impact of diabetes on ace/ace2 balance and angiotensin ii
TRANSCRIPT

Wright State University Wright State University
CORE Scholar CORE Scholar
Browse all Theses and Dissertations Theses and Dissertations
2009
Impact of Diabetes on ACE/ACE2 Balance and Angiotensin II Type Impact of Diabetes on ACE/ACE2 Balance and Angiotensin II Type
1 Receptor Expression in db/db Diabetic Mice 1 Receptor Expression in db/db Diabetic Mice
Malav Navinchandra Madhu Wright State University
Follow this and additional works at: https://corescholar.libraries.wright.edu/etd_all
Part of the Pharmacology, Toxicology and Environmental Health Commons
Repository Citation Repository Citation Madhu, Malav Navinchandra, "Impact of Diabetes on ACE/ACE2 Balance and Angiotensin II Type 1 Receptor Expression in db/db Diabetic Mice" (2009). Browse all Theses and Dissertations. 310. https://corescholar.libraries.wright.edu/etd_all/310
This Thesis is brought to you for free and open access by the Theses and Dissertations at CORE Scholar. It has been accepted for inclusion in Browse all Theses and Dissertations by an authorized administrator of CORE Scholar. For more information, please contact [email protected].

IMPACT OF DIABETES ON ACE/ACE2 BALANCE AND
ANGIOTENSIN II TYPE 1 RECEPTOR EXPRESSION IN db/db
DIABETIC MICE
A thesis submitted in partial fulfillment of the requirements for the degree of
Master of Science
By
MALAV MADHU B.Pharm., North Gujarat University, Gujarat, India 2006
2009 Wright State University

WRIGHT STATE UNIVERSITYSCHOOL OF GRADUATE STUDIES
Date: August 27, 2009
I HEREBY RECOMMEND THAT THE THESIS PREPARED UNDER MY SUPERVISION BY MALAV MADHU ENTITLED “IMPACT OF DIABETES ON ACE/ACE2 BALANCE AND
ANGIOTENSIN II TYPE 1 RECEPTOR EXPRESSION IN db/db Diabetic MICE” BE ACCEPTED IN PARTIAL FULFILLMENT OF THE REQUIREMENTS FOR THE DEGREE OF MASTER OF SCIENCE.
_______________________ Khalid M. Elased, R.Ph., Ph.D.
Thesis Director
________________________ Terry Oroszi
Director, Graduate Program
_______________________Mariana Morris, Ph.D. Department Chair
Committee on Final Examination __________________________ Khalid M. Elased, R.Ph., Ph.D. __________________________ James B. Lucot, Ph.D. __________________________ Mariana Morris, Ph.D. __________________________ Joseph F. Thomas, Jr., Ph.D. Dean, School of Graduate Studies

ABSTRACT
Madhu, Malav. M.S., Department of Pharmacology and Toxicology, Wright State University, 2009. Impact of Diabetes on ACE/ACE2 Balance and Angiotensin II Type 1 Receptor Expression in db/db Diabetic Mice.
Alterations in the renin-angiotensin system (RAS) are considered to be crucial for
the development of diabetic complications like hypertension and nephropathy. Our
previous work demonstrated role of AT1 receptors (AT1R) in the development of
hypertension in db/db diabetic mice. The aim of this study was to test the hypothesis that
there is upregulation of renal AT1R and imbalance in renal ACE/ACE2 homeostasis in
db/db mice. In addition, we hypothesize that treatment with an anti-hyperglycemic or an
AT1R blocker will correct this imbalance. Five week old control and db/db mice were
housed in metabolic cages for 24 hour collection of urine. At early age of 5 weeks, db/db
mice were obese and hyperglycemic. Urinary albumin excretion was also significantly
high in db/db mice. Changes in RAS were evaluated using enzyme activities, western
blots and immunohistochemistry. There was a significant increase in urinary ACE2
activity and ACE2 content in db/db mice at 5 weeks. There was a significant increase in
plasma ACE activity and Ang II content in db/db mice compared to controls at 8 weeks.
Western blot analysis showed significant increase in AT1R protein expression in 8, 18
and 31 week db/db mice compared to controls. There was upregulation of ACE2 and
down-regulation of ACE in kidney to compensate the effects of high plasma Ang II. To
study the effect of reduction in blood glucose and AT1R blockade, mice were treated
iii

with metformin and losartan for 12 weeks. Chronic treatment with metformin (150
mg/kg/day) and losartan (10 mg/kg/day) significantly decreased urinary albumin and
protein excretion. Metformin improved blood glucose and glucose tolerance db/db mice,
but did not affect renal expression of ACE, ACE2 and AT1R. Although chronic losartan
treatment did not alter blood glucose levels, it improved the morphology of pancreatic
islets. There was a significant increase in renal AT1R protein expression and decrease in
renal ACE2 protein expression following losartan treatment. Losartan treatment
significantly increased urinary ACE2 activity. Western blot of concentrated urine from 8
week db/db mice revealed immunoreactive bands of ACE, ACE2 and AT1R protein.
Conclusion: 1) There is upregulation in renal AT1R protein expression in db/db mice. 2)
Chronic metformin treatment significantly reduces blood glucose and microalbuminuria
in db/db mice without affecting ACE/ACE2 balance. 3) Chronic losartan treatment had
no effect on blood glucose, but it up-regulates renal AT1R and down-regulates renal
ACE2. 4) Enzyme activity and western blot shows increased excretion of ACE2 in the
urine of db/db mice. These data show that urinary ACE and ACE2 provide good index of
intra-renal RAS status and could be used in early diagnosis and prognosis of diabetic
renal disease.
iv

TABLE OF CONTENTS
Page
1. INTRODUCTION………………………………………………………….………….1
Diabetes……………………………………………………………….….………..1
Diabetes, hypertension and kidney disease………………………………………..2
Renin-angiotensin system (RAS)……………………………………………….....4
Angiotensin converting enzyme (ACE)…………………………………………...8
Angiotensin converting enzyme 2 (ACE2)………………………………………..9
Angiotensin II type 1 receptor (AT1R)…………………………………………..10
Changes in RAS homeostasis in diabetes………………………………………..11
Diagnosis of diabetic nephropathy……………………………………………....12
2. HYPOTHESIS AND SPECIFIC AIMS……………………………………………....15
3. MATERIALS AND METHODS……………………………………………………...16
Chronic treatment with metformin and losartan…………………………………16
Western blot analysis…………………………………………………………….17
Plasma renin activity……………………………………………………………..18
Urine collection and concentration………………………………………………18
ACE activity……………………………………………………………………...19
ACE2 activity…………………………………………………………………….19
Immunohistochemistry…………………………………………………………..20
Measurement of blood glucose levels………..…………………………………..21
Glucose tolerance test (GTT)…………………………………………………….21
v

Urinary albumin assay…………………………………………………………...22
Measurement of plasma and renal Ang II………..………………………………23
Urinary creatinine assay………………………………………………………….23
Statistical analysis………………………………………………………………..24
4. RESULTS……………………………………………………………………………..57
Anthropometric and metabolic parameters………………………………………57
Measurement of renal function…………………………………………………..58
Measurement of enzyme activities……………………………………………….59
Renal protein expression of ACE, ACE2 and AT1R…………………………….60
Plasma and kidney Ang II content……………………………………………….61
Effect of metformin……………………………………………………………....61
Effect of losartan…………………………………………………………………63
Immunohistochemistry of kidney………………………………………………..65
Western blot of concentrated urine………………………………………………65
5. DISCUSSION…………………………………………………………………………66
6. CONCLUSION………………………………………………………………………..74
7. APPENDICES………………………………………………………………………...76
8. BIBLIOGRAPHY……………………………………………………………………..78
vi

LIST OF TABLES
Page
1. Time course of blood glucose and food intake in db/db and control mice……………27
2. Time course of urine volume, albumin, protein and creatinine in db/db and control
mice……………………………………………………………………………………28
vii

viii
LIST OF FIGURES
Page
1. Weight and water intake………………………………………………….…………...26
2. Plasma ACE activity at 8 and 31 weeks……..………………………………………..29
3. Plasma renin activity at 8 and 31 weeks..……………………………………………..30
4. Renal ACE activity at 8 and 31 weeks………………………………………………..31
5. Renal ACE2 activity at 8 and 31 weeks………………………………………………32
6. Urinary ACE2 activity at 5 and 30 weeks…………………………………………….33
7. Urinary ACE2 concentration at 5 weeks……………………………………………...34
8. Renal AT1R protein expression at 8 and 31 weeks…………………………………...35
9. Renal ACE protein expression at 8 and 31 weeks…………………………………….36
10. Renal ACE2 protein expression at 8 and 31 weeks………………………………….37
11. Plasma Ang II content at 8 and 31 weeks……………………………………………38
12. Renal Ang II content at 8 and 31 weeks……………………………………………..39
13. Effect of metformin on blood glucose……………………………………………….40
14. Effect of losartan on blood glucose………………………………………………….41
15. Effect of treatments on glucose tolerance in control mice…………………………...42
16. Effect of metformin on glucose tolerance in db/db mice……….……………………43
17. Effect of losartan on glucose tolerance in db/db mice……………………………….44
18. Effect of treatments on urinary albumin excretion………………….……………….45
19. Effect of treatments on urinary total protein excretion…………………..…………..46

20. Effect of treatments on urinary creatinine excretion…………………………………47
21. Effect of treatments on renal ACE and ACE2 activity………………………………48
22. Effect of treatments on urinary ACE activity………………………………………..49
23. Effect of treatments on urinary ACE2 activity………………………………………50
24. Effect of losartan on renal AT1R protein expression………………………………..51
25. Effect of losartan on renal ACE protein expression…………………………………52
26. Effect of losartan on renal ACE2 protein expression………………………………..53
27. Effect of treatments on morphology of pancreatic islets…………………………….54
28. Immunohistochemistry for AT1R in renal tissue sections…………………………..55
29. Western blot of concentrated urine from 8 week db/db mice……………………….56
ix

INTRODUCTION
Diabetes
Diabetes mellitus is a chronic metabolic disorder resulting in hyperglycemia and
disturbances of carbohydrate, fat, and protein metabolism. Diabetes is occurring at an
epidemic rate in the United States and other western countries (Mokdad et al., 2001). In
the year 2000, there were approximately 171 million people with diabetes worldwide;
estimates for 2030 suggest that the prevalence of diabetes will increase to 366 million
(Wild et al., 2004). According to Centers for Disease Control and Prevention, the risk of
death among individuals with diabetes is almost twice that of individuals who do not
have diabetes of similar age (USNDFS, 2005). For individuals born in 2000, the risk for
developing diabetes is 33% for males and 39% for females. Diabetes is a huge burden on
our healthcare system (USNDFS, 2005). The total estimated cost of diabetes in 2007 was
174 billion in US only (Ettaro et al., 2004). One in 5 healthcare dollars in the US is spent
caring for someone with diagnosed diabetes (Ettaro et al., 2004). The exact cause of
diabetes is still unknown and many factors like obesity, genetics, diet, environment,
individual lifestyle are believed to play part in the pathogenesis. There are 3 types of
diabetes: 1) Type 1 diabetes mellitus caused by beta-cell destruction that leads to absolute
insulin deficiency, hyperglycemia and ketosis, 2) Type 2 diabetes mellitus characterized
by insulin resistance and relative insulin deficiency and 3) Gestational diabetes which
occurs in 5-10% pregnant women with no previous history of diabetes. Of all diabetics,
1

90 to 95% have type 2 diabetes. Kidney disease, heart disease, blindness, nervous system
disease, dental diseases are some of the complications of diabetes.
Diabetes, hypertension and kidney disease
Diabetic nephropathy (DN) is a leading cause of end-stage renal disease (ESRD) that
requires renal dialysis or kidney transplantation (USRDS, 2003). When kidney disease is
caught late, ESRD usually follows. Nearly 44% of all new patients enrolled in ESRD
treatment programs have diabetic background (USRDS, 2003). The number of people in
the United States with ESRD has doubled between 1991 and 2001. In the year 2000,
expenditures for about 400,000 patients with ESRD in the United States totaled about $20
billion, meaning that the cost to manage ESRD for each patient in the year 2000 was
$50,000 (Rodby, 2004). According to United States Renal Data System, diabetes mellitus
is the single largest cause of ESRD requiring chronic dialysis or kidney transplantation in
the US.
Hyperglycemia may lead to nephropathy by a number of mechanisms (Larkins &
Dunlop, 1992). Sustained hyperglycemia of diabetes causes microvascular dysfunction,
which contributes to the development of ESRD (Futrakul et al., 2006;Jawa et al., 2006).
Many transmembrane proteins translocate glucose into the cells (Brosius & Heilig, 2005).
Intracellular glucose and its metabolites give rise to vasoactive peptides and elevate
intraglomerular pressure (Wautier & Schmidt, 2004). Advanced glycation end-products
mediate renal tissue injury by producing reactive oxygen species (ROS) (Cooper, 2004)
and by initiating signaling events through activation of protein kinase C, mitogen
activated protein kinase and nuclear factor-κ of activated B cells. This would be followed
2

by over activity of tumor growth factor-β and thereby alter expression of extracellular
matrix proteins (Jakus & Rietbrock, 2004). ROS can then cause apoptosis of podocytes,
thus initiating kidney damage (Susztak et al., 2006). Moreover, acute elevations in
glomerular filtration rate (GFR) were observed in patients in response to glucose infusion
(Christiansen et al., 1981).
Circulating leptin levels are increased in patients with obesity and type 2 diabetes
(Nyholm et al., 1997). High serum leptin levels cause an increase in sympathetic tone
which then leads to hypertension and other related complications (Considine et al.,
1996;Haynes, 2005). It has also been reported that hypertensive individuals have high
leptin levels and are at high risk of developing diabetes (Adamczak et al., 2000).
Hypertension is twice as common in type 2 diabetics and is responsible for many
complications of diabetes (Sowers et al., 2001). Kidney plays an important role in the
development of hypertension. In fact, kidney disease is both a cause and a consequence
of hypertension (Paul et al., 2006). One study reports that normotensive rats receiving a
kidney from genetically hypertensive donor rats develop hypertension (Navar, 2005). On
the contrary, genetically hypertensive rats who have had bilateral nephrectomy and
receive a kidney from normotensive rats exhibit a reduction in blood pressure (Navar,
2005). Increase in renal vascular resistance, induced by hyperglycemia, can lead to
diminished GFR. Many patients at risk of hypertension manifest reduced renal blood
flow and elevated filtration fraction even before development of hypertension (Navar,
2005).
The first sign of renal damage in diabetes is the presence of persistent microalbuminuria
(24-hour urinary albumin excretion of 30 to 300 mg/day), hypertrophy of epithelial cells
3

and thickening of glomerular basement membrane (Cooper, 1998). This stage is known
as incipient nephropathy. 20% to 40% of patients show this symptom 10 to 15 years after
the onset of diabetes (Lee, 2005). Unfortunately, the onset of type 2 diabetes is often
difficult to ascertain and so when a patient presents for the first time with type 2 diabetes,
they may already have microalbuminuria. In type 2 diabetes, the microalbuminuria is
seldom reversible and is probably a sign of endothelial dysfunction (Ritz, 2003).
Progression to proteinuria (urinary albumin excretion >300 mg/day) occurs in patients 15
to 20 years following the onset of diabetes and this stage is known as overt nephropathy
(Lee, 2005). Following this, the creatinine clearance start to decline at an average rate of
10 to 12 mL/min/year in untreated patients and hypertension develops (Parving et al.,
2001).
Optimization of glycemic control helps to reduce onset of DN (Hasslacher et al., 1989).
In this study, we want to study the effect of metformin, a glucose sensitizer, on renal
outcomes of DN. A variety of anti-hypertensive therapies produce beneficial effects in
reducing proteinuria (Cooper & Johnston, 2000). However not all antihypertensive agents
are the same in terms of delaying the progression of renal disease in diabetic patients. The
renin-angiotensin system plays an important role in the pathogenesis of kidney disease. A
substantial amount of evidence demonstrates that blockade of the renin-angiotensin
system provides renoprotection (Hostetter, 2003;Lewis et al., 1993;Maschio et al., 1996).
Renin-angiotensin system (RAS)
The renin-angiotensin system (RAS) has been implicated in the pathophysiology of the
diabetic renal disease (Andersen et al., 2000;Lewis, 2002). The functional roles of RAS
4

in the regulation of blood flow, sodium, bicarbonate and water transport, cell growth and
differentiation have also been clarified. There is evidence of presence of RAS in pancreas
of human (Tahmasebi et al., 1999), mouse (Leung et al., 1998) and dog (Chappell et al.,
1992). RAS plays a key role in renal injury (Taal & Brenner, 2000;Hollenberg & Raij,
1993). It is one of the major targets in the treatment of DN (Ye et al., 2004;Ye et al.,
2006;Tikellis et al., 2003). Drugs that interrupt RAS cascade are widely used in the
management of diabetes and its complications. Additionally, weight gain and obesity are
believed to activate RAS in humans (Barton et al., 2003).
The RAS has long been recognized to play a crucial role in the regulation of blood
pressure and electrolyte balance (see diagram 1). Angiotensinogen (AGT) is converted to
to angiotensin I (Ang I) by the enzyme renin secreted by kidney. Ang I has little or no
biological activity. Ang I is further catabolized by ACE to the biologically active peptide
angiotensin II (Ang II) (Skeggs, Jr. et al., 1956). Ang II is found in circulation, in tissues
and even in cells making it an endocrine, paracrine and intracrine peptide (Kumar et al.,
2007). Ang II has been shown to cause vasoconstriction, renal tubule sodium re-
absorption, growth promotion, cellular dedifferentiation, increased aldosterone secretion,
polydipsia and increased sympathetic outflow (Giacchetti et al., 2005). Ang II directly
contributes to the progression of chronic kidney disease, including DN (Lewis et al.,
1993;Maschio et al., 1999;Parving et al., 2001). In renal interstitial fluid, the
concentration of Ang II is 1000 times higher than plasma (Seikaly et al., 1990). That is
why kidney is a very important organ when studying hypertension and diabetes.
Recently, an ACE-related carboxypeptidase (ACE2) was identified and cloned
(Donoghue et al., 2000). ACE2 primarily cleaves Ang II into angiotensin 1-7 (Ang 1-7)
5

and less preferably degrades Ang I to angiotensin 1-9 (Ang 1-9) (Donoghue et al.,
2000;Li et al., 2005;Eriksson et al., 2002). Interestingly, these products of ACE2
cleavage appear to have effects that oppose those of ANG II (Haulica et al., 2003). Thus,
the vasoconstrictor/proliferative or vasodilator/anti-proliferative actions of RAS are
primarily driven by ACE-ACE2 balance.
6

Renin-Angiotensin System Enzyme Cascade
Santos R. A. S. et.al. Exp Physiol 2008
Abbreviations: AMP, aminopeptidase; AT1, Ang II type 1 receptor; AT2, Ang II type 2
receptor; Mas, Ang(1–7) receptor Mas; D-Amp, dipeptidyl-aminopeptidase; IRAP,
insulin-regulated aminopeptidase; PCP, prolyl-carboxypeptidase; PEP, prolyl-
endopeptidase; NEP, neutral endopeptidase and (P)RR, Renin/prorenin receptor.
Diagram 1: A schematic representation of the renin-angiotensin system cascade
7

Angiotensin converting enzyme (ACE)
ACE was discovered in plasma in 1956 by Leonard T. Skeggs (Skeggs, Jr. et al., 1956).
ACE is a monomeric, membrane bound, zinc and chloride dependent di-peptidyl
carboxypeptidase (Riordan, 2003). ACE was also found to be present in other organs
such as kidney, heart, pancreas and brain (Nash, 1992). ACE plays a crucial role in RAS;
it catalyzes the cleavage of decapeptide Ang I to produce a potent vasoconstrictor Ang II,
by removal of carboxy terminal peptides. ACE also less preferably hydrolyzes the
inactive Ang (1-9) to produce vasodilator Ang (1-7) (Tschope et al., 2002). Ang II is a
potent vasoconstrictor and mediates its effects through AT1 and AT2 receptors (Higuchi
et al., 2007). Pathological activation of tissue ACE with resulting increase in local Ang II
produces deleterious effects on kidney and heart during organ remodeling (Dzau et al.,
2002). ACE promotes degradation of bradykinin, which acts as a vasodilator via
stimulation of nitric oxide (Carey & Siragy, 2003). The kidney, under the regulation of
Ang II and aldosterone, maintains the electrolyte balance in the body. A recent study on
ACE expression revealed that higher ACE was associated with an increased diabetic
pathologies like renal dysfunction and high blood pressure (Ye et al., 2004;Senador et al.,
2009). High ACE leads to high production of Ang II followed by increased blood
pressure and subsequent kidney damage due to hyperfiltration. Inhibition of ACE has
been shown to decrease systemic blood pressure, albuminuria and glomerular capillary
pressure (Mathiesen et al., 1991;Ahmad et al., 1997;Lewis et al., 1993). Aside from
lowering blood pressure, ACE inhibitors have found to improve the prognosis of patients
with congestive heart failure and myocardial infarction (Garg & Yusuf, 1995).
8

Angiotensin converting enzyme 2 (ACE2)
ACE2, a new homologue of ACE, was identified and cloned by two separate groups in
the year 2000 (Donoghue et al., 2000;Tipnis et al., 2000). ACE2 displays 42% sequence
homology and 62% sequence similarity with NH2-terminal catalytic domain of ACE and,
like ACE, is a type 1 integral membrane protein (Tipnis et al., 2000). ACE2 is not
inhibited by the ACE inhibitors captopril and lisinopril (Tipnis et al., 2000). Unlike ACE,
ACE2 levels in plasma are very low and this could be due to less shedding of ACE2 from
plasma membrane of endothelial cells (Rice et al., 2006). Our previous study shows that
ACE2 activity is not detectable in the plasma of diabetic and control mice (Elased et al.,
2006). ACE2 was first found to be present in kidneys, heart and testes but later studies
show its widespread distribution (Donoghue et al., 2000;Tipnis et al., 2000;Hamming et
al., 2004). In kidneys, ACE2 is particularly found in apical membranes of the proximal
tubules and in podocytes (Soler et al., 2008). ACE2 is a carboxy-peptidase that primarily
cleaves vasoconstricting Ang II to vasodilator Ang (1-7). Ang (1-7) acts on Mas, a G-
protein coupled receptor, to exert its vasodilatory action (Pinheiro et al., 2004) and thus
ACE2 acts in a counter-regulatory manner with ACE, keeping production and actions of
Ang II in ckeck. Furthermore, ACE2 activity has been detected in urine of healthy
subjects (Warner et al., 2005) and sheep (Shaltout et al., 2007). Studies have shown that
ACE2 protein expression and activity changes in diabetic kidneys (Wysocki et al.,
2006;Ye et al., 2006). It has been shown that Ang II can upregulate ACE and down
regulate ACE2 (Koka et al., 2008). Administration of MLN-4760, a specific ACE2
inhibitor, worsens albuminuria in db/db mice together with increased glomerular
expression of fibronectin (Ye et al., 2006). Moreover, ACE2 null mice develop a
9

progressive, age-dependent cardio-myopathy with increased oxidative stress, collagenase
levels and hypertrophy together with increased urinary albumin excretion (Oudit et al.,
2007). Whereas, generation of double mutant ACE-ACE2 null mice prevented cardiac
dysfunction suggesting cardio-protective role of ACE2 (Crackower et al., 2002). Another
study reports that ACE2 null mice do not develop cardiac complications but they show
high plasma Ang II levels and increased pressor sensitivity after Ang II infusion (Gurley
et al., 2004). Thus, ACE2 counteracts pressor activity of Ang II by its degradation and by
production of Ang (1-7) having depressor activity.
Angiotensin II type 1 receptor (AT1R)
One of the aims of the present study is to investigate the effect of losartan, an AT1R
blocker (ARB), on kidney function and intra-renal RAS in db/db diabetic mice. The
actions of Ang II are mediated by AT1 and AT2 receptors which, invariably mediate
opposite functions (Carey & Padia, 2008). Most of the effects of Ang II, such as
hypertension, atherosclerosis and heart failure, are mediated by AT1R, a seven
transmembrane G-protein coupled receptor (Higuchi et al., 2007). AT1Rs are expressed
in kidney, heart, adrenal gland, brain, lung and adipose tissue (de et al., 2000). Studies
indicate that AT1R signaling in endothelial cells induce endothelial dysfunction
(Nakashima et al., 2006). Dysfunctional endothelium is characterized by less production
of nitric oxide, accelerated vasoconstriction, smooth muscle proliferation and a
prothrombotic state (Watanabe et al., 2005). Ang II has been shown to reduce baroreflex
sensitivity by interacting with AT1R, contributing to the development of hypertension
(Gao et al., 2005). By its action on AT1R, Ang II causes generation of oxidative radicals
10

and promotes inflammatory processes like atherosclerosis and vascular aging (Fyhrquist
& Saijonmaa, 2008).
A recent study reported that Ang II infusion causes decrease in plasma adiponectin, an
insulin sensitizer via AT1R in rats (Ran et al., 2006). Suppression of adiponectin may be
a mechanism whereby Ang II impairs glucose tolerance and explains why hypertensive
patients are at more risk of developing diabetes. In fact, treatment with ARBs reduce new
onset of diabetes by 15-30% (Aguilar & Solomon, 2006). Our previous study showed
that, losartan treatment reduced blood pressure without affecting glucose handling in
db/db mice (Senador et al., 2009). Blockade of AT1R reduces cardiovascular
complications in animal models of type1 and type 2 diabetes (Nielsen et al.,
2003;Amazonas & Lopes De Faria, 2006).
It has been reported that Ang II suppresses glucose induced insulin release from isolated
islets and pre-treatment of islets with losartan restores the effect of glucose. This effect of
Ang II is partly because of reduction in (pro)insulin biosynthesis (Lau et al., 2004). A
recent study showed up regulation of AT1 receptor together with over expression Ang II
content in cavernous tissue of type 1 diabetic rats suggesting its possible role in erectile
dysfunction (Yang et al., 2009). In present study, we will investigate whether there is
upregulation of renal AT1 receptor protein expression in db/db diabetic mice.
Changes in RAS homeostasis in diabetes
The balance between Ang II and Ang (1-7), reflecting ACE and ACE2 activities,
respectively, is considered as physiologically significant ratio (Huentelman et al., 2004).
Over activity of the RAS has been identified as an important determinant in the etiology
11

of diabetes, heart disease and therefore represents a major target for therapy. In young
db/db diabetic mice, the pattern of ACE and ACE2 expression in the renal cortical
tubules was characterized by decrease in ACE and an increase in ACE2 (Ye et al., 2004).
In diabetic rat and human kidneys, ACE is redistributed towards glomeruli and away
from proximal tubules (Anderson et al., 1993). Furthermore, glomerular immunostaining
for ACE2 decreases and that of ACE increases in db/db mice at the age of 8 weeks (Ye et
al., 2006). At this age, db/db mice excrete more albumin in urine without obvious signs
of renal pathology (Sharma et al., 2003). Furthermore, increased ACE expression was
related to ACE2 inhibition in diabetic mice, suggesting that the ACE2-Ang (1-7)-Mas
axis may play a renoprotective role by negatively regulating the ACE-Ang II- AT1 axis
(Soler et al., 2007). Kidney also sequesters Ang II from circulation via AT1R mediated
mechanisms (Navar, 2005). Therefore, sustained increase in plasma Ang II, as seen in
diabetes, results in more uptake of Ang II by kidneys.
Diagnosis of diabetic nephropathy
The biggest challenge for healthcare professionals is accurate and early detection of
diabetic kidney disease. Considerable scientific effort has been dedicated to identify
patients at risk for the development of diabetic nephropathy (Susztak & Bottinger, 2006).
There are some hurdles in diagnosis of kidney disease. Standard method for the diagnosis
of diabetic nephropathy is renal biopsy which is a painful process and can suffer from
sampling errors (Sharma et al., 2005). Detection of albumin in urine is the only
noninvasive technique available for the diagnosis of diabetic nephropathy. Unfortunately
the onset of diabetes is difficult to ascertain and so many patients diagnosed with high
blood glucose already have microalbuminuria (Lee, 2005). Microalbuminuria is seldom
12

reversible in type 2 diabetics (Ritz, 2003). The problem with albuminuria as a disease
marker is twofold. Microalbuminuria is a poor predictor of diabetic nephropathy (Perkins
et al., 2007); proteinuria (macroalbuminuria), which is a strong predictor, only develops
at advanced stages of diabetic nephropathy, when little can be done to prevent the
development of ESRD. Furthermore, the immunoassay to measure albuminuria can detect
only immunoreactive forms of albumin where as immunounreactive forms are not
detectable by this conventional method (Comper & Osicka, 2005). An undiagnosed and
untreated microalbuminuria progresses to proteinuria and at this point little can be done
to stop progression of nephropathy. An early diagnosis is necessary for early treatment
and to prevent further kidney damage.
A lot of research is going on to find a better biomarker for kidney disease. For instance,
N-acetyl β-glucosaminidase is a lysosomal enzyme derived from proximal tubular cells
which is not filtered by kidney under normal circumstances. Its excretion increases in
circumstances that cause tubular injury (Basturk et al., 2006). Smad1 is a transcription
factor for mesangial matrix expansion. Its excretion increases in early stage of diabetic
nephropathy and decreases with olmesartan treatment (Mima et al., 2008).
Angiotensinogen, which is also a part of RAS, is also a potential candidate (Kobori et al.,
2009). Urine testing for biomarkers could substitute renal biopsy as safe and painless
alternative.
Aggressive control of hyperglycemia and hypertension is very important in the
management of diabetic nephropathy. Effectiveness of ACEIs and ARBs illustrate the
contribution of RAS in development of diabetes and its complications. Nevertheless, the
effect of these medications on renal and urinary RAS remains a matter of debate. To
13

14
clarify the issue, we studied the effect of an anti-diabetic, metformin and an anti-
hypertensive, losartan on renal RAS using db/db mice as a model of type 2 diabetes.

HYPOTHESIS AND SPECIFIC AIMS
Hypothesis:
There is upregulation of AT1 receptor protein expression and imbalance in ACE/ACE2
homeostasis in the kidney of db/db mice. Treatment with an anti-hyperglycemic or an
AT1 receptor blocker will correct this imbalance.
Specific aims:
1. To test the hypothesis that there is upregulation of renal AT1 receptor protein
expression in db/db mice.
2. To test the hypothesis that early treatment with metformin or losartan will correct
the imbalance of ACE and ACE2.
3. To test the hypothesis that urinary ACE2 could be used as an early biomarker for
diabetic nephropathy.
15

16
MATERIALS AND METHODS
Animals:
Five week old db/db mice of the strain BKS.cg-m +/+ Leprdb/J and their age matched
non-diabetic littermates were used. Animals were purchased from The Jackson
Laboratory (Bar harbor, ME). Mice were housed individually at 22° C with a 12:12-hour
light-dark cycle (6:30-18:30, lights on). Mice were maintained on a standard pellet diet
with tap water available ad libitum. Cages were examined daily to assess the health of the
animals. The obese (db/db) mouse strain has a point mutation in diabetes (db) gene
encoding the leptin receptor gene. At early age, they serve as a good model of type 2
diabetes, characterized by hyperinsulinemia, obesity and progressive hyperglycemia. All
experimental protocols were approved by WSU Animal Care and Use Committee.
1. Chronic treatment with metformin and losartan
Five to 8 week db/db and control mice were randomly assigned to metformin and losartan
treatment groups. Each group consisted of 8 mice. Losartan group received 10 mg/kg/day
losartan dissolved in drinking water for 12 weeks. Metformin group received 150
mg/kg/day metformin in drinking water for 12 weeks. After 12 weeks of treatment, mice
were euthanized by decapitation trunk blood was collected in ice-chilled heparin washed
tubes. Plasma was immediately separated by centrifugation at 10,000 x g for 10 minutes
at 4° C and stored at -80° C. Tissues were collected in dry ice and stored at -80° C.

2. Western blot analysis
Control and db/db mice were sacrificed by decapitation and kidneys were quickly
removed and homogenized on ice in phosphate buffered saline (PBS) containing protease
inhibitor (Complete lysis M, Roche diagnostics, Mannheim, Germany). Tissue
homogenates were centrifuged at 10,000 x g for 10 mins at 4° C to remove cellular
debris. Total protein content was determined in supernatant using BSA as a standard and
BioRad reagent (BioRad, Hercules, CA). Fifty microliter of tissue lysate was added to 50
µl sample loading buffer (8% SDS, 125 mmol/L Tris-HCl, pH-6.8, 20% glycerol, 0.02%
bromophenol blue, 100 mmol/L dithiothreitol) and boiled for 10 minutes. Approximately
50 µg protein was loaded to 8% or 10% SDS-PAGE gel and separated by electrophoresis.
Proteins on gel were then transferred (with Bio-Rad transfer apparatus, Hercules, CA) to
a 0.2 µm PVDF membrane (Millipore, MA). The membrane was blocked for 1 hour with
10% non-fat milk made in 10 mM Tris buffered saline with Tween 20 (TBS-T) at room
temperature (R.T.). For analysis of ACE, ACE2 and AT1, membranes were probed with
respective antibodies (Santa Cruz, CA) made in 5% non-fat milk in TBS-T for 2 days at
4° C. Dilution for ACE and ACE2 antibodies was 1:200 while for AT1R antibody it was
1:500. The membranes were then washed with TBS-T buffer 3 times for 5 minutes at
R.T. Then membranes were incubated with horse radish peroxidase (HRP) conjugated
donkey anti-rabbit secondary antibody (Jackson Immunoresearch, PA) made in TBS-T
buffer with 1:40,000 dilution for 1 hour at R.T. Blots were detected using SuperSignal
chemiluminescent substrate (Pierce, Rockford, IL) and visualized in Fujifilm image
analyzer (LAS-3000 Image Quant, Sunnyvale, CA). ACE, ACE2 and AT1 have
17

molecular weights 195 kDa, 90 kDa, and 43 kDa respectively. The relative amounts of
proteins of interest were determined by normalizing to β-actin.
3. Plasma renin activity
Renin activity assays were performed using a kit purchased from DiaSorin (Stillwater,
MN). Mice were sacrificed by decapitation and trunk blood was collected in ice chilled,
heparin washed tubes as described above. Plasma samples stored at -80° C were thawed
and 100 µl plasma was transferred to 0.5 mL uncoated tubes. One microliter of PMSF
and 10 µl of maleate generation buffer were added to plasma samples and mixed well.
Fifty microliter of this mixture was transferred to ice chilled tubes. One set of tubes was
incubated at 37° C and the other set was incubated at 4° C for 18 hours. After incubation,
50 µl of samples, standards, blank and controls were transferred to appropriately marked
angiotensin I antibody coated tubes. Then 500 µl of tracer-buffer solution was added to
each tube followed by gentle vortex and incubated for 3 hours at room temperature. All
tubes except ones for total count were decanted after incubation. Each tube was then
counted in gamma counter for 1 minute. Renin activity was expressed as ng/mL/hr of
generated Ang I.
4. Urine collection and concentration
Mice were put in metabolic cages for 24 hour collection of urine with free access to food
and water. A total of 15 µl of protease inhibitor (Roche Diagnostics, IN) was added to
each sample during 24 hour collection. Urine samples were centrifuged at 1,000 x g for 5
minutes at 4° C to remove debris. Urine was then aliqouted and stored at -80° C. For
concentration, frozen urine samples were thawed and mixed with protease inhibitor
18

(Sigma-Aldrich, MO) in a dilution of 1:1000. Samples were then concentrated in
ultrafiltration chambers with a semi-permeable membrane (Millipore, MA) at 4° C.
Concentrated samples were mixed with protease inhibitor (Sigma-Aldrich, MO) in a
dilution of 1:100. The sample concentrates were then aliquoted and stored at -80° C for
later use.
5. ACE activity
ACE activity assays were performed using a kit purchased from Alpco Diagnostics
(Salem, NH). Mice were sacrificed by decapitation. Plasma, kidneys and urine were
collected and processed as described above. Kidney lysate (80-100 µg) or plasma
samples (10 µl) were incubated with 100 µl HEPES buffer containing synthetic substrate,
3H-hippuryl-glycyl-glycine, at 37° C for 1 hour. For evaluation of urinary ACE activity,
50µl of urine samples were incubated with 100 µl of the 3H-hippuryl-glycyl-glycine at
37° C for 1 hour. Incubation was followed by acidification with 50 µl 1N HCl to stop the
reaction. Tritiated hippuric acid was separated from unreacted substrate by extraction
with 1.5 mL scintillation cocktail and measured in beta counter (Packard 18TR Liquid
Scintillation Analyzer). ACE activity was expressed as Units/µg protein or Units/Liter as
previously described (Neels et al., 1982). One unit (U/L) of ACE activity is defined as
the amount of enzyme required to release 1 µmol hippuric acid per minute per liter of
sample at 37° C.
6. ACE2 activity
ACE2 activity was measured using fluorogenic substrate 7-Mca-APK(Dnp) which is
specific for ACE2 as described before (Vickers et al., 2002;Guy et al., 2003) with some
19

modification. Fluorescence of Mca is quenched by Dnp group until cleavage by ACE2.
After cleavage fluorescence was detected at Excitation: 328 nm and Emission: 393 nm
(FusionR Packard plate reader). ACE2 activity was measured in presence of 10 mM
lisinopril, an ACE inhibitor, to prevent any interference from ACE. Four microliter (32-
40 µg) of kidney protein or 50 µl of urine samples were incubated with the substrate in a
buffer (50 mM Tris, 5 mM ZnCl2, 150 mM NaCl, 10 µM lisinopril) at 37° C. The plate
was read at 0, 1, 2, 3, 4 and 18 hours. The results were expressed as pmoles/hr/µg protein
of cleaved substrate.
7. Immunohistochemistry
Immunohistochemistry refers to the process of localizing proteins in cells of a tissue
section by using antibodies binding specifically to antigens in biological tissues. Mice
were injected with ketamine/xylazine mixture (100:8 mg/kg). Mice were then perfused
transcardially with ice cold PBS to flush out the blood and then with 4%
paraformaldehyde (PFA) for 10 minutes. Tissues were collected and fixed in 4% PFA
overnight at 4° C. Tissues were then sent to AML laboratories for microtomy and
staining (Rosedale, MD). Paraffin sections (4 µm) were deparaffinized by washing the
sections with xylene and subsequent hydration by 100%, 95% and 70% ethanol. Then
sections were transferred to 10 mM citrate buffer (pH 8.5) for 10 minutes at 95° C. Then
sections were incubated in 5% normal donkey serum (Vector, Burlingame, CA) in PBS
containing 0.1% Triton-X 100, for 1 hour at R.T. Sections were then incubated with
rabbit anti-AT1 primary antibody (Santa Cruz, CA) in a dilution of 1:100 at 4° C
overnight. Following this, the sections were washed with PBS 3 times and incubated with
donkey anti-rabbit secondary antibody conjugated with Cyanine 3 fluorescent dye
20

(Jackson immunoresearch, PA) for 60 minutes at R.T. Slides were then allowed to dry in
air and mounted with Vectashield mounting medium (Vector, Burlingame, CA). The
slides were then visualized in a fluorescence microscope (Optronics, Goleta, CA).
8. Measurement of blood glucose levels
For determination of glucose, blood samples were withdrawn from a cut made on tail
vein and measured using an Accu-Check Advantage Blood Glucose Monitor (Roche
Diagnostics, Indianapolis, IN). The measuring limit of this monitor was 600 mg/dL. For
measurement of higher levels of blood glucose, a glucose assay kit was purchased from
Sigma (St.Luis, MO). For this assay, 5 µl blood was diluted in 25 µl of PBS buffer and
300 µl of water. Ten microliter of diluted blood was incubated with 100 µl of assay
reagent for 30 minutes at 37° C. Glucose is oxidized to gluconic acid and hydrogen
peroxide by glucose oxidase. Hydrogen peroxide reacts with o-dianisidine in the presence
of peroxidase to form a colored product. The reaction was stopped by addition of 100 µl
12N H2SO4. Oxidized o-dianisidine reacts with sulfuric acid to form a more stable
colored product. The intensity of the pink color measured at 540 nm is proportional to the
original glucose concentration. We nullify the red color of blood by measuring blank
reading at 600 nm and dividing one third of individual sample reading from actual 540
nm reading.
9. Glucose tolerance test (GTT)
To study glucose handling in mice, intra-peritoneal (i.p.) GTT was performed. Mice were
fasted for 16 hours. Fasting blood glucose was measured after the end of fasting period.
21

Mice were then given i.p. injections of 1.5 mg/kg glucose in an aqueous solution. Blood
glucose was measured at 30, 60, 90, 120 minutes after glucose injection as described.
10. Urinary albumin assay
To monitor kidney function, quantitative estimation of urinary albumin was performed
using a kit purchased from Bethyl Laboratories (Montgomery, TX). Urine samples were
collected and stored as described above. In a 96 well plate, the wells were coated with
100 µl goat anti-mouse albumin antibody diluted 1:100 in carbonate-bicarbonate buffer
overnight at 4° C. After incubation, the antibody solution was aspired from each well and
washed with 150 µl TBS-T buffer 3 times. Then each well was incubated with 200 µl
blocking buffer (Tris buffered saline with 1% BSA) for 30 minutes and washed 3 times
with TBS-T buffer. One microliter urine samples were diluted with 1 mL of conjugate
buffer. One hundred microliter of diluted urine samples were added to each well and
incubated at R.T. for 1 hour. At the same time, 100 µl of standards were added to
assigned wells followed by 1 hour incubation. Albumin present in samples and standards
binds with the coated antibody. Wells were then washed 5 times with TBS-T buffer. Then
100 µl HRP conjugated detection antibody diluted 1:35,000 in conjugate buffer was
incubated for 1 hour at R.T. for detection of bound antigen. Wells were then washed 5
times with TBS-T buffer. Equal volumes of TMB substrate A and substrate B (KPL,
Gaithersburg, MD) were mixed and 100 µl of this substrate was added to each well. HRP
cleaves the substrate to produce color. The intensity of the color produced is directly
proportional to the amount of albumin present in the sample. Plate was finally read at 450
nm in FusionR Packard plate reader.
22

11. Measurement of plasma and renal Ang II
Mice were sacrificed by decapitation and trunk blood was collected in ice chilled heparin
washed tubes and kidneys were collected in dry ice. Plasma and kidney samples were
processed as described above. Plasma and kidney Ang II contents were measured using a
kit purchased from Alpco (Salem, NH). This technique uses double-antibody
radioimmunoassay to measure Ang II. Ang II is extracted from 50 µl of plasma or 450-
500 µg kidney samples treated with 1 µl EDTA using reverse phase extraction by special
columns followed by vacuum evaporation of liquid to form a pellet. The pellet was
reconstituted in 120 µl Tris buffer. Hundred microliter of standards and samples were
incubated with 20 µl primary antibody for 16 hours at 2-8° C. After incubation, 40 µl of
tracer was added to each tube and incubated at 2-8° C for 6 hours. 125I present in the
tracer competes with Ang II present in the sample and standards for the same antibody
sites. After 6 hour incubation, solid phase secondary antibody (20 µl) was added to the
mixture and incubated at 2-8° C for 30 minutes. The antibody bound fraction was
separated from liquid by centrifugation and counted in gamma counter (Micromedic
Systems, Seattle, WA). Ang II content was expressed as pg/mL.
12. Urinary creatinine assay
Urinary creatinine assays were performed using a kit purchased from Quidel (San Diego,
CA). The excretion rate of creatinine in a normal individual is relatively constant. Thus,
urinary creatinine levels are useful in detecting renal disease and estimating the extent of
impairment of renal function. The assay is based on modified Jaffe reaction where
alkaline picrate forms a colored solution in presence of creatinine. Urine samples were
23

collected and processed as described above. Samples and standards were diluted 1:40
with distilled water. Fifty microliters of diluted samples and standards were added to 96
well plate followed by addition of 150 µl of color reagent (7 mL picric acid + 1 mL 1N
NaOH). This mixture was incubated for 30 minutes at R.T. and plate was read at 490 nm
(FusionR Packard plate reader). The intensity of the color produced is directly
proportional to the amount of creatinine present in the sample.
Statistical analysis
Diabetic db/db and control mice were separated in three groups, metformin treated group
(n=8), losartan treated group (n=8) and untreated group (n=19). Students unpaired two
tailed t test were performed to calculate p values. For multiple comparisons between two
or more groups, one-way and two-way ANOVAs were carried out followed by Fisher’s
LSD test. All data obtained are presented as mean ± SEM, and the criterion for statistical
significance was set at p<0.05. Data were analyzed using Statistica software (v.7).
24

RESULTS
25

Figure 1: Weight (A) and water intake (B) of db/db mice and their age matched lean
controls. *p<0.05, control vs. db/db. n=8-12 per group.
26

Mice
Age
Food intake (gms)
Blood glucose (mg/dL)
Control 5 week
N.D. 145.25 ± 4.7
db/db N.D. 230.38 ± 13.25*
Control 8 week
4.44 ± 0.05 158.8 ± 1.7
db/db 8.92 ± 0.09* 568 ± 32.03*
Control 10 week
3.77 ± 0.09 154.86 ± 7.18
db/db 7.94 ± 0.14* 585.39 ± 12.36*
Table 1: Time course of blood glucose and food intake in db/db mice and their age
matched lean controls. *p<0.05, control vs. db/db, n=10 per group. N.D.: not determined
27

Mice Age Volume (mL) Albumin (mg/day)
Protein (mg/day)
Creatinine (mg/mL)
Control 5 week 0.7 ± 0.25 0.06 ± 0.02
3.41 ± 1.22 0.42 ± 0.04
db/db 2.7 ± 0.52 0.28 ± 0.05*
3.6 ± 0.6 0.19 ± 0.03*
Control 8 week 1.12 ± 0.21 0.09 ± 0.02
4.57 ± 0.78 0.58 ± 0.03
db/db 15.8 ± 2.2* 2.09 ± 0.38*
16.34 ± 1.82* 0.09 ± 0.01*
Control 14-15 week
0.61 ± 0.14 0.04 ± 0.01
4.08 ± 0.85 0.52 ± 0.02
db/db 25 ± 1.83* 8.02 ± 1.09*
19.46 ± 3.55* 0.06 ± 0.01*
Control 26 week 0.55 ± 0.07 0.02 ± 0.00
N.D. 0.56 ± 0.02
db/db 30.13 ± 1.23* 4.98 ± 0.91*
N.D. 0.07 ± 0.00*
Control 30 week 1.46 ± 0.27 0.05 ± 0.01
7.61 ± 1.33 0.48 ± 0.02
db/db 25.29 ± 3.81*† 2.86 ± 0.94*†
22.12 ± 4.68*† 0.09 ± 0.01*†
Table 2: Time course of urine volume, albumin, protein and creatinine excretion in
control and db/db mice. Two-way ANOVA shows main effect of strain on volume [F(1,64)
= 488.3, p<0.0001], albumin [F(1,63) = 140.34, p<0.0001], protein [F(1,54) = 39.84,
p<0.0001] and creatinine [F(1,65) = 870.52, p<0.0001] excretion. There was a main effect
of age on volume [F(4,64) = 27.67, p<0.0001], albumin [F(4,63) = 19.75, p<0.0001], protein
[F(4,54) = 10.4, p<0.0001] and creatinine [F(4,65) = 2.94, p<0. 05] excretion. There is an
interaction between strain and age for volume [F(4,64) = 27.68, p<0.0001], albumin [F(4,63)
= 20.08, p<0.0001], protein [F(4,54) = 4.43, p<0.01] and creatinine [F(4,65) = 19.75,
p<0.0001]. *p<0.01, control vs. db/db. †p<0.01, 30 week vs. 5 week. n=5-7 per group.
N.D.: not determined.
28

Figure 2: Plasma ACE activity in 8 week (A) and 31 week (B) db/db mice and their age
matched lean controls. *p<0.01, control vs. db/db. n=8 per group.
29

Figure 3: Plasma renin activity in 8 week (A) and 31 week (B) db/db mice and their age
matched lean controls. *p<0.05, control vs. db/db. n=8 per group.
30

Figure 4: Renal ACE activity in 8 week (A) and 31 week (B) db/db mice and their age
matched lean controls. *p<0.05, control vs. db/db. n=7-8 per group.
31

Figure 5: Renal ACE2 activity in 8 week (A) and 31 week (B) db/db mice and their age
matched lean controls. *p<0.05, control vs. db/db. n=8 per group.
32

Figure 6: Urinary ACE2 activity in 5 week (A) and 30 week (B) db/db mice and their
age matched lean controls. *p<0.05, control vs. db/db. n=6 per group.
33

Figure 7: Urinary ACE2 concentration in 5 week db/db mice and their age matched lean
controls. *p<0.05, control vs. db/db. n=6 per group.
34

Figure 8: Renal AT1R protein expression in 8 week (A) and 31 week (B) db/db mice and
their age matched lean controls. *p<0.05, control vs. db/db. n=8 per group.
35

Figure 9: Renal ACE protein expression in 8 week (A) and 31 week (B) db/db mice and
their age matched lean controls. *p<0.05, control vs. db/db. n=9 per group.
36

Figure 10: Renal ACE2 protein expression in 8 week (A) 31 week (B) db/db mice and
their age matched lean controls. *p<0.05, control vs. db/db. n=8 per group.
37

Figure 11: Plasma Ang II content in 8 week (A) and 31 week (B) db/db mice and their
age matched lean controls. *p<0.01, control vs. db/db. n=8 per group.
38

Figure 12: Renal Ang II content in 8 week (A) and 31 week (B) db/db mice and their age
matched lean controls. n=8 per group.
39

Figure 13: Effect of metformin on blood glucose of control (A) and db/db (B) mice.
*p<0.05 untreated vs. metformin. n=6-8 per group.
40

Figure 14: Effect of losartan on blood glucose of control (A) and db/db (B) mice. n=6-8
per group.
41

Figure 15: Glucose tolerance test in control mice after 9 weeks of metformin or losartan
treatment. One-way ANOVA showed no main effect of treatment on area under curve.
n=8 per group.
42

Figure 16: Glucose tolerance test in db/db mice after 9 weeks of metformin treatment.
*p<0.0.5, untreated vs. metformin. n=8 per group.
43

Figure 17: Glucose tolerance test in db/db mice after 9 weeks of losartan treatment. n=8
per group.
44

Figure 18: Urinary albumin excretion in 8 week (A) and 14 week (B) db/db mice and
their age matched lean controls. Two-way ANOVA showed a main effect of strain at 8
weeks [F(1,39) = 129.78, p<0.0001] and at 14 weeks [F(1,37) = 113.93, p<0.0001]. There
was also a main effect of treatment at 14 weeks [F(2,37) = 6.57, p<0.01] but not at 8
weeks. ANOVA also showed an interaction between strain and treatment at 14 weeks
[F(2,37) = 6.56, p<0.01] but not at 8 weeks. * p<0.0001, control vs. db/db. #p<0.001,
untreated vs. treated db/db mice. n=6-8 per group.
45

Figure 19: Urinary protein excretion in 8 week (A) and 14 week (B) db/db mice and their
age matched lean controls. Two-way ANOVA showed a main effect of strain at 8 weeks
[F(1,33) = 74.24, p<0.0001] and at 14 weeks [F(1,38) = 38.53, p<0.0001]. There was also a
main effect of treatment at 8 weeks [F(2,33) = 17.86, p<0.0001] and at 14 weeks [F(2,38) =
12.5, p<0.0001]. ANOVA also showed an interaction between strain and treatment at 8
weeks [F(2,33) = 8.82, p<0.01] and at 14 weeks [F(2,38) = 12.52, p<0.001]. *p<0.01, control
vs. db/db. #p<0.0001, untreated vs. treated db/db mice. n=5-8 per group.
46
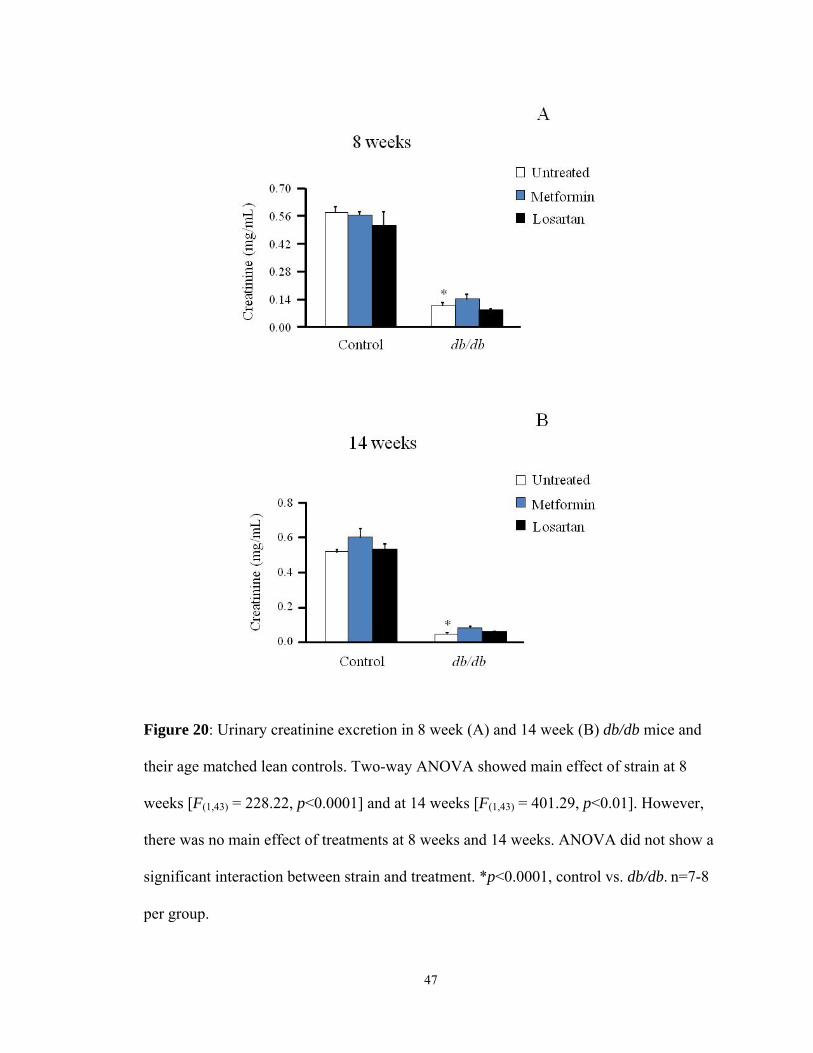
Figure 20: Urinary creatinine excretion in 8 week (A) and 14 week (B) db/db mice and
their age matched lean controls. Two-way ANOVA showed main effect of strain at 8
weeks [F(1,43) = 228.22, p<0.0001] and at 14 weeks [F(1,43) = 401.29, p<0.01]. However,
there was no main effect of treatments at 8 weeks and 14 weeks. ANOVA did not show a
significant interaction between strain and treatment. *p<0.0001, control vs. db/db. n=7-8
per group.
47

Figure 21: Renal ACE activity (A) and ACE2 activity (B) of 18 week db/db mice and
their age matched lean controls. Two-way ANOVA showed main effect of strain for ACE
activity [F(1,25) = 268.54, p<0.0001] and for ACE2 activity [F(1,27) = 33.18, p<0.0001].
However, there was no main effect of treatment on either ACE activity or ACE2 activity.
There was no significant interaction between strain and treatment. *p<0.001, control vs.
db/db. n=4-6 per group.
48

Figure 22: Urinary ACE activity in 14 week db/db mice and their age matched lean
controls. Two-way ANOVA shows main effect of strain [F(1,30) = 71.72, p<0.0001] but
not that of treatment. There was no significant interaction between strain and treatment.
*p<0.01, control vs. db/db. #p<0.05 untreated vs. treated db/db mice. n=6-7 per group.
49

Figure 23: Urinary ACE2 activity in 8 week (A) and 14 week (B) db/db mice and their
age matched lean controls. Two-way ANOVA showed main effect of strain at 8 weeks
[F(1,34) = 80.19, p<0.0001] and at 14 weeks [F(1,39) = 117.89, p<0.0001]. There was a
main effect of treatment at 8 weeks [F(2,34) = 9.3, p<0.001] and at 14 weeks [F(2,39) = 8.8,
p<0.001]. There was an interaction between strain and treatment at 8 weeks [F(2,34) =
8.58, p<0.01] and at 14 weeks [F(2,39) = 8.56, p<0.001]. *p<0.001, control vs. db/db.
#p<0.01, untreated vs. treated. n=5-7 per group.
50

Figure 24: Effect of losartan on renal AT1R expression in 18 week control (A) and db/db
(B) mice and their age matched lean controls. *p<0.05, untreated vs. treated. n=8 per
group.
51

Figure 25: Effect of losartan on renal ACE expression in 18 week control (A) and db/db
(B) mice and their age matched lean controls. n=8 per group.
52

Figure 26: Effect of losartan on renal ACE2 expression in 18 week control (A) and db/db
(B) mice and their age matched lean controls. *p<0.05, untreated vs. treated. n=8 per
group.
53

Figure 27: Effect treatments on morphology of pancreatic islets. Representative
trichrome staining in control mouse (A), control mouse treated with losartan (B), control
mouse treated with metformin (C), db/db mouse (D), db/db mouse treated with losartan
(E), db/db mouse treated with metformin (F). Metformin and losartan treatments reduce
collagen and preserves integrity of β-cells.
54

Control db/db
Figure 28: Immunohistochemical staining for AT1R in renal tissue sections from 8 week
old mice. Kidney sections were stained as described in materials and methods.
55

Figure 29: Urinary expression of ACE, ACE2, AT1 and β-actin in 8 week db/db mice.
Five week old db/db mice were treated with metformin (150 mg/kg/day) and losartan (10
mg/kg/day) in drinking water.
56

RESULTS
1. Anthropometric and metabolic parameters:
To evaluate the progression of diabetes, body weight, water intake, food intake and blood
glucose of control and db/db mice were measured.
1.1 Body weight: Young 5 week db/db mice were obese and had significantly greater
body weight compared to control mice. Diabetic db/db mice showed consistently higher
body weights compared to controls throughout the 12 week study period (Figure 1A,
p<0.05).
1.2 Water intake: At 5 weeks, water intake was comparable between the two groups
(control 6.15 ± 0.76 vs. db/db 7.3 ± 0.54, n=6). Starting from 6 weeks, water
consumption of db/db mice increased significantly. With age db/db mice showed
consistently higher water intake compared to control mice (p<0.05).
1.3 Food intake: At 8 weeks, food intake of db/db mice was significantly higher
compared to control mice (Table 1, p<0.05). High food intake of db/db mice was also
noticeable at 10 weeks (Table 1, p<0.05).
1.4 Blood glucose: At 5 weeks, blood glucose of db/db mice was significantly high
compared to controls. There was a consistent increase in the blood glucose of db/db mice
(Table 1, p<0.05). However, blood glucose of control mice remained rather constant.
57

2. Measurement of renal function:
Renal function was evaluated by measurement of urinary albumin, protein and creatinine.
Mice were placed in metabolic cages for 24-hour collection of urine.
2.1 Urinary albumin: Albuminuria is a risk marker for diabetic nephropathy. At 5 weeks,
there was a significant difference in urinary albumin excretion between control and db/db
mice (Table 2, p<0.01). With age, kidney function worsens and albumin excretion
increases further. At the age of 30 weeks, db/db mice excreted almost 10 times more
albumin compared to 5 week old mice (Table 2, p<0.01).
2.2 Urinary total protein: Urinary protein was measured by using Bradford’s reagent. At
5 weeks, urinary protein excretion of db/db mice was not different compared with non-
diabetic controls (Table 2). Protein excretion of db/db mice increased significantly with
age. By the age of 30 weeks, urinary protein excretion from db/db mice increased 6 fold
compared to that of 5 week mice (Table 2, p<0.01).
2.3 Urinary creatinine: Urinary creatinine levels are useful in estimating the extent of
impairment of kidney function. In 5 week db/db mice, urinary creatinine concentration
was significantly less compared to controls (Table 2, p<0.01). With the progression of
diabetes, urinary creatinine concentration declined further. At 30 weeks also, urinary
creatinine concentration of db/db mice was significantly less compared to control mice
(Table 2, p<0.01).
58

3. Measurement of enzyme activities:
3.1 Plasma ACE and renin activity:
3.1.1 Plasma ACE activity: Plasma ACE activity was measured using 10 µl
plasma samples. At 8 weeks, db/db mice had significant increase in plasma ACE
activity compared to controls (Figure 2, p<0.01). The increase in plasma ACE
activity was also observed in 31 week db/db mice (Figure 2, p<0.01).
3.1.2 Plasma renin activity: Renin activity was measured in 100 µl plasma
samples. There was no significant difference in renin activities between db/db and
control mice at 8 weeks and at 31 weeks (Figure 3).
3.2 Renal ACE and ACE2 activity:
3.2.1 Renal ACE activity: Renal ACE activity was measured using 10 µl (80-100
µg) kidney lysate. At 8 weeks, db/db mice had significant decrease in ACE
activity compared to controls (Figure 4A, p<0.05). ACE activity in 31 week db/db
mice was also significantly reduced compared to controls (Figure 4B, p<0.05).
3.2.2 Renal ACE2 activity: Renal ACE2 activity was measured in 4 µl (32-40 µg)
kidney lysate. Renal ACE2 activity was significantly increased in the kidneys of
young 8 week db/db mice (Figure 5A, p<0.05). Higher ACE2 activity was also
observed in 31 week old db/db mice (Figure 5B, p<0.05).
3.3 Urinary ACE and ACE2 activity
In this project, we propose to use urinary ACE and ACE2 as an index of intra-renal RAS
status.
59

3.3.1 Urinary ACE activity: Urinary ACE activity was determined using ACE
REA kit and 50 µl urine. Urinary ACE activity in young 5 week db/db mice was
below the detectable limit (data not shown).
3.3.2 Urinary ACE2 activity: Urinary ACE2 activity was determined using
fluorogenic substrate Mca-APK (Dnp) in 50 µl urine in presence of ACE inhibitor
(lisinopril). Five week mice had a significant increase in urinary ACE2 activity
compared to controls (Figure 6A, p<0.05). Urinary ACE2 activity increased 4-
fold in db/db mice by the age 31 weeks (Figure 6B, p<0.05).
3.3.3 Urinary ACE2 content: Urinary ACE2 content was measured by ELISA in
50 µl urine. At 5 weeks, ACE2 content was increased significantly in db/db mice
compared to control mice (Figure 7, p<0.05).
4. Renal protein expression of ACE, ACE2 and AT1R:
To study the effect of diabetes on renal protein expression of ACE, ACE2 and AT1R
western blots were performed.
4.1 AT1R expression: Renal AT1R expression was significantly high in 8 week db/db
mice (Figure 8A, p<0.05). Higher expression of renal AT1R was also observed in 31
week db/db mice (Figure 8B, p<0.05). These renal changes may explain hypertension
associated with diabetes.
4.2 ACE expression: In young 8 week db/db mice, kidney ACE expression was
significantly less compared to their lean controls (Figure 9A, p<0.05). Old 31 week mice
60

also had lower kidney ACE expression when compared to control mice (Figure 9B,
p<0.01)
4.3 ACE2 expression: Young 8 week db/db mice exhibited significantly high renal ACE2
expression than controls (Figure 10A, p<0.05). With progression of diabetes, kidney
function declines and so does ACE2 expression. In kidneys of old 31 week mice, ACE2
expression does not differ between control and db/db mice (Figure 10B).
5. Plasma and kidney Ang II content:
5.1 Plasma Ang II: Ang II content was evaluated in 45 µl of plasma containing 1 µl
EDTA. At 8 weeks, plasma Ang II content of db/db mice was increased compared with
control mice (Figure 11A, p<0.01). Plasma Ang II levels in old 31 week db/db mice were
also significantly high compared to controls (Figure 11B, p<0.01). This finding is
supported by high plasma ACE activity in db/db mice.
5.2 Kidney Ang II: Ang II content was evaluated using 50 µl (450-500 µg) of kidney
lysate. There was no significant difference in renal Ang II content between control and
db/db mice at the age of 8 weeks and 31 weeks (Figure 12). This finding is supported by
the fact that renal ACE expression and activity are reduced in db/db mice. Upregulation
of ACE2 in kidney degrades excess Ang II, thereby keeping its deleterious effects in
control.
6. Effect of metformin:
To study the effect of reduction in glycemia on renal and urinary outcomes, 5-8 week
mice were treated with metformin (150 mg/kg/day) in drinking water for 12 weeks.
61

6.1 Effect of metformin on blood glucose: Metformin treatment in 8 week mice did not
alter blood glucose levels (data not shown). We believe that the treatment was initiated
after a significant rise in blood glucose of 8 week db/db mice. Therefore, another group
of 5 week old db/db and control mice were treated with metformin for 12 weeks.
Metformin treatment significantly reduced blood glucose of db/db mice during ad libitum
feeding (Figure 13B, p<0.05). However, the treatment did not alter blood glucose of
control mice (Fig 13A). To evaluate the effect of metformin on glucose handling, we
performed i.p. glucose tolerance test. As expected, metformin treatment significantly
improved glucose tolerance in db/db mice (Figure 16, p<0.05) but not in control mice
(Figure 15).
6.2 Effect of metformin on renal function:
6.2.1 Albumin excretion: Three weeks of metformin treatment (150 mg/kg/day)
did not alter urinary albumin excretion in db/db mice (Figure 18A). However, 9
weeks of metformin treatment significantly reduced urinary albumin excretion
(Figure 18B, p<0.001). The albumin excretion of control mice did not change
during the treatment period.
6.2.2 Total protein excretion: Treatment with metformin significantly decreased
urinary total protein excretion in db/db mice (Figure 19, p<0.0001). However,
there was no effect of the treatment on urinary total protein excretion of control
mice (Figure 19).
62

6.2.3 Creatinine excretion: Metformin did not change creatinine concentration in
urine of either db/db or control mice after 3 and 9 weeks of treatment (Figure
20A).
6.3 Effect of metformin on renal ACE and ACE2 activities: Chronic metformin treatment
has no effect on renal ACE and ACE2 activities in either db/db or control mice (Figure
21).
6.4 Effect of metformin on urinary ACE and ACE2 activities: Metformin treatment has no
effect on urinary ACE activity (Figure 22) or urinary ACE2 (Figure 23) activity in either
db/db or control mice.
6.5. Effect of metformin on renal expression of ACE, ACE2 and AT1: Metformin
treatment has no effect on the renal expression of ACE, ACE2 and AT1R in db/db and
control mice (data not shown).
6.6 Effect of metformin on morphology of pancreatic islets: Pancreas sections from 18
week mice were stained with Masson’s trichrome to study the effect of metformin
treatment on islet morphology. Untreated db/db mice show disarray of cellular
architecture and loss of their structural integrity. Chronic metformin treatment improved
islet integrity. It also reduced fibrosis by reducing collagen around islets (Figure 27).
7. Effect of losartan
To study the effect of AT1R blockade on renal and urinary outcomes 5 week mice were
treated with losartan (10 mg/kg/day) in drinking water for 12 weeks.
63

7.1 Effect of losartan on blood glucose: Chronic losartan treatment did not alter blood
glucose in control (Figure 14A) and db/db mice (Figure 14B). To evaluate the effect of
losartan on glucose handling, we performed i.p. glucose tolerance test. Losartan treatment
had no effect on glucose tolerance of control and db/db mice (Figure 15).
7.2 Effect losartan on renal function:
Urine samples were collected after 3 and 9 weeks of initiation of the treatments.
7.2.1 Albumin excretion: Three weeks of losartan treatment did not alter urinary
albumin excretion in db/db mice (Figure 18A). However, 9 weeks of losartan
treatment significantly reduced urinary albumin excretion (Figure 18B, p<0.001).
There was no effect of the treatment on urinary albumin excretion of control mice.
7.2.2 Total protein excretion: Treatment with losartan decreased urinary total
protein excretion of db/db mice (Figure 19, p<0.0001). However, there was no
effect of the treatment on urinary total protein excretion of control mice.
7.2.3 Creatinine excretion: Losartan did not change creatinine concentration in
urine of either db/db or control mice (Figure 20A).
7.3 Effect of losartan on renal ACE and ACE2 activities: Losartan treatment did not
affect renal ACE and ACE2 activity after 12 weeks of treatment (Figure 21).
7.4 Effect of losartan on urinary ACE and ACE2 activities: Losartan increased urinary
ACE2 activity in db/db mice (Figure 23, p<0.01). However, losartan had no effect on
urinary ACE2 activity of control mice. Losartan has no effect on urinary ACE activity
(Figure 22).
64

65
7.5 Effect of losartan on renal expression of ACE, ACE2 and AT1R: Chronic treatment
with losartan significantly increased AT1 receptor protein expression in both db/db and
control mice (Figure 24, p<0.05). However, the treatment decreased ACE2 protein
expression (Figure 26, p<0.05) in both db/db and control mice. Losartan treatment had no
effect on renal ACE expression (Figure 25).
7.6 Effect of losartan on morphology of pancreatic islets: Untreated db/db mice show
disarray of cellular architecture and loss of their structural integrity. Chronic losartan
treatment improved islet integrity. It also reduced fibrosis by reducing collagen around
islets (Figure 27).
8. Immunohistochemistry of kidney:
To confirm the results obtained from western blot analysis, immunohistochemistry was
performed. As expected, AT1R expression was increased significantly in kidney tubules
of db/db mice compared to controls (Figure 28).
9. Western blots of concentrated urine:
Urinary excretion of ACE, ACE2 and AT1R protein was studied using western blots. A
total of 80 µg of concentrated urinary protein was added in each lane. Immunoblot of
ACE revealed two immunoreactive bands at 190 kDa and ~70 kDa. The smaller band
may be a degradation fragment of intact 190 kDa ACE. Immunoblot of ACE2 revealed
only one band at ~70 kDa which represents degradation fragment of integral ACE2.
Single immunoreactive bands of AT1R and β-actin were also detected at 43 kDa and 42
kDa respectively (Figure 29). The bands of β-actin were not consistent for each sample
so as to be used as a control protein.

DISCUSSION
This study tested the hypothesis that there is upregulation of AT1 receptors and
imbalance in ACE/ACE2 homeostasis in the kidneys of db/db mice. In addition we
studied the effects of chronic metformin and losartan treatment on renal RAS. Metformin
is widely prescribed as a blood glucose lowering drug for type 2 diabetics. It is an insulin
sensitizer which is thought to act by reducing hepatic glucose output and enhancing
peripheral glucose uptake (Stumvoll et al., 1995;Cusi et al., 1996). Initially a group of 8
week old db/db and control mice were treated with 150 mg/kg/day metformin in drinking
water. The treatment did not affect blood glucose of either db/db or control mice. Eight
week db/db mice had very high average blood glucose (more than 500 mg/dL) at the start
of the treatment. Therefore, we think that metformin was ineffective in reducing blood
glucose. To achieve glycemic control, young 5 week db/db and control mice were treated
with metformin (150 mg/kg/day) for 12 weeks. On this occasion metformin treatment
improved both glycemia and glucose tolerance in db/db mice. The time of initiation of
metformin treatment is critical for lowering blood glucose.
In present study, losartan treatment had no effect on blood glucose and glucose tolerance
of db/db and control mice. Some studies indicate that AT1 receptor blockers improve β-
cell function and glucose tolerance and delay the onset of type 2 diabetes in humans
(Lindholm et al., 2002) and in mouse (Chu et al., 2006). Some epidemiological data
indicates that RAS blockade delays the onset of type 2 diabetes in patients with
66

hypertension (Yusuf et al., 2005). ARBs and ACEIs are thought to affect glucose
metabolism by improving insulin sensitivity (Moan et al., 1996;Fogari et al., 1998).
However, our previous study shows that chronic losartan treatment reduces blood
pressure in db/db mice without affecting glucose tolerance (Senador et al., 2009). One
reason for improved glucose tolerance by AT1R blockade could be timing of initiation of
treatment. Our finding agrees with previous studies on db/db mice who initiated the
treatment after glucose had started to rise (Mathew et al., 2005;Shao et al., 2006;Sugaru
et al., 2007). Moreover, studies on streptozotocin induced diabetes and ob/ob mice
reported failure of chronic losartan treatment to improve blood glucose (Raimondi et al.,
2004;Erbe et al., 2006).
Although losartan treatment does not improve glucose tolerance, it improves morphology
of pancreatic islets in db/db mice. RAS components like ACE, angiotensinogen and
AT1R are reported be present in pancreatic islets (Lau et al., 2004). Activation of AT1R
is believed to inhibit insulin release in response to glucose loading (Carlsson et al., 1998).
Ang II also activates NAD(P)H oxidase and thus causes oxidative stress induced β-cell
dysfunction and apoptosis (Nakayama et al., 2005). Treatment of db/db mice with
candesartan improves granulation and reduces fibrosis and loss of endothelial cells in
islets (Shao et al., 2006). In present study, losartan treatment improves islet morphology
and integrity of β-cells. It should be noted that losartan treatment may increase insulin
release but may not improve insulin resistance. Therefore, it may not alter glucose levels
significantly.
The first sign of nephropathy in diabetics is presence of persistent albuminuria. In db/db
mice, significant microalbuminuria develops as early as 8 weeks (Sharma et al., 2003).
67

In this study, microalbuminuria was evident at the age of 5 weeks in db/db mice. At the
same time total protein excretion was not different between control and db/db mice. At
this age db/db mice were hyperglycemic. Moreover, blood pressure in db/db mice starts
to rise after the age of 11 weeks (Senador et al., 2009). Therefore in initial stages of
kidney damage is triggered by high blood glucose levels. Hyperglycemia and RAS
contribute in the development of nephropathy (Larkins & Dunlop, 1992;Andersen et al.,
2000). As mice become old, kidney function declines, measured by glomerular filtration
rate (Sharma et al., 2003). At the age of 31 weeks, albumin excretion of db/db mice
increases 10 fold compared to 5 week mice. Hyperinsulinemia has been found to increase
transcapillary escape of albumin in non-diabetic subjects, providing a link between
albuminuria and insulin resistance (Niskanen & Laakso, 1993). There are conflicting
reports in the literature on the effect of metformin on albuminuria. One study reports
reduction in urinary albumin excretion after metformin treatment in patients with type 2
diabetes (Amador-Licona et al., 2000) while others did not find any difference between
the treated and untreated groups (Imano et al., 1998;UKPDS,1998). The fact that
metformin reduces both fasting (Fujita et al., 2005) and non-fasting (Fruehwald-Schultes
et al., 2002) serum insulin levels, explains why it is effective in reducing albuminuria. On
the contrary, the effectiveness of losartan in reducing albuminuria in normotensive
(Zandbergen et al., 2003) and hypertensive (Brenner et al., 2001;Lozano et al.,
2001;Andersen et al., 2002) diabetic patients is well-known. Losartan blocks AT1R and
attenuates many of the deleterious actions of Ang II in kidneys such as contraction of
mesangial cells and glomerular arterioles (Manley, 2000), increase in membrane pore
radius (Remuzzi et al., 1993), glomerular sclerosis and modulation of extra-cellular
68

matrix (Leehey et al., 2000). In present study, metformin and losartan significantly
reduced urinary total protein excretion after 3 weeks of treatment. However, reduction in
urinary albumin excretion was only noticeable after 9 weeks. The duration of treatments
and time-points for urine collections were selected to compare our results with the
literature (Hu et al., 2009;Chu et al., 2006).
Western blot analysis of kidney shows that there is increase in ACE2 expression and
decrease in ACE expression in young db/db mice. This combination attenuates Ang II
accumulation and produces more Ang (1-7) in kidneys. Ang II over-activity is believed to
play an important role in the pathogenesis of DN (Parving et al., 2001). Ang (1-7),
produced by ACE2, is a vasodilator and anti-proliferative peptide that opposes the action
of Ang II (Koitka et al., 2008). Interestingly, ACE2 expression decreases and ACE
expression increases in the glomerulus of db/db mice, leading to altered glomerular
permeability and albuminuria (Ye et al., 2006). Ang II can increase intraglomerular
pressure by constricting both afferent and efferent arteriole, thereby stimulating urinary
albumin excretion (Remuzzi & Bertani, 1998). It has also been revealed that in animals
with experimental diabetes, intragmolerular pressure is increased even before systemic
blood pressure rises (Hostetter et al., 1982). Therefore, kidney upregulates ACE2 to
counteract pro-hypertensive processes and maintain its function. As they become old,
ACE2 expression goes down and kidney function deteriorates.
One of the key findings in the present study is upregulation of AT1R in kidneys of db/db
mice. AT1Rs are up regulated by conditions that increase Ang II like dehydration in rats
(Barth & Gerstberger, 1999;Sanvitto et al., 1997) and sodium deficiency in mouse (Chen
et al., 2003). These findings indicate that expression of AT1 receptors is affected by its
69

agonist Ang II. In a recent study, researchers found that systemic Ang II infusion
increases AT1 receptor mRNA expression in brain tissue of rats (Wei et al., 2009). An
increase in oxidative stress also leads to an increase in renal AT1R protein and mRNA
expression causing stimulation of sodium transporters and hypertension (Banday &
Lokhandwala, 2008). High blood glucose levels can increase reactive oxygen species and
eventually oxidative stress to upregulate AT1R. AT1R mRNA and protein levels are also
increased in vascular smooth muscles of type 2 diabetic patients (Hodroj et al., 2007).
Another study reported upregulation of AT1 receptor together with over expression of
Ang II in cavernous tissue of type 1 diabetic rats suggesting its possible role in erectile
dysfunction (Yang et al., 2009). High levels of circulating insulin, as seen type 2
diabetics, can also upregulate AT1 receptors in vascular smooth muscles (Hodroj et al.,
2007;Nickenig et al., 1998). Additionally, AT1R mRNA expression also increases in
pancreatic islets of db/db mice (Chu et al., 2006). This study shows that db/db mice have
high levels of circulating Ang II. Therefore, it is plausible that high expression of AT1
receptors in response to high circulating Ang II could lead to diabetes related
hypertension in db/db diabetic mice.
Treatment with losartan increases Ang II levels in the plasma in Lewis rats (Ferrario et
al., 2005). As a result, losartan also increases cardiac ACE2 activity promoting
production of Ang (1-7) form Ang II. High plasma Ang II may also cause stimulation of
AT2 receptors to exert its beneficial effects. There are conflicting reports on effect of
ARBs on AT1R expression. Some report an increase in AT1R with ARB treatment
(Wang et al., 1997;Hu et al., 2009) while others report down regulation (Wei et al.,
2009). Our data show that renal AT1R protein expression increases following chronic
70

losartan treatment in both db/db and control mice. As mentioned earlier db/db mice
already have high levels of circulating Ang II and an increase in Ang II results in an
increase in AT1R. Therefore, losartan treatment is likely to up regulate AT1R in kidney,
where Ang II is sequestered from plasma and is also a primary site of its action. Many
reports in the literature suggest that blockade of AT1R increases ACE2 (Soler et al.,
2009;Ferrario et al., 2005;Igase et al., 2005;Whaley-Connell et al., 2006). In contrast,
study by Xia and others did not find any significant change in ACE2 expression after
losartan treatment (Xia et al., 2009). In this study, losartan treatment significantly
reduced renal ACE2 protein expression in db/db and control. A recent study shows down
regulation of ACE2 mRNA in rat astrocytes after Ang II treatment (Gallagher et al.,
2006). Therefore, an increase in plasma Ang II levels by losartan may cause
downregulation of ACE2. Although AT1Rs are blocked by losartan, they can be
constitutively active and may act as autoreceptors (Zou et al., 2004). In this case, AT1R
no longer need Ang II to initiate signaling and may affect expression of ACE2. Another
possible mechanism for ACE2 downregulation may be action of Ang II or its derivatives
on angiotensin receptors. There was no change in expression of renal ACE protein after
losartan treatment. This finding agrees with study by Gallagher and others (Gallagher et
al., 2006). However, chronic metformin treatment did not affect RAS parameters in either
db/db or control mice.
To confirm the data obtained from western blot, renal ACE and ACE2 activities were
determined. As expected, ACE2 activity was increased and ACE activity was decreased
in kidneys of 8 week db/db mice. On the contrary, plasma ACE activity and Ang II
content were higher in 8 week db/db mice compared to controls and at this age mice are
71

not hypertensive (Senador et al., 2009). This means that kidney keeps deleterious effects
of Ang II in check by upregulating ACE2. As mice become old, kidneys cannot keep up
and systemic hypertension develops (Figure 5 vs. Figure 21). A ratio of high ACE2 to
low ACE favors less Ang II accumulation in tissues like kidney, helping to maintain their
function. Studies in the literature suggest that losartan treatment increases ACE2 activity
(Ferrario et al., 2005;Xia et al., 2009;Jessup et al., 2006). In this study, losartan treatment
does not change ACE activity in either db/db or control mice. Chronic losartan treatment
reduces expression of ACE2 protein in the kidney, but it doesn’t change ACE2 activity.
One reason for this could be sequestration of plasma Ang II by the kidney. Reduction in
ACE2 protein caused by losartan in the kidney is compensated by high ACE2 activity to
cleave the harmful Ang II.
It is reasonable to assume that up regulation of ACE2 in kidneys may be reflected in
urine samples. A study by Wakahara et. al. has shown that ACE2 mRNA expression in
human renal tissue marginally correlated with the degree of proteinuria (Wakahara et al.,
2007). A strong correlation between proteinuria and urinary expression of ACE and
ACE2 has also been observed in humans (Wang et al., 2008). In this study, we measured
urinary ACE2 activity and ACE2 content in young 5 week mice. At this age, db/db mice
excreted more ACE2 in urine compared to controls. Additionally, ACE2 activity in the
urine of db/db mice was also higher compared to controls. Kidney upregulates ACE2
sensing the change glycemia which is detected by urine analysis. At 5 weeks, urinary
albumin excretion was also high in db/db mice but urinary total protein excretion was not
different between the two groups. Furthermore, our study shows presence of ACE, ACE2
and AT1 proteins in the urine of 8 week old db/db mice. Urinary ACE and ACE2 enzyme
72

73
activities were also high in 8 week db/db mice. ACE and ACE2 are both type 1 integral
membrane protein comprising a large extracellular catalytic domain. ACE has been
shown to be proteolytically released from cell surface (Parkin et al., 2004). Catalytically
active forms of ACE have also been found in urine (Hooper, 1991) and plasma (Senador
et al., 2009). On the contrary, ACE2 activity is not detectable in plasma (Elased et al.,
2006). Therefore, it likely that source of urinary ACE2 is kidney and that of urinary ACE
is plasma. This study shows presence of ACE2 in urine of young db/db mice, using both
sensitive catalytic assay and immunoblotting. Urinary ACE2 levels reflect intra-renal
RAS status and have potential for diagnosis and prognosis of diabetic renal disease.

CONCLUSION
Cardiovascular and renal diseases are long term complications of diabetes and are leading
cause of morbidity and mortality. There is evidence of activation of RAS in diabetic
animals and humans. Our previous study showed effectiveness of AT1R blockade in
reduction of blood pressure in db/db mice. Present study shows for the first time, that
there is upregulation of AT1R protein expression in kidneys of db/db mice that may
contribute in the development of diabetes related hypertension. We also show that,
chronic losartan (10 mg/kg/day) treatment has no effect on blood glucose levels although
it improves morphology of pancreatic islets. In addition, losartan treatment increased
AT1R protein expression but decreased ACE2 protein expression in both db/db and
control mice. Losartan treatment also reduces urinary albumin and protein excretion in
db/db mice.
To investigate the effect of blood glucose reduction, mice were treated with metformin
(150 mg/kg/day). As expected, metformin treatment improved blood glucose and glucose
tolerance in db/db mice. Our study shows effectiveness of metformin in reducing urinary
albumin and protein excretion. However, chronic metformin treatment did not change
renal expression or activity of ACE and ACE2.
One of the aims of this study was to examine if ACE2 could be used as a predictor for
early phase of diabetic nephropathy. We show that there is an increase in urinary ACE2
activity and ACE2 content in young 5 week, db/db mice. Present study also shows
74

presence of ACE, ACE2 and AT1R proteins in concentrated urine samples of 8 week
mice. Our previous studies show that there is no detectable ACE2 activity in plasma.
Therefore, kidney is the primary source of urinary ACE2. These findings suggest that
urinary ACE2 could be a potential non-invasive biomarker of diabetic nephropathy.
75

APPENDIX A
Urinary, but Not Plasma Angiotensin-Converting Enzyme 2 (ACE2), Is Associated with Diabetic Nephropathy
Malav N Madhu, Rendong Quan, Nathan M Weir, Wenfeng Zhang, Mariana Morris, Khalid M Elased
Boonshoft School of Medicine, Wright State University, Dayton, OH
Diabetic nephropathy (DN) is a leading cause of end-stage renal disease worldwide. Alteration in the renin angiotensin system (RAS) is widely believed to contribute to kidney injury in diabetes. Currently, detection of urinary albumin is the only non-invasive technique used for diagnosis of DN. However, microalbuminuria is a poor predictor for DN, while proteinuria is only detectable in late stage nephropathy. Recent studies suggested that ACE2 is renoprotective in 8 week old murine model of type II diabetes (db/db mice). The aim of this study was to test the hypothesis that urinary ACE2 is an early marker for intra-renal RAS status and nephropathy in db/db diabetic mice. Individual urine samples were collected from 5-8 week old male db/db diabetic and control mice over 24 hours. Renal and urinary ACE2 activities were determined using the conventional fluorogenic substrate, Mca-APK (Dnp) and also using SELDI-TOF mass spectrometry (MS). Urinary ACE2 content was evaluated by ELISA. Urinary albumin, creatinine and protein were measured as an index of kidney damage. Renal ACE and ACE2 expression were determined by western blot. At an early age (5-6 weeks) db/db mice developed moderate hyperglycemia, hyperinsulinemia and mild albuminuria (p<0.01). Five week old db/db mice showed a significant increase in urinary ACE2 content (p<0.05) and activity (p<0.01) compared to controls. This finding was confirmed by SELDI-TOF MS. There was increase in renal ACE2 expression and activity of 8 week db/db mice (p<0.05) while renal ACE expression was decreased in db/db mice (p<0.01) compared to controls. Interestingly, plasma ACE activity was significantly higher in db/db mice compared to controls (p<0.01). There was no detectable ACE2 activity in plasma suggesting urinary ACE2 was derived from the kidney. In conclusion, urinary ACE2 warrants further investigation as a potential non-invasive marker for early diabetic nephropathy.
Poster accepted in the 63rd High Blood Pressure Research Conference, Chicago 2009
76

APPENDIX B
Upregulation of Angiotensin AT1 Receptors in Hypertensive db/db Diabetic Mice
Malav N Madhu, Nathan M Weir, Rendong Quan, Denielle Senador, Wenfeng Zhang, Mariana Morris, Khalid M Elased
Boonshoft School of Medicine, Wright State University, Dayton, OH
Hypertension is a major cause of cardiovascular and renal disease in diabetics. In our previous studies we showed that high blood pressure in obese db/db diabetic mice can be reduced by angiotensin AT1 receptor (AT1R) blockade. The aim of this study was to assess the changes in renal and aortic AT1R expression and pressor response to chronic angiotensin II (Ang II) infusion in db/db mice. Western blot analysis was used to measure renal and aortic protein expression in 8-18 week old male db/db mice and their lean controls. AT1R expression was significantly increased in kidneys and aorta of db/db mice compared to controls (p<0.01). Immunohistochemistry showed increased immunostaining for AT1R in cortical kidney tubules and glomeruli of db/db mice compared to controls. There was also a significant increase in plasma ACE activity (p<0.01) and plasma Ang II (p<0.05) in db/db mice compared to controls. Another group of 8 week old db/db mice were implanted with carotid telemetric probes and 24 hr mean arterial pressure (MAP), heart rate (HR) and activity were monitored weekly. MAP began to increase in db/db mice after the age of 11 weeks during both light and dark periods when compared to controls (p<0.01). At 15 weeks, Ang II was infused at 1000 ng/kg/h for 4 weeks to evaluate its effect on pressor response. The infusion elicited a spike in MAPs of both control and db/db mice compared to the previous week (p<0.01). After the initial increase, MAP of control mice regressed towards baseline. However, MAP of db/db mice remained elevated throughout the infusion period (p<0.05). This is the first report to demonstrate increases in AT1R expression in db/db mice. The prolonged pressor response to Ang II by db/db mice could, in part, be attributed to the upregulation of AT1R and preexisting elevation in plasma Ang II.
Poster accepted in the 63rd High Blood Pressure Research Conference, Chicago 2009
77

REFERENCE LIST
National diabetes fact sheet: United States 2005. Centers for Disease Control and Prevention. Available at: www.ndep.nih.gov/diabetes/pubs/2005_National_Diabetes_Fact_Sheet.pdf. Accessed August 11, 2009. Ref Type: Generic
(1998). Effect of intensive blood-glucose control with metformin on complications in overweight patients with type 2 diabetes (UKPDS 34). UK Prospective Diabetes Study (UKPDS) Group. Lancet 352, 854-865.
(2003). USRDS: the United States Renal Data System. Am J Kidney Dis 42, 1-230.
ADAMCZAK, M., KOKOT, F., & WIECEK, A.W. (2000). Relationship between plasma renin profile and leptinaemia in patients with essential hypertension. J Hum Hypertens 14, 503-509.
AGUILAR, D. & SOLOMON, S.D. (2006). ACE inhibitors and angiotensin receptor antagonists and the incidence of new-onset diabetes mellitus: an emerging theme. Drugs 66, 1169-1177.
AHMAD, J., SIDDIQUI, M.A., & AHMAD, H. (1997). Effective postponement of diabetic nephropathy with enalapril in normotensive type 2 diabetic patients with microalbuminuria. Diabetes Care 20, 1576-1581.
AMADOR-LICONA, N., GUIZAR-MENDOZA, J., VARGAS, E., SANCHEZ-CAMARGO, G., & ZAMORA-MATA, L. (2000). The short-term effect of a switch from glibenclamide to metformin on blood pressure and microalbuminuria in patients with type 2 diabetes mellitus. Arch Med Res 31, 571-575.
AMAZONAS, R.B. & LOPES DE FARIA, J.B. (2006). Effects of tight blood pressure control on glomerular hypertrophy in a model of genetic hypertension and experimental diabetes mellitus. Life Sci 79, 2135-2143.
ANDERSEN, S., ROSSING, P., JUHL, T.R., DEINUM, J., & PARVING, H.H. (2002). Optimal dose of losartan for renoprotection in diabetic nephropathy. Nephrol Dial Transplant 17, 1413-1418.
78

ANDERSEN, S., TARNOW, L., ROSSING, P., HANSEN, B.V., & PARVING, H.H. (2000). Renoprotective effects of angiotensin II receptor blockade in type 1 diabetic patients with diabetic nephropathy. Kidney International 57, 601-606.
ANDERSON, S., JUNG, F.F., & INGELFINGER, J.R. (1993). Renal renin-angiotensin system in diabetes: functional, immunohistochemical, and molecular biological correlations. Am J Physiol 265, F477-F486.
BANDAY, A.A. & LOKHANDWALA, M.F. (2008). Oxidative stress-induced renal angiotensin AT1 receptor upregulation causes increased stimulation of sodium transporters and hypertension. Am J Physiol Renal Physiol 295, F698-F706.
BARTH, S.W. & GERSTBERGER, R. (1999). Differential regulation of angiotensinogen and AT1A receptor mRNA within the rat subfornical organ during dehydration. Brain Res Mol Brain Res 64, 151-164.
BARTON, M., CARMONA, R., ORTMANN, J., KRIEGER, J.E., & TRAUPE, T. (2003). Obesity-associated activation of angiotensin and endothelin in the cardiovascular system. Int J Biochem Cell Biol 35, 826-837.
BASTURK, T., ALTUNTAS, Y., KURKLU, A., AYDIN, L., EREN, N., & UNSAL, A. (2006). Urinary N-acetyl B glucosaminidase as an earlier marker of diabetic nephropathy and influence of low-dose perindopril/indapamide combination. Ren Fail 28, 125-128.
BRENNER, B.M., COOPER, M.E., DE, Z.D., KEANE, W.F., MITCH, W.E., PARVING, H.H., REMUZZI, G., SNAPINN, S.M., ZHANG, Z., & SHAHINFAR, S. (2001). Effects of losartan on renal and cardiovascular outcomes in patients with type 2 diabetes and nephropathy. N Engl J Med 345, 861-869.
BROSIUS, F.C. & HEILIG, C.W. (2005). Glucose transporters in diabetic nephropathy. Pediatr Nephrol 20, 447-451.
CAREY, R.M. & PADIA, S.H. (2008). Angiotensin AT2 receptors: control of renal sodium excretion and blood pressure. Trends Endocrinol Metab 19, 84-87.
CAREY, R.M. & SIRAGY, H.M. (2003). The intrarenal renin-angiotensin system and diabetic nephropathy. Trends Endocrinol Metab 14, 274-281.
CARLSSON, P.O., BERNE, C., & JANSSON, L. (1998). Angiotensin II and the endocrine pancreas: effects on islet blood flow and insulin secretion in rats. Diabetologia 41, 127-133.
79

CHAPPELL, M.C., DIZ, D.I., & JACOBSEN, D.W. (1992). Pharmacological characterization of angiotensin II binding sites in the canine pancreas. Peptides 13, 313-318.
CHEN, Y., DA ROCHA, M.J., & MORRIS, M. (2003). Osmotic regulation of angiotensin AT1 receptor subtypes in mouse brain. Brain Research 965, 35-44.
CHRISTIANSEN, J.S., FRANDSEN, M., & PARVING, H.H. (1981). The effect of intravenous insulin infusion on kidney function in insulin-dependent diabetes mellitus. Diabetologia 20, 199-204.
CHU, K.Y., LAU, T., CARLSSON, P.O., & LEUNG, P.S. (2006). Angiotensin II type 1 receptor blockade improves beta-cell function and glucose tolerance in a mouse model of type 2 diabetes. Diabetes 55, 367-374.
COMPER, W.D. & OSICKA, T.M. (2005). Detection of urinary albumin. Adv Chronic Kidney Dis 12, 170-176.
CONSIDINE, R.V., SINHA, M.K., HEIMAN, M.L., KRIAUCIUNAS, A., STEPHENS, T.W., NYCE, M.R., OHANNESIAN, J.P., MARCO, C.C., MCKEE, L.J., BAUER, T.L., & . (1996). Serum immunoreactive-leptin concentrations in normal-weight and obese humans. N Engl J Med 334, 292-295.
COOPER, M.E. (2004). Importance of advanced glycation end products in diabetes-associated cardiovascular and renal disease. American Journal of Hypertension 17, 31S-38S.
COOPER, M.E. (1998). Pathogenesis, prevention, and treatment of diabetic nephropathy. Lancet 352, 213-219.
COOPER, M.E. & JOHNSTON, C.I. (2000). Optimizing treatment of hypertension in patients with diabetes. JAMA 283, 3177-3179.
CRACKOWER, M.A., SARAO, R., OUDIT, G.Y., YAGIL, C., KOZIERADZKI, I., SCANGA, S.E., OLIVEIRA-DOS-SANTOS, A.J., DA COSTA, J., ZHANG, L., PEI, Y., SCHOLEY, J., FERRARIO, C.M., MANOUKIAN, A.S., CHAPPELL, M.C., BACKX, P.H., YAGIL, Y., & PENNINGER, J.M. (2002). Angiotensin-converting enzyme 2 is an essential regulator of heart function. Nature 417, 822-828.
CUSI, K., CONSOLI, A., & DEFRONZO, R.A. (1996). Metabolic effects of metformin on glucose and lactate metabolism in noninsulin-dependent diabetes mellitus. J Clin Endocrinol Metab 81, 4059-4067.
80

DE, G.M., CATT, K.J., INAGAMI, T., WRIGHT, J.W., & UNGER, T. (2000). International union of pharmacology. XXIII. The angiotensin II receptors 2. Pharmacol Rev 52, 415-472.
DONOGHUE, M., HSIEH, F., BARONAS, E., GODBOUT, K., GOSSELIN, M., STAGLIANO, N., DONOVAN, M., WOOLF, B., ROBISON, K., JEYASEELAN, R., BREITBART, R.E., & ACTON, S. (2000). A novel angiotensin-converting enzyme-related carboxypeptidase (ACE2) converts angiotensin I to angiotensin 1-9. Circulation Research 87, E1-E9.
DZAU, V.J., BERNSTEIN, K., CELERMAJER, D., COHEN, J., DAHLOF, B., DEANFIELD, J., DIEZ, J., DREXLER, H., FERRARI, R., VAN, G.W., HANSSON, L., HORNIG, B., HUSAIN, A., JOHNSTON, C., LAZAR, H., LONN, E., LUSCHER, T., MANCINI, J., MIMRAN, A., PEPINE, C., RABELINK, T., REMME, W., RUILOPE, L., RUZICKA, M., SCHUNKERT, H., SWEDBERG, K., UNGER, T., VAUGHAN, D., & WEBER, M. (2002). Pathophysiologic and therapeutic importance of tissue ACE: a consensus report. Cardiovasc Drugs Ther 16, 149-160.
ELASED, K.M., CUNHA, T.S., GURLEY, S.B., COFFMAN, T.M., & MORRIS, M. (2006). New Mass Spectrometric Assay for Angiotensin-Converting Enzyme 2 Activity. Hypertension 47, 1010-1017.
ERBE, D.V., GARTRELL, K., ZHANG, Y.L., SURI, V., KIRINCICH, S.J., WILL, S., PERREAULT, M., WANG, S., & TOBIN, J.F. (2006). Molecular activation of PPARgamma by angiotensin II type 1-receptor antagonists. Vascul Pharmacol 45, 154-162.
ERIKSSON, U., DANILCZYK, U., & PENNINGER, J.M. (2002). Just the beginning: novel functions for angiotensin-converting enzymes. Curr Biol 12, R745-R752.
ETTARO, L., SONGER, T.J., ZHANG, P., & ENGELGAU, M.M. (2004). Cost-of-illness studies in diabetes mellitus. Pharmacoeconomics 22, 149-164.
FERRARIO, C.M., JESSUP, J., CHAPPELL, M.C., AVERILL, D.B., BROSNIHAN, K.B., TALLANT, E.A., DIZ, D.I., & GALLAGHER, P.E. (2005). Effect of angiotensin-converting enzyme inhibition and angiotensin II receptor blockers on cardiac angiotensin-converting enzyme 2 11. Circulation 111, 2605-2610.
FOGARI, R., ZOPPI, A., LAZZARI, P., PRETI, P., MUGELLINI, A., CORRADI, L., & LUSARDI, P. (1998). ACE inhibition but not angiotensin II antagonism reduces plasma fibrinogen and insulin resistance in overweight hypertensive patients. J Cardiovasc Pharmacol 32, 616-620.
81

FRUEHWALD-SCHULTES, B., OLTMANNS, K.M., TOSCHEK, B., SOPKE, S., KERN, W., BORN, J., FEHM, H.L., & PETERS, A. (2002). Short-term treatment with metformin decreases serum leptin concentration without affecting body weight and body fat content in normal-weight healthy men. Metabolism 51, 531-536.
FUJITA, H., FUJISHIMA, H., KOSHIMURA, J., HOSOBA, M., YOSHIOKA, N., SHIMOTOMAI, T., MORII, T., NARITA, T., KAKEI, M., & ITO, S. (2005). Effects of antidiabetic treatment with metformin and insulin on serum and adipose tissue adiponectin levels in db/db mice. Endocr J 52, 427-433.
FUTRAKUL, N., BUTTHEP, P., VONGTHAVARAWAT, V., FUTRAKUL, P., SIRISALIPOCH, S., CHAIVATANARAT, T., & SUWANWALAIKORN, S. (2006). Early detection of endothelial injury and dysfunction in conjunction with correction of hemodynamic maladjustment can effectively restore renal function in type 2 diabetic nephropathy. Clin Hemorheol Microcirc 34, 373-381.
FYHRQUIST, F. & SAIJONMAA, O. (2008). Renin-angiotensin system revisited. J Intern Med 264, 224-236.
GALLAGHER, P.E., CHAPPELL, M.C., FERRARIO, C.M., & TALLANT, E.A. (2006). Distinct roles for ANG II and ANG-(1-7) in the regulation of angiotensin-converting enzyme 2 in rat astrocytes. Am J Physiol Cell Physiol 290, C420-C426.
GAO, L., WANG, W., LI, Y.L., SCHULTZ, H.D., LIU, D., CORNISH, K.G., & ZUCKER, I.H. (2005). Sympathoexcitation by central ANG II: roles for AT1 receptor upregulation and NAD(P)H oxidase in RVLM. Am J Physiol Heart Circ Physiol 288, H2271-H2279.
GARG, R. & YUSUF, S. (1995). Overview of randomized trials of angiotensin-converting enzyme inhibitors on mortality and morbidity in patients with heart failure. Collaborative Group on ACE Inhibitor Trials. JAMA 273, 1450-1456.
GIACCHETTI, G., SECHI, L.A., RILLI, S., & CAREY, R.M. (2005). The renin-angiotensin-aldosterone system, glucose metabolism and diabetes. Trends Endocrinol Metab 16, 120-126.
GURLEY, S.B., ALLRED, A., LE, T.H., MAO, L., DONOGHUE, M., BREITBART, R.E., ACTON, S., ROCKMAN, H.A., & COFFMAN, T.M. Altered Blood Pressure Response and Normal Cardiac Phenotype in ACE2-Deficient Mice. Hypertension 44, 19. 2004. Ref Type: Abstract
GUY, J.L., JACKSON, R.M., ACHARYA, K.R., STURROCK, E.D., HOOPER, N.M., & TURNER, A.J. (2003). Angiotensin-converting enzyme-2 (ACE2): comparative modeling of the active site, specificity requirements, and chloride dependence. Biochemistry 42, 13185-13192.
82

HAMMING, I., TIMENS, W., BULTHUIS, M.L., LELY, A.T., NAVIS, G.J., & VAN, G.H. (2004). Tissue distribution of ACE2 protein, the functional receptor for SARS coronavirus. A first step in understanding SARS pathogenesis 3. J Pathol 203, 631-637.
HASSLACHER, C., RITZ, E., WAHL, P., & MICHAEL, C. (1989). Similar risks of nephropathy in patients with type I or type II diabetes mellitus. Nephrol Dial Transplant 4, 859-863.
HAULICA, I., BILD, W., MIHAILA, C.N., IONITA, T., BOISTEANU, C.P., & NEAGU, B. (2003). Biphasic effects of angiotensin (1-7) and its interactions with angiotensin II in rat aorta. J Renin Angiotensin Aldosterone Syst 4, 124-128.
HAYNES, W.G. (2005). Role of leptin in obesity-related hypertension. Exp Physiol 90, 683-688.
HIGUCHI, S., OHTSU, H., SUZUKI, H., SHIRAI, H., FRANK, G.D., & EGUCHI, S. (2007). Angiotensin II signal transduction through the AT1 receptor: novel insights into mechanisms and pathophysiology. Clin Sci (Lond) 112, 417-428.
HODROJ, W., LEGEDZ, L., FOUDI, N., CERUTTI, C., BOURDILLON, M.C., FEUGIER, P., BEYLOT, M., RANDON, J., & BRICCA, G. (2007). Increased insulin-stimulated expression of arterial angiotensinogen and angiotensin type 1 receptor in patients with type 2 diabetes mellitus and atheroma. Arterioscler Thromb Vasc Biol 27, 525-531.
HOLLENBERG, N.K. & RAIJ, L. (1993). Angiotensin-converting enzyme inhibition and renal protection. An assessment of implications for therapy. Arch Intern Med 153, 2426-2435.
HOOPER, N.M. (1991). Angiotensin converting enzyme: implications from molecular biology for its physiological functions. Int J Biochem 23, 641-647.
HOSTETTER, T.H. (2003). Hyperfiltration and glomerulosclerosis. Semin Nephrol 23, 194-199.
HOSTETTER, T.H., RENNKE, H.G., & BRENNER, B.M. (1982). The case for intrarenal hypertension in the initiation and progression of diabetic and other glomerulopathies. American Journal of Medicine 72, 375-380.
HU, J., TIWARI, S., RIAZI, S., HU, X., WANG, X., & ECELBARGER, C.M. (2009). Regulation of angiotensin II type I receptor (AT1R) protein levels in the obese Zucker rat kidney and urine. Clin Exp Hypertens 31, 49-63.
83

HUENTELMAN, M.J., ZUBCEVIC, J., KATOVICH, M.J., & RAIZADA, M.K. (2004). Cloning and characterization of a secreted form of angiotensin-converting enzyme 2. Regul Pept 122, 61-67.
IGASE, M., STRAWN, W.B., GALLAGHER, P.E., GEARY, R.L., & FERRARIO, C.M. (2005). Angiotensin II AT1 receptors regulate ACE2 and angiotensin-(1-7) expression in the aorta of spontaneously hypertensive rats. Am J Physiol Heart Circ Physiol 289, H1013-H1019.
IMANO, E., KANDA, T., NAKATANI, Y., NISHIDA, T., ARAI, K., MOTOMURA, M., KAJIMOTO, Y., YAMASAKI, Y., & HORI, M. (1998). Effect of troglitazone on microalbuminuria in patients with incipient diabetic nephropathy. Diabetes Care 21, 2135-2139.
JAKUS, V. & RIETBROCK, N. (2004). Advanced glycation end-products and the progress of diabetic vascular complications. Physiol Res 53, 131-142.
JAWA, A., NACHIMUTHU, S., PENDERGRASS, M., ASNANI, S., & FONSECA, V. (2006). Impaired vascular reactivity in African-American patients with type 2 diabetes mellitus and microalbuminuria or proteinuria despite angiotensin-converting enzyme inhibitor therapy. J Clin Endocrinol Metab 91, 31-35.
JESSUP, J.A., GALLAGHER, P.E., AVERILL, D.B., BROSNIHAN, K.B., TALLANT, E.A., CHAPPELL, M.C., & FERRARIO, C.M. (2006). Effect of angiotensin II blockade on a new congenic model of hypertension derived from transgenic Ren-2 rats. Am J Physiol Heart Circ Physiol 291, H2166-H2172.
KOBORI, H., ALPER, A.B., JR., SHENAVA, R., KATSURADA, A., SAITO, T., OHASHI, N., URUSHIHARA, M., MIYATA, K., SATOU, R., HAMM, L.L., & NAVAR, L.G. (2009). Urinary angiotensinogen as a novel biomarker of the intrarenal renin-angiotensin system status in hypertensive patients. Hypertension 53, 344-350.
KOITKA, A., COOPER, M.E., THOMAS, M.C., & TIKELLIS, C. (2008). Angiotensin converting enzyme 2 in the kidney. Clin Exp Pharmacol Physiol 35, 420-425.
KOKA, V., HUANG, X.R., CHUNG, A.C., WANG, W., TRUONG, L.D., & LAN, H.Y. (2008). Angiotensin II up-regulates angiotensin I-converting enzyme (ACE), but down-regulates ACE2 via the AT1-ERK/p38 MAP kinase pathway. Am J Pathol 172, 1174-1183.
KUMAR, R., SINGH, V.P., & BAKER, K.M. (2007). The intracellular renin-angiotensin system: a new paradigm. Trends Endocrinol Metab 18, 208-214.
LARKINS, R.G. & DUNLOP, M.E. (1992). The link between hyperglycaemia and diabetic nephropathy. Diabetologia 35, 499-504.
84

LAU, T., CARLSSON, P.O., & LEUNG, P.S. (2004). Evidence for a local angiotensin-generating system and dose-dependent inhibition of glucose-stimulated insulin release by angiotensin II in isolated pancreatic islets. Diabetologia 47, 240-248.
LEE, G.S. (2005). Retarding the progression of diabetic nephropathy in type 2 diabetes mellitus: focus on hypertension and proteinuria. Ann Acad Med Singapore 34, 24-30.
LEEHEY, D.J., SINGH, A.K., ALAVI, N., & SINGH, R. (2000). Role of angiotensin II in diabetic nephropathy. Kidney Int Suppl 77, S93-S98.
LEUNG, P.S., CHAN, H.C., & WONG, P.Y. (1998). Immunohistochemical localization of angiotensin II in the mouse pancreas. Histochem J 30, 21-25.
LEWIS, E.J. (2002). The role of angiotensin II receptor blockers in preventing the progression of renal disease in patients with type 2 diabetes. American Journal of Hypertension 15, 123S-128S.
LEWIS, E.J., HUNSICKER, L.G., BAIN, R.P., & ROHDE, R.D. (1993). The effect of angiotensin-converting-enzyme inhibition on diabetic nephropathy. The Collaborative Study Group. N Engl J Med 329, 1456-1462.
LI, N., ZIMPELMANN, J., CHENG, K., WILKINS, J.A., & BURNS, K.D. (2005). The role of angiotensin converting enzyme 2 in the generation of angiotensin 1-7 by rat proximal tubules 1. Am J Physiol Renal Physiol 288, F353-F362.
LINDHOLM, L.H., IBSEN, H., BORCH-JOHNSEN, K., OLSEN, M.H., WACHTELL, K., DAHLOF, B., DEVEREUX, R.B., BEEVERS, G., DE FAIRE, U., FYHRQUIST, F., JULIUS, S., KJELDSEN, S.E., KRISTIANSON, K., LEDERBALLE-PEDERSEN, O., NIEMINEN, M.S., OMVIK, P., OPARIL, S., WEDEL, H., AURUP, P., EDELMAN, J.M., & SNAPINN, S. (2002). Risk of new-onset diabetes in the Losartan Intervention For Endpoint reduction in hypertension study. J Hypertens 20, 1879-1886.
LOZANO, J.V., LLISTERRI, J.L., AZNAR, J., & REDON, J. (2001). Losartan reduces microalbuminuria in hypertensive microalbuminuric type 2 diabetics. Nephrol Dial Transplant 16 Suppl 1, 85-89.
MANLEY, H.J. (2000). Role of angiotensin-converting-enzyme inhibition in patients with renal disease. Am J Health Syst Pharm 57 Suppl 1, S12-S18.
MASCHIO, G., ALBERTI, D., JANIN, G., LOCATELLI, F., MANN, J.F., MOTOLESE, M., PONTICELLI, C., RITZ, E., & ZUCCHELLI, P. (1996). Effect of the angiotensin-converting-enzyme inhibitor benazepril on the progression of chronic renal insufficiency. The Angiotensin-
85

Converting-Enzyme Inhibition in Progressive Renal Insufficiency Study Group. N Engl J Med 334, 939-945.
MASCHIO, G., ALBERTI, D., LOCATELLI, F., MANN, J.F., MOTOLESE, M., PONTICELLI, C., RITZ, E., JANIN, G., & ZUCCHELLI, P. (1999). Angiotensin-converting enzyme inhibitors and kidney protection: the AIPRI trial. The ACE Inhibition in Progressive Renal Insufficiency (AIPRI) Study Group. J Cardiovasc Pharmacol 33 Suppl 1, S16-S20.
MATHEW, R., FUTTERWEIT, S., VALDERRAMA, E., TARECTECAN, A.A., BYLANDER, J.E., BOND, J.S., & TRACHTMAN, H. (2005). Meprin-alpha in chronic diabetic nephropathy: interaction with the renin-angiotensin axis. Am J Physiol Renal Physiol 289, F911-F921.
MATHIESEN, E.R., HOMMEL, E., GIESE, J., & PARVING, H.H. (1991). Efficacy of captopril in postponing nephropathy in normotensive insulin dependent diabetic patients with microalbuminuria. BMJ 303, 81-87.
MIMA, A., ARAI, H., MATSUBARA, T., ABE, H., NAGAI, K., TAMURA, Y., TORIKOSHI, K., ARAKI, M., KANAMORI, H., TAKAHASHI, T., TOMINAGA, T., MATSUURA, M., IEHARA, N., FUKATSU, A., KITA, T., & DOI, T. (2008). Urinary Smad1 is a novel marker to predict later onset of mesangial matrix expansion in diabetic nephropathy. Diabetes 57, 1712-1722.
MOAN, A., HOIEGGEN, A., SELJEFLOT, I., RISANGER, T., ARNESEN, H., & KJELDSEN, S.E. (1996). The effect of angiotensin II receptor antagonism with losartan on glucose metabolism and insulin sensitivity. J Hypertens 14, 1093-1097.
MOKDAD, A.H., BOWMAN, B.A., FORD, E.S., VINICOR, F., MARKS, J.S., & KOPLAN, J.P. (2001). The continuing epidemics of obesity and diabetes in the United States. JAMA 286, 1195-1200.
NAKASHIMA, H., SUZUKI, H., OHTSU, H., CHAO, J.Y., UTSUNOMIYA, H., FRANK, G.D., & EGUCHI, S. (2006). Angiotensin II regulates vascular and endothelial dysfunction: recent topics of Angiotensin II type-1 receptor signaling in the vasculature. Curr Vasc Pharmacol 4, 67-78.
NAKAYAMA, M., INOGUCHI, T., SONTA, T., MAEDA, Y., SASAKI, S., SAWADA, F., TSUBOUCHI, H., SONODA, N., KOBAYASHI, K., SUMIMOTO, H., & NAWATA, H. (2005). Increased expression of NAD(P)H oxidase in islets of animal models of Type 2 diabetes and its improvement by an AT1 receptor antagonist. Biochemical & Biophysical Research Communications 332, 927-933.
86
NASH, D.T. (1992). Comparative properties of angiotensin-converting enzyme inhibitors: relations with inhibition of tissue angiotensin-converting enzyme and potential clinical implications. Am J Cardiol 69, 26C-32C.
NAVAR, L.G. (2005). The role of the kidneys in hypertension. J Clin Hypertens (Greenwich ) 7, 542-549.
NEELS, H.M., SCHARPE, S.L., VAN SANDE, M.E., VERKERK, R.M., & VAN ACKER, K.J. (1982). Improved micromethod for assay of serum angiotensin converting enzyme. Clin Chem 28, 1352-1355.
NICKENIG, G., ROLING, J., STREHLOW, K., SCHNABEL, P., & BOHM, M. (1998). Insulin induces upregulation of vascular AT1 receptor gene expression by posttranscriptional mechanisms. Circulation 98, 2453-2460.
NIELSEN, B., GRONBAEK, H., OSTERBY, R., & FLYVBJERG, A. (2003). Effect of combination therapy with a calcium channel blocker and an angiotensin-converting enzyme inhibitor on renal hypertrophy and urinary albumin excretion in diabetic rats. Exp Diabesity Res 4, 191-199.
NISKANEN, L. & LAAKSO, M. (1993). Insulin resistance is related to albuminuria in patients with type II (non-insulin-dependent) diabetes mellitus. Metabolism 42, 1541-1545.
NYHOLM, B., FISKER, S., LUND, S., MOLLER, N., & SCHMITZ, O. (1997). Increased circulating leptin concentrations in insulin-resistant first-degree relatives of patients with non-insulin-dependent diabetes mellitus: relationship to body composition and insulin sensitivity but not to family history of non-insulin-dependent diabetes mellitus. Eur J Endocrinol 136, 173-179.
OUDIT, G.Y., KASSIRI, Z., PATEL, M.P., CHAPPELL, M., BUTANY, J., BACKX, P.H., TSUSHIMA, R.G., SCHOLEY, J.W., KHOKHA, R., & PENNINGER, J.M. (2007). Angiotensin II-mediated oxidative stress and inflammation mediate the age-dependent cardiomyopathy in ACE2 null mice. Cardiovasc Res 75, 29-39.
PARKIN, E.T., TURNER, A.J., & HOOPER, N.M. (2004). Secretase-mediated cell surface shedding of the angiotensin-converting enzyme. Protein Pept Lett 11, 423-432.
PARVING, H.H., LEHNERT, H., BROCHNER-MORTENSEN, J., GOMIS, R., ANDERSEN, S., & ARNER, P. (2001). [Effect of irbesartan on the development of diabetic nephropathy in patients with type 2 diabetes]. Ugeskr Laeger 163, 5519-5524.
PAUL, M., POYAN, M.A., & KREUTZ, R. (2006). Physiology of local renin-angiotensin systems. Physiol Rev 86, 747-803.
87

PERKINS, B.A., FICOCIELLO, L.H., OSTRANDER, B.E., SILVA, K.H., WEINBERG, J., WARRAM, J.H., & KROLEWSKI, A.S. (2007). Microalbuminuria and the risk for early progressive renal function decline in type 1 diabetes. J Am Soc Nephrol 18, 1353-1361.
PINHEIRO, S.V., SIMOES E SILVA AC, SAMPAIO, W.O., DE PAULA, R.D., MENDES, E.P., BONTEMPO, E.D., PESQUERO, J.B., WALTHER, T., ALENINA, N., BADER, M., BLEICH, M., & SANTOS, R.A. (2004). Nonpeptide AVE 0991 is an angiotensin-(1-7) receptor Mas agonist in the mouse kidney. Hypertension 44, 490-496.
RAIMONDI, L., DE, P.P., MANNUCCI, E., LONARDO, G., SARTIANI, L., BANCHELLI, G., PIRISINO, R., MUGELLI, A., & CERBAI, E. (2004). Restoration of cardiomyocyte functional properties by angiotensin II receptor blockade in diabetic rats. Diabetes 53, 1927-1933.
RAN, J., HIRANO, T., FUKUI, T., SAITO, K., KAGEYAMA, H., OKADA, K., & ADACHI, M. (2006). Angiotensin II infusion decreases plasma adiponectin level via its type 1 receptor in rats: an implication for hypertension-related insulin resistance. Metabolism 55, 478-488.
REMUZZI, A., PERICO, N., AMUCHASTEGUI, C.S., MALANCHINI, B., MAZERSKA, M., BATTAGLIA, C., BERTANI, T., & REMUZZI, G. (1993). Short- and long-term effect of angiotensin II receptor blockade in rats with experimental diabetes. J Am Soc Nephrol 4, 40-49.
REMUZZI, G. & BERTANI, T. (1998). Pathophysiology of progressive nephropathies. N Engl J Med 339, 1448-1456.
RICE, G.I., JONES, A.L., GRANT, P.J., CARTER, A.M., TURNER, A.J., & HOOPER, N.M. (2006). Circulating Activities of Angiotensin-Converting Enzyme, Its Homolog, Angiotensin-Converting Enzyme 2, and Neprilysin in a Family Study. Hypertension.
RIORDAN, J.F. (2003). Angiotensin-I-converting enzyme and its relatives. Genome Biol 4, 225.
RITZ, E. (2003). Albuminuria and vascular damage--the vicious twins. N Engl J Med 348, 2349-2352.
RODBY, R.A. (2004). Pharmacoeconomic challenges in the management of diabetic nephropathy. J Manag Care Pharm 10, S6-11.
SANVITTO, G.L., JOHREN, O., HAUSER, W., & SAAVEDRA, J.M. (1997). Water deprivation upregulates ANG II AT1 binding and mRNA in rat subfornical organ and anterior pituitary. Am J Physiol 273, E156-E163.
88

SEIKALY, M.G., ARANT, B.S., JR., & SENEY, F.D., JR. (1990). Endogenous angiotensin concentrations in specific intrarenal fluid compartments of the rat. J Clin Invest 86, 1352-1357.
SENADOR, D., KANAKAMEDALA, K., IRIGOYEN, M.C., MORRIS, M., & ELASED, K.M. (2009). Cardiovascular and autonomic phenotype of db/db diabetic mice. Exp Physiol.
SHALTOUT, H.A., WESTWOOD, B.M., AVERILL, D.B., FERRARIO, C.M., FIGUEROA, J.P., DIZ, D.I., ROSE, J.C., & CHAPPELL, M.C. (2007). Angiotensin metabolism in renal proximal tubules, urine, and serum of sheep: evidence for ACE2-dependent processing of angiotensin II. Am J Physiol Renal Physiol 292, F82-F91.
SHAO, J., IWASHITA, N., IKEDA, F., OGIHARA, T., UCHIDA, T., SHIMIZU, T., UCHINO, H., HIROSE, T., KAWAMORI, R., & WATADA, H. (2006). Beneficial effects of candesartan, an angiotensin II type 1 receptor blocker, on beta-cell function and morphology in db/db mice. Biochemical & Biophysical Research Communications 344, 1224-1233.
SHARMA, K., LEE, S., HAN, S., LEE, S., FRANCOS, B., MCCUE, P., WASSELL, R., SHAW, M.A., & RAMACHANDRARAO, S.P. (2005). Two-dimensional fluorescence difference gel electrophoresis analysis of the urine proteome in human diabetic nephropathy. Proteomics 5, 2648-2655.
SHARMA, K., MCCUE, P., & DUNN, S.R. (2003). Diabetic kidney disease in the db/db mouse. Am J Physiol Renal Physiol 284, F1138-F1144.
SKEGGS, L.T., JR., KAHN, J.R., & SHUMWAY, N.P. (1956). The preparation and function of the hypertensin-converting enzyme. J Exp Med 103, 295-299.
SOLER, M.J., WYSOCKI, J., & BATLLE, D. (2008). Angiotensin-converting enzyme 2 and the kidney. Exp Physiol 93, 549-556.
SOLER, M.J., WYSOCKI, J., YE, M., LLOVERAS, J., KANWAR, Y., & BATLLE, D. (2007). ACE2 inhibition worsens glomerular injury in association with increased ACE expression in streptozotocin-induced diabetic mice. Kidney International 72, 614-623.
SOLER, M.J., YE, M., WYSOCKI, J., WILLIAM, J., LLOVERAS, J., & BATLLE, D. (2009). Localization of ACE2 in the renal vasculature: amplification by angiotensin II type 1 receptor blockade using telmisartan. Am J Physiol Renal Physiol 296, F398-F405.
SOWERS, J.R., EPSTEIN, M., & FROHLICH, E.D. (2001). Diabetes, hypertension, and cardiovascular disease: an update. Hypertension 37, 1053-1059.
89

STUMVOLL, M., NURJHAN, N., PERRIELLO, G., DAILEY, G., & GERICH, J.E. (1995). Metabolic effects of metformin in non-insulin-dependent diabetes mellitus. N Engl J Med 333, 550-554.
SUGARU, E., NAKAGAWA, T., ONO-KISHINO, M., NAGAMINE, J., TOKUNAGA, T., KITOH, M., HUME, W.E., NAGATA, R., & TAIJI, M. (2007). Amelioration of established diabetic nephropathy by combined treatment with SMP-534 (antifibrotic agent) and losartan in db/db mice. Nephron Exp Nephrol 105, e45-e52.
SUSZTAK, K. & BOTTINGER, E.P. (2006). Diabetic nephropathy: a frontier for personalized medicine. J Am Soc Nephrol 17, 361-367.
SUSZTAK, K., RAFF, A.C., SCHIFFER, M., & BOTTINGER, E.P. (2006). Glucose-induced reactive oxygen species cause apoptosis of podocytes and podocyte depletion at the onset of diabetic nephropathy. Diabetes 55, 225-233.
TAAL, M.W. & BRENNER, B.M. (2000). Renoprotective benefits of RAS inhibition: from ACEI to angiotensin II antagonists. Kidney International 57, 1803-1817.
TAHMASEBI, M., PUDDEFOOT, J.R., INWANG, E.R., & VINSON, G.P. (1999). The tissue renin-angiotensin system in human pancreas. J Endocrinol 161, 317-322.
TIKELLIS, C., JOHNSTON, C.I., FORBES, J.M., BURNS, W.C., BURRELL, L.M., RISVANIS, J., & COOPER, M.E. (2003). Characterization of renal angiotensin-converting enzyme 2 in diabetic nephropathy. Hypertension 41, 392-397.
TIPNIS, S.R., HOOPER, N.M., HYDE, R., KARRAN, E., CHRISTIE, G., & TURNER, A.J. (2000). A human homolog of angiotensin-converting enzyme. Cloning and functional expression as a captopril-insensitive carboxypeptidase. J Biol Chem 275, 33238-33243.
TSCHOPE, C., SCHULTHEISS, H.P., & WALTHER, T. (2002). Multiple interactions between the renin-angiotensin and the kallikrein-kinin systems: role of ACE inhibition and AT1 receptor blockade. J Cardiovasc Pharmacol 39, 478-487.
VICKERS, C., HALES, P., KAUSHIK, V., DICK, L., GAVIN, J., TANG, J., GODBOUT, K., PARSONS, T., BARONAS, E., HSIEH, F., ACTON, S., PATANE, M., NICHOLS, A., & TUMMINO, P. (2002). Hydrolysis of biological peptides by human angiotensin-converting enzyme-related carboxypeptidase. J Biol Chem 277, 14838-14843.
WAKAHARA, S., KONOSHITA, T., MIZUNO, S., MOTOMURA, M., AOYAMA, C., MAKINO, Y., KATO, N., KONI, I., & MIYAMORI, I. (2007). Synergistic expression of
90

angiotensin-converting enzyme (ACE) and ACE2 in human renal tissue and confounding effects of hypertension on the ACE to ACE2 ratio. Endocrinology 148, 2453-2457.
WANG, D.H., DU, Y., ZHAO, H., GRANGER, J.P., SPETH, R.C., & DIPETTE, D.J. (1997). Regulation of angiotensin type 1 receptor and its gene expression: role in renal growth. J Am Soc Nephrol 8, 193-198.
WANG, G., LAI, F.M., LAI, K.B., CHOW, K.M., KWAN, C.H., LI, K.T., & SZETO, C.C. (2008). Urinary mRNA expression of ACE and ACE2 in human type 2 diabetic nephropathy. Diabetologia 51, 1062-1067.
WARNER, F.J., LEW, R.A., SMITH, A.I., LAMBERT, D.W., HOOPER, N.M., & TURNER, A.J. (2005). Angiotensin-converting enzyme 2 (ACE2), but not ACE, is preferentially localized to the apical surface of polarized kidney cells. J Biol Chem 280, 39353-39362.
WATANABE, T., BARKER, T.A., & BERK, B.C. (2005). Angiotensin II and the endothelium: diverse signals and effects. Hypertension 45, 163-169.
WAUTIER, J.L. & SCHMIDT, A.M. (2004). Protein glycation: a firm link to endothelial cell dysfunction. Circulation Research 95, 233-238.
WEI, S.G., YU, Y., ZHANG, Z.H., & FELDER, R.B. (2009). Angiotensin II Upregulates Hypothalamic AT1 Receptor Expression in Rats via the Mitogen-Activated Protein Kinase Pathway. Am J Physiol Heart Circ Physiol.
WHALEY-CONNELL, A.T., CHOWDHURY, N.A., HAYDEN, M.R., STUMP, C.S., HABIBI, J., WIEDMEYER, C.E., GALLAGHER, P.E., TALLANT, E.A., COOPER, S.A., LINK, C.D., FERRARIO, C., & SOWERS, J.R. (2006). Oxidative stress and glomerular filtration barrier injury: role of the renin-angiotensin system in the Ren2 transgenic rat. Am J Physiol Renal Physiol 291, F1308-F1314.
WILD, S., ROGLIC, G., GREEN, A., SICREE, R., & KING, H. (2004). Global prevalence of diabetes: estimates for the year 2000 and projections for 2030. Diabetes Care 27, 1047-1053.
WYSOCKI, J., YE, M., SOLER, M.J., GURLEY, S.B., XIAO, H.D., BERNSTEIN, K.E., COFFMAN, T.M., CHEN, S., & BATLLE, D. (2006). ACE and ACE2 Activity in Diabetic Mice. Diabetes 55, 2132-2139.
XIA, H., FENG, Y., OBR, T.D., HICKMAN, P.J., & LAZARTIGUES, E. (2009). Angiotensin II type 1 receptor-mediated reduction of angiotensin-converting enzyme 2 activity in the brain impairs baroreflex function in hypertensive mice. Hypertension 53, 210-216.
91

92
YANG, R., YANG, B., WEN, Y., FANG, F., CUI, S., LIN, G., SUN, Z., WANG, R., & DAI, Y. (2009). Losartan, an Angiotensin type I receptor, restores erectile function by downregulation of cavernous renin-angiotensin system in streptozocin-induced diabetic rats. J Sex Med 6, 696-707.
YE, M., WYSOCKI, J., NAAZ, P., SALABAT, M.R., LAPOINTE, M.S., & BATLLE, D. (2004). Increased ACE 2 and decreased ACE protein in renal tubules from diabetic mice: a renoprotective combination? Hypertension 43, 1120-1125.
YE, M., WYSOCKI, J., WILLIAM, J., SOLER, M.J., COKIC, I., & BATLLE, D. (2006). Glomerular localization and expression of Angiotensin-converting enzyme 2 and Angiotensin-converting enzyme: implications for albuminuria in diabetes. J Am Soc Nephrol 17, 3067-3075.
YUSUF, S., OSTERGREN, J.B., GERSTEIN, H.C., PFEFFER, M.A., SWEDBERG, K., GRANGER, C.B., OLOFSSON, B., PROBSTFIELD, J., & MCMURRAY, J.V. (2005). Effects of candesartan on the development of a new diagnosis of diabetes mellitus in patients with heart failure. Circulation 112, 48-53.
ZANDBERGEN, A.A., BAGGEN, M.G., LAMBERTS, S.W., BOOTSMA, A.H., DE, Z.D., & OUWENDIJK, R.J. (2003). Effect of losartan on microalbuminuria in normotensive patients with type 2 diabetes mellitus. A randomized clinical trial. Ann Intern Med 139, 90-96.
ZOU, Y., AKAZAWA, H., QIN, Y., SANO, M., TAKANO, H., MINAMINO, T., MAKITA, N., IWANAGA, K., ZHU, W., KUDOH, S., TOKO, H., TAMURA, K., KIHARA, M., NAGAI, T., FUKAMIZU, A., UMEMURA, S., IIRI, T., FUJITA, T., & KOMURO, I. (2004). Mechanical stress activates angiotensin II type 1 receptor without the involvement of angiotensin II. Nat Cell Biol 6, 499-506.