impact of energy efficiency provisions in the american ... · energy efficiency in the american...
TRANSCRIPT
Energy Efficiency in the
American Clean Energy and Security Act of 2009: Impacts of Current Provisions and
Opportunities to Enhance the Legislation
Rachel Gold, Laura Furrey, Steven Nadel, John “Skip” Laitner, and R. Neal Elliott
September 2009
ACEEE Report E096
© American Council for an Energy-Efficient Economy 529 14th Street, N.W., Suite 600, Washington, D.C. 20045
(202) 507-4000 phone, (202) 429-2248 fax, www.aceee.org

EE in ACES, ACEEE
CONTENTS Acknowledgments....................................................................................................................................................... ii About the American Council for an Energy-Efficient Economy (ACEEE) .................................................................. ii Abstract...................................................................................................................................................................... iii Introduction ................................................................................................................................................................ 1 Estimated Economic, Energy, and Carbon Savings from Energy Efficiency Provisions........................................... 2
National-Level Results ........................................................................................................................................... 2 State-Level Results ................................................................................................................................................ 9 Methodology......................................................................................................................................................... 10
Conclusions ............................................................................................................................................................. 11 References .............................................................................................................................................................. 13 Appendix A. Detailed National Results of Energy Efficiency Provisions in ACES, as Passed by House, and with
Proposed Enhancements..................................................................................................................................... 17 Appendix B. Detailed State-by-State Results of Energy Efficiency Provisions in ACES, as Passed by House and
with Enhancements.............................................................................................................................................. 19 Appendix C. Descriptions of Energy Efficiency Provisions in ACES as Passed by the House............................... 21 Appendix D. Methodology for the Assessment of Energy Efficiency Provisions in ACES...................................... 25
Introduction .......................................................................................................................................................... 25 Methodology......................................................................................................................................................... 25 Federal Legislative Scoring Methodology............................................................................................................ 26 Job Creation Impacts ........................................................................................................................................... 33 Allocation of Fuel Savings to States .................................................................................................................... 34
i

EE in ACES, ACEEE
ACKNOWLEDGMENTS The authors express appreciation to the Energy Foundation for its support that made this study possible. In addition, they acknowledge the important contributions by their ACEEE colleagues Therese Langer, Suzanne Watson, Glee Murray, and Maggie Eldridge. We also appreciate the patience and attention to detail of our editor Renee Nida, and Michael Sciortino’s assistance in creating the Web site. Many of our colleagues within the NGO community also provided important reviews, comments, suggestions, and encouragement. Among them are Maggie Duncan and Allen Rosenfeld of M+R Strategic Services, Rob Sargent and Sean Garren of Environment America, Ryan Hodum of David Gardiner & Associates, LLC, Anna Pavlova and Mark Wagner of Johnson Controls, and Jennifer Schafer of Cascade Associates. Their assistance in framing the results was invaluable. ABOUT THE AMERICAN COUNCIL FOR AN ENERGY-EFFICIENT ECONOMY (ACEEE) ACEEE is a nonprofit organization dedicated to advancing energy efficiency as a means of promoting economic prosperity, energy security, and environmental protection. For more information, see www.aceee.org. ACEEE fulfills its mission by:
• Conducting in-depth technical and policy assessments • Advising policymakers and program managers • Working collaboratively with businesses, public interest groups, and other organizations • Organizing conferences and workshops • Publishing books, conference proceedings, and reports • Educating consumers and businesses
Projects are carried out by staff and selected energy efficiency experts from universities, national laboratories, and the private sector. Collaboration is key to ACEEE's success. We collaborate on projects and initiatives with dozens of organizations including federal and state agencies, utilities, research institutions, businesses, and public interest groups. Support for our work comes from a broad range of foundations, governmental organizations, research institutes, utilities, and corporations.
ii
EE in ACES, ACEEE
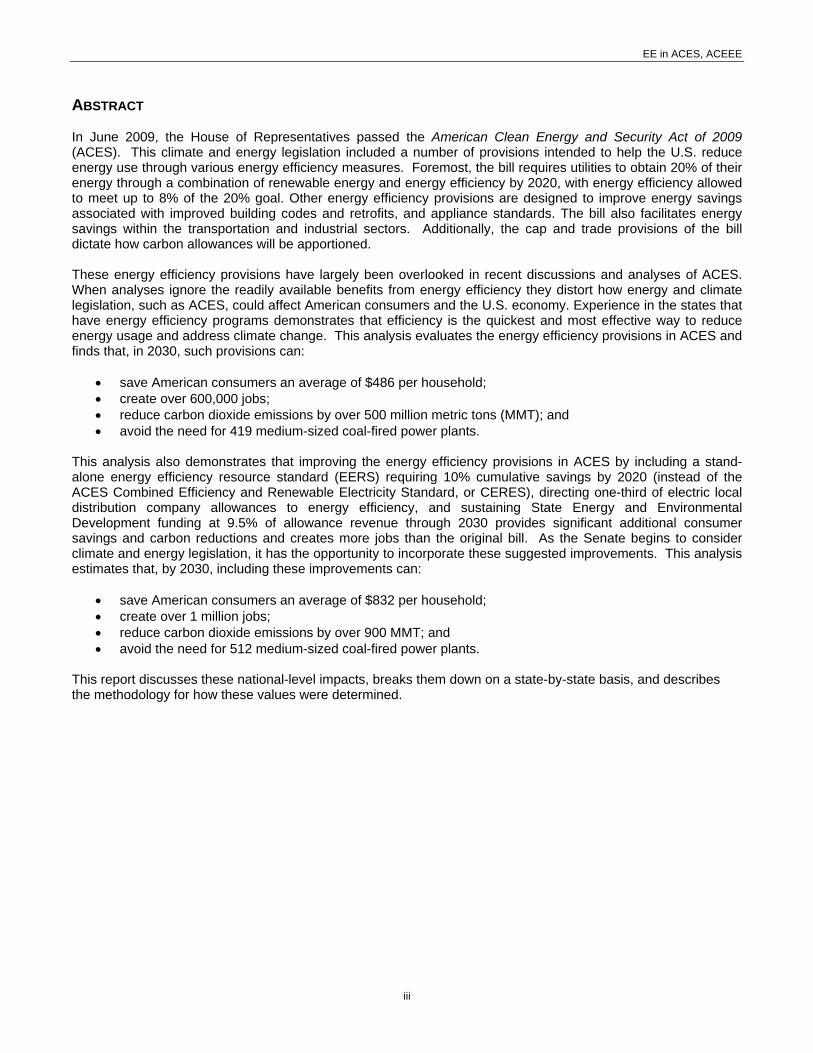
ABSTRACT In June 2009, the House of Representatives passed the American Clean Energy and Security Act of 2009 (ACES). This climate and energy legislation included a number of provisions intended to help the U.S. reduce energy use through various energy efficiency measures. Foremost, the bill requires utilities to obtain 20% of their energy through a combination of renewable energy and energy efficiency by 2020, with energy efficiency allowed to meet up to 8% of the 20% goal. Other energy efficiency provisions are designed to improve energy savings associated with improved building codes and retrofits, and appliance standards. The bill also facilitates energy savings within the transportation and industrial sectors. Additionally, the cap and trade provisions of the bill dictate how carbon allowances will be apportioned. These energy efficiency provisions have largely been overlooked in recent discussions and analyses of ACES. When analyses ignore the readily available benefits from energy efficiency they distort how energy and climate legislation, such as ACES, could affect American consumers and the U.S. economy. Experience in the states that have energy efficiency programs demonstrates that efficiency is the quickest and most effective way to reduce energy usage and address climate change. This analysis evaluates the energy efficiency provisions in ACES and finds that, in 2030, such provisions can:
• save American consumers an average of $486 per household; • create over 600,000 jobs; • reduce carbon dioxide emissions by over 500 million metric tons (MMT); and • avoid the need for 419 medium-sized coal-fired power plants.
This analysis also demonstrates that improving the energy efficiency provisions in ACES by including a stand-alone energy efficiency resource standard (EERS) requiring 10% cumulative savings by 2020 (instead of the ACES Combined Efficiency and Renewable Electricity Standard, or CERES), directing one-third of electric local distribution company allowances to energy efficiency, and sustaining State Energy and Environmental Development funding at 9.5% of allowance revenue through 2030 provides significant additional consumer savings and carbon reductions and creates more jobs than the original bill. As the Senate begins to consider climate and energy legislation, it has the opportunity to incorporate these suggested improvements. This analysis estimates that, by 2030, including these improvements can:
• save American consumers an average of $832 per household; • create over 1 million jobs; • reduce carbon dioxide emissions by over 900 MMT; and • avoid the need for 512 medium-sized coal-fired power plants.
This report discusses these national-level impacts, breaks them down on a state-by-state basis, and describes the methodology for how these values were determined.
iii

EE in ACES, ACEEE
iv
EE in ACES, ACEEE
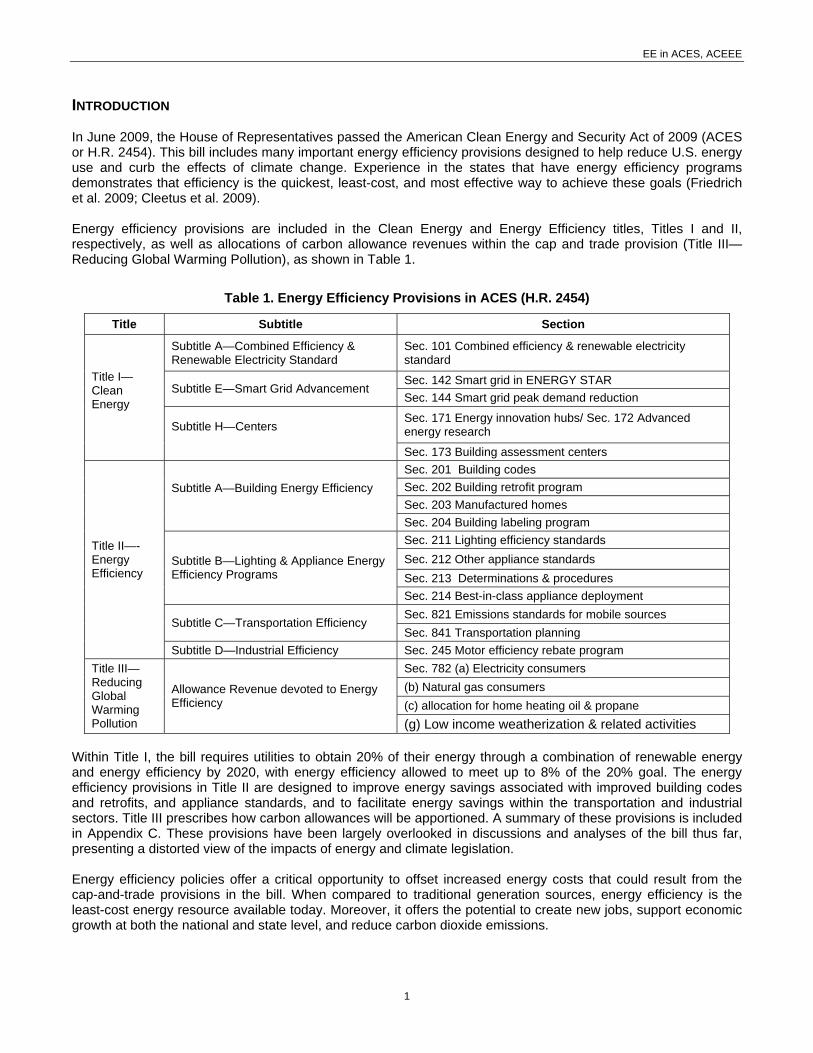
INTRODUCTION In June 2009, the House of Representatives passed the American Clean Energy and Security Act of 2009 (ACES or H.R. 2454). This bill includes many important energy efficiency provisions designed to help reduce U.S. energy use and curb the effects of climate change. Experience in the states that have energy efficiency programs demonstrates that efficiency is the quickest, least-cost, and most effective way to achieve these goals (Friedrich et al. 2009; Cleetus et al. 2009). Energy efficiency provisions are included in the Clean Energy and Energy Efficiency titles, Titles I and II, respectively, as well as allocations of carbon allowance revenues within the cap and trade provision (Title III—Reducing Global Warming Pollution), as shown in Table 1.
Table 1. Energy Efficiency Provisions in ACES (H.R. 2454)
Title Subtitle Section
Subtitle A—Combined Efficiency & Renewable Electricity Standard
Sec. 101 Combined efficiency & renewable electricity standard
Sec. 142 Smart grid in ENERGY STAR Subtitle E—Smart Grid Advancement
Sec. 144 Smart grid peak demand reduction
Sec. 171 Energy innovation hubs/ Sec. 172 Advanced energy research
Title I— Clean Energy
Subtitle H—Centers
Sec. 173 Building assessment centers Sec. 201 Building codes Sec. 202 Building retrofit program Sec. 203 Manufactured homes
Subtitle A—Building Energy Efficiency Sec. 204 Building labeling program
Sec. 211 Lighting efficiency standards Sec. 212 Other appliance standards Sec. 213 Determinations & procedures
Subtitle B—Lighting & Appliance Energy Efficiency Programs
Sec. 214 Best-in-class appliance deployment Sec. 821 Emissions standards for mobile sources
Subtitle C—Transportation Efficiency Sec. 841 Transportation planning
Title II—- Energy Efficiency
Subtitle D—Industrial Efficiency Sec. 245 Motor efficiency rebate program Sec. 782 (a) Electricity consumers (b) Natural gas consumers (c) allocation for home heating oil & propane
Title III— Reducing Global Warming Pollution
Allowance Revenue devoted to Energy Efficiency
(g) Low income weatherization & related activities Within Title I, the bill requires utilities to obtain 20% of their energy through a combination of renewable energy and energy efficiency by 2020, with energy efficiency allowed to meet up to 8% of the 20% goal. The energy efficiency provisions in Title II are designed to improve energy savings associated with improved building codes and retrofits, and appliance standards, and to facilitate energy savings within the transportation and industrial sectors. Title III prescribes how carbon allowances will be apportioned. A summary of these provisions is included in Appendix C. These provisions have been largely overlooked in discussions and analyses of the bill thus far, presenting a distorted view of the impacts of energy and climate legislation. Energy efficiency policies offer a critical opportunity to offset increased energy costs that could result from the cap-and-trade provisions in the bill. When compared to traditional generation sources, energy efficiency is the least-cost energy resource available today. Moreover, it offers the potential to create new jobs, support economic growth at both the national and state level, and reduce carbon dioxide emissions.
1
EE in ACES, ACEEE
This report presents the results of an assessment of the energy efficiency provisions in ACES in terms of:
• energy savings, • net consumer savings, • net jobs created, and • carbon dioxide emissions reductions.
We provide these figures at the national level, and estimate these impacts for each of the 50 states and the District of Columbia (DC). As the Senate begins to consider energy and climate legislation, it has the opportunity to significantly improve upon the work done in the House and expand the economic benefits associated with energy efficiency and further offset the costs of cap and trade legislation. In this analysis, we also estimate the additional benefits that would result from the following enhancements to three key energy efficiency provisions: • Modify the Combined Efficiency and Renewable Electricity Standard in Section 101 to be a stand-alone
renewable electricity standard and a stand-alone cumulative 10% energy efficiency resource standard in 2020. The level of electricity savings required under the EERS would begin at 0.75% of the 2 prior years’ sales in 2012 and slowly ramp up to 1.5% savings in 2020. The standard is expressed in cumulative terms (10%) because efficiency measures installed in early years will continue to save energy throughout the compliance period such that total energy savings in 2020 will be 10% of 2018 and 2019 sales. This proposed increase in energy efficiency targets is exclusive of building codes and appliance standards, and does not allow for interstate trading of energy efficiency savings.
• Require that one-third of the free credits allocated to electric local distribution companies (LDCs) are directed to energy efficiency similar to the manner in which one-third of natural gas credit allocations are devoted to energy efficiency in Section 782(b). ACES does not specify how the electric LDC allocation is to be spent.
• Extend the allocation of allowance revenue to the State Energy and Environmental Development fund. ACES ramps down SEED fund spending beginning in 2016, and we explore the potential benefits of maintaining the 9.5% allocation out to 2030. A billion dollars per year of these extra funds would be allocated to transportation planning, with the rest funding a variety of different types of building retrofits.1
The results of including the improvements in the legislation, as outlined, are hereinafter referred to collectively as “Enhanced ACES” as the energy savings are added to the provisions of the House-passed bill as detailed in Table 1. ESTIMATED ECONOMIC, ENERGY, AND CARBON SAVINGS FROM ENERGY EFFICIENCY PROVISIONS ACEEE has estimated the impacts of these energy efficiency provisions using analysis tools developed over the years for different sectors and types of provisions. During the past decade, ACEEE has become recognized for providing estimates of the impacts of energy efficiency provisions in federal energy legislation (Nadel et al. 2005, Geller et al. 1992). We brought these tools together in an Excel-based model that allows for:
• individual assessments of each provision and various changes to the provisions; • projection of national and state level energy and CO2 emissions reductions; and • estimation of macroeconomic and employment impacts.
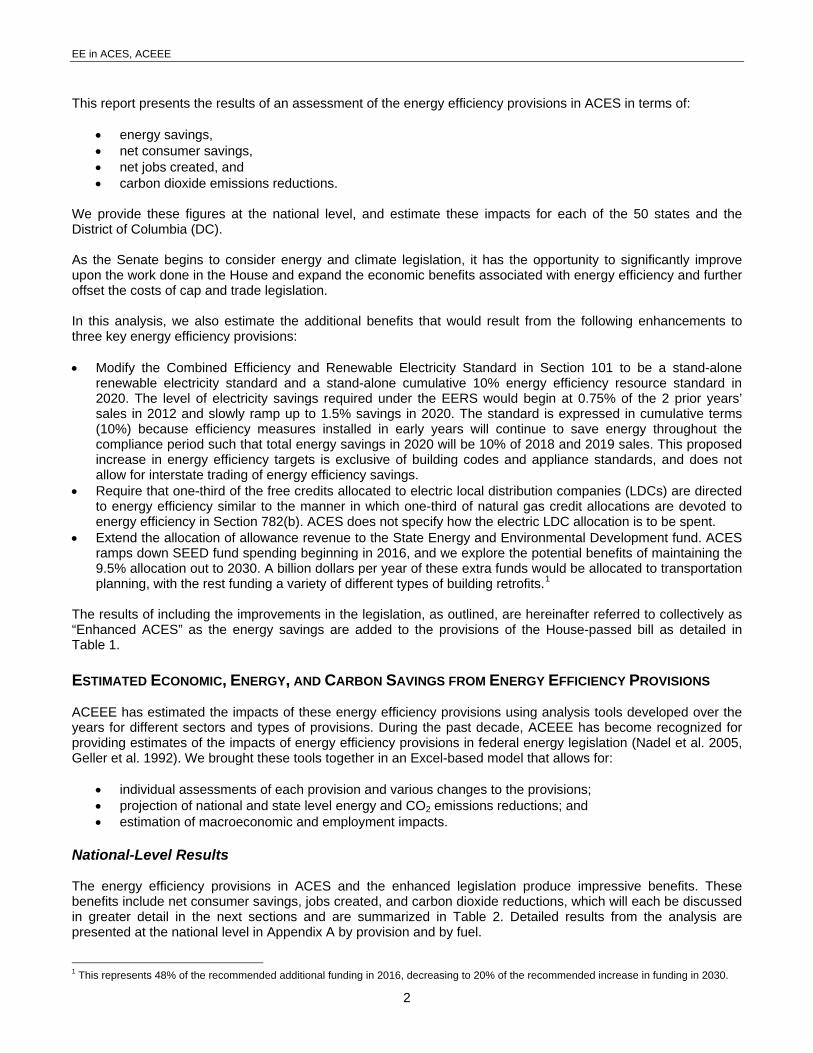
National-Level Results The energy efficiency provisions in ACES and the enhanced legislation produce impressive benefits. These benefits include net consumer savings, jobs created, and carbon dioxide reductions, which will each be discussed in greater detail in the next sections and are summarized in Table 2. Detailed results from the analysis are presented at the national level in Appendix A by provision and by fuel.
1 This represents 48% of the recommended additional funding in 2016, decreasing to 20% of the recommended increase in funding in 2030.
2
EE in ACES, ACEEE
Table 2. ACEEE Estimates of Benefits from Energy Efficiency in ACES
2020 2030
ACES Enhanced
ACES ACES Enhanced
ACES Net jobs created 383,800 569,200 607,200 1,035,500Net annual consumer savings to U.S. economy (in 2007$ billion) $30 $38 $62 $105
Net annual consumer savings per household (in 2007$) $215 $283 $486 $832
CO2 emissions avoided (MMT) 296 480 506 959Equivalent autos taken off the road as a result of avoided CO2 emissions (for given year)2
49,000,000 80,000,000 85,000,000
159,000,000
Equivalent number of 300 MW power plants avoided 253 513 419 1,023
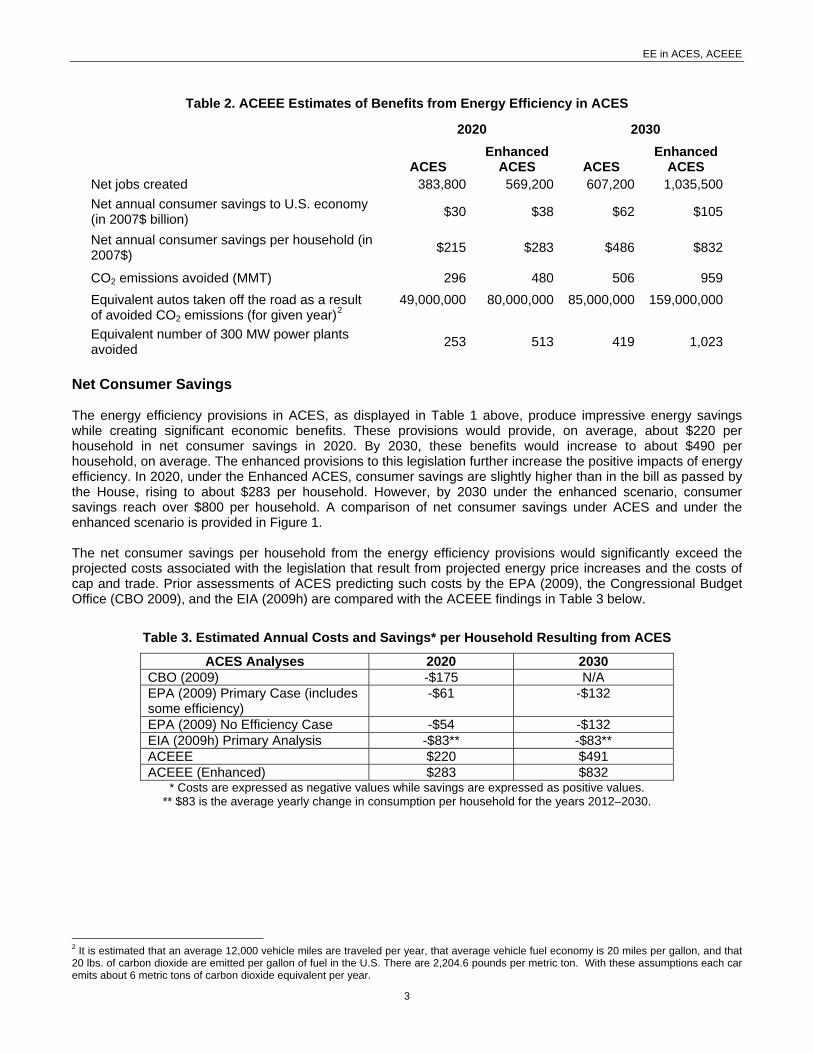
Net Consumer Savings The energy efficiency provisions in ACES, as displayed in Table 1 above, produce impressive energy savings while creating significant economic benefits. These provisions would provide, on average, about $220 per household in net consumer savings in 2020. By 2030, these benefits would increase to about $490 per household, on average. The enhanced provisions to this legislation further increase the positive impacts of energy efficiency. In 2020, under the Enhanced ACES, consumer savings are slightly higher than in the bill as passed by the House, rising to about $283 per household. However, by 2030 under the enhanced scenario, consumer savings reach over $800 per household. A comparison of net consumer savings under ACES and under the enhanced scenario is provided in Figure 1. The net consumer savings per household from the energy efficiency provisions would significantly exceed the projected costs associated with the legislation that result from projected energy price increases and the costs of cap and trade. Prior assessments of ACES predicting such costs by the EPA (2009), the Congressional Budget Office (CBO 2009), and the EIA (2009h) are compared with the ACEEE findings in Table 3 below.
Table 3. Estimated Annual Costs and Savings* per Household Resulting from ACES
ACES Analyses 2020 2030 CBO (2009) -$175 N/A EPA (2009) Primary Case (includes some efficiency)
-$61 -$132
EPA (2009) No Efficiency Case -$54 -$132 EIA (2009h) Primary Analysis -$83** -$83** ACEEE $220 $491 ACEEE (Enhanced) $283 $832
* Costs are expressed as negative values while savings are expressed as positive values. ** $83 is the average yearly change in consumption per household for the years 2012–2030.
2 It is estimated that an average 12,000 vehicle miles are traveled per year, that average vehicle fuel economy is 20 miles per gallon, and that 20 lbs. of carbon dioxide are emitted per gallon of fuel in the U.S. There are 2,204.6 pounds per metric ton. With these assumptions each car emits about 6 metric tons of carbon dioxide equivalent per year.
3
EE in ACES, ACEEE
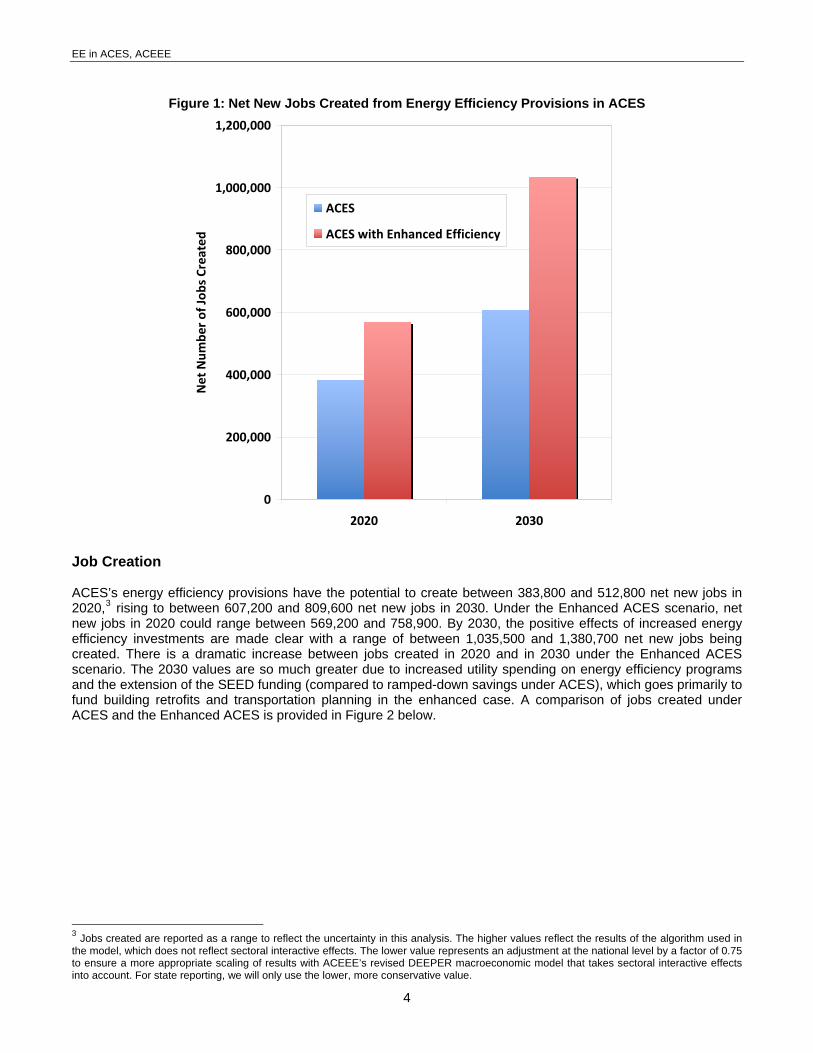
Figure 1: Net New Jobs Created from Energy Efficiency Provisions in ACES
0
200,000
400,000
600,000
800,000
1,000,000
1,200,000
2020 2030
Net Num
ber of Jo
bs Created
ACES
ACES with Enhanced Efficiency
Job Creation ACES’s energy efficiency provisions have the potential to create between 383,800 and 512,800 net new jobs in 2020,3 rising to between 607,200 and 809,600 net new jobs in 2030. Under the Enhanced ACES scenario, net new jobs in 2020 could range between 569,200 and 758,900. By 2030, the positive effects of increased energy efficiency investments are made clear with a range of between 1,035,500 and 1,380,700 net new jobs being created. There is a dramatic increase between jobs created in 2020 and in 2030 under the Enhanced ACES scenario. The 2030 values are so much greater due to increased utility spending on energy efficiency programs and the extension of the SEED funding (compared to ramped-down savings under ACES), which goes primarily to fund building retrofits and transportation planning in the enhanced case. A comparison of jobs created under ACES and the Enhanced ACES is provided in Figure 2 below.
3 Jobs created are reported as a range to reflect the uncertainty in this analysis. The higher values reflect the results of the algorithm used in the model, which does not reflect sectoral interactive effects. The lower value represents an adjustment at the national level by a factor of 0.75 to ensure a more appropriate scaling of results with ACEEE’s revised DEEPER macroeconomic model that takes sectoral interactive effects into account. For state reporting, we will only use the lower, more conservative value.
4

EE in ACES, ACEEE
Figure 2. Net Consumer Household Savings from Energy Efficiency Provisions in ACES
$‐
$100
$200
$300
$400
$500
$600
$700
$800
$900
2020 2030
Net Ann
ual Con
sumer Savings (in $/ho
useh
old)
ACES
ACES with Enhanced Efficiency
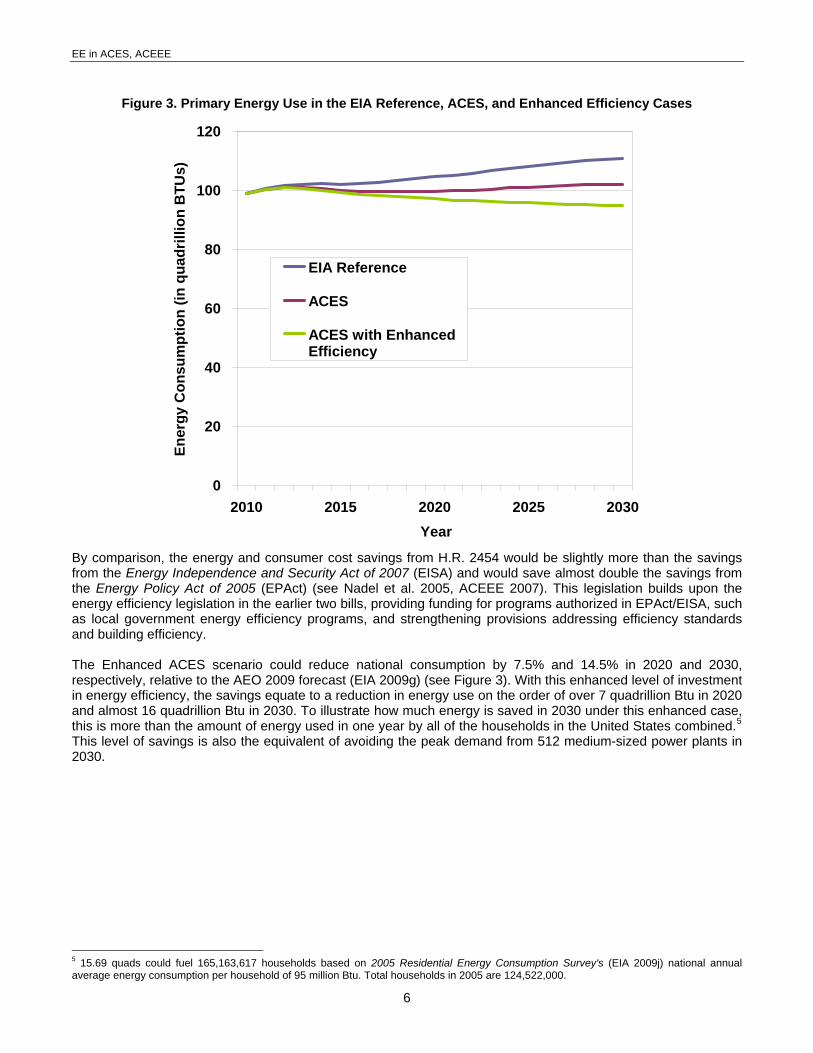
Energy Savings The energy savings from ACES’s energy efficiency provisions would reduce national consumption by 4.6% and 8.0% in 2020 and 2030, respectively, relative to the Annual Energy Outlook (AEO) 2009 forecast (EIA 2009g) (see Figure 3). In total, the existing energy efficiency provisions in ACES could reduce U.S. energy use by 4.9 quadrillion Btu, which accounts for about 4.6% of projected U.S. energy use in 2020. This 4.6% savings in 2020 is about the same as what EPA estimated in a June 23, 2009 analysis.4 This amount of energy saved is more than the annual energy use of 47 of the 50 states, including New York State. By 2030, this level of energy savings increases to 7.66 quads. The 2030 electricity savings in ACES are the equivalent of displacing the peak demand from 419 medium-sized power plants (with a capacity of 300 MW).
4 The U.S. Environmental Protection Agency's Analysis of H.R. 2454 in the 111th Congress, the American Clean Energy and Security Act of 2009. June 2009.
5
EE in ACES, ACEEE
Figure 3. Primary Energy Use in the EIA Reference, ACES, and Enhanced Efficiency Cases
0
20
40
60
80
100
120
2010 2015 2020 2025 2030Year
Ener
gy C
onsu
mpt
ion
(in q
uadr
illio
n B
TUs)
EIA Reference
ACES
ACES with EnhancedEfficiency
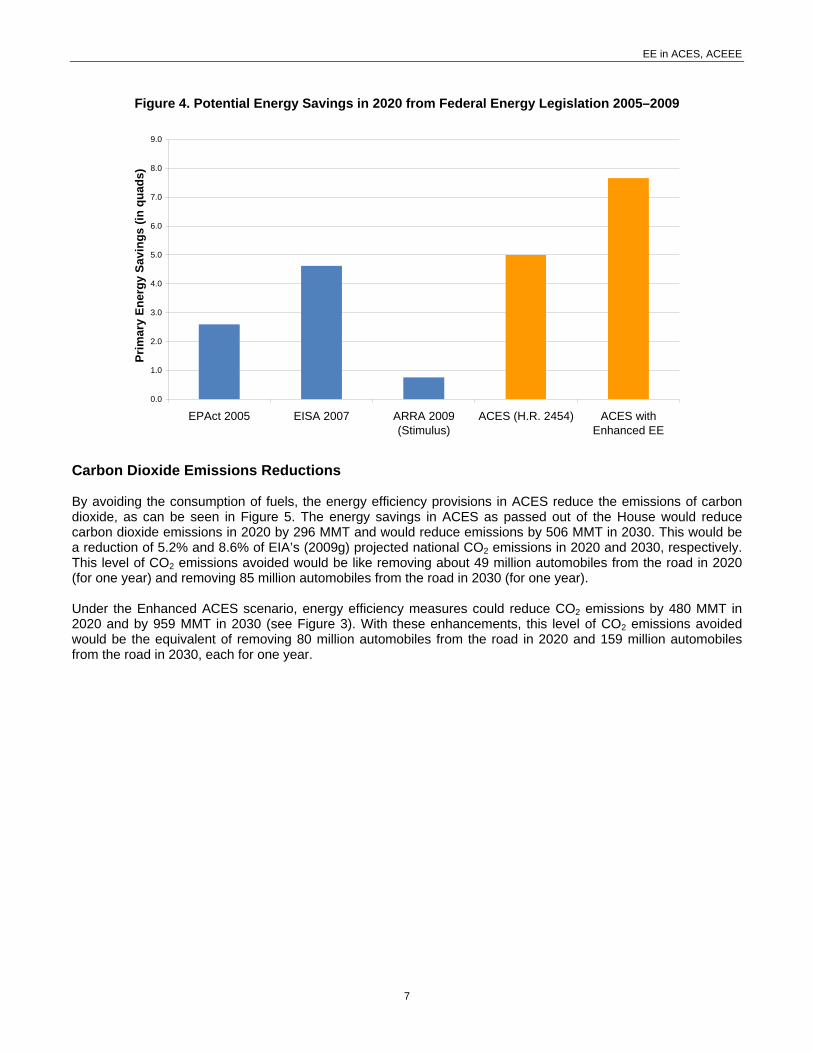
By comparison, the energy and consumer cost savings from H.R. 2454 would be slightly more than the savings from the Energy Independence and Security Act of 2007 (EISA) and would save almost double the savings from the Energy Policy Act of 2005 (EPAct) (see Nadel et al. 2005, ACEEE 2007). This legislation builds upon the energy efficiency legislation in the earlier two bills, providing funding for programs authorized in EPAct/EISA, such as local government energy efficiency programs, and strengthening provisions addressing efficiency standards and building efficiency. The Enhanced ACES scenario could reduce national consumption by 7.5% and 14.5% in 2020 and 2030, respectively, relative to the AEO 2009 forecast (EIA 2009g) (see Figure 3). With this enhanced level of investment in energy efficiency, the savings equate to a reduction in energy use on the order of over 7 quadrillion Btu in 2020 and almost 16 quadrillion Btu in 2030. To illustrate how much energy is saved in 2030 under this enhanced case, this is more than the amount of energy used in one year by all of the households in the United States combined.5 This level of savings is also the equivalent of avoiding the peak demand from 512 medium-sized power plants in 2030.
5 15.69 quads could fuel 165,163,617 households based on 2005 Residential Energy Consumption Survey's (EIA 2009j) national annual average energy consumption per household of 95 million Btu. Total households in 2005 are 124,522,000.
6
EE in ACES, ACEEE
Figure 4. Potential Energy Savings in 2020 from Federal Energy Legislation 2005–2009
0.0
1.0
2.0
3.0
4.0
5.0
6.0
7.0
8.0
9.0
EPAct 2005 EISA 2007 ARRA 2009(Stimulus)
ACES (H.R. 2454) ACES withEnhanced EE
Prim
ary
Ener
gy S
avin
gs (i
n qu
ads)
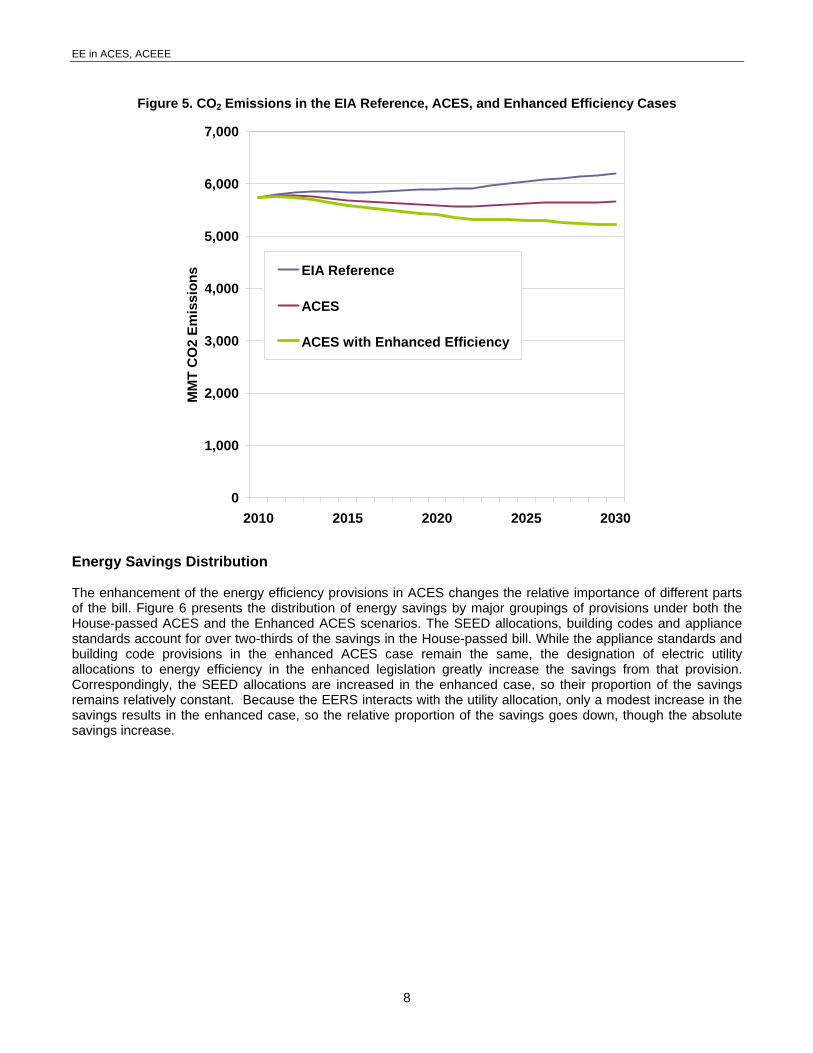
Carbon Dioxide Emissions Reductions By avoiding the consumption of fuels, the energy efficiency provisions in ACES reduce the emissions of carbon dioxide, as can be seen in Figure 5. The energy savings in ACES as passed out of the House would reduce carbon dioxide emissions in 2020 by 296 MMT and would reduce emissions by 506 MMT in 2030. This would be a reduction of 5.2% and 8.6% of EIA’s (2009g) projected national CO2 emissions in 2020 and 2030, respectively. This level of CO2 emissions avoided would be like removing about 49 million automobiles from the road in 2020 (for one year) and removing 85 million automobiles from the road in 2030 (for one year). Under the Enhanced ACES scenario, energy efficiency measures could reduce CO2 emissions by 480 MMT in 2020 and by 959 MMT in 2030 (see Figure 3). With these enhancements, this level of CO2 emissions avoided would be the equivalent of removing 80 million automobiles from the road in 2020 and 159 million automobiles from the road in 2030, each for one year.
7
EE in ACES, ACEEE
Figure 5. CO2 Emissions in the EIA Reference, ACES, and Enhanced Efficiency Cases
0
1,000
2,000
3,000
4,000
5,000
6,000
7,000
2010 2015 2020 2025 2030
MM
T C
O2
Emis
sion
s EIA Reference
ACES
ACES with Enhanced Efficiency
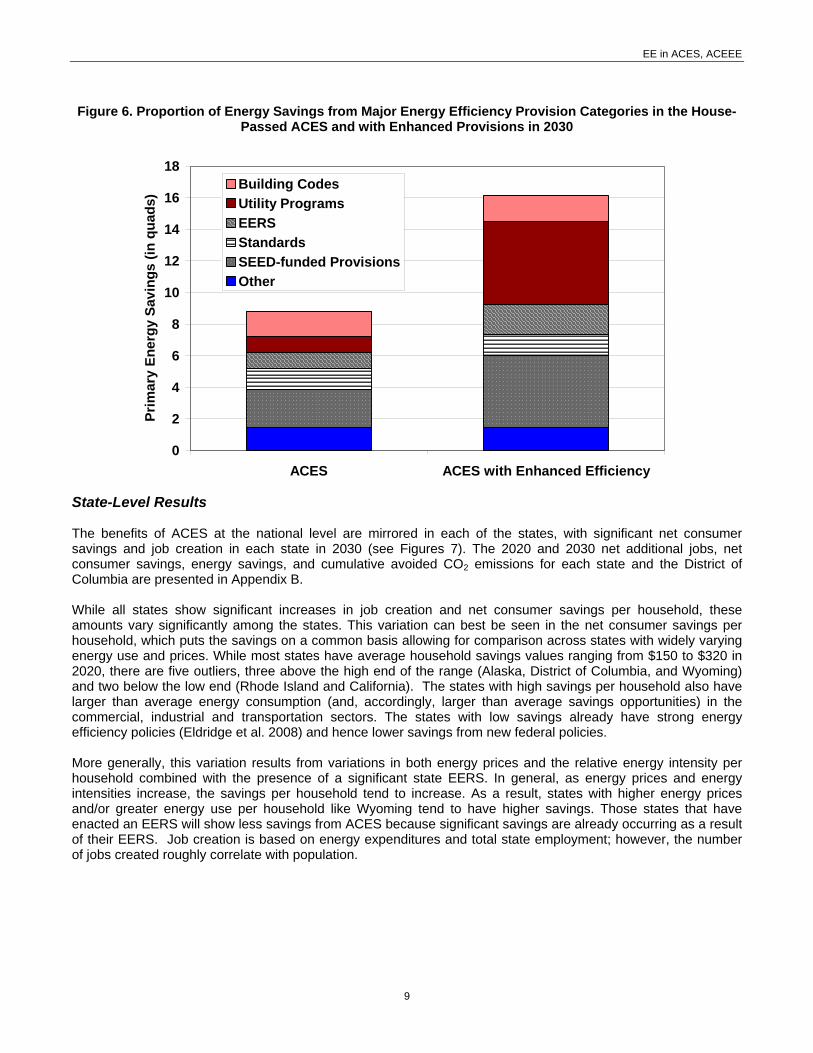
Energy Savings Distribution The enhancement of the energy efficiency provisions in ACES changes the relative importance of different parts of the bill. Figure 6 presents the distribution of energy savings by major groupings of provisions under both the House-passed ACES and the Enhanced ACES scenarios. The SEED allocations, building codes and appliance standards account for over two-thirds of the savings in the House-passed bill. While the appliance standards and building code provisions in the enhanced ACES case remain the same, the designation of electric utility allocations to energy efficiency in the enhanced legislation greatly increase the savings from that provision. Correspondingly, the SEED allocations are increased in the enhanced case, so their proportion of the savings remains relatively constant. Because the EERS interacts with the utility allocation, only a modest increase in the savings results in the enhanced case, so the relative proportion of the savings goes down, though the absolute savings increase.
8
EE in ACES, ACEEE
Figure 6. Proportion of Energy Savings from Major Energy Efficiency Provision Categories in the House-Passed ACES and with Enhanced Provisions in 2030
0
2
4
6
8
10
12
14
16
18
ACES ACES with Enhanced Efficiency
Prim
ary
Ener
gy S
avin
gs (i
n qu
ads)
Building CodesUtility ProgramsEERSStandardsSEED-funded ProvisionsOther
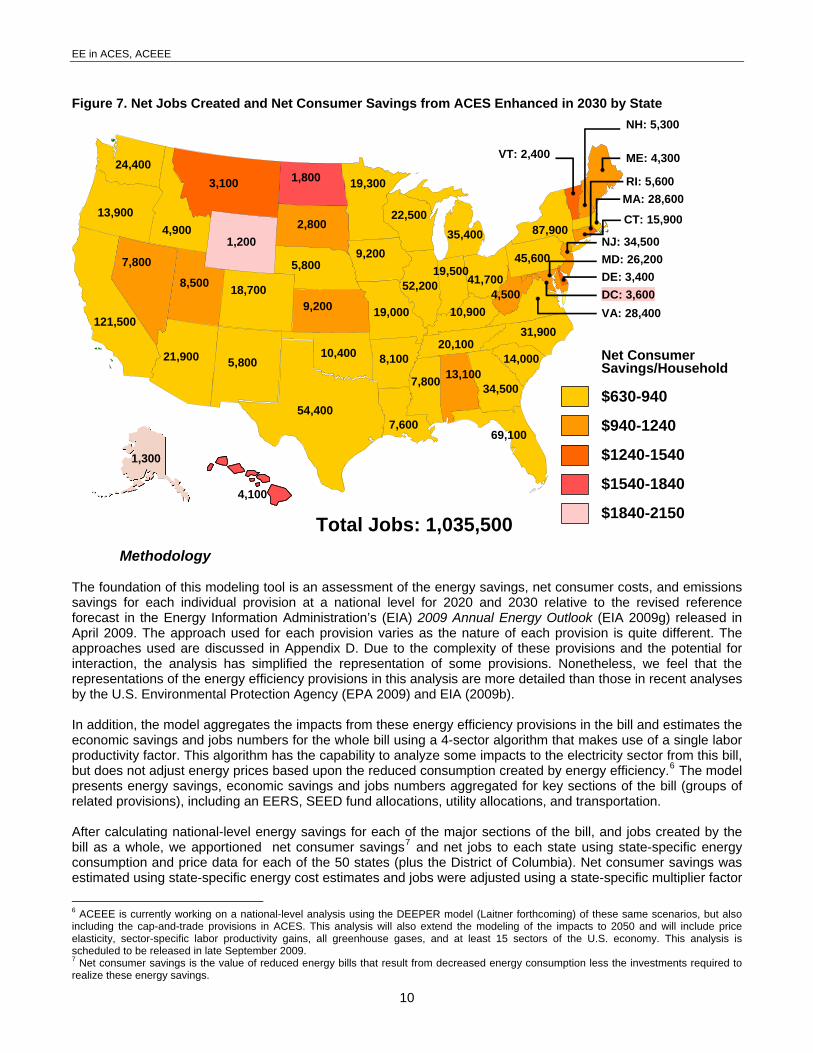
State-Level Results The benefits of ACES at the national level are mirrored in each of the states, with significant net consumer savings and job creation in each state in 2030 (see Figures 7). The 2020 and 2030 net additional jobs, net consumer savings, energy savings, and cumulative avoided CO2 emissions for each state and the District of Columbia are presented in Appendix B. While all states show significant increases in job creation and net consumer savings per household, these amounts vary significantly among the states. This variation can best be seen in the net consumer savings per household, which puts the savings on a common basis allowing for comparison across states with widely varying energy use and prices. While most states have average household savings values ranging from $150 to $320 in 2020, there are five outliers, three above the high end of the range (Alaska, District of Columbia, and Wyoming) and two below the low end (Rhode Island and California). The states with high savings per household also have larger than average energy consumption (and, accordingly, larger than average savings opportunities) in the commercial, industrial and transportation sectors. The states with low savings already have strong energy efficiency policies (Eldridge et al. 2008) and hence lower savings from new federal policies. More generally, this variation results from variations in both energy prices and the relative energy intensity per household combined with the presence of a significant state EERS. In general, as energy prices and energy intensities increase, the savings per household tend to increase. As a result, states with higher energy prices and/or greater energy use per household like Wyoming tend to have higher savings. Those states that have enacted an EERS will show less savings from ACES because significant savings are already occurring as a result of their EERS. Job creation is based on energy expenditures and total state employment; however, the number of jobs created roughly correlate with population.
9
EE in ACES, ACEEE
Figure 7. Net Jobs Created and Net Consumer Savings from ACES Enhanced in 2030 by State
7,800
54,400
18,700
5,80021,900
9,200
87,900
VT: 2,400
MA: 28,600
CT: 15,900
RI: 5,600
NJ: 34,500MD: 26,200
DC: 3,600
3,100
DE: 3,400
24,400
Net Consumer Savings/Household
$630-940
$940-1240
$1240-1540
$1540-1840
$1840-2150
NH: 5,300
VA: 28,400
13,900
ME: 4,300
52,200
22,500
19,300
19,000121,500
45,600
31,900
1,800
2,800
8,500 41,700
35,400
9,200
Total Jobs: 1,035,500
8,10010,400
5,800
1,2004,900
34,500
69,1007,600
20,10014,000
19,500
10,900
7,800 13,100
1,300
4,500
4,100
Methodology
The foundation of this modeling tool is an assessment of the energy savings, net consumer costs, and emissions savings for each individual provision at a national level for 2020 and 2030 relative to the revised reference forecast in the Energy Information Administration’s (EIA) 2009 Annual Energy Outlook (EIA 2009g) released in April 2009. The approach used for each provision varies as the nature of each provision is quite different. The approaches used are discussed in Appendix D. Due to the complexity of these provisions and the potential for interaction, the analysis has simplified the representation of some provisions. Nonetheless, we feel that the representations of the energy efficiency provisions in this analysis are more detailed than those in recent analyses by the U.S. Environmental Protection Agency (EPA 2009) and EIA (2009b). In addition, the model aggregates the impacts from these energy efficiency provisions in the bill and estimates the economic savings and jobs numbers for the whole bill using a 4-sector algorithm that makes use of a single labor productivity factor. This algorithm has the capability to analyze some impacts to the electricity sector from this bill, but does not adjust energy prices based upon the reduced consumption created by energy efficiency.6 The model presents energy savings, economic savings and jobs numbers aggregated for key sections of the bill (groups of related provisions), including an EERS, SEED fund allocations, utility allocations, and transportation. After calculating national-level energy savings for each of the major sections of the bill, and jobs created by the bill as a whole, we apportioned net consumer savings7 and net jobs to each state using state-specific energy consumption and price data for each of the 50 states (plus the District of Columbia). Net consumer savings was estimated using state-specific energy cost estimates and jobs were adjusted using a state-specific multiplier factor
6 ACEEE is currently working on a national-level analysis using the DEEPER model (Laitner forthcoming) of these same scenarios, but also including the cap-and-trade provisions in ACES. This analysis will also extend the modeling of the impacts to 2050 and will include price elasticity, sector-specific labor productivity gains, all greenhouse gases, and at least 15 sectors of the U.S. economy. This analysis is scheduled to be released in late September 2009. 7 Net consumer savings is the value of reduced energy bills that result from decreased energy consumption less the investments required to realize these energy savings.
10
EE in ACES, ACEEE
to reflect differing economic structures in the states. In the case of the SEED-fund based provisions, savings were apportioned based upon the factors specified in Section 782(g). The algorithm used to generate net jobs includes additional factors, detailed in Appendix D. This analysis did not conduct individual analyses of each state, so it is likely that the results somewhat overstate the savings in states that are already promoting energy efficiency and somewhat understate the savings in state that have not been as actively promoting energy efficiency. This distortion results because the algorithm apportions savings based on energy consumption and does not take into account existing energy efficiency policies beyond the presence of a state-level EERS (Furrey et al. 2009), such as state building codes or public facilities programs, such as schools and government buildings. Avoided carbon emission from the electric sector are calculated using national factors, since calculation using state-specific values would represent false precision in view of the interconnected nature of much of the nation’s electric system and significant interstate flows of electricity. Because the model allows key overall parameters, as well as measures specific parameters to be varied, the model can easily explore alternate scenarios such as the enhanced case presented above. The model is designed such that additional provisions can be added with relative ease so that it can be used to explore an evolving suite of legislative provisions. A more detailed description of the model and key assumptions can be found in Appendix D. CONCLUSIONS The energy efficiency provisions in ACES as passed by the House will result in important consumer cost savings and new job creation. In addition, this analysis confirms that energy efficiency mitigates the potential cost of climate legislation. The estimated consumer cost savings from the energy efficiency policies in ACES will more than offset the estimated cost to consumers from overall legislation. As impressive as the impacts of the House-passed bill are, critical energy savings opportunities are left on the table. Our analysis finds that adoption of the three enhanced efficiency policies:
• 10% stand-alone EERS • one-third of electric utility allowances devoted to energy efficiency • continued SEED allocations at 2012 levels
will result in the creation of 71% more jobs nationwide and an additional 70% in net consumer savings per household in 2030 while reducing carbon emissions even further than would result from the House-passed bill. The benefits of these enhancements are proportional in each of the 50 states. Much of the debate on federal cap and trade legislation is focusing on the costs of compliance. Prior studies either do not account for the energy efficiency provisions in the legislation, or due to a shortage of time and other resources, address only a few of the efficiency provisions. A broader accounting of all of the efficiency provisions shows large savings for consumers. Based on these results, we conclude that energy efficiency provisions are a key cost mitigation strategy and an important foundation for any Senate climate and/or energy legislation.
11

EE in ACES, ACEEE
12
EE in ACES, ACEEE
REFERENCES [ACEEE] American Council for an Energy-Efficient Economy. 2007. “Triple Play: New Energy Bill Saves Three
Times As Much as 2005 Act.” Press Release, December 6. http://www.aceee.org/press/0712energy-bill.htm. Washington, D.C.: American Council for an Energy-Efficient Economy.
[BEA] Bureau of Economic Analysis. 2009. Regional Economic Accounts. http://www.bea.gov/regional/index.htm.
Washington, DC: U.S. Department of Commerce. Boteler, R. (Emerson Motor Company). 2009. Personal communication with Rachel Gold. May. [CBO] Congressional Budget Office. 2009. Congressional Budget Office Cost Estimate: H.R. 2454 American
Clean Energy Security Act of 2009. http://www.cbo.gov/ftpdocs/103xx/doc10327/06-19-CapTradeCosts.htm Washington, D.C.: Congressional Budget Office.
Census Bureau. 2009. American Community Survey. Housing Units for 2005.
http://factfinder.census.gov/servlet/DatasetMainPageServlet?_program=ACS&_submenuId=datasets_2&_lang=en. Washington, D.C.: U.S. Department of Commerce.
Cleetus, R., S. Clemmer and D. Friedman. 2009. Climate 2030: A National Blueprint for a Clean Energy
Economy, http://www.ucsusa.org/global_warming/solutions/big_picture_solutions/climate-2030-blueprint.html. Cambridge, Mass.: Union of Concerned Scientist.
[eGrid] U.S. EPA. 2007. eGRID2007 Version 1.1, Year 2005 Summary Tables (created December 2008).
Washington, D.C.: U.S Environmental Protection Agency, Office of Atmospheric Programs. [EIA] Energy Information Administration. 2000. Electric Utility Demand Side Management 1999: Executive
Summary. http://www.eia.doe.gov/cneaf/electricity/dsm99/dsm_sum99.html. Washington, D.C.: U.S. Department of Energy.
______. 2007. Commercial Buildings Energy Consumption Survey. http://www.eia.doe.gov/emeu/cbecs/.
Washington, DC: U.S. Department of Energy. ______. 2008. Fuel and Kerosene Sales 2007, Residential and Commercial Distillate Fuel Consumption.
http://www.eia.doe.gov/pub/oil_gas/petroleum/data_publications/fuel_oil_and_kerosene_sales/current/pdf/foksall.pdf. Washington, D.C.: U.S. Department of Energy.
______. 2009a.. “Retail Sales of Electricity to Ultimate Customers by End-Use Sector, by State.” Electric Power
Monthly. http://www.eia.doe.gov/cneaf/electricity/epm/table5_4_b.html. Washington, D.C.: U.S. Department of Energy.
______. 2009b. “Average Retail Price of Electricity to Ultimate Customers by End-Use Sector, by State.” Electric
Power Monthly. http://www.eia.doe.gov/cneaf/electricity/epm/table5_6_b.html. Washington, D.C.: U.S. Department of Energy.
______. 2009c. “Natural Gas Consumption, Residential and Commercial Consumers.” Natural Gas Navigator.
http://tonto.eia.doe.gov/dnav/ng/ng_cons_sum_a_EPG0_vgt_mmcf_a.htm. Washington, D.C.: US Department of Energy.
______. 2009d. Petroleum Navigator, “Prices, Sales Volumes & Stocks by State.”
http://tonto.eia.doe.gov/dnav/pet/pet_sum_mkt_a_epm0_ptc_cpgal_a.htm Washington, D.C.: U.S. Department of Energy.
______. 2009e. “Annual Average Price of Natural Gas Delivered to Residential and Commercial Consumers—by
State.” Natural Gas Monthly. http://tonto.eia.doe.gov/oog/ftparea/wogirs/xls/ngm18vmall.xls. Washington, D.C.: U.S. Department of Energy.
13
EE in ACES, ACEEE
______ 2009f. State Energy Data System. http://www.eia.doe.gov/emeu/states/_seds.html. Washington, D.C.: U.S. Department of Energy.
_______2009g. Updated Annual Energy Outlook 2009 Reference Case Service Report, April 2009. DOE/EIA-
0383(2009). http://www.eia.doe.gov/oiaf/aeo/. Washington, D.C.: U.S. Department of Energy. ______. 2009h. Energy Market and Economic Impacts of H.R. 2454, the American Clean Energy and Security Act
of 2009. http://www.eia.doe.gov/oiaf/servicerpt/hr2454/pdf/sroiaf(2009)05.pdf. Washington, D.C.: U.S. Department of Energy.
_______. 2009i. "U.S. Electric Industry Net Generation by State, 2007." Electric Power Annual January 2009.
Energy Information Administration, Form EIA-923. “Power Plant Operations Report” and predecessor form(s) including Energy Information Administration, Form EIA-906. “Power Plant Report;” and Form EIA-920, “Combined Heat and Power Plant Report.” Washington, D.C.: U.S. Department of Energy.
______ 2009j. 2005 Residential Energy Consumption Survey. http://www.eia.doe.gov/emeu/recs/contents.html.
Washington, D.C.: U.S. Department of Energy. Eldridge, M., M. Neubauer, D. York, S. Vaidyanathan, A. Chittum, and S. Nadel. 2008. The 2008 State Energy
Efficiency Scorecard. http://aceee.org/pubs/e086.htm. Washington, D.C.: American Council for an Energy-Efficient Economy.
[EPRI] Electric Power Research Institute. 2008. The Green Grid: Energy Savings and Carbon Emissions
Reductions Enabled by a Smart Grid. 1016905. Palo Alto, Calif.: Electric Power Research Institute. [EPA] Environmental Protection Agency. 2009. EPA Analysis of the American Clean Energy and Security Act of
2009 H.R. 2454 in the 111th Congress. http://www.epa.gov/climatechange/economics/ economicanalyses.html#wax. Washington, D.C.: U.S. Environmental Protection Agency, Office of Atmospheric Programs.
Faruqui, A. and S. Sergici. 2008. The Power of Experimentation: New Evidence on Residential Demand
Response. San Francisco, Calif.: The Brattle Group. [FHA] Federal Highway Administration. 2009. Highway Statistics 2007, Motor Fuel Volume Taxed.
http://www.fhwa.dot.gov/policyinformation/statistics/2007/mf2.cfm#foot2. Washington, D.C.: U.S. Department of Transportation, Federal Highway Administration.
Friedrich, Katherine, Maggie Eldridge, Dan York, Patti Witte, and Marty Kushler. (forthcoming). Saving Energy
Cost-Effectively. Washington, D.C.: American Council for an Energy-Efficient Economy. Furrey, L,A., S. Nadel, and J.A. “Skip” Laitner. 2009. Laying the Foundation for Implementing a Federal Energy
Efficiency Resource Standard. http://aceee.org/pubs/e091.pdf. Washington, D.C.: American Council for an Energy-Efficient Economy.
Geller, Howard, Steven Nadel, and Mark Hopkins. 1992. Energy Savings Estimates from the Energy Efficiency
Provisions in the Energy Policy Act of 1992. Washington, D.C.: American Council for an Energy-Efficient Economy.
Jones, John (NYSERDA). 2009. Personal communication with S. Nadel. January and February. Laitner, John A. “Skip.” (Forthcoming). The Dynamic Concepts Behind the DEEPER Model, Washington, D.C.:
American Council for an Energy-Efficient Economy Levy, Emanuel (Manufactured Housing Institute). 2009. Personal communication with Jacob Talbot, American
Council for an Energy-Efficient Economy. May.
14
EE in ACES, ACEEE
Nadel, Steve, R. Neal Elliott, and Therese Langer. 2005. A Choice of Two Paths: Energy Savings from Pending Federal Energy Legislation. http://www.aceee.org/pubs/e051.htm. Washington, D.C.: American Council for an Energy-Efficient Economy.
Nadel, Steve. 2004. “Supplementary Information on Energy Efficiency for the National Commission on Energy
Policy.” NCEP Technical Appendix Chapter 3: Improving Energy Efficiency. http://www.bipartisanpolicy.org/library/report/technical-appendix-chapter-3-improving-energy-effciency. Washington, D.C.: American Council for an Energy-Efficient Economy.
Neubauer, Max, Andrew deLaski, Marianne DiMascio & Steven Nadel 2009. Ka-BOOM! The Power of Appliance
Standards: Opportunities for New Federal Appliance and Equipment Standards. Washington, D.C.: American Council for an Energy-Efficient Economy.
[NREL] National Renewable Energy Laboratory. 2007. Projected Benefits of Federal Energy Efficiency and
Renewable Energy Programs FY 2007 Budget Request. NREL/TP-620-39684. http://www1.eere.energy.gov/ba/pba/pdfs/41347_chap3_.pdf. Washington, D.C.: U.S. Department of Energy, Energy Information Administration.
[ORNL] Schweitzer, Martin. 2005. Estimating the National Effects of the U.S. Department of Energy’s
Weatherization Assistance Program with State-Level Data: A Metaevaluation Using Studies from 1993 to 2005. ORNL/CON-493. http://weatherization.ornl.gov/pdf/CON-493FINAL10-10-05.pdf. Washington, DC: U.S. Department of Energy, Office of the Weatherization and Intergovernmental Program.
Osborn, J., C. Goldman, N. Hopper, and T. Singer. 2002. “Assessing U.S. ESCO Industry Performance and
Market Trends: Results from the NAESCO Database Project.” In Proceedings of the 2002 ACEEE Summer Study on Energy Efficiency in Buildings, 5.233–245. Washington, D.C.: American Council for an Energy-Efficient Economy.
15

EE in ACES, ACEEE
16
EE in ACES, ACEEE
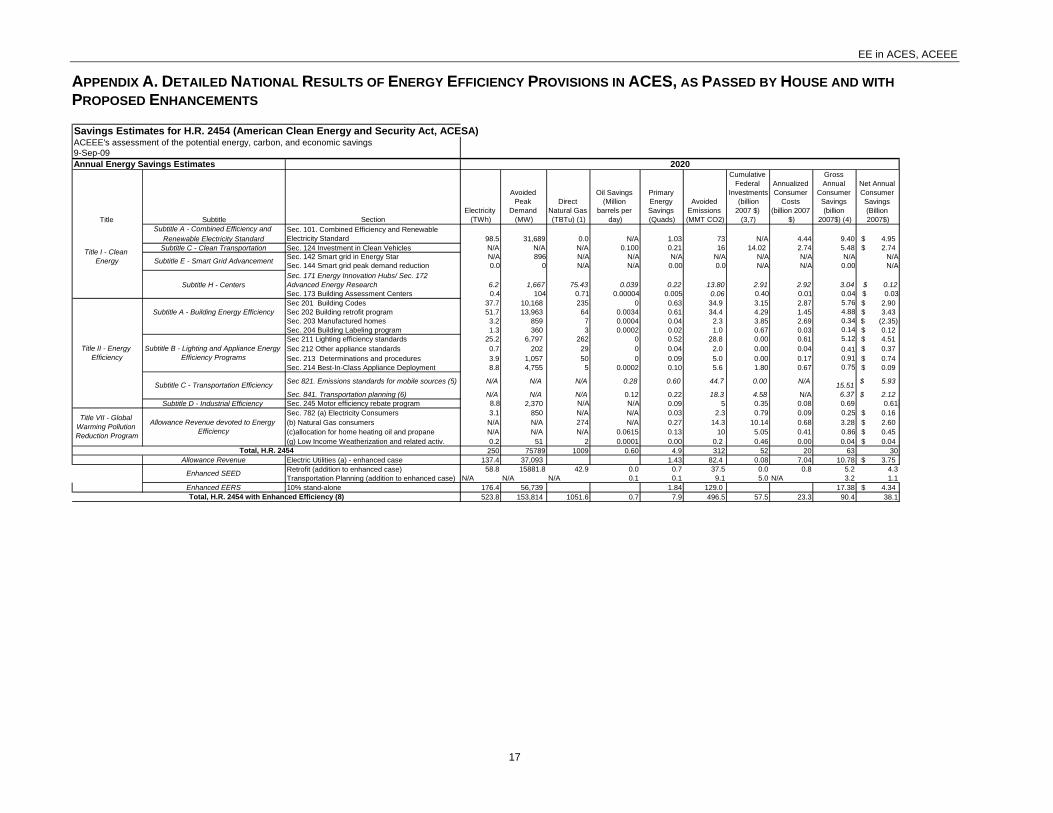
APPENDIX A. DETAILED NATIONAL RESULTS OF ENERGY EFFICIENCY PROVISIONS IN ACES, AS PASSED BY HOUSE AND WITH PROPOSED ENHANCEMENTS Savings Estimates for H.R. 2454 (American Clean Energy and Security Act, ACESA)ACEEE's assessment of the potential energy, carbon, and economic savings9-Sep-09Annual Energy Savings Estimates
Title Subtitle SectionElectricity
(TWh)
Avoided Peak
Demand (MW)
Direct Natural Gas (TBTu) (1)
Oil Savings (Million
barrels per day)
Primary Energy Savings (Quads)
Avoided Emissions (MMT CO2)
Cumulative Federal
Investments (billion 2007 $)
(3,7)
Annualized Consumer
Costs (billion 2007
$)
Gross Annual
Consumer Savings (billion
2007$) (4)
Net Annual Consumer Savings (Billion 2007$)
Subtitle A - Combined Efficiency and Renewable Electricity Standard
Sec. 101. Combined Efficiency and Renewable Electricity Standard 98.5 31,689 0.0 N/A 1.03 73 N/A 4.44 9.40 4.95$
Subtitle C - Clean Transportation Sec. 124 Investment in Clean Vehicles N/A N/A N/A 0.100 0.21 16 14.02 2.74 5.48 2.74$ Sec. 142 Smart grid in Energy Star N/A 896 N/A N/A N/A N/A N/A N/A N/A N/A Sec. 144 Smart grid peak demand reduction 0.0 0 N/A N/A 0.00 0.0 N/A N/A 0.00 N/A
Subtitle H - CentersSec. 171 Energy Innovation Hubs/ Sec. 172 Advanced Energy Research 6.2 1,667 75.43 0.039 0.22 13.80 2.91 2.92 3.04 $ 0.12 Sec. 173 Building Assessment Centers 0.4 104 0.71 0.00004 0.005 0.06 0.40 0.01 0.04 $ 0.03 Sec 201 Building Codes 37.7 10,168 235 0 0.63 34.9 3.15 2.87 5.76 2.90$
Subtitle A - Building Energy Efficiency Sec 202 Building retrofit program 51.7 13,963 64 0.0034 0.61 34.4 4.29 1.45 4.88 3.43$ Sec. 203 Manufactured homes 3.2 859 7 0.0004 0.04 2.3 3.85 2.69 0.34 (2.35)$ Sec. 204 Building Labeling program 1.3 360 3 0.0002 0.02 1.0 0.67 0.03 0.14 0.12$ Sec 211 Lighting efficiency standards 25.2 6,797 262 0 0.52 28.8 0.00 0.61 5.12 4.51$ Sec 212 Other appliance standards 0.7 202 29 0 0.04 2.0 0.00 0.04 0.41 0.37$ Sec. 213 Determinations and procedures 3.9 1,057 50 0 0.09 5.0 0.00 0.17 0.91 0.74$ Sec. 214 Best-In-Class Appliance Deployment 8.8 4,755 5 0.0002 0.10 5.6 1.80 0.67 0.75 0.09$
Sec 821. Emissions standards for mobile sources (5) N/A N/A N/A 0.28 0.60 44.7 0.00 N/A 15.51 5.93$
Sec. 841. Transportation planning (6) N/A N/A N/A 0.12 0.22 18.3 4.58 N/A 6.37 2.12$ Subtitle D - Industrial Efficiency Sec. 245 Motor efficiency rebate program 8.8 2,370 N/A N/A 0.09 5 0.35 0.08 0.69 0.61
Sec. 782 (a) Electricity Consumers 3.1 850 N/A N/A 0.03 2.3 0.79 0.09 0.25 0.16$ (b) Natural Gas consumers N/A N/A 274 N/A 0.27 14.3 10.14 0.68 3.28 2.60$ (c)allocation for home heating oil and propane N/A N/A N/A 0.0615 0.13 10 5.05 0.41 0.86 0.45$ (g) Low Income Weatherization and related activ. 0.2 51 2 0.0001 0.00 0.2 0.46 0.00 0.04 0.04$
250 75789 1009 0.60 4.9 312 52 20 63 30Allowance Revenue Electric Utilities (a) - enhanced case 137.4 37,093 1.43 82.4 0.08 7.04 10.78 3.75$
Retrofit (addition to enhanced case) 58.8 15881.8 42.9 0.0 0.7 37.5 0.0 0.8 5.2 4.3Transportation Planning (addition to enhanced case) N/A N/A N/A 0.1 0.1 9.1 5.0 N/A 3.2 1.1
Enhanced EERS 10% stand-alone 176.4 56,739 1.84 129.0 17.38 4.34$ 523.8 153,814 1051.6 0.7 7.9 496.5 57.5 23.3 90.4 38.1
2020
Title I - Clean Energy
Subtitle C - Transportation Efficiency
Subtitle E - Smart Grid Advancement
Title II - Energy Efficiency
Subtitle B - Lighting and Appliance Energy Efficiency Programs
Total, H.R. 2454 with Enhanced Efficiency (8)
Total, H.R. 2454
Allowance Revenue devoted to Energy Efficiency
Title VII - Global Warming Pollution Reduction Program
Enhanced SEED
17
EE in ACES, ACEEE
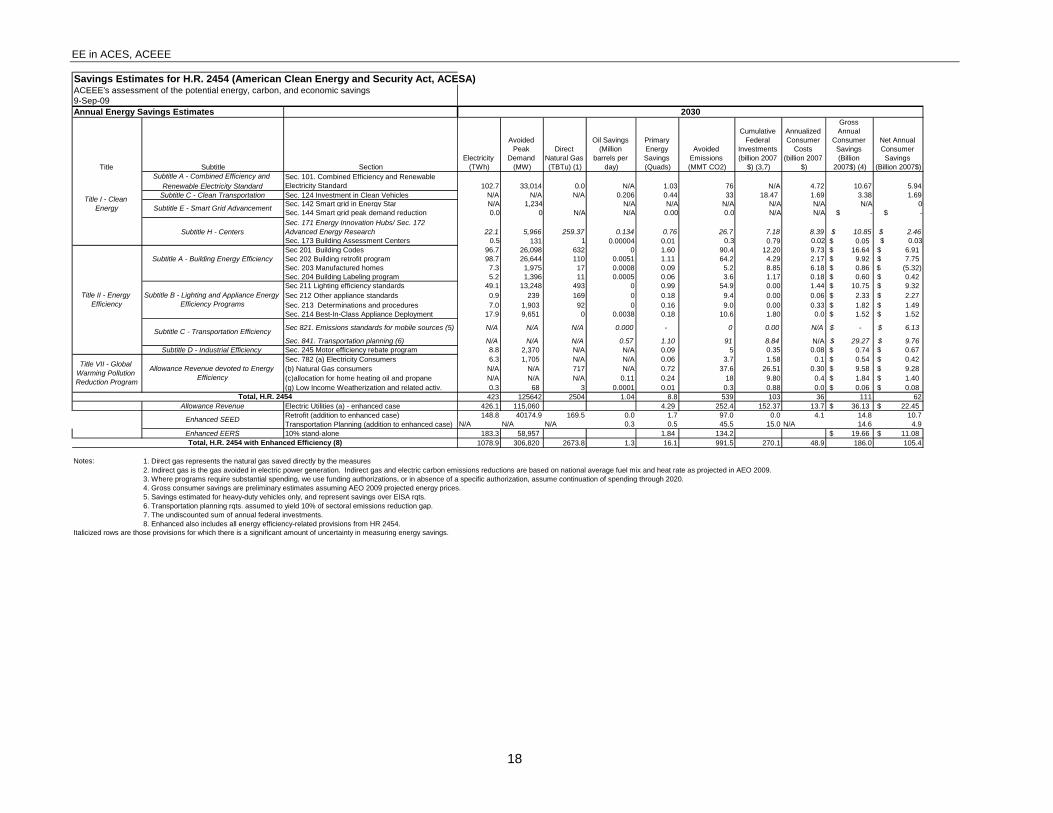
Savings Estimates for H.R. 2454 (American Clean Energy and Security Act, ACESA)ACEEE's assessment of the potential energy, carbon, and economic savings9-Sep-09Annual Energy Savings Estimates
Title Subtitle SectionElectricity
(TWh)
Avoided Peak
Demand (MW)
Direct Natural Gas (TBTu) (1)
Oil Savings (Million
barrels per day)
Primary Energy Savings (Quads)
Avoided Emissions (MMT CO2)
Cumulative Federal
Investments (billion 2007
$) (3,7)
Annualized Consumer
Costs (billion 2007
$)
Gross Annual
Consumer Savings (Billion
2007$) (4)
Net Annual Consumer Savings
(Billion 2007$) Subtitle A - Combined Efficiency and
Renewable Electricity StandardSec. 101. Combined Efficiency and Renewable Electricity Standard 102.7 33,014 0.0 N/A 1.03 76 N/A 4.72 10.67 5.94
Subtitle C - Clean Transportation Sec. 124 Investment in Clean Vehicles N/A N/A N/A 0.206 0.44 33 18.47 1.69 3.38 1.69Sec. 142 Smart grid in Energy Star N/A 1,234 N/A N/A N/A N/A N/A N/A 0Sec. 144 Smart grid peak demand reduction 0.0 0 N/A N/A 0.00 0.0 N/A N/A $ - $ -
Subtitle H - CentersSec. 171 Energy Innovation Hubs/ Sec. 172 Advanced Energy Research 22.1 5,966 259.37 0.134 0.76 26.7 7.18 8.39 $ 10.85 $ 2.46 Sec. 173 Building Assessment Centers 0.5 131 1 0.00004 0.01 0.3 0.79 0.02 0.05$ $ 0.03 Sec 201 Building Codes 96.7 26,098 632 0 1.60 90.4 12.20 9.73 16.64$ 6.91$
Subtitle A - Building Energy Efficiency Sec 202 Building retrofit program 98.7 26,644 110 0.0051 1.11 64.2 4.29 2.17 9.92$ 7.75$ Sec. 203 Manufactured homes 7.3 1,975 17 0.0008 0.09 5.2 8.85 6.18 0.86$ (5.32)$ Sec. 204 Building Labeling program 5.2 1,396 11 0.0005 0.06 3.6 1.17 0.18 0.60$ 0.42$ Sec 211 Lighting efficiency standards 49.1 13,248 493 0 0.99 54.9 0.00 1.44 10.75$ 9.32$ Sec 212 Other appliance standards 0.9 239 169 0 0.18 9.4 0.00 0.06 2.33$ 2.27$ Sec. 213 Determinations and procedures 7.0 1,903 92 0 0.16 9.0 0.00 0.33 1.82$ 1.49$ Sec. 214 Best-In-Class Appliance Deployment 17.9 9,651 0 0.0038 0.18 10.6 1.80 0.0 1.52$ 1.52$
Sec 821. Emissions standards for mobile sources (5) N/A N/A N/A 0.000 - 0 0.00 N/A -$ 6.13$
Sec. 841. Transportation planning (6) N/A N/A N/A 0.57 1.10 91 8.84 N/A 29.27$ 9.76$ Subtitle D - Industrial Efficiency Sec. 245 Motor efficiency rebate program 8.8 2,370 N/A N/A 0.09 5 0.35 0.08 0.74$ 0.67$
Sec. 782 (a) Electricity Consumers 6.3 1,705 N/A N/A 0.06 3.7 1.58 0.1 0.54$ 0.42$ (b) Natural Gas consumers N/A N/A 717 N/A 0.72 37.6 26.51 0.30 9.58$ 9.28$ (c)allocation for home heating oil and propane N/A N/A N/A 0.11 0.24 18 9.80 0.4 1.84$ 1.40$ (g) Low Income Weatherization and related activ. 0.3 68 3 0.0001 0.01 0.3 0.88 0.0 0.06$ 0.08$
423 125642 2504 1.04 8.8 539 103 36 111 62Allowance Revenue Electric Utilities (a) - enhanced case 426.1 115,060 4.29 252.4 152.37 13.7 36.13$ 22.45$
Retrofit (addition to enhanced case) 148.8 40174.9 169.5 0.0 1.7 97.0 0.0 4.1 14.8 10.7Transportation Planning (addition to enhanced case) N/A N/A N/A 0.3 0.5 45.5 15.0 N/A 14.6 4.9
Enhanced EERS 10% stand-alone 183.3 58,957 1.84 134.2 19.66$ 11.08$ 1078.9 306,820 2673.8 1.3 16.1 991.5 270.1 48.9 186.0 105.4
Notes: 1. Direct gas represents the natural gas saved directly by the measures2. Indirect gas is the gas avoided in electric power generation. Indirect gas and electric carbon emissions reductions are based on national average fuel mix and heat rate as projected in AEO 2009.3. Where programs require substantial spending, we use funding authorizations, or in absence of a specific authorization, assume continuation of spending through 2020.4. Gross consumer savings are preliminary estimates assuming AEO 2009 projected energy prices.5. Savings estimated for heavy-duty vehicles only, and represent savings over EISA rqts.6. Transportation planning rqts. assumed to yield 10% of sectoral emissions reduction gap.7. The undiscounted sum of annual federal investments. 8. Enhanced also includes all energy efficiency-related provisions from HR 2454.
Italicized rows are those provisions for which there is a significant amount of uncertainty in measuring energy savings.
2030
Title I - Clean Energy
Subtitle C - Transportation Efficiency
Subtitle E - Smart Grid Advancement
Title II - Energy Efficiency
Subtitle B - Lighting and Appliance Energy Efficiency Programs
Total, H.R. 2454 with Enhanced Efficiency (8)
Total, H.R. 2454
Allowance Revenue devoted to Energy Efficiency
Title VII - Global Warming Pollution Reduction Program
Enhanced SEED
18
EE in ACES, ACEEE
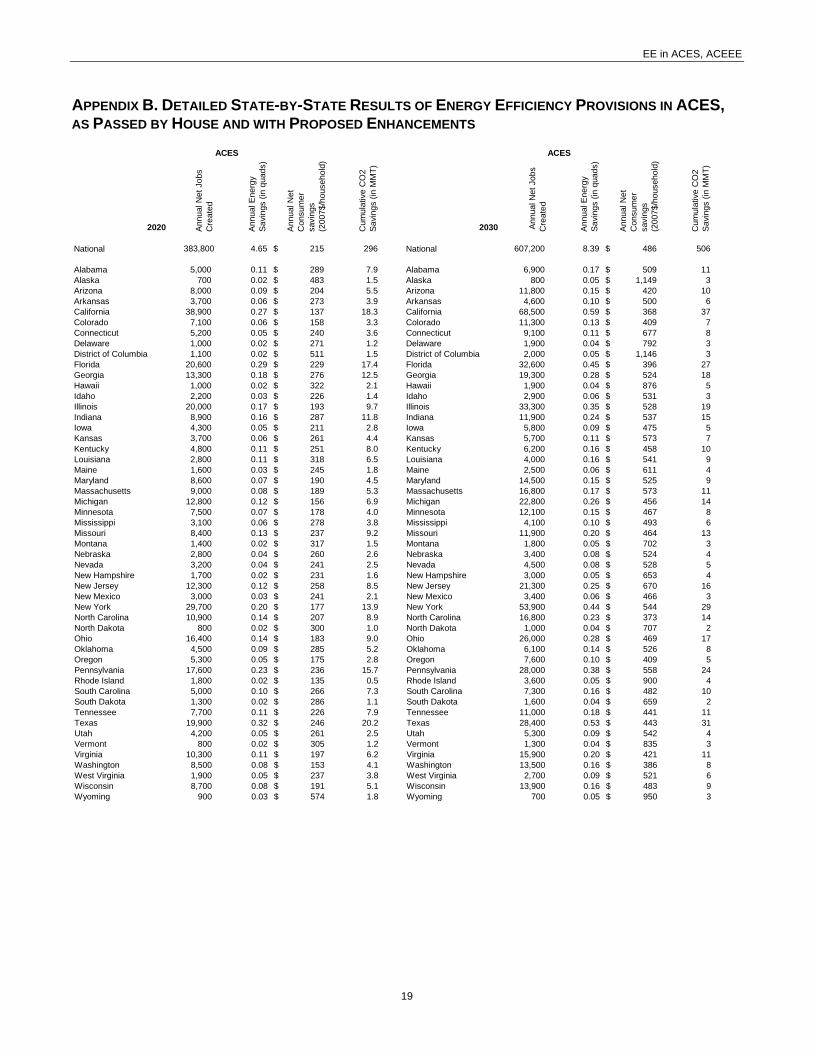
APPENDIX B. DETAILED STATE-BY-STATE RESULTS OF ENERGY EFFICIENCY PROVISIONS IN ACES, AS PASSED BY HOUSE AND WITH PROPOSED ENHANCEMENTS
2020 Annu
al N
et J
obs
Cre
ated
Annu
al E
nerg
y Sa
ving
s (in
qua
ds)
Annu
al N
et
Con
sum
er
savi
ngs
(200
7$/h
ouse
hold
)
Cum
ulat
ive
CO
2 Sa
ving
s (in
MM
T)
2030 Ann
ual N
et J
obs
Cre
ated
Annu
al E
nerg
y Sa
ving
s (in
qua
ds)
Annu
al N
et
Con
sum
er
savi
ngs
(200
7$/h
ouse
hold
)
Cum
ulat
ive
CO
2 Sa
ving
s (in
MM
T)
National 383,800 4.65 215$ 296 National 607,200 8.39 486$ 506
Alabama 5,000 0.11 289$ 7.9 Alabama 6,900 0.17 509$ 11Alaska 700 0.02 483$ 1.5 Alaska 800 0.05 1,149$ 3Arizona 8,000 0.09 204$ 5.5 Arizona 11,800 0.15 420$ 10Arkansas 3,700 0.06 273$ 3.9 Arkansas 4,600 0.10 500$ 6California 38,900 0.27 137$ 18.3 California 68,500 0.59 368$ 37Colorado 7,100 0.06 158$ 3.3 Colorado 11,300 0.13 409$ 7Connecticut 5,200 0.05 240$ 3.6 Connecticut 9,100 0.11 677$ 8Delaware 1,000 0.02 271$ 1.2 Delaware 1,900 0.04 792$ 3District of Columbia 1,100 0.02 511$ 1.5 District of Columbia 2,000 0.05 1,146$ 3Florida 20,600 0.29 229$ 17.4 Florida 32,600 0.45 396$ 27Georgia 13,300 0.18 276$ 12.5 Georgia 19,300 0.28 524$ 18Hawaii 1,000 0.02 322$ 2.1 Hawaii 1,900 0.04 876$ 5Idaho 2,200 0.03 226$ 1.4 Idaho 2,900 0.06 531$ 3Illinois 20,000 0.17 193$ 9.7 Illinois 33,300 0.35 528$ 19Indiana 8,900 0.16 287$ 11.8 Indiana 11,900 0.24 537$ 15Iowa 4,300 0.05 211$ 2.8 Iowa 5,800 0.09 475$ 5Kansas 3,700 0.06 261$ 4.4 Kansas 5,700 0.11 573$ 7Kentucky 4,800 0.11 251$ 8.0 Kentucky 6,200 0.16 458$ 10Louisiana 2,800 0.11 318$ 6.5 Louisiana 4,000 0.16 541$ 9Maine 1,600 0.03 245$ 1.8 Maine 2,500 0.06 611$ 4Maryland 8,600 0.07 190$ 4.5 Maryland 14,500 0.15 525$ 9Massachusetts 9,000 0.08 189$ 5.3 Massachusetts 16,800 0.17 573$ 11Michigan 12,800 0.12 156$ 6.9 Michigan 22,800 0.26 456$ 14Minnesota 7,500 0.07 178$ 4.0 Minnesota 12,100 0.15 467$ 8Mississippi 3,100 0.06 278$ 3.8 Mississippi 4,100 0.10 493$ 6Missouri 8,400 0.13 237$ 9.2 Missouri 11,900 0.20 464$ 13Montana 1,400 0.02 317$ 1.5 Montana 1,800 0.05 702$ 3Nebraska 2,800 0.04 260$ 2.6 Nebraska 3,400 0.08 524$ 4Nevada 3,200 0.04 241$ 2.5 Nevada 4,500 0.08 528$ 5New Hampshire 1,700 0.02 231$ 1.6 New Hampshire 3,000 0.05 653$ 4New Jersey 12,300 0.12 258$ 8.5 New Jersey 21,300 0.25 670$ 16New Mexico 3,000 0.03 241$ 2.1 New Mexico 3,400 0.06 466$ 3New York 29,700 0.20 177$ 13.9 New York 53,900 0.44 544$ 29North Carolina 10,900 0.14 207$ 8.9 North Carolina 16,800 0.23 373$ 14North Dakota 800 0.02 300$ 1.0 North Dakota 1,000 0.04 707$ 2Ohio 16,400 0.14 183$ 9.0 Ohio 26,000 0.28 469$ 17Oklahoma 4,500 0.09 285$ 5.2 Oklahoma 6,100 0.14 526$ 8Oregon 5,300 0.05 175$ 2.8 Oregon 7,600 0.10 409$ 5Pennsylvania 17,600 0.23 236$ 15.7 Pennsylvania 28,000 0.38 558$ 24Rhode Island 1,800 0.02 135$ 0.5 Rhode Island 3,600 0.05 900$ 4South Carolina 5,000 0.10 266$ 7.3 South Carolina 7,300 0.16 482$ 10South Dakota 1,300 0.02 286$ 1.1 South Dakota 1,600 0.04 659$ 2Tennessee 7,700 0.11 226$ 7.9 Tennessee 11,000 0.18 441$ 11Texas 19,900 0.32 246$ 20.2 Texas 28,400 0.53 443$ 31Utah 4,200 0.05 261$ 2.5 Utah 5,300 0.09 542$ 4Vermont 800 0.02 305$ 1.2 Vermont 1,300 0.04 835$ 3Virginia 10,300 0.11 197$ 6.2 Virginia 15,900 0.20 421$ 11Washington 8,500 0.08 153$ 4.1 Washington 13,500 0.16 386$ 8West Virginia 1,900 0.05 237$ 3.8 West Virginia 2,700 0.09 521$ 6Wisconsin 8,700 0.08 191$ 5.1 Wisconsin 13,900 0.16 483$ 9Wyoming 900 0.03 574$ 1.8 Wyoming 700 0.05 950$ 3
ACES ACES
19
EE in ACES, ACEEE
2020 Annu
al N
et J
obs
Cre
ated
Annu
al E
nerg
y Sa
ving
s (in
qua
ds)
Annu
al N
et
Con
sum
er
savi
ngs
(200
7$/h
ouse
hold
)
Cum
ulat
ive
CO
2 Sa
ving
s (in
MM
T)
2030 Annu
al N
et J
obs
Cre
ated
Annu
al E
nerg
y Sa
ving
s (in
qua
ds)
Annu
al N
et
Con
sum
er
savi
ngs
(200
7$/h
ouse
hold
)
Cum
ulat
ive
CO
2 Sa
ving
s (in
MM
T)
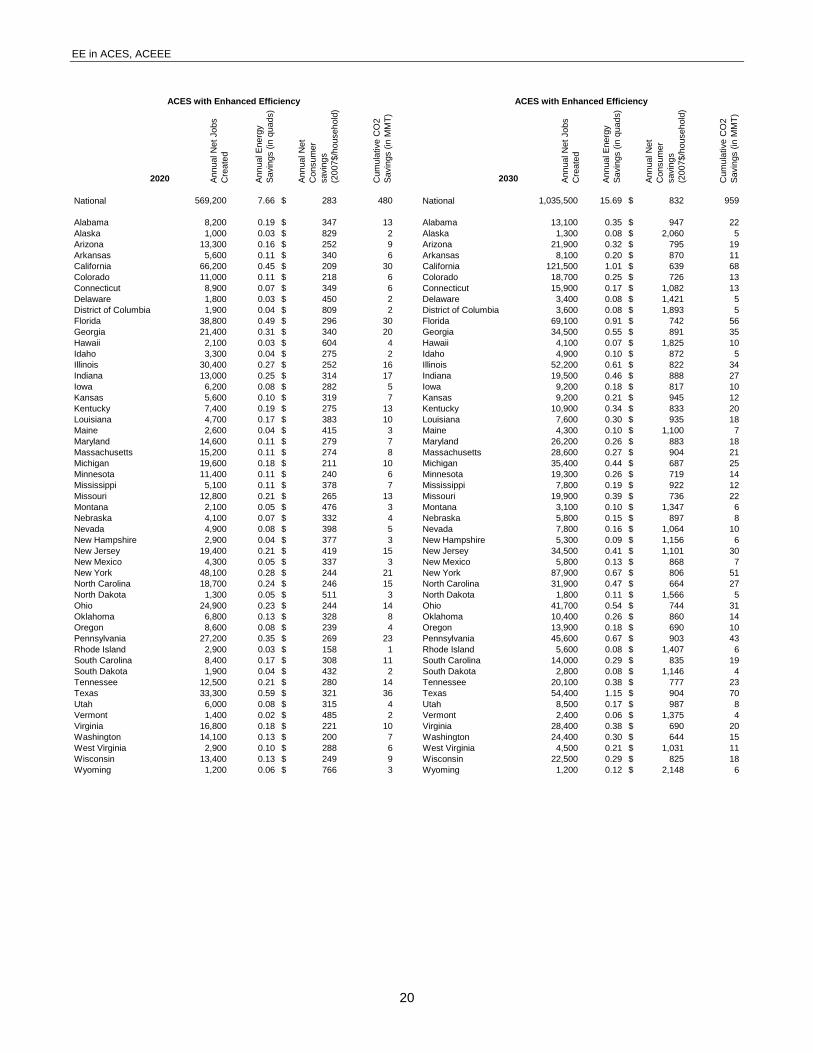
National 569,200 7.66 283$ 480 National 1,035,500 15.69 832$ 959
Alabama 8,200 0.19 347$ 13 Alabama 13,100 0.35 947$ 22Alaska 1,000 0.03 829$ 2 Alaska 1,300 0.08 2,060$ 5Arizona 13,300 0.16 252$ 9 Arizona 21,900 0.32 795$ 19Arkansas 5,600 0.11 340$ 6 Arkansas 8,100 0.20 870$ 11California 66,200 0.45 209$ 30 California 121,500 1.01 639$ 68Colorado 11,000 0.11 218$ 6 Colorado 18,700 0.25 726$ 13Connecticut 8,900 0.07 349$ 6 Connecticut 15,900 0.17 1,082$ 13Delaware 1,800 0.03 450$ 2 Delaware 3,400 0.08 1,421$ 5District of Columbia 1,900 0.04 809$ 2 District of Columbia 3,600 0.08 1,893$ 5Florida 38,800 0.49 296$ 30 Florida 69,100 0.91 742$ 56Georgia 21,400 0.31 340$ 20 Georgia 34,500 0.55 891$ 35Hawaii 2,100 0.03 604$ 4 Hawaii 4,100 0.07 1,825$ 10Idaho 3,300 0.04 275$ 2 Idaho 4,900 0.10 872$ 5Illinois 30,400 0.27 252$ 16 Illinois 52,200 0.61 822$ 34Indiana 13,000 0.25 314$ 17 Indiana 19,500 0.46 888$ 27Iowa 6,200 0.08 282$ 5 Iowa 9,200 0.18 817$ 10Kansas 5,600 0.10 319$ 7 Kansas 9,200 0.21 945$ 12Kentucky 7,400 0.19 275$ 13 Kentucky 10,900 0.34 833$ 20Louisiana 4,700 0.17 383$ 10 Louisiana 7,600 0.30 935$ 18Maine 2,600 0.04 415$ 3 Maine 4,300 0.10 1,100$ 7Maryland 14,600 0.11 279$ 7 Maryland 26,200 0.26 883$ 18Massachusetts 15,200 0.11 274$ 8 Massachusetts 28,600 0.27 904$ 21Michigan 19,600 0.18 211$ 10 Michigan 35,400 0.44 687$ 25Minnesota 11,400 0.11 240$ 6 Minnesota 19,300 0.26 719$ 14Mississippi 5,100 0.11 378$ 7 Mississippi 7,800 0.19 922$ 12Missouri 12,800 0.21 265$ 13 Missouri 19,900 0.39 736$ 22Montana 2,100 0.05 476$ 3 Montana 3,100 0.10 1,347$ 6Nebraska 4,100 0.07 332$ 4 Nebraska 5,800 0.15 897$ 8Nevada 4,900 0.08 398$ 5 Nevada 7,800 0.16 1,064$ 10New Hampshire 2,900 0.04 377$ 3 New Hampshire 5,300 0.09 1,156$ 6New Jersey 19,400 0.21 419$ 15 New Jersey 34,500 0.41 1,101$ 30New Mexico 4,300 0.05 337$ 3 New Mexico 5,800 0.13 868$ 7New York 48,100 0.28 244$ 21 New York 87,900 0.67 806$ 51North Carolina 18,700 0.24 246$ 15 North Carolina 31,900 0.47 664$ 27North Dakota 1,300 0.05 511$ 3 North Dakota 1,800 0.11 1,566$ 5Ohio 24,900 0.23 244$ 14 Ohio 41,700 0.54 744$ 31Oklahoma 6,800 0.13 328$ 8 Oklahoma 10,400 0.26 860$ 14Oregon 8,600 0.08 239$ 4 Oregon 13,900 0.18 690$ 10Pennsylvania 27,200 0.35 269$ 23 Pennsylvania 45,600 0.67 903$ 43Rhode Island 2,900 0.03 158$ 1 Rhode Island 5,600 0.08 1,407$ 6South Carolina 8,400 0.17 308$ 11 South Carolina 14,000 0.29 835$ 19South Dakota 1,900 0.04 432$ 2 South Dakota 2,800 0.08 1,146$ 4Tennessee 12,500 0.21 280$ 14 Tennessee 20,100 0.38 777$ 23Texas 33,300 0.59 321$ 36 Texas 54,400 1.15 904$ 70Utah 6,000 0.08 315$ 4 Utah 8,500 0.17 987$ 8Vermont 1,400 0.02 485$ 2 Vermont 2,400 0.06 1,375$ 4Virginia 16,800 0.18 221$ 10 Virginia 28,400 0.38 690$ 20Washington 14,100 0.13 200$ 7 Washington 24,400 0.30 644$ 15West Virginia 2,900 0.10 288$ 6 West Virginia 4,500 0.21 1,031$ 11Wisconsin 13,400 0.13 249$ 9 Wisconsin 22,500 0.29 825$ 18Wyoming 1,200 0.06 766$ 3 Wyoming 1,200 0.12 2,148$ 6
ACES with Enhanced Efficiency ACES with Enhanced Efficiency
20
EE in ACES, ACEEE
APPENDIX C. DESCRIPTIONS OF ENERGY EFFICIENCY PROVISIONS IN ACES AS PASSED BY THE HOUSE The American Clean Energy and Security Act (H.R. 2454, or ACES) was passed by the U.S. House of Representatives on June 26, 2009. The bill provides important steps forward in addressing climate change. Most importantly, the legislation creates a cap-and-trade policy—a market-based incentive to reduce carbon emissions. The bill also mandates a combined renewable and electricity standard requiring that 20% of electricity sales by 2020 be met by renewable energy and energy efficiency. In addition, the bill includes a number of “complementary” policies designed to maximize savings from energy efficiency, including improved building codes, appliance and lighting standards, and residential and commercial retrofits. Furthermore, allowances from the sale of carbon credits in the cap-and-trade system are allocated to funding a number of important energy efficiency initiatives. Together, these energy efficiency provisions have the potential to help people and businesses to become more efficient and to drive adoption of energy-efficient technologies, our country’s cheapest and most abundant energy source. This appendix provides a brief summary of each of these provisions. Title I—Clean Energy Section 101 of ACES creates a combined renewable and electricity standard requiring that 20% of electricity sales be met with a combination of renewable energy and energy efficiency by 2020. Energy efficiency programs can be used to meet 5% of the requirement, and governors can petition to bring the percentage devoted to efficiency up to 8%. Many utilities and states will choose to use the maximum amount of efficiency, as efficiency investments tend to be less expensive than renewable energy. The Clean Transportation subtitle (Subtitle C) promotes vehicle electrification by requiring utilities to develop plans for vehicle charging infrastructure and two-way communication between vehicles and the grid; establishing a large-scale deployment program for plug-in electric drive vehicles in multiple regions of the country; and providing assistance to manufacturers of plug-in electric drive vehicles developed and produced domestically. Three percent of all emissions allowances in 2012–2017 and 1% from 2018–2025 are dedicated to advanced vehicles, one-quarter of which will fund the plug-in electric drive programs just mentioned through 2017 and the remainder of which will be used for retooling manufacturing facilities and engineering integration for production of advanced technology vehicles more generally. In addition, this subtitle expands the “Section 136” retooling loans set up in the Energy Independence and Security Act of 2007 from $25 billion to $50 billion. The Smart Grid Advancement subtitle (Subtitle E) includes two provisions designed to promote deployment of smart grid technologies, including a provision that includes smart grid in ENERGY STAR, and a provision that encourages peak demand reduction through the smart grid. In addition, Sections 171 and 172 of the bill create Energy Innovation Hubs and fund the Advanced Research Projects Agency—Energy (ARPA-E), a cutting-edge R&D program previously established by EISA. These programs will be administered by the Department of Energy. These initiatives will be funded by 1.5% of the total allowances from the cap-and-trade provision established in Title III of ACES. Seventy percent of these funds will go to Advanced Energy Research and 30% will go to Energy Innovation Hubs at universities. Two of the eight Energy Innovation Hubs mentioned in the bill are dedicated to energy efficiency, and ACEEE estimates that one-third of the ARPA-E funds will be used for energy efficiency R&D. Title II—Energy Efficiency Section 201 of the bill establishes new building code standards for new building efficiency, providing for 30% improvements in 2010, 50% improvements in 2014 for residential and 2015 for commercial buildings, and 5% additional improvements every 3 years after 2017/2018. States will be responsible for adoption and enforcement of the codes,8 which will be funded by 0.5% of the total emissions allowances established in Title III of this bill.
8 The U.S. Department of Energy will be responsible for implementation in states that do not incorporate the new standards into their state building codes.
21
EE in ACES, ACEEE
Section 202 of the bill establishes the Retrofit for Energy and Environmental Performance (REEP) program to promote comprehensive energy efficiency retrofits for residential and commercial buildings, in which per building energy savings of 20% or more are targeted. States must offer preferential access of at least 10% of REEP program funding to public housing. The REEP program will be funded by the SEED allowances (discussed below). ACES establishes a program to promote energy efficiency in manufactured homes in Section 203. This program enables low-income families living in pre-1976 manufactured homes to use a rebate to help purchase a new ENERGY STAR manufactured home. Section 204 of ACES establishes a building energy performance labeling program, which the Manager’s Amendment restricted to new construction only. The version of this provision in the Senate Energy and Natural Resource Committee’s ACELA bill is not limited to new construction. As such, the Senate version provides more robust energy savings. The building labeling program will be funded by the SEED allowances. Lighting and Appliance Energy Efficiency Programs (Subtitle B) details new standards for lighting and appliances. Section 212 includes stronger standards for commercial furnaces, drinking water dispensers, hot food holding cabinets, and portable electric spas. Lighting standards in Section 211 will improve the efficiency of outdoor lighting fixtures, BR incandescent reflector lamps, and portable lighting fixtures. The Manager’s Amendment changed the outdoor lighting standards by delaying effective dates and eliminating a planned 2015 increase in the standard, which decreases savings from the standard by 28% relative to the bill reported out of committee. Section 214 of the bill created the Best-In-Class Appliances Deployment Program to promote the sales and manufacture of the most (top 10%) energy-efficient equipment and appliances. A new section added in the Rules Committee version of the bill would require DOE to include smart grid savings when setting standards for the bill. $600 million per year is authorized to be appropriated for the years 2011–2013. In addition to building and appliance standards, ACES aims to increase transportation efficiency through a number of measures. These include a provision (Section 821) that directs EPA to issue greenhouse gas standards for new heavy-duty trucks by 2010, and for non-road engines and vehicles two years later. The bill also includes a provision (Section 841) directing EPA, in consultation with the Department of Transportation, to set transportation sector greenhouse gas (GHG) reduction targets “commensurate with” the reductions required for the economy as a whole. States and large metropolitan areas must integrate GHG targets and other climate considerations into their transportation plans and programs. The relationship between the national targets and the state and regional targets is unclear, as is the enforcement mechanism that would ensure real savings from this provision. Furthermore, there is no funding dedicated specifically to the achievement of the necessary transportation emissions reductions, which will require major improvements in the coordination of transportation and land use planning. Despite these shortcomings, the inclusion of this provision is significant, and we attribute to it 10% of the remaining transportation sector emissions reductions needed to achieve emissions targets. Subtitle D (Industrial Efficiency Programs) of the bill includes a number of provisions designed to improve energy efficiency in the industrial sector. Section 228 details a motor efficiency rebate program for the purchase and installation of some new electric motors. This program is authorized to be funded through appropriations beginning at $80 million in 2011, and declining by $5 million each year until 2015. Title III—Reducing Global Warming Pollution Title III creates a cap-and-trade policy, a market-based incentive to reduce carbon emissions. This policy creates a price for greenhouse gas emissions that should induce investments in strategies to reduce these emissions, such as energy efficiency. In addition, the sale of allowances of carbon credits in the cap-and-trade system will provide funding for a number of important energy efficiency initiatives. Title VII—Global Warming Pollution Reduction Program Free allowances will be given to natural gas utilities beginning in 2016 (Section 782 (b)), one-third of which must be used specifically for energy efficiency. The allowances to gas efficiency will begin at 3% of total allowances in
22
EE in ACES, ACEEE
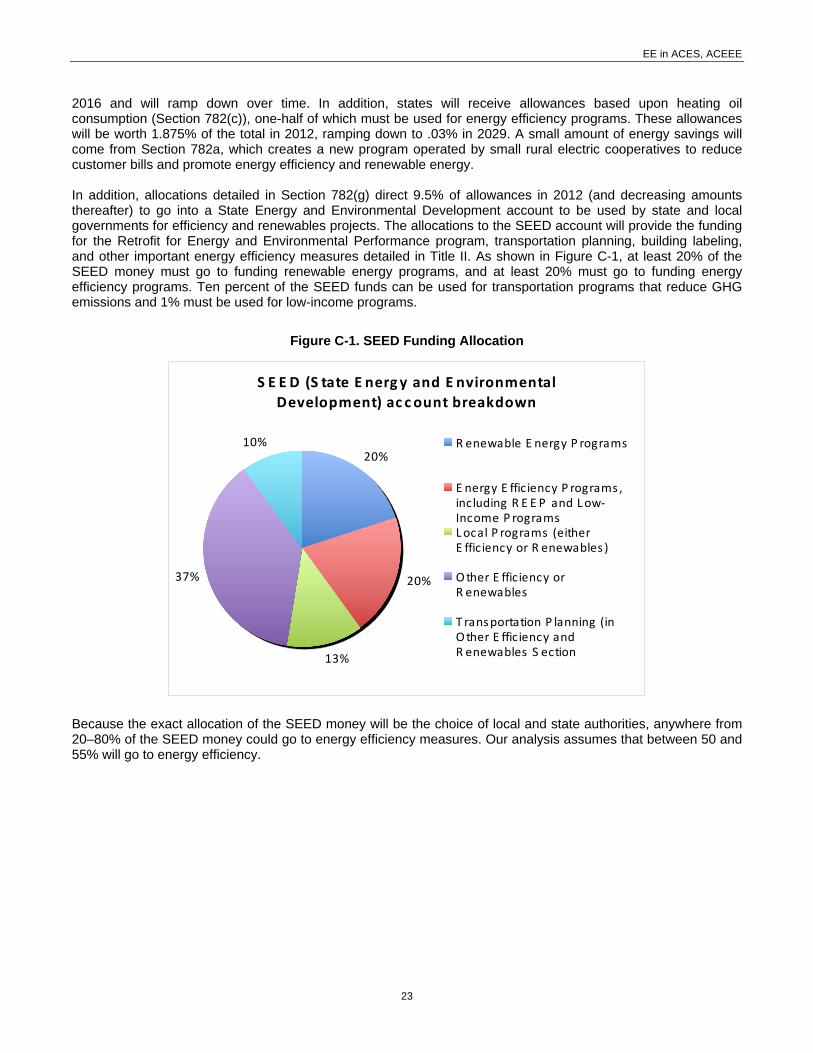
2016 and will ramp down over time. In addition, states will receive allowances based upon heating oil consumption (Section 782(c)), one-half of which must be used for energy efficiency programs. These allowances will be worth 1.875% of the total in 2012, ramping down to .03% in 2029. A small amount of energy savings will come from Section 782a, which creates a new program operated by small rural electric cooperatives to reduce customer bills and promote energy efficiency and renewable energy. In addition, allocations detailed in Section 782(g) direct 9.5% of allowances in 2012 (and decreasing amounts thereafter) to go into a State Energy and Environmental Development account to be used by state and local governments for efficiency and renewables projects. The allocations to the SEED account will provide the funding for the Retrofit for Energy and Environmental Performance program, transportation planning, building labeling, and other important energy efficiency measures detailed in Title II. As shown in Figure C-1, at least 20% of the SEED money must go to funding renewable energy programs, and at least 20% must go to funding energy efficiency programs. Ten percent of the SEED funds can be used for transportation programs that reduce GHG emissions and 1% must be used for low-income programs.
Figure C-1. SEED Funding Allocation
S E E D (S tate E nergy and E nvironmental Development) ac count breakdown
20%
13%
37%
10%
20%
R enewable E nergy P rograms
E nergy E fficiency P rograms ,including R E E P and Low‐Income P rogramsLocal P rograms (eitherE fficiency or R enewables )
Other E fficiency orR enewables
T ransportation P lanning (inOther E fficiency andR enewables S ection
Because the exact allocation of the SEED money will be the choice of local and state authorities, anywhere from 20–80% of the SEED money could go to energy efficiency measures. Our analysis assumes that between 50 and 55% will go to energy efficiency.
23

EE in ACES, ACEEE
24
EE in ACES, ACEEE
APPENDIX D. METHODOLOGY FOR THE ASSESSMENT OF ENERGY EFFICIENCY PROVISIONS IN ACES Introduction The American Clean Energy Security Act of 2009 (H.R. 2454, or ACES), which passed the House of Representatives on June 26, 2009, includes important energy efficiency provisions. ACEEE produced several preliminary, national-level analyses of the various iterations of ACES as the bill worked toward passage. We update our assessment of the national impacts of the energy efficiency provisions in ACES as passed by the House in this report, and project the impacts on each of the 50 states. In addition, this analysis contains an enhanced scenario, which modifies three provisions in ACES to enhance the energy savings that would result for the legislation: • Modify the Combined Efficiency and Renewable Electricity Standard in Section 101 to be a stand-alone
renewable electricity standard and a stand-alone cumulative 10% energy efficiency resource standard in 2020. The level of electricity savings required under the EERS would begin at 0.75% of the 2 prior years’ sales in 2012 and slowly ramp up to 1.5% savings in 2020. The standard is expressed in cumulative terms (10%) because efficiency measures installed in early years will continue to save energy throughout the compliance period such that total energy savings in 2020 will be 10% of 2018 and 2019 sales. This proposed increase in energy efficiency targets is exclusive of building codes and appliance standards, and does not allow for interstate trading of energy efficiency savings.
• Require that one-third of the free credits allocated to electric local distribution companies is directed to energy efficiency similar to the manner in which one-third of natural gas credit allocations is devoted to energy efficiency in Section 782(b). ACES does not specify how the electric LDC allocation is to be spent.
• Extend the allocation of allowance revenue to the State Energy and Environmental Development fund. ACES ramps down SEED fund spending beginning in 2016, and we explore the potential benefits of maintaining the 9.5% allocation out to 2030. A billion dollars per year of these extra funds would be allocated to transportation planning, with the rest funding a variety of different types of building retrofits.9
This analysis is intended to demonstrate the potential benefits of ACES in individual states. In addition, the model has the ability to explore various changes that may be made to this energy and climate legislation as it progresses through the Senate. This appendix explains the construction of the Excel model used in this analysis and presents the key assumptions that were made in this analysis. Methodology The foundation of this model is an assessment of each of the energy efficiency provisions in ACES at the national level. This analysis projected the aggregate energy savings, economic savings, and net jobs creation for the bill as a whole. In addition, energy savings, economic savings, and created jobs were aggregated for key sections of the bill, including EERS, SEED fund allocations, utility allocations, standards, and transportation (see Appendix C for details of these provisions). ACEEE’s analysis focuses on provisions from the Clean Energy (Title I) and Energy Efficiency (Title II) titles in ACES as well as allocations of carbon allowance revenues from certain cap-and-trade provisions in Reducing Global Warming Pollution (Title III) as presented in Table 1 on page 1 in the body of this report. The approach used to model each provision was developed by research leads at ACEEE. A brief overview of each approach follows: • The impacts for the EERS were calculated by adapting the model developed for the ACEEE report, Laying
the Foundation for Implementing a Federal Energy Efficiency Resource Standard (Furrey et al. 2009). • The impacts of the energy efficiency in the SEED allocations were based on the projected savings from
building codes (Section 201), building retrofits (Section 202), manufactured homes (Section 203), building
9 This represents 48% of the recommended additional funding in 2016, decreasing to 20% of the recommended increase in funding in 2030.
25
EE in ACES, ACEEE
labeling program (Section 204), low-income weatherization (Section 782g), and transportation planning (Section 841).
Savings for SEED allocations were apportioned based upon the language in Section 131 of the bill, which specifies that one-third of the allocations be divided equally among the states, one-third be distributed based on population, and one-third be distributed based upon energy consumption of each state. Factors were created for each state and each fuel type in 2020 and 2030 based upon projections of the above data from the Census Bureau (2009) and EIA data (2009a, c & d), and these factors were applied to total SEED costs and total SEED benefits from ACEEE’s national aggregate values.
• The provisions incorporated in the calculation of savings from utility allocations included Section 782(a)
regarding allowances to rural electricity cooperatives, Section 782(b) regarding natural gas utilities, and Section 782(c) relating to home heating oil and propane. The “enhanced case” also includes savings from allocating one-third of electric utility allowances to energy efficiency.
• Those provisions in the category of “other” include the smart grid provisions (Sections 142 and 144), R&D
(Section 173), Building Assessment Centers (Section 173), lighting and appliance standards (Sections 211-213), BICAD (Section 214), heavy-duty vehicle emissions (Section 821), and the motor efficiency rebate program (Section 245).
The next sections provide details on key aspects of the analysis, identifying key assumptions and data sources used. Federal Legislative Scoring Methodology For each of the policies mentioned below, this analysis estimates energy savings in 2020 and 2030. Estimates were calculated for electricity use, peak energy demand, natural gas use, oil savings (including motor gasoline, diesel, and home fuel oil), and all energy sources together. This analysis also estimates federal, state/utility, and consumer costs, as well as gross consumer savings (based upon dollar savings from unused energy) and net consumer savings. In general, EIA’s Annual Energy Outlook 2009 (EIA 2009g) was used as the reference case. A number of key assumptions were taken from this document. These assumptions included projected energy prices and consumption by sector and by fuel type, power plant heat rates, and carbon dioxide emissions per unit of fuel saved. To estimate peak demand savings, we used the ratio of peak demand savings per unit reduction in electricity sales from an EIA study of demand-side management (EIA 2000). ACES provides funding for many of the energy efficiency policies through emissions allowances from cap-and-trade revenue. These provisions were scored in this report using the percentages of allowances specified in the bill and the projections of carbon prices in the ADAGE and IGEM results (averaged together) from EPA’s analysis of ACES (EPA 2009). In addition, a few sections of the bill authorize the establishment of a specific program, sometimes with an accompanying funding level. However, these authorizations must be followed by an explicit appropriation of funds, handled by the House and Senate Appropriations Committees. As a result, our estimates assume less than the full amount of funding, with estimates at about 50% of the recommended level of authorization. Interest Rates Used To calculate annualized net consumer investment values, we amortized consumer investments for each provision in a given year (and in years with savings from prior investments) using an interest rate of 4.5% and measure lives in Table D-1. 4.5% reflects the average utility discount rate used in DSM filings and plans (Nadel 2004). These amortized net investment values were subtracted from the gross savings to calculate net savings. For the Combined Efficiency and Renewable Electricity Standard (Section 101), total costs were amortized, then subtracted from the gross savings.
26
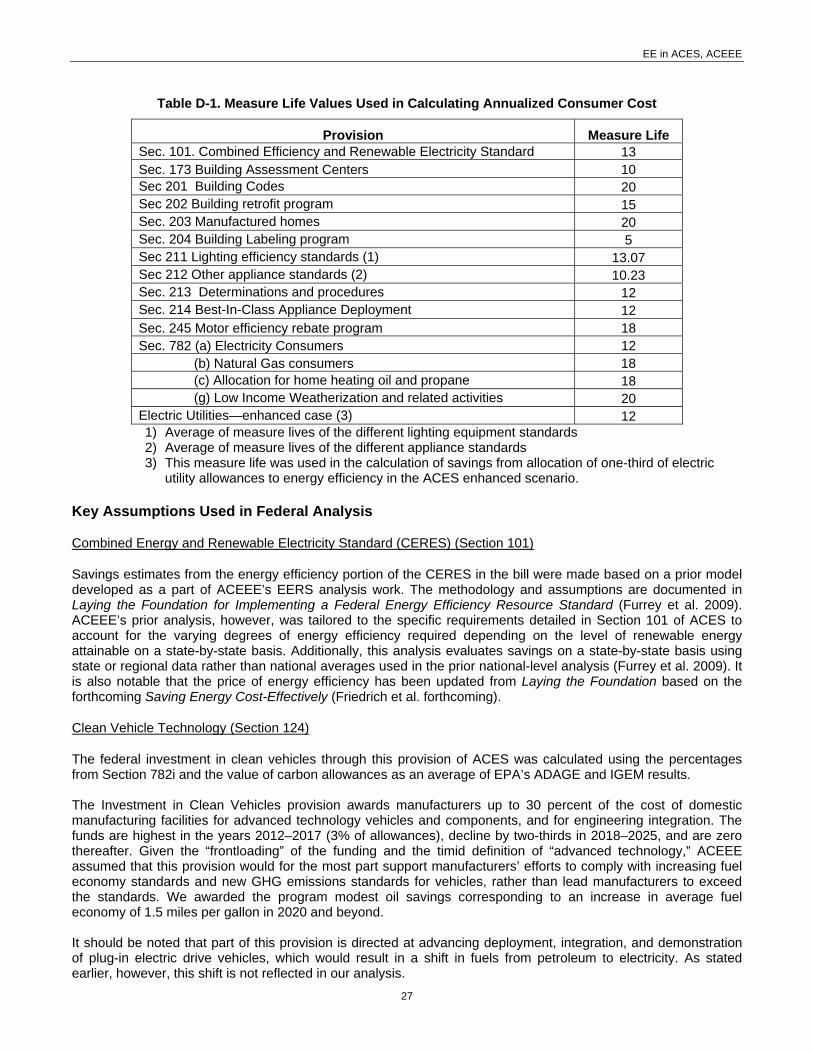
EE in ACES, ACEEE
Table D-1. Measure Life Values Used in Calculating Annualized Consumer Cost
Provision Measure Life Sec. 101. Combined Efficiency and Renewable Electricity Standard 13 Sec. 173 Building Assessment Centers 10 Sec 201 Building Codes 20 Sec 202 Building retrofit program 15 Sec. 203 Manufactured homes 20 Sec. 204 Building Labeling program 5 Sec 211 Lighting efficiency standards (1) 13.07 Sec 212 Other appliance standards (2) 10.23 Sec. 213 Determinations and procedures 12 Sec. 214 Best-In-Class Appliance Deployment 12 Sec. 245 Motor efficiency rebate program 18 Sec. 782 (a) Electricity Consumers 12
(b) Natural Gas consumers 18 (c) Allocation for home heating oil and propane 18 (g) Low Income Weatherization and related activities 20
Electric Utilities—enhanced case (3) 12 1) Average of measure lives of the different lighting equipment standards 2) Average of measure lives of the different appliance standards 3) This measure life was used in the calculation of savings from allocation of one-third of electric
utility allowances to energy efficiency in the ACES enhanced scenario. Key Assumptions Used in Federal Analysis
Combined Energy and Renewable Electricity Standard (CERES) (Section 101)
Savings estimates from the energy efficiency portion of the CERES in the bill were made based on a prior model developed as a part of ACEEE’s EERS analysis work. The methodology and assumptions are documented in Laying the Foundation for Implementing a Federal Energy Efficiency Resource Standard (Furrey et al. 2009). ACEEE’s prior analysis, however, was tailored to the specific requirements detailed in Section 101 of ACES to account for the varying degrees of energy efficiency required depending on the level of renewable energy attainable on a state-by-state basis. Additionally, this analysis evaluates savings on a state-by-state basis using state or regional data rather than national averages used in the prior national-level analysis (Furrey et al. 2009). It is also notable that the price of energy efficiency has been updated from Laying the Foundation based on the forthcoming Saving Energy Cost-Effectively (Friedrich et al. forthcoming).
Clean Vehicle Technology (Section 124)
The federal investment in clean vehicles through this provision of ACES was calculated using the percentages from Section 782i and the value of carbon allowances as an average of EPA’s ADAGE and IGEM results. The Investment in Clean Vehicles provision awards manufacturers up to 30 percent of the cost of domestic manufacturing facilities for advanced technology vehicles and components, and for engineering integration. The funds are highest in the years 2012–2017 (3% of allowances), decline by two-thirds in 2018–2025, and are zero thereafter. Given the “frontloading” of the funding and the timid definition of “advanced technology,” ACEEE assumed that this provision would for the most part support manufacturers’ efforts to comply with increasing fuel economy standards and new GHG emissions standards for vehicles, rather than lead manufacturers to exceed the standards. We awarded the program modest oil savings corresponding to an increase in average fuel economy of 1.5 miles per gallon in 2020 and beyond. It should be noted that part of this provision is directed at advancing deployment, integration, and demonstration of plug-in electric drive vehicles, which would result in a shift in fuels from petroleum to electricity. As stated earlier, however, this shift is not reflected in our analysis.
27
EE in ACES, ACEEE
Smart Grid in ENERGY STAR (Section 142)
We calculated the consumption of major appliances that would be eligible to join ENERGY STAR as smart grid products as a result of this provision, including cooling, refrigerators, and freezers. ENERGY STAR products make up about 25% of the current total appliance market, so savings of 3% were applied to this portion of sales then converted to MW using the assumption of 0.27 MW/GWh from DSM programs (EIA 2000). A 3% average peak demand savings was applied, assuming that there would be no savings for some products, and that savings would be higher than 3% for others (Faruqui and Sergici 2008). Energy savings were ramped up over 15 years, multiplying by 1/15 in Year 1, 2/15 in Year 2, etc. for full savings in Year 15. This analysis only calculates the avoided peak demand for 2020 and 2030; electricity and natural gas savings from smart grid in ENERGY STAR technologies would be negligible.
Smart Grid Peak Demand Reduction (Section 143)
Estimated U.S. generating capacity from EIA (2009g) was divided by 1.12 to represent an average reserve margin of 12%.10 We ramped up to a 5% reduction in peak demand over 10 years (Faruqui and Sergici 2008), and divided the total peak demand by 2 to account for the assumption that one-half of peak demand savings would occur without government intervention. To calculate the amount of actual energy saved from the peak demand reduction, a ratio of 113 kW/kWh was used (EPRI 2008).
Energy Innovation Hubs (Section 171) and Advanced Energy Research (Section 172)
We calculated the amount of the building, industry, and transportation related federal R&D investment from ACES by assuming that one-fourth of Energy Innovation Hubs would go to efficiency (with one-half of the investment to buildings, and one-half to transportation, because two of the eight Hubs proposed in the bill were dedicated to transportation and building efficiency), and estimated that one-third of Advanced Research Projects Agency- Energy (ARPA-E) would go to efficiency (divided by consumption patterns amongst buildings, transportation, and industry). We also compiled estimates of quad savings from DOE’s EERE program projections, specifically from transportation, buildings, and industry (NREL 2007). A ratio of ACES: DOE present investment was created and applied to the EERE savings in quads to estimate the total number of quads savings from ACES investments in efficiency R&D for each sector. The implementation of this ratio was delayed by 10 years for buildings and transportation and by 7 years for industry to reflect delays between investment and realized savings. In addition, a probability of success rate of 25% for buildings, 25% for industry, and 20% for transportation was applied, based on ACEEE judgment. A multiplier of one-third in 2020 and one-half in 2030 was also included for transportation R&D to reflect overlap with vehicle fuel economy standards, and a multiplier of two-thirds was applied for buildings to reflect those codes and standards already accounted for in estimates of savings from the bill. To figure out the distribution of fuel savings, we assumed that ARPA-E savings would follow total national fuel consumption patterns (EIA 2009g). For the Energy Innovation Hubs, one-half of the funds were for a transportation center, so we assumed that those savings were gasoline savings, and one-half were for buildings, so we used building fuel consumption patterns to distribute those fuel savings.
Building Assessment Centers (Section 173)
Building Assessment Center (BAC) savings were based upon a ramp-up to 75 centers in 2016 assuming 26 assessments/center/year, based on Industrial Assessment Center data. This is a new program, so the number of centers will initially be zero. This analysis calculated electricity, natural gas, and fuel oil use per square foot and assumed a mean commercial building size of 13,900 sq. ft. and energy savings of 10% to calculate savings from each assessment (EIA 2007).
10 ACEEE estimate.
28
EE in ACES, ACEEE
Building Codes (Section 201)
For commercial codes, we calculated the amount of electricity and natural gas consumed on average per square foot of commercial space. Those buildings affected by the code are new stock, so we used new additions as the amount of square footage participating, and then applied 35% electricity savings and 25% gas savings for an average of 30% in 2012 (two years of implementation time) and 55% electricity savings and 45% gas savings for average of 50% in 2014 for residential and 2015 for commercial codes, with an additional 5% improvement every three years after 2017/2018. It was assumed that 40 of the 50 states implement the codes. We also assumed that 70% of buildings would correctly implement the codes, increasing the implementation percentage by 5% every year. Each time a new level of savings is required by the bill, the percent of implementation moves back down to 80% and increases by 5% until the next standard is required. Each improvement in codes was delayed by an implementation period of two years, accounting for time for states to adopt and begin enforcing the codes. For residential codes, we calculated new additions to the residential stock of Single-Family Homes by subtracting the difference in the new stock from the previous year, and included an assumption that 1/100 of the stock would be lost to demolition each year (EIA 2009g). The amount of electricity and natural gas/home was calculated by dividing the delivered electricity and natural gas consumption by the number of homes. The same implementation assumptions for commercial buildings were used for residential buildings. Federal costs for this provision will be equivalent to 0.5% of allowance revenues. To assess the consumer costs, federal investment was subtracted from the savings from reduced energy bills, assuming a payback period of 7 years.
Building Retrofit Program (Section 202)
Estimates of savings from Home Retrofits were based upon participation levels derived from spending of allocations allowances. These are variable each year based on the value of the allowances and the percentage of allowances dedicated to the SEED funds. We assumed that 5.5% of the SEED money would go to Retrofit for Energy and Environmental Performance (REEP), and one-half of the additional non-allocated SEED funds would also go to REEP (half to home retrofits and half to commercial retrofits). The number of participating homes was calculated by assuming that administrative costs account for 15% of the SEED funds and that retrofits cost $3,000 per home. Energy savings were determined using estimates of 1,709 kWh11 of electricity saved per home and 30.6 MMBtu12 of natural gas saved per home, derived from NYSERDA home performance program results, but adjusted to reflect national average weather conditions (Jones 2009). We allocated the Btu savings using national figures for consumption of distillate fuel oil and natural gas. For Commercial Retrofits, we assumed the REEP funds would be equally allocated between residential and commercial retrofits. To calculate participation levels, we calculated the cost of the retrofits for 1 billion square feet, assuming a federal retrofit cost of $0.75/sq. ft., and used this amount per square footage to the amount of funding for commercial retrofits. Electricity, natural gas, and distillate fuel oil consumption and savings were calculated per square foot using EIA (2009g) total commercial consumption and total commercial square feet data, and 30% savings were assumed for electricity and 20% for natural gas and distillate fuel oil. The federal cost was calculated based upon the amount of funding assumed for REEP. Consumer costs were calculated by assuming a 1:1 ratio of federal to consumer costs, given a total cost of $1.50/square foot (Osborn et al. 2002).
Manufactured Homes (Section 203)
To calculate spending from manufactured homes, we assumed a ramp-up in spending from $150 million in 2012 to $500 million in 2015, then a spending level of $500 million from 2015–2030. This program will be funded by the SEED accounts, but the current version is not specific regarding the amount to be spent each year, so we used the above spending levels based upon an earlier version of the bill. To compute energy savings, a rebate cost of $7,500 was used to estimate the number of homes participating, and average savings of 6,200 kWh/home and 175 therms/home13 for ENERGY STAR homes over pre-1976 models were used. We allocated the Btu savings using national figures for consumption of distillate fuel oil and natural gas. 11 N.Y. is 934 kWh/home — we increase by an 1.83 multiplier based on US/NY avg. cooling 12 N.Y. is 40.2 mBtu — we discount by 24% based on NY/US avg. heating degree 13 This value is based on Levy (2009).
29
EE in ACES, ACEEE
Building Labeling/Disclosure (Section 204)
To calculate the number of homes participating in building labeling, we assumed a ramp-up to 1 million homes per year in 2013, and multiplied by the ratio of new households to total households (EIA 2009g) to reflect that the provision only applies to new construction. A measure life of 16 years for electricity measures as a result of labeling and 30 years for natural gas and fuel oil savings was used in residential buildings. The amount of electricity and natural gas consumption per home was calculated by dividing the delivered electricity and natural gas consumption by the number of homes. Similar approaches were used to calculate commercial building labeling savings, using the consumption per square foot of commercial space, and participation levels ramped up to the product of 1 billion square feet in 2013, and the percent of new square footage to reflect that the provision only applies to new construction. We used a measure life of 13 years for the electricity, natural gas, and fuel oil measures that result from labeling programs. Five percent savings were assumed from the program for both commercial and residential buildings. To calculate the federal costs, ACEEE estimated a cost of $50 million per year for the program, with $25 million/year for residential labeling and $25 million/year for commercial labeling. We used a 3-year payback period for all measures in calculating the consumer investments.
Lighting and Other Appliance Standards (Sections 211-212)
Energy savings from appliance standards were estimated using a complex spreadsheet created by ACEEE for the Appliance Standards Awareness Project (ASAP). The methodology and assumptions are detailed in an ACEEE/ASAP joint report, Ka-BOOM! The Power of Appliance Standards: Opportunities for New Federal Appliance and Equipment Standards (Neubauer et. al. 2009).
Determinations and Procedures (Section 213)
ACEEE calculated the subtotal of estimated savings from all applicable federal rulemakings as estimated in Ka-BOOM! The Power of Appliance Standards: Opportunities for New Federal Appliance and Equipment Standards (Neubauer et. al. 2009) and assumed 5% additional savings from the improvements to the rulemaking process specified in this section.
BICAD (Best-In-Class-Appliance-Deployment) (Section 214)
ACES authorizes $600 million per year for the first three years for BICAD, then “such sums as are necessary” in subsequent years. To account for differences between authorization and appropriation, we assumed that 50% of the authorized funds would be appropriated. We also extended the spending for an extra three years to account for “such sums as are necessary.” We also assumed that 10% of the appropriated funds would go toward program administration. To calculate energy savings from this provision, we used a levelized cost of saved energy of 6 cents/kWh, which equates to an upfront investment of approximately 60 cents per KWh saved. We apportioned savings to natural gas, fuel oil, and electricity based on the percentage of these sources used in applicable appliance consumption. Based on ACEEE judgment, we used an 8-year payback period to calculate the consumer investments.
Emissions Standards for Mobile Sources (Section 821)
The estimate of savings from GHG standards for heavy-duty trucks reflects EPA’s finding, in its 2008 ANPRM for regulating GHGs, of “a potential for up to a 40% reduction in GHG emissions from a typical heavy-duty truck in the 2015 timeframe, with greater reductions possible looking beyond 2015, through improvements in truck and engine technologies.” ACEEE’s estimate of the benefits of ACES for heavy-duty trucks follows from ramping up linearly, starting in 2010, to a 40% reduction in new truck emissions in 2015 and applying a stock model to determine GHG reductions from the entire truck stock. This may be optimistic, but we assigned no reductions to the standards for marine and aviation sources, so total reductions from vehicle standards may be understated.
30

EE in ACES, ACEEE
Also, savings from heavy-duty truck GHG standards in the ACES bill phase out after the early years, because only the incremental savings relative to truck fuel economy standards in EISA CAFÉ are included. The bill requires an earlier startup for EPA’s GHG standards than EISA requires for fuel economy standards.
Transportation Planning (Section 841)
The transportation planning section of the bill requires EPA, in consultation with DOT, to establish national GHG emissions reduction goals for the transportation sector that are “commensurate with the emissions reduction goals” established by the bill overall. ACEEE calculated the emissions reductions required in the transportation sector to match the overall percentage reduction goals of the bill in 2020 and 2030. We then assumed that the transportation planning provisions, together with transportation’s share of the SEED program, would achieve 10% of the emissions reductions required by reducing the demand for vehicle miles traveled. In the enhanced case, we assumed an extra billion dollars per year for transportation planning, and assumed that this tripling of the dollar investment increases savings by 50%. The increase in savings is small relative to the increase in investment, because we assume that the vehicle miles traveled reductions are driven primarily by the transportation sector GHG target.
Motor Efficiency Rebate program (Section 245)
Estimates from the Motor Efficiency Rebate program in the bill were made using a spreadsheet developed by Rob Boteler of Emerson Motor Company (Boteler 2009). Free Allowances Calculations Calculations of free allowances were based on an ACEEE analysis of electric allowances, which averages results from ADAGE and IGEM (EPA 2009). The cost of saved energy figures come from a forthcoming ACEEE study that cites an average levelized electric utility program cost of $0.025/kWh and a 12-year measure life. We used a 5% real discount rate (Friedrich et al. forthcoming). The electric Total Resource Cost (TRC) used was $0.046 per kWh. For natural gas programs, a gas utility program cost of $0.37/therm and an 18-year measure life were used. The gas TRC cost was measured at $0.68 per therm.
Rural Electric Utilities
To calculate the energy savings from rural electric utilities, we used the percentage of allowances given in Section 782(a) of the bill and assumed that 25% of the savings would go towards efficiency. We divided the total allowance value by the cost of saved energy (see "Free Allowances Calculations” above), and assumed that consumer investment was equivalent to the federal investment.
Natural Gas
To calculate energy savings from natural gas utility allowances, we used the carbon allowance values from EPA’s IGEM and ADAGE reports, and used the percentages from Section 782(b) to determine the total value of allowances. These values were reduced by one-third because one-third is allocated to energy efficiency programs in the bill. To account for business-as-usual natural gas program spending, we used the amount of natural gas spending ($292.8 million/year) in 2006 (Eldridge et al. 2008). To translate spending into energy savings, we used the cost and measure life data for natural gas programs (see "Free Allowances Calculations” above). We multiplied the amount of natural gas savings by a factor of 0.82 to account for a 0.82 consumer to federal investment match.
Home Heating Oil and Propane
To calculate energy savings from the heating oil and propane utility allowances, we used the carbon allowances values from EPA’s IGEM and ADAGE reports, and used the percentages from Section 782(c) to calculate the value of allowance. These values were divided in half because half of these funds are specifically allocated to energy efficiency programs in the bill. To translate spending into energy savings, we used the cost and measure life data for natural gas programs (see “Natural Gas” above). We multiplied the amount of savings by a factor of 0.82 to account for a customer investment to utility cost ratio.
31
EE in ACES, ACEEE
Low Income Weatherization (Section 131)
The federal cost of low-income weatherization was calculated using 1% of allowance value (as specified in Section 131). We assumed that 40% of the energy savings would come from saved electricity and 60% would come from saved natural gas, and that there would be an 10-year payback for electricity and natural gas measures (ORNL 2005).
State Energy and Environmental Development (SEED)
SEED accounts may be used for a variety of energy efficiency and renewable energy programs, detailed in Section 131, with between 20% and 80% of those programs required to be related to efficiency. Many of the programs mentioned above are funded by SEED account allowances, including building codes, manufactured homes, building labeling, low-income measures (at least 1% of total allowances), building retrofits, and REEP (at least 5.5% of SEED). In addition, not more than 10% of the SEED funds may be used for transportation planning purposes. The only specified energy efficiency related percentages in the bill are for REEP (5.5%) and low-income (1% of the total allowances), as well as building codes (0.5% of total allowances). To calculate federal investment amounts for different provisions, we subtracted those definite amounts and the amount dedicated to renewable energy sources from the total SEED allowances. Renewable energy investments account for at least 20% of the SEED funds, and we also assumed that half of the local SEED funds (12.5%) would be dedicated towards renewable energy. Because Section 131 is ambiguous regarding the amounts dedicated to each program (and it is likely that each state will make different choices about which programs to emphasize), we made some general assumptions about SEED funds invested in energy efficiency. We assumed that states would invest in the maximum allowable amount of transportation planning funding, 10% of SEED funding. We also assumed spending levels for manufactured housing of $50 million to $500 million between 2012 and 2015, then spending $500 million annually from 2015–2020. Because REEP will likely be a popular program with a high benefit-to-cost ratio, we determined that half of the funds not used by renewable energy, building codes, low-income, manufactured housing, or the 5.5% guaranteed to REEP would additionally be used by the REEP program. To calculate the federal costs for building labeling, ACEEE assumed a cost of $50 million per year for the program, divided equally between residential and commercial portions. Enhanced Case Assumptions
One-Third of Electric Utilities’ Allowances Invested in Energy Efficiency
Fifty percent of electric LDC allowances are allocated according to CO2 emissions, with the remaining 50% allocated according to electricity sales, relative to a base period of 2006 through 2008 (Section 783(b)). To determine state-by-state emissions, we multiplied state-specific CO2 emissions factors (eGrid 2007) by the amount of net generation for the given state in 2007 (EIA 2009i), the midpoint of the base period. The percentage of state level emissions, in million metric tons, relative to national CO2 emissions determines how emissions-based allowances are allocated. To calculate energy savings from the electric utility allowances dedicated to energy efficiency, we used the carbon allowance values from EPA’s IGEM and ADAGE reports, and used the percentages from Section 782(a) to calculate the value of allowances. These values were divided in half because half of these funds are specifically allocated to energy efficiency programs in the bill. To translate spending into energy savings, we used a price of 2.5 cents/kWh based on the ACEEE program cost review study (Friedrich et al. forthcoming). We multiplied the amount of savings by a factor of 0.82 to account for a customer investment: utility cost ratio. To account for the interaction between electric utilities and EERS, we assumed that savings from the one-third dedicated to energy efficiency for electric utilities would count towards a 10% EERS, and removed the amount of overlap savings from the electric utilities savings.
32
EE in ACES, ACEEE
SEED Enhanced Case
ACES ramps down SEED fund spending beginning in 2016, and we explored the potential benefits of maintaining the 9.5% allocation out to 2030. We assumed that $1 billion/year of these extra funds would be allocated to transportation planning, with the remainder funding a variety of different types of building retrofits (see “Building Retrofit program” assumptions above). Job Creation Impacts This section describes the approach used to develop the aggregate estimate of net total U.S. jobs created by the energy efficiency provisions in ACES as a nationwide estimate, allocated to each state. The jobs calculator used an input-output framework to evaluate the net jobs from energy efficiency provisions in ACES based on utility program spending, energy savings, federal investment (or utility incentive), and consumer investment. These expenditures tend to drive up employment activities. At the same time, the analysis also anticipates decreased revenues for the energy sectors of the economy, which tend to reduce employment in those sectors. It is calibrated to indicate the magnitude of net job creation at the national level. In effect, the job calculators take all of the pluses and minuses that result from the changed investment and spending patterns, and then multiply them by the appropriate job multipliers for each affected sector. The results are further multiplied by estimates of future labor productivity gains, which reduces the net gains as fewer people in the workforce are needed to deliver a given set of goods and services in the years 2020 and 2030. Total national jobs were then allocated to each of the states (plus the District of Columbia) using a ratio of the 2007 employment level to the 2007 energy bill expenditure, all based on the calculated net annual consumer savings for each state — with state-level jobs data available from the Bureau of Economic Analysis (BEA 2009) and state energy expenditures available from the EIA (2009f). The calculator estimated net annual job creation impacts for years 1–18 that result for the set of energy efficiency investments made by ACES. Year 1 begins when spending, not necessarily construction or use, begins on a project. Thus, the employment impact in Year 3 is the net change in jobs that result from any investments actually made in Years 1 and 2. Similarly, the listed employment impact in Year 18 is the aggregate of all prior efficiency improvement made in Years 1 through 18. Because of the sectoral interactive effects at this scale, which are not typically accounted for within the normal calculations, our analysis was further adjusted at the national level by a factor of 0.75 to ensure a more appropriate scale of results. This factor was determined by ACEEE’s revised DEEPER macroeconomic model.14
Description of Financial and Input Variables Used in Job Calculation Construction: This variable represents the total of all non-transportation-related investments in the bill, i.e., the total level of capital spending that results from any energy efficiency provision not related to transportation. This is the total expected capital expenditure financed through all sources of funds, including federal share, customer share, and borrowing. Electricity Savings: This variable is the projected dollar amount of annual electricity savings that occurs as a result of the energy efficiency provisions in ACES. Savings are based on the average national retail prices of electricity projected by EIA (2009g). These are reflected in the model as a negative impact to electricity-generating industries as a result of reduced demand. Natural Gas Savings: This variable is the projected dollar amount of annual natural gas savings that occurs as a result of the energy efficiency provisions in ACES. These savings are based on the average retail prices of natural gas projected by EIA (2009g) and are reflected in the model as a negative impact to natural gas-generating industries as a result of reduced demand. Auto Manufacturing and Sales: This variable is the total of all transportation-related investments in the bill, i.e., the total level of capital spending that results from any transportation energy efficiency provision. This is the total
14 DEEPER refers to the Dynamic Energy Efficiency Policy Evaluation Routine, a dynamic input output model of the U.S. economy based on 2007 national economic accounts. For further discussion on the DEEPER model, see Laitner (forthcoming).
33
EE in ACES, ACEEE
expected capital expenditure financed through all sources of funds, including federal share, customer share, and borrowing. Gasoline and Diesel Savings: This variable is the projected dollar amount of annual gasoline and diesel savings that occurs because of the energy efficiency provisions in ACES. These sales are based on the average retail prices of gasoline and diesel projected by EIA (2009g) and are reflected in the model as a negative impact to petroleum-generating industries as a result of reduced demand. It should be noted that some of the investment in vehicle technology will result in increase penetration of plug-in electric vehicles, which will replace some amount of petroleum usage with electricity usage. For simplicity, this replacement is omitted from the calculations. Home Heating Fuels: This variable is the projected dollar amount of annual home heating fuel savings that occurs as a result of the energy efficiency provisions in ACES. These savings are based on the average retail prices of home heating fuels projected by EIA (2009g) and are reflected in the model as a negative impact to home fuel oil-generating industries because of reduced demand. Government and Program Services: This variable is total government expenditures for program administration, assuming program administration is 13% of total costs, based on an ACEEE report, Saving Energy Cost-Effectively (Friedrich et al. forthcoming). In addition, two-thirds of SEED money for transportation planning is placed here to reflect that this funding is largely to enhance state and local capacity to integrate transportation and land use planning. Other: This category represents the sum of all savings (expenditures for electricity, natural gas, petroleum, and home heating oil), minus program expenditures, minus total investment, multiplied by the impact coefficients from the rest of the economy. The set of multipliers (Table D-2) used by the jobs model to provide estimates of net employment benefits refers to the direct and indirect jobs that are supported for every one million dollars of revenue received or lost by a particular sector of the U.S. economy. Direct jobs are those created by actual expenditures, and indirect jobs are those that are necessary to create the goods and services purchased in support of actual expenditures.
Table D-2. Impact Coefficients Used in Jobs Model
Final Demands Job Coefficient Construction 17.56 Electric Savings 6.71 Natural Gas Savings 7.47 Auto Mfg. and Sales 10.16 Gasoline Sales 11.76 Home Heating Fuels 9.28 Government and Program Services 20.01 Other 16.64
The reason for a small but net positive job benefit is that the energy-related sectors of the economy are not especially labor-intensive. The numbers reflect actual values taken from a variety of publicly available economic data and made available by the Minnesota IMPLAN Group.15 Therefore, as productive investments are increased in products or technologies that save money for businesses and consumers and as that money is spent on other goods and services within the U.S. economy, those differences in job multipliers suggest that a small net gain in total jobs should result from increased investment (like through the strengthening of the bill to include more efficiency investments). Allocation of Fuel Savings to States State level savings for each fuel type were projected by taking the total amount of each fuel saved at the national level and apportioning it based on each state’s percent of total consumption. For electricity, natural gas, and motor gasoline, 2008 state consumption data was used (EIA 2008; 2009a-f; FHA 2009). For fuel oil and diesel oil,
15 http://www.implan.com/.
34
EE in ACES, ACEEE
2008 national consumption was apportioned by assuming that state-by-state consumption patterns were the same as in 2006.16 To apportion the national figures to each state, a population growth factor was calculated for each state. This growth factor is the difference between the state’s total projected population for 2020 (and 2030) and total population in 2009 and assumes that energy consumption is proportional to population. The national fuel savings for each fuel were then multiplied by this population growth factor to determine state-level savings for each fuel type. This growth factor assumes that energy consumption is proportional to population. Monetary savings for each fuel were calculated using each state’s 2008 price of a given fuel, then multiplying by a ratio of 2020 or 2030 projected national prices: 2008 national prices. This factor assumes that the inter-fuel and inter-sector distribution of consumption and prices remains static. To calculate total savings from all fuels, the heat rates from EIA (2009g) were used. To estimate peak demand electricity savings, we used the ratio of peak demand savings per unit reduction in electricity sales from an EIA study of demand-side management (EIA 2000). Gross economic savings were calculated by combining the monetary savings from each of the five fuels. The ratio of each state’s gross fuel savings to total national gross fuel savings was calculated, and this ratio was applied to total national net savings to determine the amount of net savings for each state. Carbon dioxide emissions were also calculated using the ratio of each state’s gross fuel savings to the total national gross fuel savings. State-specific emissions factors only apply to electric power generation and were not used because of the inter-state wholesale transfer of electric power.
16 2008 data were not available for state-by-state fuel oil and diesel oil consumption at the time of this analysis. Data from the most recent year with complete data, 2006, was used.
35