impact of energy storage system response speed on enhanced
TRANSCRIPT

The University of Manchester Research
Impact of Energy Storage System Response Speed onEnhanced Frequency Response ServicesDOI:10.1109/ECCE.2019.8912725
Document VersionOther version
Link to publication record in Manchester Research Explorer
Citation for published version (APA):Zhu, Q., Bolzoni, A., Forsyth, A., & Todd, R. (2019). Impact of Energy Storage System Response Speed onEnhanced Frequency Response Services: 2019 IEEE Energy Conversion Congress and Exposition (ECCE). 2523-2529. Paper presented at 2019 IEEE Energy Conversion Congress and Exposition (ECCE), Baltimore, MD, UnitedStates. https://doi.org/10.1109/ECCE.2019.8912725Citing this paperPlease note that where the full-text provided on Manchester Research Explorer is the Author Accepted Manuscriptor Proof version this may differ from the final Published version. If citing, it is advised that you check and use thepublisher's definitive version.
General rightsCopyright and moral rights for the publications made accessible in the Research Explorer are retained by theauthors and/or other copyright owners and it is a condition of accessing publications that users recognise andabide by the legal requirements associated with these rights.
Takedown policyIf you believe that this document breaches copyright please refer to the University of Manchester’s TakedownProcedures [http://man.ac.uk/04Y6Bo] or contact [email protected] providingrelevant details, so we can investigate your claim.
Download date:07. Feb. 2022

This paper was published at the IEEE Energy Congress and Exposition
(ECCE) in Oct. 2019, DOI 10.1109/ECCE.2019.8912725, and is available at:
https://ieeexplore.ieee.org/stamp/stamp.jsp?tp=&arnumber=8912725
Q. Zhu, A. Bolzoni, A. Forsyth and R. Todd, "Impact of Energy Storage System
Response Speed on Enhanced Frequency Response Services," IEEE Energy
Conversion Congress and Exposition (ECCE), 2019, pp. 2523-2529, DOI:
10.1109/ECCE.2019.8912725.
© 2019 IEEE. Personal use of this material is permitted. Permission from the
IEEE must be obtained for all other uses, in any current or future media,
including reprinting/republishing this material for advertising or promotional
purposes, creating new collective works, for resale or redistribution to servers
or lists, or reuse of any copyrighted component of this work in other works.

Impact of Energy Storage System Response Speed
on Enhanced Frequency Response Services
Qingwei Zhu, Alberto Bolzoni, Andrew Forsyth, and Rebecca Todd
School of Electrical and Electronic Engineering,
The University of Manchester
Manchester, United Kingdom
[email protected], [email protected]
Abstract— This paper investigates the impact of energy
storage systems (ESSs) response speed on its ability to perform
fast frequency support services such as the UK’s enhanced
frequency response (EFR) services. The response time of a
commercial Siemens SieStorage 240kVA/180kWh grid-linked
battery energy storage system (BESS) is characterized and the
results are used to model an emulated BESS in a representative
micro-grid system using a real-time digital simulator (RTDS).
The SieStorage system is also linked to the RTDS micro-grid
through an Ethernet connection, forming a hardware-in-the-
loop (HIL) system. Simulations and then HIL tests of the
emulated BESS providing EFR to the micro-grid are
conducted to investigate the impact of the communication
latency, the physical power delivery time, and also the installed
capacity of the BESS. The study shows that the communication
latency has a much more significant impact than the physical
power delivery time; for better EFR support, reducing the
communication latency of a BESS could be even more effective
than increasing the power capacity, which is costly.
Keywords— Battery, energy storage system, enhanced
frequency response, hardware-in-the-loop, response time
I. INTRODUCTION
Driven by decarbonisation, the power networks in many countries worldwide are seeing a rapid increase in power-electronic-connected renewable generators [1-4] such as wind farms and photovoltaic plants, at both the transmission and distribution network level. However, the ever increasing penetration of these generators will lead to a more variable, less predictable grid system [5]. This is likely to increase the regularity and severity of frequency events [6] in future power systems and raises greater challenges for grid operators. Meanwhile, diverse energy storage systems (ESSs) including hydro, thermal, compressed-air, flywheel, battery, superconducting-magnetic systems, are being investigated as possible solutions to tackle the new challenges facing the grid. Amongst these different ESSs, battery storage [2, 7-10] is one type attracting particular interest due to its relatively high efficiency [9] and fast response speed.
Today, modern power systems such as those in the UK, Germany and Sweden [1] are embracing ESSs mainly for frequency regulation. In addition to the existing services like the short term operating reserve (STOR) and firm frequency response (FFR), the UK National Grid Electricity Transmission (NGET) network operator, operates a new faster frequency response service, called enhanced frequency response (EFR), to provide a fast response to support the grid
in times of low system inertia [3, 11]. There are two EFR service options, the wide band service (service1), which requires the ESS to respond when the frequency is outside of the range 49.95-50.05Hz, and the narrow band service (service2), where the dead-band is 49.985-50.015Hz. For both, NGET requires a response within one second and the capability to provide more than 1MW, either as a single site or as an aggregated ESS fleet. The first round of EFR tendering resulted in eight awards, totalling to 201MW, and all are battery energy storage system (BESS).
The majority of the published work on BESS, and especially that considering EFR is focused on state-of-charge (SoC) management [2, 7, 8, 12] with the exception of [6] which considered the BESS response time of 80ms, however this was an emulated system. In this paper, the impact of the BESS maximum power, and response speed on its ability to deliver EFR services is investigated. Firstly, a characterisation study on the response time of a commercial Siemens SieStorage 240kVA/180kWh BESS is carried out. Using the characterisation results an emulated BESS is modelled within a representative micro-grid system through a power system real-time digital simulator (RTDS). Comprehensive simulations are then undertaken to look at the impacts of the communication latency, delivery time, as well as the power capacity of the BESS on its ability to provide EFR to support the micro-grid. Both the wide band and narrow band EFR services are studied. Moreover, hardware-in-the-loop (HIL) tests with the SieStorage system linked to the RTDS micro-grid model are conducted to validate the simulation.
II. RESPONSE TIME CHARACTERASATION OF A COMMERTIAL
BATTERY ENERGY STORAGE SYSTEM
A. System description
The battery energy storage system studied is a Siemens SieStorage, shown in Figure 1. The nominal power/energy capacity of the SieStorage is 240kVA/180kWh. The battery comprises four racks, each consist of fourteen 48V lithium-ion polymer UPB4860 modules manufactured by LG Chem. The system is connected to the local low-voltage distribution grid via a 260kVA, 400/433V transformer. The system has a three-level hierarchical control architecture as shown in Figure 2. The lowest accessible level of control is the programmable logic controller (PLC), which directly interfaces with the battery management system, the protection relays, the circuit breakers, the cycle-to-cycle controller for the power converters, and all other subsystems within SieStorage. The PLC communicates with a dSPACE
This work was supported by the UK Engineering and Physical Sciences
Research Council (EPSRC) under the Multi-scale ANalysis for Facilities
for Energy STorage (Manifest) project [EP/N032888/1].

real-time platform (DS1007) through a Profibus connection. The dSPACE platform is the central controller of SieStorage, and it is interfaced using TCP/IP Ethernet to the RTDS, which in this study is used to represent a remote controller like an ESS aggregator or grid transmission system operator (TSO).
Figure 1. SieStorage battery energy storage system.
Figure 2. Diagram of the three-level control structure of SieStorage.
B. Response Time Characterisation Tests
The response time of SieStorage, from when a setpoint is sent from the remote controller (RTDS) to when the remote controller receives measured data showing delivery of the setpoint, has been characterized through a series of step power tests and a set of continuous power tests. The step tests cover three different levels of power, 80kW, 160kW, and 240kW, and four different SoC levels, 25%, 45%, 65%, and 85%. As an example, Figure 3(a) shows the power profile from the 240kW step test with a battery SoC of 65%. The continuous power tests include six ramp tests with different ramp rates, ±60kW/s, ±120kW/s, ±240kW/s, (the +60kW/s case is shown in Figure 3(b)), and two arbitrary real power tests resembling an over-frequency EFR event and a down-frequency EFR event, which is shown in Figure 3(c). The communication latencies t1, t2 between the controllers shown in Figure 2, the grid-side line current transient time ttran, the physical execution time texcu, and the total response time tresp, of SieStorage are all investigated.
The plots in Figure 3 show four waveforms captured in the RTDS, the setpoint from the RTDS simulator ‘RTDS to dSPACE’, the setpoint that dSPACE received from RTDS and passes to SieStorage ‘dSPACE to SieS’, the SieStorage accepted value ‘SieS accepted’, and the SieStorage output power measurement ‘SieS measured’. A Yokogawa PX8000 power analyser was used to measure the grid-side, three-phase, line-to-line voltages and line currents to obtain the instantaneous power ‘Actual measured’.
(a)
(b)
(c)
Figure 3: Measured power profile samples of the characterization tests, (a) step tests at the power level of 240kW and SoC of 65%, (b) +60kW/s ramp
test, (c) down-frequency EFR-emulating arbitrary real power test.
In Figure 3 the main latencies are between ‘dSPACE to SieS’ and ‘SieS accepted’, and between ‘SieS accepted’ and ‘SieS measured’. To investigate this further, the known, measurable communication latencies are sketched in Figure 4, showing the control and response sequences of SieStorage.
Controllers
External interface
Battery racks
tresp
tresp
polynomially fitted ‘SieS measured’
polynomially fitted
‘SieS measured’
tresp

In Figure 4, tdelay is the time after subtracting t1, t2, and ttran from texcu, representing the time delay from the cycle-to-cycle controller of the power converter to the PLC. tdelay and ttran are merged to form Tdlv, to represent the total delivery time of the SieStorage power converter. And t1 and t2 are combined to form Tcomm, to represent the total communication delay of SieStorage to receive commands from a remote controller.
Figure 4. Control and response sequences of SieStorage.
t1 and t2 are then estimated according to Figure 4 by comparing the ‘dSPACE to SieS’ signal, the ‘SieS accepted’ signal to the initiating signal ‘RTDS to dSPACE’, respectively. ttran is only investigated in the step tests, by identifying the 2%, and the 98% values of the line current to determine the physical start time and fulfilment time for each command; then ttran and texcu is evaluated. For the step test, tresp is estimated by identifying the moment of when the new setpoint is reached on the ‘SieS measured’ signal, which is indicated with the arrow in Figure 3(a).
For the continuous tests, the measured instantaneous power curve ‘Actual measured’ is polynomially fitted, and texcu is estimated by comparing this poly-fitted curve to the original ‘RTDS to dSPACE’ signal. The power curve ‘SieS measured’ is also polynomially fitted as shown in Figure 3(b) and Figure 3(c), to calculate the averaged tresp.
C. Results
The detailed characterisation results of SieStorage’s response time are summarised in Table I. The remote-to-local communication latency t1 (between ‘RTDS to dSPACE’ and ‘dSPACE to SieS’) is approximately 4ms, while the communication latency t2 (between ‘dSPACE to SieS’ and ‘SieS accepted’) is an average of 86ms, due to the loop-back acknowledgement algorithm [13] implemented in the dSPACE controller of the SieStorage system.
TABLE I. RESPONSE TIME CHARACTERISATION RESULTS
test step tests (kW) Ramp tests (kW/s) EFR tests
80 160 240 60 -60 120 -120 240 -240 EFR1 EFR2
t1(ms) 5.0 3.0 3.1 4.3 5.1 4.5 4.5 5.4 5.2 2.8 3.1
t2(ms) 84 86 90 87 84 86 87 84 87 84 86
texcu(ms) 143 158 167 157 154 181 177 160 167 156 150
tresp(ms) 570 582 653 478 477 477 480 497 477 469 465
ttran indicates the response time of the power converter, and texcu represents the actual performance of the BESS from the change in set-point to SieStorage delivering the new set-point. Step test results of ttran and texcu are shown in Figure 5. Both ttran and texcu increases approximately linearly with power level, but are not significantly affected by the SoC of the battery. The average ttran for delivering full real power from zero is around 45ms. ttran for a power reversal command from full charge/discharge to full discharge/charge, takes 56ms on average. All these transient times are within three utility cycles, indicating the high performance of the power converter of this commercial BESS.
(a) (b) Figure 5: Response times of SieStorage system. (a) ttran, (b) texcu.
texcu has negligible dependence on power, or SoC, and is an average 162ms. texcu shows the time from the remote controller RTDS commanding a setpoint change, to SieStorage delivering the new response, however RTDS does not know the change in SieStorage output until tresp.
tresp was measured to be in the range of 465-497ms with a high consistency in the continuous tests, and the average value of tresp is 477ms; while the value of tresp estimated from the step tests is 602ms on average. The difference of 125ms between them is approximately half of the SieStorage system’s measurement sampling time (around 260ms measured), which is due to the polynomial fitting process for tresp evaluation of the continuous tests as shown in Figure 3(b) and Figure 3(c). However, continuous power operation rather than delivering abrupt large power steps is how a BESS works in real application scenarios like providing EFR, therefore, 477ms is taken as the total response time of SieStorage.
Figure 6 shows the breakdown of texcu, and for SieStorage, Tcomm is the dominant portion (almost 56%) of the total response time texcu. The following section investigates how Tdlv and Tcomm of a BESS affect its ability to provide EFR services.
Figure 6. Breakdown of texcu of SieStorage.

III. SIMULATION STUDY ON THE IMPACT OF RESPONSE TIME
FOR ENHANCED FREQUECY RESPONSE SERVICES
A. RTDS Model Description
A representative lumped micro-grid model (shown in Figure 7) consisting of a synchronous generator (SG), an emulated BESS, and dynamic loads is programmed in RTDS to enable quick evaluation of the impact of different response times and power ratings. The inertia constant of the 10MVA SG is set to 2.5MJ/MVA, which is consistent with the estimated overall inertia of the UK power system [5]. The emulated BESS in this study is modelled by a dynamic AC source from the RTDS component library, and its power capacity PBESS is set to 0.5MW. The dynamic characteristic of this AC source is set according to the characterisation results of the SieStorage system as described in the previous section.
Figure 7: Diagram of the representative micro-grid system model.
B. Simulation Study on the BESS Response Time
A basic 10% load-generation imbalance event is studied to see how different response times of the emulated BESS affect its ability to provide EFR services to support the micro grid. The simulation scenario is described as follows, initially the system is operated in a load-generation balanced state of 5MW, then at t=2s, a 0.5MW (10% of the base load) new load is added to the micro-grid system. This stepped load event automatically triggers the primary regulation of the SG and causes the frequency of the micro-grid system to deviate from the nominal value of 50Hz.
The resultant frequency drop, in particular the frequency nadir Δfmax (maximum frequency deviation), which occurs at the early stage of the primary control of the generator, is considered in this simulation study. f profiles without and with the BESS providing EFR are compared. Both the wide band EFR service1 and narrow band EFR service2 are studied; and in the simulation, the EFR P(f) curve [11] is defined by the EFR dead band frequencies (49.985Hz and 50.015Hz for service2 as shown in Figure 7) and the EFR threshold frequencies (49.5Hz and 50.5Hz). Due to the shortness of the EFR timescale, secondary regulation of the SG is not considered in this study. Five communication latency Tcomm settings, 0.01s, 0.05s, 0.1s, 0.2s, and 0.5s, and five delivery time Tdlv settings, 0.06s, 0.1s, 0.15s, 0.2s, and
0.3s, are compared. The impact of the installation capacity PBESS of the emulated BESS is also investigated; four different power ratings, 0.25MW, 0.5MW, 0.75MW, and 1.0 MW, are compared.
(a)
(b)
(c)
Figure 8. Sensitivity of the BESS’s EFR performance to Tdlv, narrow band EFR service2. (a) PBESS=0.5 MW, Tcomm=0.1s, (b) PBESS=0.5MW, Tcomm=0.5s, (c) PBESS=1.0 MW, Tcomm=0.1s.
C. Simulation Results
The sensitivity of the BESS power converter’s delivery time Tdlv on EFR performance is first investigated. The frequency transient profiles with the BESS having two different values of Tcomm, 0.1s and 0.5s, and two different power capacities PBESS, 0.5MW and 1MW, are shown in
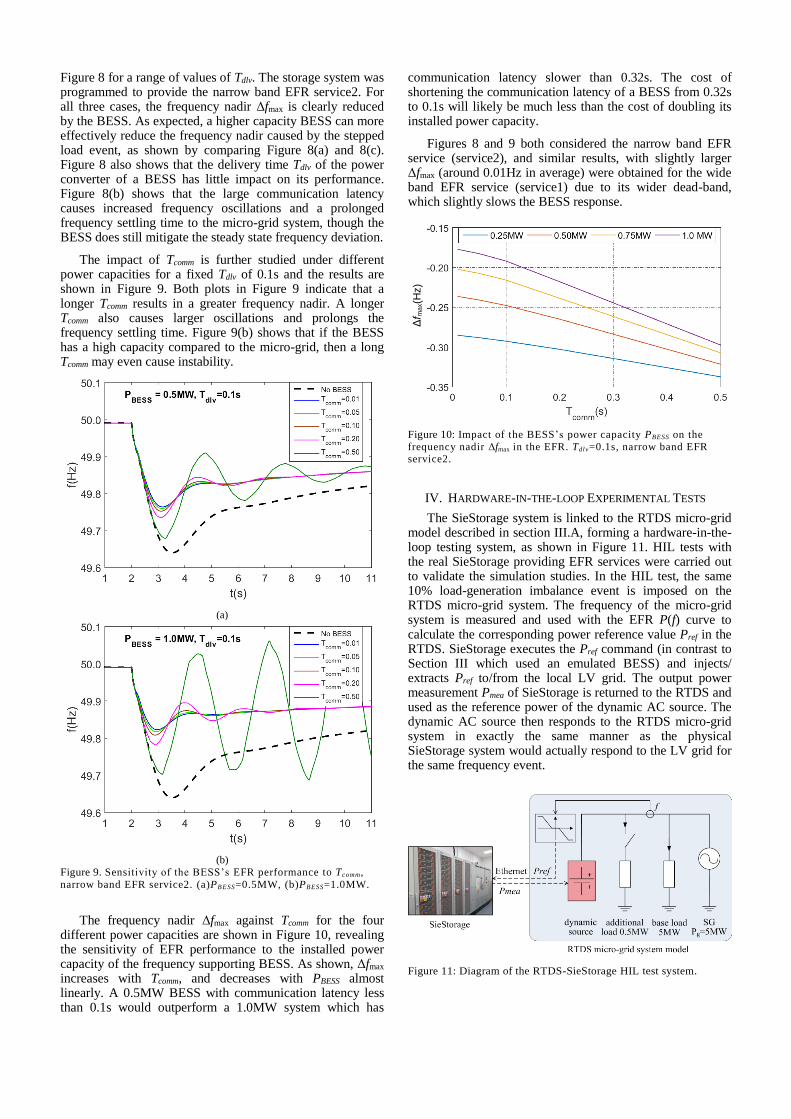
Figure 8 for a range of values of Tdlv. The storage system was programmed to provide the narrow band EFR service2. For all three cases, the frequency nadir Δfmax is clearly reduced by the BESS. As expected, a higher capacity BESS can more effectively reduce the frequency nadir caused by the stepped load event, as shown by comparing Figure 8(a) and 8(c). Figure 8 also shows that the delivery time Tdlv of the power converter of a BESS has little impact on its performance. Figure 8(b) shows that the large communication latency causes increased frequency oscillations and a prolonged frequency settling time to the micro-grid system, though the BESS does still mitigate the steady state frequency deviation.
The impact of Tcomm is further studied under different power capacities for a fixed Tdlv of 0.1s and the results are shown in Figure 9. Both plots in Figure 9 indicate that a longer Tcomm results in a greater frequency nadir. A longer Tcomm also causes larger oscillations and prolongs the frequency settling time. Figure 9(b) shows that if the BESS has a high capacity compared to the micro-grid, then a long Tcomm may even cause instability.
(a)
(b)
Figure 9. Sensitivity of the BESS’s EFR performance to Tcomm,
narrow band EFR service2. (a)PB ESS=0.5MW, (b)PBESS=1.0MW.
The frequency nadir Δfmax against Tcomm for the four different power capacities are shown in Figure 10, revealing the sensitivity of EFR performance to the installed power capacity of the frequency supporting BESS. As shown, Δfmax increases with Tcomm, and decreases with PBESS almost linearly. A 0.5MW BESS with communication latency less than 0.1s would outperform a 1.0MW system which has
communication latency slower than 0.32s. The cost of shortening the communication latency of a BESS from 0.32s to 0.1s will likely be much less than the cost of doubling its installed power capacity.
Figures 8 and 9 both considered the narrow band EFR service (service2), and similar results, with slightly larger Δfmax (around 0.01Hz in average) were obtained for the wide band EFR service (service1) due to its wider dead-band, which slightly slows the BESS response.
Figure 10: Impact of the BESS’s power capacity PBESS on the
frequency nadir Δfmax in the EFR. Tdlv=0.1s, narrow band EFR service2.
IV. HARDWARE-IN-THE-LOOP EXPERIMENTAL TESTS
The SieStorage system is linked to the RTDS micro-grid model described in section III.A, forming a hardware-in-the-loop testing system, as shown in Figure 11. HIL tests with the real SieStorage providing EFR services were carried out to validate the simulation studies. In the HIL test, the same 10% load-generation imbalance event is imposed on the RTDS micro-grid system. The frequency of the micro-grid system is measured and used with the EFR P(f) curve to calculate the corresponding power reference value Pref in the RTDS. SieStorage executes the Pref command (in contrast to Section III which used an emulated BESS) and injects/ extracts Pref to/from the local LV grid. The output power measurement Pmea of SieStorage is returned to the RTDS and used as the reference power of the dynamic AC source. The dynamic AC source then responds to the RTDS micro-grid system in exactly the same manner as the physical SieStorage system would actually respond to the LV grid for the same frequency event.
Figure 11: Diagram of the RTDS-SieStorage HIL test system.
Δf m
ax(H
z)

As the capacity of the micro-grid is an order of magnitude larger than that of the SieStorage system, a scale on Pmea is applied. In the HIL experiments, two cases, with the 240kVA SieStorage system scaled up to a 0.5MW and a 1.0MW emulated BESS in the micro-grid model, are studied. The measurements and results are shown in Figure 12 and 13, respectively.
(a)
(b)
Figure 12. 0.5MW HIL test results. (a) frequency transient in the
simulation and HIL test , (b) measured power and line currents of
SieStorage in the service2 test case.
(a)
(b)
Figure 13. 1.0MW HIL test results. (a) frequency transient, (b) measured power and line currents of SieStorage.
For both EFR service1 and service2, and for both the 0.5MW scaling case and the 1.0MW scaling case, a consistent match (frequency difference less than 0.02Hz) between the measurements of the HIL tests and the RTDS simulation have been achieved, as shown in Figure 12(a) and Figure 13(a). In accordance with the findings in section III.B, the HIL tests also show the increased frequency oscillation and prolonged frequency settling time caused by the long communication latency (around 477ms as identified in section II.C) of the SieStorage system. Also due to the long communication latency, the 1.0MW scaled BESS system just outperformed the 0.5MW scaled BESS by 0.03Hz. All the HIL test results match well with those from the simulation study.
V. CONCLUSION
The enhanced frequency response (EFR) services that the UK National Grid operator brought to market in 2016 are the latest frequency regulation products and also the most demanding ones on the response speed of the participating ESSs. This paper investigates the impacts of the response time of a BESS to its EFR performance. Comprehensive characterization of a 240kVA/180kWh commercial BESS SieStorage is conducted, showing that it has an average response time of 0.162s, this includes a communication latency of around 90ms from the remote controller to the storage site, and a physical delivery time of about 72ms. Based on the characterization results, SieStorage is then modelled within a representative micro-grid using RTDS. The impacts of the communication latency, the delivery time, the installed power capacity of the BESS, as well as the EFR service type is then investigated by simulation. Further, the commercial SieStorage system is linked to the representative micro-grid system forming a hardware-in-the-loop test platform. HIL tests on two different BESS power capacity cases for both the two types of EFR are conducted and the results are in high consistency with the simulation.
It is found in this study that the EFR performance of a BESS is greatly dependent on the communication latency, whereas the physical delivery time of the BESS power converters makes little difference if their delivery capability is less than 0.2s, which is not a particularly demanding requirement for modern power electronics. The findings indicate the importance of reducing the communication latency of EFR oriented BESSs. It also raises questions about how an aggregator should best combine assets with dissimilar characteristics to provide EFR services. It is also found that using a BESS to provide service2 EFR could achieve a slightly better frequency regulation than offering service1.
REFERENCES
[1] R. Hollinger, A. M. Cortes, and T. Erge, "Fast Frequency Response
with BESS: A Comparative Analysis of Germany, Great Britain and Sweden," in 2018 15th International Conference on the European Energy Market (EEM), 2018, pp. 1-6.
[2] B. M. Gundogdu, S. Nejad, D. T. Gladwin, M. P. Foster, and D. A. Stone, "A Battery Energy Management Strategy for U.K. Enhanced Frequency Response and Triad Avoidance," IEEE Transactions on Industrial Electronics, vol. 65, pp. 9509-9517, 2018.
[3] N. grid, "Enhanced Frequency Response Market Information Report," Available: https://www.nationalgrideso.com/sites/eso/files/documents /EFR%20Market%20Information%20Report%20v1.pdf, 2016.
f (H
z)
f (H
z)

[4] A. Adrees and J. V. Milanovic, "Study of frequency response in power system with renewable generation and energy storage," in 2016 Power Systems Computation Conference (PSCC), 2016, pp. 1-7.
[5] P. M. Ashton, C. S. Saunders, G. A. Taylor, A. M. Carter, and M. E. Bradley, "Inertia Estimation of the GB Power System Using Synchrophasor Measurements," IEEE Transactions on Power Systems, vol. 30, pp. 701-709, 2015.
[6] D. M. Greenwood, K. Y. Lim, C. Patsios, P. F. Lyons, Y. S. Lim, and P. C. Taylor, "Frequency response services designed for energy storage," Applied Energy, vol. 203, pp. 115-127, 2017/10/01/ 2017.
[7] S. Canevese, D. Cirio, A. Gatti, M. Rapizza, E. Micolano, and L. Pellegrino, "Simulation of enhanced frequency response by battery storage systems: The UK versus the continental europe system," in 2017 IEEE EEEIC / I&CPS Europe, 2017, pp. 1-6.
[8] B. Gundogdu, D. T. Gladwin, and D. A. Stone, "Battery SOC management strategy for enhanced frequency response and day-ahead energy scheduling of BESS for energy arbitrage," in IECON 2017, pp. 7635-7640.
[9] T. Feehally, A. J. Forsyth, R. Todd, M. P. Foster, D. Gladwin, D. A. Stone, et al., "Battery energy storage systems for the electricity grid: UK research facilities," in 8th IET PEMD 2016, 2016, pp. 1-6.
[10] J. Fang, Y. Tang, H. Li, and X. Li, "A Battery/Ultracapacitor Hybrid Energy Storage System for Implementing the Power Management of Virtual Synchronous Generators," IEEE Transactions on Power Electronics, vol. 33, pp. 2820-2824, 2018.
[11] nationalgridESO. (2019). Enhanced frequency response (EFR). Available: https://www.nationalgrideso.com/balancing-services/frequ -ency-response-services/enhanced-frequency-response-efr.
[12] M. Bahloul and S. K. Khadem, "Design and control of energy storage system for enhanced frequency response grid service," in 2018 IEEE ICIT, 2018, pp. 1189-1194.
[13] Alberto Bolzoni, Qingwei Zhu, Vasileios Tsormpatzoudis, Rebecca Todd, and Andrew Forsyth, "Dynamical Characterization of Grid-Scale Energy Storage Assets," in IECON 2019, under review.