impact of eu ets phase iv proposals on administrative ... · impact of eu ets phase iv proposals on...
TRANSCRIPT

Impact of EU ETS phase IV proposals on
administrative costs and quality of the
data collection process
ECOFYS Netherlands B.V. | Kanaalweg 15G | 3526 KL Utrecht| T +31 (0)30 662-3300 | F +31 (0)30 662-3301 | E [email protected] | I www.ecofys.com
Chamber of Commerce 30161191
Impact of EU ETS phase IV proposals on administrative costs and quality of the data collection process
Final version
By: Oskar Krabbe, Bram Borkent, Charles Bourgault & Cathrine Sachweh
Date: 14 March 2016
Project number: MARNL15562
Reviewer: Maarten Neelis
© Ecofys 2016 by order of: Dutch Emissions Authority/Nederlandse Emissieautoriteit (NEa)

ECOFYS Netherlands B.V. | Kanaalweg 15G | 3526 KL Utrecht| T +31 (0)30 662-3300 | F +31 (0)30 662-3301 | E [email protected] | I www.ecofys.com
Chamber of Commerce 30161191
Executive summary
For the next phase of the EU Emissions Trading Scheme (EU ETS Phase IV, from 2021 until 2030),
the European Commission and other stakeholders are considering an improved free allocation of
emission allowances. These changes may provide additional administrative costs and complexities,
which have had little attention so far. The additional administrative costs of free allocation being
better aligned with production levels may accumulate to €173 million for the entire Phase IV, more
than double the estimate of the EC impact assessment. Because of the interdependency with other
free allocation proposals, in particular a tiered system of free allocation, costs may increase even
further. We recommend to take these cost considerations into account in the decision making
process.
In order to prevent industrial production to move to regions outside the EU with lighter emission
reduction regimes (“carbon leakage”), free allowances are granted to companies in industrial sectors
that are subject to this risk. This report assesses the administrative costs of two main design
elements in the Phase IV proposals for free allocation. The first aspect regards following the changes
in an installation’s production more closely, leading to adjustments of free allowances. The second
aspect regards the classification of sectors into Carbon Leakage ‘tiers’. In addition, this report
provides an assessment of the timeline proposed towards Phase IV and the data collection processes
involved.
Proposal: Rules for changes in production levels
The Commission’s proposal suggests to update the level of free allocation every five years, using
historical production levels. In between, allocation will be updated for significant production changes
(we assume this replaces current rules on capacity changes) with a threshold that still needs to be
determined. Under the assumption that these rules replace current rules on capacity changes, this is
a simplification of the system. It would also provide additional allocation for increased production
within existing capacity, which is not possible under current rules.
Administrative costs depend heavily on the threshold level
The Commission’s proposal is not specific on the production level threshold. The Impact Assessment
(IA) that accompanies the proposals mentions a 15% threshold in a footnote. The IA estimates that
the additional costs for reporting production changes is slightly higher compared to current rules
(+ €3 million). The larger number of annual reports expected (about 2,000 installations) are offset by
the lower costs per installation.

ECOFYS Netherlands B.V. | Kanaalweg 15G | 3526 KL Utrecht| T +31 (0)30 662-3300 | F +31 (0)30 662-3301 | E [email protected] | I www.ecofys.com
Chamber of Commerce 30161191
Ecofys took a closer look at these costs and how they depend on the level of the threshold. To
calculate the administrative costs of annual production adjustments, we used CO2 emissions of
installations as a proxy for sub-installation production data. As a result, we estimate that at a 15%
threshold, an average of 44% of all ETS installations with free allocation (i.e. 4,270 installations) has
to report a significant production change each year (see Summary figure 1, left). This also implies
that most of the installations already would have to report a significant change for 2021, because
2013 - 2017 production data serving as the baseline for that year will likely be outdated. A threshold
of 50% would affect 16% of ETS installations per year on average (i.e. 1,514 installations).
As a result, administrative costs of reporting production adjustments depend heavily on the threshold
level. A 15% threshold corresponds to about €90 million additional administrative costs over the
phase IV trading period compared to the IA estimate. This translates to about €3.2 million additional
costs for the Dutch Emissions Authority. Administrative costs would not significantly increase
compared to the current rules if a threshold of around 40-50% would be taken (see Summary figure
1, right).
Summary figure 1: Share of installations exceeding a change in emissions (left) and related administrative costs
(right)
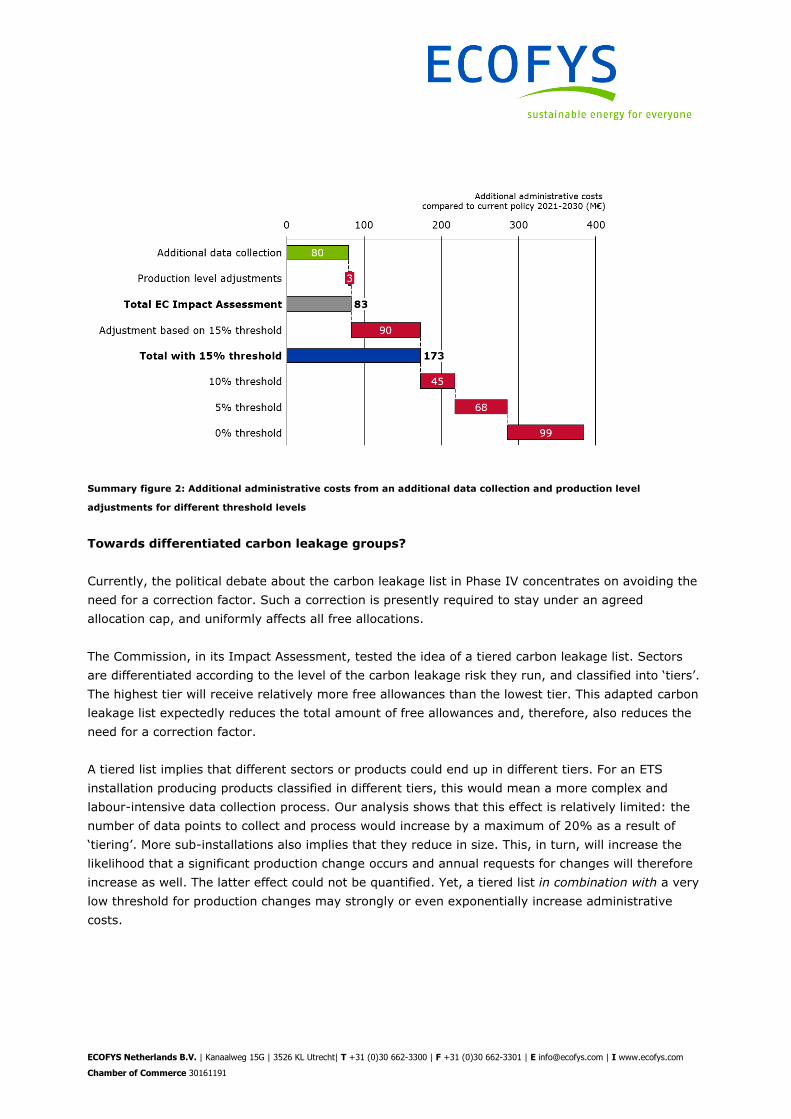
We estimate the total additional costs for Phase IV at € 173 million for a threshold of 15%, which is
more than double the IA estimate (Summary figure 2). About a quarter of these costs will be covered
by companies, the rest by public authorities. More detailed discussions on this threshold are
warranted, including the consideration of alternative options like a differentiation between installation
and sub-installation thresholds.
ECOFYS Netherlands B.V. | Kanaalweg 15G | 3526 KL Utrecht| T +31 (0)30 662-3300 | F +31 (0)30 662-3301 | E [email protected] | I www.ecofys.com
Chamber of Commerce 30161191
Summary figure 2: Additional administrative costs from an additional data collection and production level
adjustments for different threshold levels
Towards differentiated carbon leakage groups?
Currently, the political debate about the carbon leakage list in Phase IV concentrates on avoiding the
need for a correction factor. Such a correction is presently required to stay under an agreed
allocation cap, and uniformly affects all free allocations.
The Commission, in its Impact Assessment, tested the idea of a tiered carbon leakage list. Sectors
are differentiated according to the level of the carbon leakage risk they run, and classified into ‘tiers’.
The highest tier will receive relatively more free allowances than the lowest tier. This adapted carbon
leakage list expectedly reduces the total amount of free allowances and, therefore, also reduces the
need for a correction factor.
A tiered list implies that different sectors or products could end up in different tiers. For an ETS
installation producing products classified in different tiers, this would mean a more complex and
labour-intensive data collection process. Our analysis shows that this effect is relatively limited: the
number of data points to collect and process would increase by a maximum of 20% as a result of
‘tiering’. More sub-installations also implies that they reduce in size. This, in turn, will increase the
likelihood that a significant production change occurs and annual requests for changes will therefore
increase as well. The latter effect could not be quantified. Yet, a tiered list in combination with a very
low threshold for production changes may strongly or even exponentially increase administrative
costs.
ECOFYS Netherlands B.V. | Kanaalweg 15G | 3526 KL Utrecht| T +31 (0)30 662-3300 | F +31 (0)30 662-3301 | E [email protected] | I www.ecofys.com
Chamber of Commerce 30161191
Improving the data collection process
To determine the allocation for Phase IV, the EU ETS has to repeat a unique labour-intensive process
that has been done before, prior to the current trading phase: detailed data collection for each
installation. This offers the opportunity to evaluate the Phase III allocation process and take
advantage of lessons learnt.
Even though 2021 seems a long way off, time is not our friend for the data collection process for
Phase IV. If the Directive is not adopted by early 2017, the time window for the upcoming data
collection would be shorter than for Phase III while the data collection is likely to be more data-
intensive due to the EC proposal to collect emissions at sub-installation level. This data has not been
collected before and requires more guidance and explanations to operators and verifiers. We observe
several other challenges in the time window, in particular the deadline for Member States to deliver
the data to the EC by 30 September 2018, which appears to be unrealistic. A deadline of 30 March
2019 would be more feasible provided that the Directive is adopted early 2017. A dynamic deadline
would be another possibility. Furthermore, the revised carbon leakage list for Phase IV needs to be
established before the data collection is started, i.e. by the end of 2017, in order to have a
streamlined data collection process in 2018. If not, a more detailed data collection process is required
involving additional administrative costs not yet quantified.
Quality of data collection is essential for free allocation, also at sub-installation level. An improved
legal framework for validation of the methodology report, updated guidance documents, and MS
improving the dissemination of guidance documents will increase data quality. Furthermore, including
the data collection process into the well-established legal framework of monitoring, reporting and
verification (MRV) of emissions should be considered.

ECOFYS Netherlands B.V. | Kanaalweg 15G | 3526 KL Utrecht| T +31 (0)30 662-3300 | F +31 (0)30 662-3301 | E [email protected] | I www.ecofys.com
Chamber of Commerce 30161191
Table of contents
1 EU ETS phase IV preparations – an introduction 1
1.1 EU ETS phase IV 1
1.2 Administrative costs and additional complexities poorly understood 2
1.3 This report 2
2 Administrative costs of using production changes for allowance adjustments 4
2.1 Introduction 4
2.2 Administrative costs per installation 6
2.3 Approach 7
2.4 Results 8
3 The tiered leakage approach 13
3.1 Introduction 13
3.2 Approach 14
3.3 Results 16
3.3.1 A tiered leakage approach leads to limited additional carbon leakage assessments at
sectoral or sub-sectoral level 16
3.3.2 Determining allocation based on a tiered list could increase administrative costs by about
20% as compared to a non-tiered list 17
3.3.3 Updating allocation based on a tiered list increases administrative costs 19
4 Quality and feasibility of the data collection process 21
4.1 Introduction 21
4.2 Approach 21
4.3 Time 22

ECOFYS Netherlands B.V. | Kanaalweg 15G | 3526 KL Utrecht| T +31 (0)30 662-3300 | F +31 (0)30 662-3301 | E [email protected] | I www.ecofys.com
Chamber of Commerce 30161191
4.3.1 Timeline Phase III 22
4.3.2 Timeline Phase IV 23
4.3.3 Issues 25
4.4 Data quality 26
4.4.1 Experience Phase III 26
4.4.2 Proposed Phase IV 28
4.4.3 Issues 29
4.5 Solutions 29
5 Conclusions and recommendations 34
6 References 36
Annex I. Administrative costs in the EC impact assessment 37
I.1 Background 37
I.2 Administrative costs of annual production adjustments 38
I.3 Summary of data used 39
Annex II. Percentage affected installations at different thresholds 41
Annex III. Sectors that have incentives for carbon leakage assessment on PRODCOM-8
level 42

MARNL15562 1
1 EU ETS phase IV preparations – an introduction
1.1 EU ETS phase IV
On 24 October 2014, the European Council reached an agreement on the EU 2030 climate and
energy policy framework, including the outline of EU ETS rules for Phase IV (2021 - 2030) (EUCO,
2014). The European Council concluded that emissions reductions in the ETS sector will reach 43%
by 2030 compared to 2005, and that the linear reduction factor will be increased from 1.74% to
2.2%. The share of auctioned allowances should not be reduced, while free allocations is to be
continued nonetheless in order to prevent the risk of carbon leakage. The European Council specifies
that “the most efficient installations […] should not face undue carbon costs leading to carbon
leakage.” This means that the amount of free allowances will be limited and decreasing but should
still ensure (full) cost compensation for the most efficient installations.
On 15 July 2015, the European Commission released a proposal for a revised EU ETS Directive that
implements the European Council’s decisions (EC, 2015a). The proposed structure would be similar to
that of the current rules and has the following main features:
There is a cap on free allocation and thus the need for a cross-sectoral correction factor in
case the bottom-up free allocation exceeds this cap;
The benchmarking framework seems to remain the same, but benchmark levels will be
reduced significantly;
The Carbon Leakage compensation follows a black-white approach: 100% for sectors exposed
to a significant risk of carbon leakage, 30% for non-exposed sectors;
The Carbon Leakage criteria are revised to become slightly more stringent, but over 90% of
industrial emissions would remain on the Carbon Leakage list post-2020;
Allocation of free allowances is to be updated every five years, using historical production
levels. In between, allocation will be updated for significant production changes (no longer
capacity changes) with a threshold that needs to be determined.
The EC proposal will now undergo the usual legislative procedure: it will be discussed in parallel in
the EU Council (representative of the Member States) and the European Parliament. The European
Parliament has appointed a rapporteur on the dossier, Mr Ian Duncan MEP. Each of these institutions
will define their position by amending the EC text, before negotiating to find a common agreement.
The text will then be adopted. This procedure might take up to two years, depending on the
complexity of the process to reach a political agreement. As a consequence, it can be forecasted that
the revised EU ETS Directive for Phase IV will be adopted at the earliest in the beginning of 2017. It
is important that the debate, at the Council and at the European Parliament, builds on fact-based
figures and realistic estimates of potential impacts and costs. This report aims to contribute to the
discussion with concrete, bottom-up input.
MARNL15562 2
1.2 Administrative costs and additional complexities poorly understood
Until now, political discussions have been focused on broad principles related to the ETS structure
and only little attention has been given to understanding the administrative costs and additional
complexities that would result from changes in the rules. Administrative costs are defined as costs
necessary to be in compliance with the rules, costs of buying allowances not included. Entities that
encounter these costs are ETS operators for monitoring, collecting, and reporting data, verifiers for
verification of data, competent authorities for organizing the data collection, ensuring and enforcing
compliance, and distributing free allowances, and the European Commission for detailed data
assessments and determining the final amount of free allocation.
When do administrative costs increase? Basically this can have two causes: the first one is when
allocation rules are more extensive, i.e. they require more effort from the ETS operator without this
being caused by more complexities. For example, if operators need to collect more readily available
data (e.g. as a result of more baseline years), or need to collect data more often (e.g. as a result of a
more production-responsive allocation methodology). The second cause for increased administrative
costs comes from allocation rules being more complex. Examples include collecting data that is not
available (e.g. some internal heat flows) or allocating installation data to multiple sub-installations
(e.g. emissions at sub-installation level). When more complexities are introduced, this will most likely
lead to more administrative costs. A combination of more complexities and more data collection, for
example in the case of more sub-installations, may lead to a strong – if not exponential - increase of
administrative costs.
As a result, political design choices that link to complexities and/or administrative costs can have a
large impact on those dealing with the actual ETS rules. This report will assess such costs for two
aspects: the allocation adjustment to production changes (increases and decreases) and a tiered
carbon leakage list. In addition, the report will address the feasibility of the timeline for the required
data collection process.
1.3 This report
This report investigates the additional administrative costs and feasibility of three design aspects for
the next phase of the EU ETS. The first aspect is the allocation adjustment to production changes as
described in the European Commission’s proposal. Chapter 2 analyses the effect on administrative
costs of selecting certain thresholds for production increases and decreases on the number of
installations that will use this provision. Additionally, the additional administrative costs are estimated
and compared to the results of the EC impact assessment.
The second aspect relates to the possibility of a tiered carbon leakage list. In its proposal, the
European Commission adopted a ‘black and white’ approach, with two levels of compensation, 100%
and 30%. However, the impact assessment also explores the option of having a tiered approach with
four categories, separated by three thresholds. The increased number of categories may generate
additional administrative costs, which is addressed in Chapter 3.

MARNL15562 3
The third design aspect concerns changes to the process for collecting data from operators to
determine the level of free allocation, as proposed by the European Commission. Data collection is
foreseen every five years at the level of individual sub-installations of the installations. Chapter 4 will
assess a realistic time frame for the data collection process, and how the data quality can be
ensured.
The findings in this report are based on desk-based research, complemented by interviews with the
competent authorities in The Netherlands (Steven Bank), Germany (Christoph Kühleis, Christiane
Ochsenreiter und Alexandra Zirkel) and Sweden (Tom Liffen). In addition, two industrial operators
from the chemical industry, familiar with complex heat distribution networks, have been interviewed.
We like to thank them for their valuable contributions.
This report presents fact-based, independent findings and aims to contribute to the discussions on
the future of the EU ETS. Obviously, the findings do not necessarily reflect the position of the client
nor the Dutch government.
MARNL15562 4
2 Administrative costs of using production
changes for allowance adjustments
2.1 Introduction
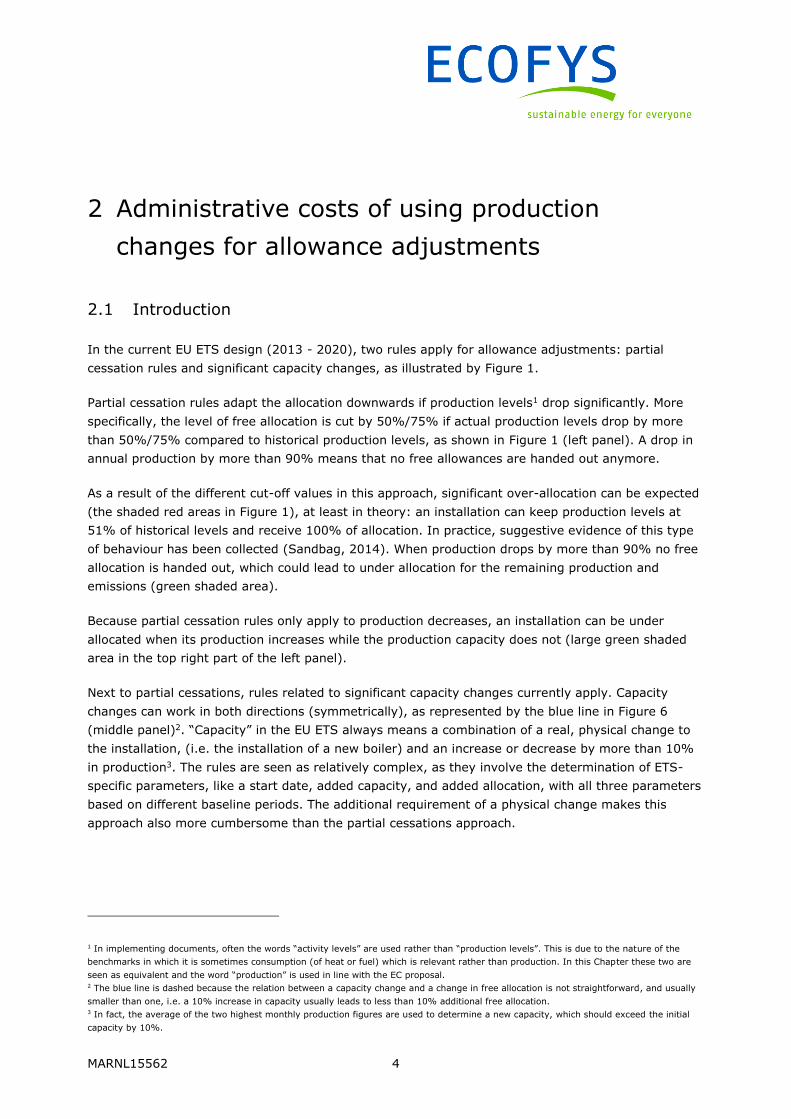
In the current EU ETS design (2013 - 2020), two rules apply for allowance adjustments: partial
cessation rules and significant capacity changes, as illustrated by Figure 1.
Partial cessation rules adapt the allocation downwards if production levels1 drop significantly. More
specifically, the level of free allocation is cut by 50%/75% if actual production levels drop by more
than 50%/75% compared to historical production levels, as shown in Figure 1 (left panel). A drop in
annual production by more than 90% means that no free allowances are handed out anymore.
As a result of the different cut-off values in this approach, significant over-allocation can be expected
(the shaded red areas in Figure 1), at least in theory: an installation can keep production levels at
51% of historical levels and receive 100% of allocation. In practice, suggestive evidence of this type
of behaviour has been collected (Sandbag, 2014). When production drops by more than 90% no free
allocation is handed out, which could lead to under allocation for the remaining production and
emissions (green shaded area).
Because partial cessation rules only apply to production decreases, an installation can be under
allocated when its production increases while the production capacity does not (large green shaded
area in the top right part of the left panel).
Next to partial cessations, rules related to significant capacity changes currently apply. Capacity
changes can work in both directions (symmetrically), as represented by the blue line in Figure 6
(middle panel)2. “Capacity” in the EU ETS always means a combination of a real, physical change to
the installation, (i.e. the installation of a new boiler) and an increase or decrease by more than 10%
in production3. The rules are seen as relatively complex, as they involve the determination of ETS-
specific parameters, like a start date, added capacity, and added allocation, with all three parameters
based on different baseline periods. The additional requirement of a physical change makes this
approach also more cumbersome than the partial cessations approach.
1 In implementing documents, often the words “activity levels” are used rather than “production levels”. This is due to the nature of the
benchmarks in which it is sometimes consumption (of heat or fuel) which is relevant rather than production. In this Chapter these two are
seen as equivalent and the word “production” is used in line with the EC proposal. 2 The blue line is dashed because the relation between a capacity change and a change in free allocation is not straightforward, and usually
smaller than one, i.e. a 10% increase in capacity usually leads to less than 10% additional free allocation. 3 In fact, the average of the two highest monthly production figures are used to determine a new capacity, which should exceed the initial
capacity by 10%.

MARNL15562 5
Figure 1: Current (left and middle panel) and future (right panel) allowance level adjustment methods for production increase/decrease
Installations that have capacity changes below the 10% threshold will receive no additional free
allocation for additional production (i.e. under allocation), or can get over allocated for reduced
production. While this system results in significantly less over allocation than the approach used for
partial cessations, it leads to higher administrative costs per installation due to more expensive
monitoring and reporting requirements and related complexities mentioned before. This is supported
by the administrative cost estimations from the Commission, presented in Annex I, which assume
five times higher costs per installation compared to reporting a partial cessation.
The EC proposal for a revised ETS post-2020 indicates that an act should be adopted to provide for
additional/reduced allocation from/to the New Entrants Reserve for significant production
increases/decreases respectively, by applying the same thresholds and allocation adjustments in both
directions. Under amendment (5), the EC proposal reads:
Article 10a is amended as follows: (a) the second paragraph of paragraph 1 is replaced by the
following: "The Commission shall be empowered to adopt a delegated act in accordance with
Article 23. This act shall also provide for additional allocation from the new entrants reserve for
significant production increases by applying the same thresholds and allocation adjustments as
apply in respect of partial cessations of operation."
This makes clear that: 1) significant production changes (up and down) are a trigger for a change
in free allocation; 2) the same threshold will be used in both directions4. This clause was added in
reaction to the European Council conclusion of October 2014 to let the allocation be better aligned
with actual production levels of sectors. The revision proposal is not specific on the threshold
levels to be used. In the accompanying IA, a 15% threshold is mentioned as an assumption (in a
footnote) without any reference to the background of this percentage.
4 The explanatory notes preceding the proposal (p.10) clarifies that the new entrants’ reserve should operate fully symmetrical, i.e. new
allocation comes from the reserve, while reduced allocations will go to the reserve. It is unclear whether the rules related to capacity
changes will be deleted.
-50%
-25%
0%
25%
50%
-50% -25% 0% 25% 50%
Change in production level
-50%
-25%
0%
25%
50%
-50% -25% 0% 25% 50%
Change in capacity
Capacity changes
Threshold (10%)
Partial cessations
Over allocation Under allocationChange in free allowances
Threshold tbd
Production changes
Phase III Phase IV
-100%
-50%
0%
50%
100%
-100% -50% 0% 50% 100%
Change in fre
e a
llow
ances
Change in production level

MARNL15562 6
The decision on this is left to an implementation decision, following the Directive. In the right panel of
Figure 1, we display the proposed rules with this 15% threshold.
It is obvious that the chosen threshold may have a major impact on: a) the number of times
installations have to report significant production changes; b) the resulting capacity needed at both
the competent authorities and the European Commission to deal with these notifications. The central
question of this chapter is therefore:
What are the consequences of choosing certain thresholds for significant production
increases and decreases for the number of installations that will use this provision and,
hence, the amount of administrative costs?
2.2 Administrative costs per installation
The impact assessment (IA) that accompanies the Commission’s proposal for a revised ETS directive
presents a detailed analysis of administrative cost impacts of two options to adjust allocation levels,
one based on current rules, the other based on production-level adjustments (EC, 2015b). The costs
are broken down into four different processes: data collecting and reporting per installation,
verification per installation, data check and allocation decision by competent authorities, and data
check and (non-)rejection by the Commission. From the impact assessment, the specific
administrative costs per installation can be derived (see Figure 2). In this report, we have used the
specific costs for annual production adjustments to calculate the administrative cost impact for
different threshold levels.
Figure 2: Specific administrative costs per reporting installation, based on the EC impact assessment
MARNL15562 7
2.3 Approach
Emissions as a proxy for production
To calculate the administrative costs of the proposed policy, one would need production data on a
sub-installation level (i.e. the relevant level on the basis of which free allocation is determined), and
one would need to make an estimate of the year-on-year changes for future years. However,
production data at sub-installation level is not publicly available at this detailed level. Therefore, we
use CO2 emissions on installation level as a proxy for sub-installation production data. This data is
publicly available for the years 2005 – 2014 through the European Union Transaction Log (EUTL). The
analysis is based on the assumption that historical year-on-year changes can be representative for
the future.
The usage of emissions as a proxy for production has its limitations. Similarly, the changes at
installation level rather than sub-installation level has its limitations, which are summarized below:
An overestimation of production level changes can be made as a result of:
Autonomous emission reductions
If an installation implements measures to reduce emissions (fossil fuel switch, energy
efficiency), its own emissions can change significantly without a significant change in
production levels.
Installations making changes in own heat production and imported or exported heat
If an installation reduces its own emissions by replacing heat production with imported heat
(produced by another ETS-installation), its own emissions reduce drastically, while its
production levels may stay constant.
An underestimation of production level changes can be made as a result of:
Higher aggregation level
Significant production changes per sub-installation level may occur within an installation (e.g.
switching from coloured glass to non-coloured glass production), which may not show up in
the aggregated emissions at installation-level.
Autonomous emission reductions in combination with production increases
If an installation implements measures to reduce emissions (fossil fuel switch, energy
efficiency), and increases its production levels simultaneously, the emissions level can remain
stable while production levels may increase significantly.
Emissions decrease less than production decreases
Because most installations run most efficiently at maximum capacity, a decrease in
production may result in an increased emissions intensity of the product and therefore the
total emissions of the installation decrease less than the production levels.

MARNL15562 8
Whether the combined effects of the above limitations lead to an under- or overestimation is hard to
tell without further analysis. Our hypothesis is that underestimation is dominant in particular due to
the dominant role of the higher aggregation analysis. This could be quantified by means of a
sampling approach, where for a number of ETS-installations both emissions at installation-level as
well as production at sub-installation level is collected and compared with each other. This is out of
the scope of the current analysis.
Selecting a representative year
In selecting the relevant historical time period for the analysis, the problem arises that varying
economic developments may show significant differences between the years. In addition, in the years
2012 – 2013 a change in ETS scope affected the change in emissions significantly. Therefore, we
selected the five most recent years of which emissions data is available (i.e. 2010 - 2014) and
analysed year-on-year emission changes. This allowed us to select a representative dataset for
further analysis.
Selecting a representative scope
As relevant scope, all ETS installations are included for which a change in free allocation is relevant,
hence, all installations with an amount of free allocation. This is relevant for around 9,600 out of the
11,000 installations in the EU ETS.
Estimating the administrative burden
The change in emissions per installation in the representative dataset is compared against a range of
thresholds and subsequently translated into an estimate of the number of installations that will make
a notification of a relevant change. Next, the administrative costs are quantified for different
threshold values, using the administrative cost estimates from the IA (p. 187).
2.4 Results
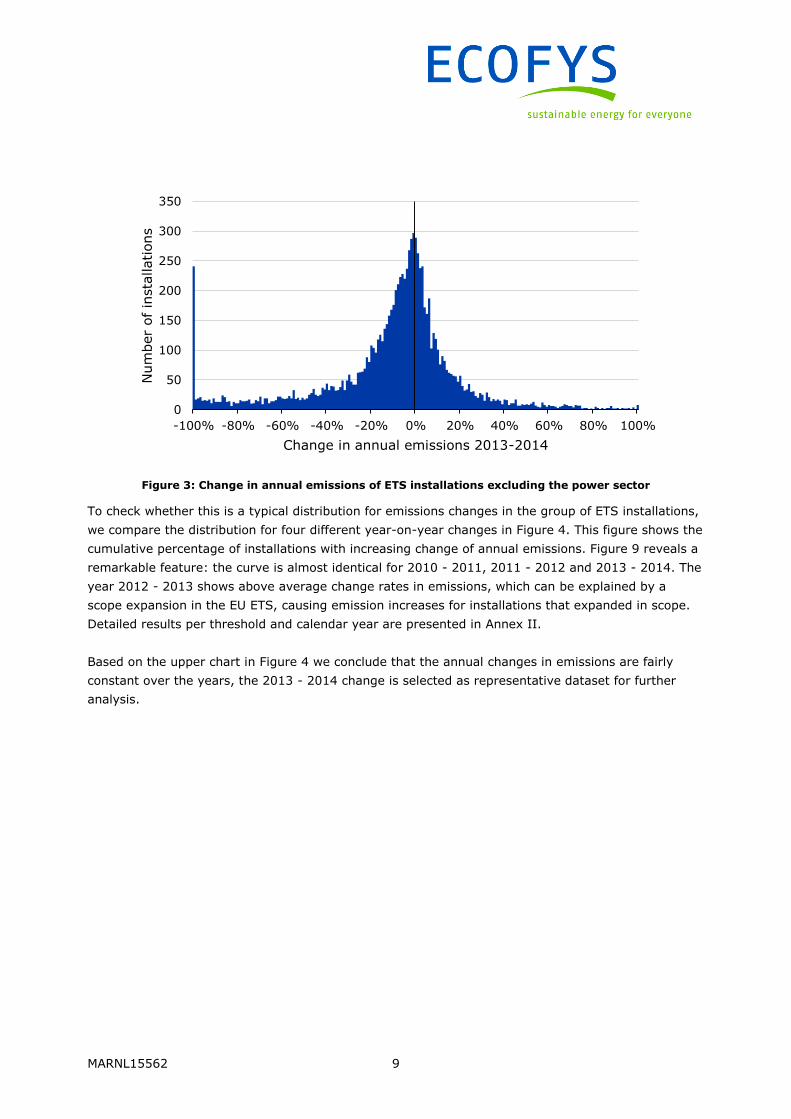
The most recent period for which the annual change in emissions data is available is 2013 – 2014.
The distribution, displayed in Figure 3, shows a high peak at a -100% change, caused by installations
that ceased their activities completely. Furthermore, an almost bell-shaped distribution is visible, with
a peak around 0% emission change, and a dominance for negative emission changes.
MARNL15562 9
Figure 3: Change in annual emissions of ETS installations excluding the power sector
To check whether this is a typical distribution for emissions changes in the group of ETS installations,
we compare the distribution for four different year-on-year changes in Figure 4. This figure shows the
cumulative percentage of installations with increasing change of annual emissions. Figure 9 reveals a
remarkable feature: the curve is almost identical for 2010 - 2011, 2011 - 2012 and 2013 - 2014. The
year 2012 - 2013 shows above average change rates in emissions, which can be explained by a
scope expansion in the EU ETS, causing emission increases for installations that expanded in scope.
Detailed results per threshold and calendar year are presented in Annex II.
Based on the upper chart in Figure 4 we conclude that the annual changes in emissions are fairly
constant over the years, the 2013 - 2014 change is selected as representative dataset for further
analysis.
0
50
100
150
200
250
300
350
-100% -80% -60% -40% -20% 0% 20% 40% 60% 80% 100%
Num
ber
of
insta
llations
Change in annual emissions 2013-2014

MARNL15562 10
Figure 4: Cumulative percentage of installations by change in emissions
The lower part of Figure 4 displays the share of affected installations at different thresholds for
2013/14. With the 15% threshold mentioned in the IA, 44% of installations is affected per year (i.e.
4,270 installations). A threshold of 50% affects 16% of ETS installations with free allocation (i.e.
1,514 installations). The IA estimates a total administrative cost of €7.9 million based on 2,000
installations reporting a production change annually. This would be in line with a threshold level of
around 40%.
The 44% share of installations is most likely a lower boundary, because emission (or production
level) changes of 15% at sub-installation level will occur more frequently than at installation level due
to the smaller unit sizes. The 44% share would further increase if the number of sub-installations
would be higher (see Chapter 3 on a tiered leakage list). If the 44% share would be reality, most of
the installations would have to report a significant change already in year 1 of the trading period,
because the 2013 - 2017 baseline data would be outdated. This would imply that the most of the
allocations for 2021 need to be adjusted before the issuance deadline, which could significantly delay
the issuance process.

MARNL15562 11
Next, we estimate the impact on administrative costs. We base this assessment on the numbers used
in the IA, which are discussed in Annex I. Assuming that all costs scale with the amount of
installations whose production exceeds the threshold, we multiply the average cost of €3,950 per
installation with the amount of installations exceeding a certain threshold to estimate the total
administrative costs at this threshold. The resulting curve is displayed in Figure 5.
The curve shows that the annual administrative costs according to the EC impact assessment result
of €7.9 million (see Figure 16 in Annex I) is less than 50% of the cost estimation based on our
analysis for a threshold of 15%. In terms of additional annual administrative costs, our result of
€16.9 million per year implies a cost increase compared to the current policy of around €9 million per
year, instead of €275 thousand as was calculated in the EC impact assessment (see Figure 16 in
Annex I).
Figure 5: Administrative costs of production level changes at different threshold levels
This significantly impacts the EC impact assessment results for the total additional administrative
costs for the entire 2021 - 2030 period, which is depicted in Figure 6. Here, the additional costs
compared to the current policy are shown for a 15% threshold as well as a 10%, 5% or 0%
threshold. For example, a 15% threshold translates into €9 million additional administrative costs per
year, which is €90 million for a 10 year trading period. The Netherlands would approximately
experience 5% of these costs (based on the share of ETS installations in the EU), i.e. €4.5 million.
About 70% of these costs are born by the competent authority for allocation checks and decisions
(based on Figure 17 in Annex I). Hence, the Dutch competent authority would experience €3.2 million
additional costs for Phase IV, equal to about €315,000 per year.

MARNL15562 12
Obviously, the smaller the threshold level the higher the additional costs, but also the less need for a
second data collection half-way the trading period. For example, in the hypothetical case of a 0%
threshold, a second data collection would not be needed as the data will be up to date, which would
save €80 million.
Figure 6: Additional administrative costs of additional data collection half-way the trading period (NIMs data collection) and production level adjustments for phase IV as a whole
MARNL15562 13
3 The tiered leakage approach
3.1 Introduction
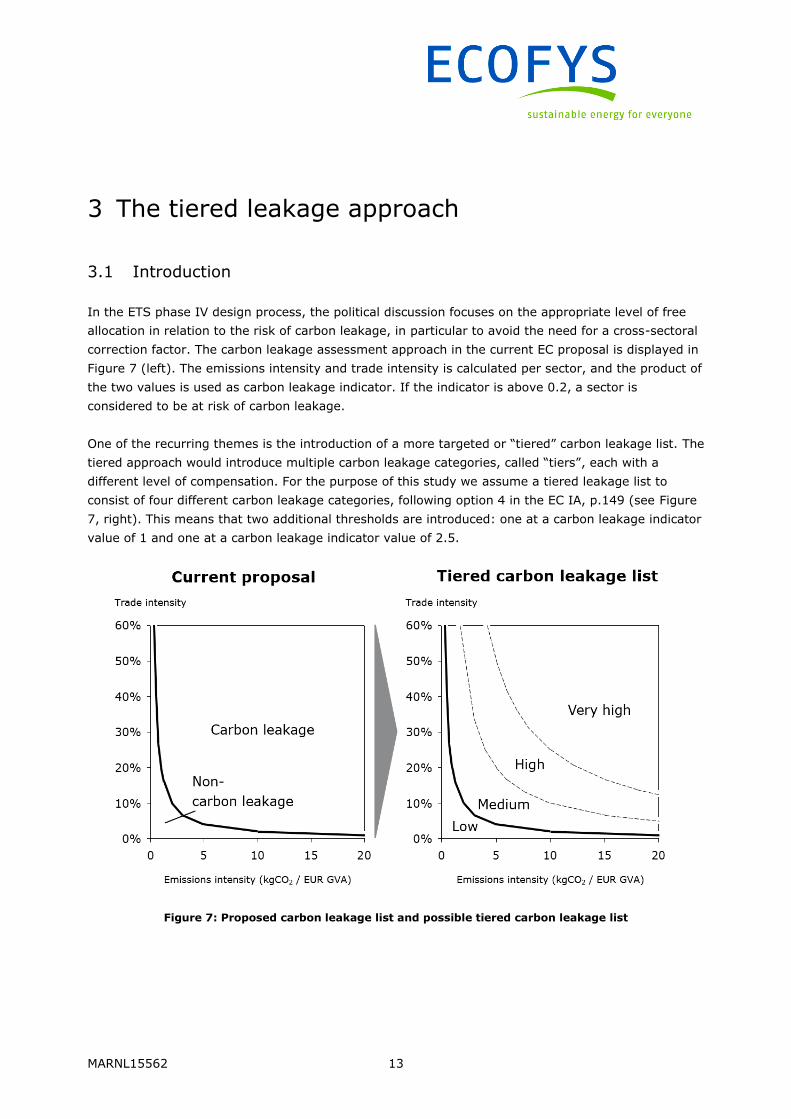
In the ETS phase IV design process, the political discussion focuses on the appropriate level of free
allocation in relation to the risk of carbon leakage, in particular to avoid the need for a cross-sectoral
correction factor. The carbon leakage assessment approach in the current EC proposal is displayed in
Figure 7 (left). The emissions intensity and trade intensity is calculated per sector, and the product of
the two values is used as carbon leakage indicator. If the indicator is above 0.2, a sector is
considered to be at risk of carbon leakage.
One of the recurring themes is the introduction of a more targeted or “tiered” carbon leakage list. The
tiered approach would introduce multiple carbon leakage categories, called “tiers”, each with a
different level of compensation. For the purpose of this study we assume a tiered leakage list to
consist of four different carbon leakage categories, following option 4 in the EC IA, p.149 (see Figure
7, right). This means that two additional thresholds are introduced: one at a carbon leakage indicator
value of 1 and one at a carbon leakage indicator value of 2.5.
Figure 7: Proposed carbon leakage list and possible tiered carbon leakage list

MARNL15562 14
It is expected that the cross-sectoral correction factor would no longer be required in a tiered system.
However, a tiered carbon leakage approach also has consequences for the implementation of the
resulting allocation rules. In this chapter, we focus on the following central question:
“What are the added administrative costs and related added complexities of a tiered
leakage list?”
3.2 Approach
We note that costs can occur in three phases: when determining the leakage list, when determining
the allocation, and when updating the allocation during the trading phase.
The additional costs for determining the list are resulting from either additional borderline cases at
sectoral level (sectors pursuing a higher tier) or additional sub-sectoral carbon leakage assessments
(sub-sectors pursuing a higher tier).
Because a tiered approach has more thresholds, more borderline cases can be expected. The
increase of these cases in a tiered approach, is assessed in our NACE borderline analysis.
Some products differ significantly from the sector average in terms of trade intensity and
emissions intensity. Producers of such product groups may argue that they need to be
assessed on a product group (PRODCOM8) level rather than on sectoral (NACE4) level. This
means that more sectors may need to be assessed, with additional administrative costs as a
result. Also here, a tiered approach may result in more cases because of the increased
amount of thresholds. The increase of these cases in a tiered approach, is assessed in our
NACE disaggregation analysis
Figure 8 shows the logic behind our analysis. In the NACE borderline analysis, we calculate the
number of borderline cases. For this calculation, we use the results of the carbon leakage
assessments for 2015 - 2019 (EC, 2014). In the EC proposal, sectors can be assessed using
qualitative criteria if its carbon leakage indicator is between 0.18 and 0.2, i.e. between 90% and
100% of the threshold value. We applying the same interval to the additional thresholds, to find
borderline sectors with a carbon leakage indicator between 0.9 and 1, and between 2.25 and 2.5.
For the NACE disaggregation analysis, we are interested in the NACE sectors that may benefit from a
sub-sectoral assessment at PRODCOM6 or PRODCOM8-level. This is illustrated in Figure 8, where the
NACE sector is in the Medium tier, but the individual products are in both the Medium and High tiers,
because they have different emissions intensities.
Because of limited data availability, a semi-quantitative approach is used to estimate the increased
costs. First, a selection of relevant ETS sectors is made by looking at the amount of ETS-installations
per NACE sector in the Netherlands. Second, the product groups in these NACE sectors are examined
and for each NACE sector is assessed whether a disaggregation could result in a possible beneficial
differentiation into different carbon leakage tiers.
MARNL15562 15
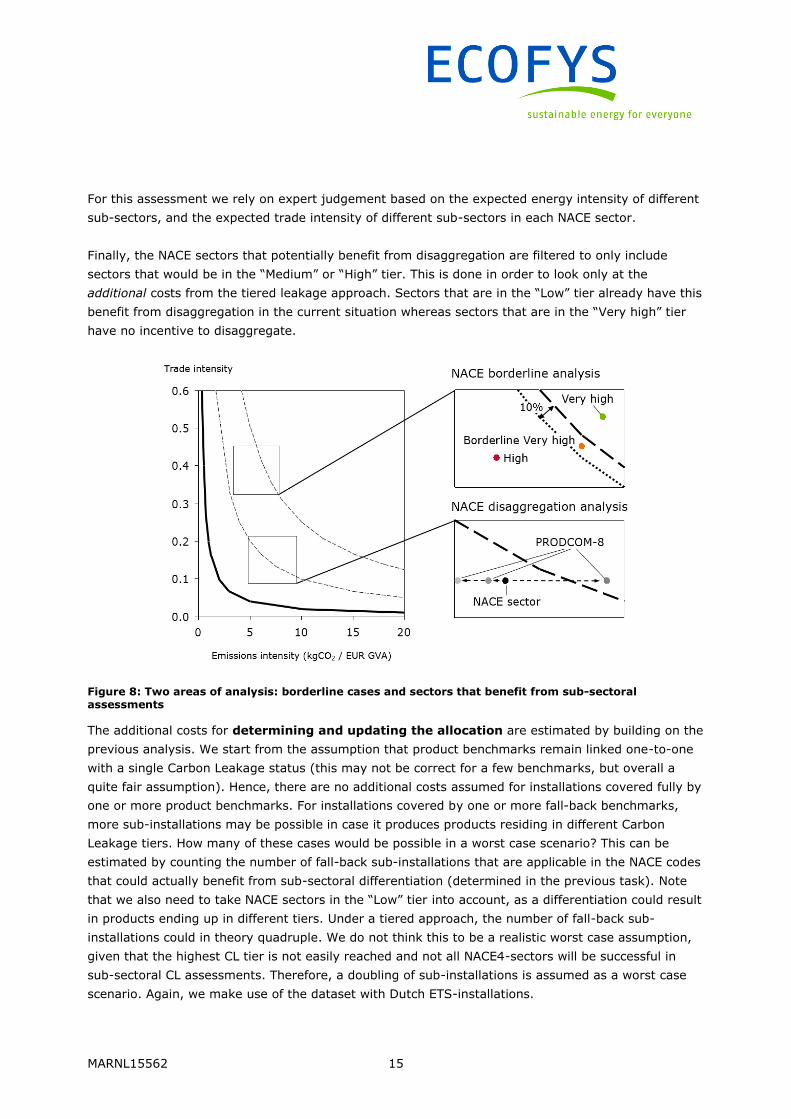
For this assessment we rely on expert judgement based on the expected energy intensity of different
sub-sectors, and the expected trade intensity of different sub-sectors in each NACE sector.
Finally, the NACE sectors that potentially benefit from disaggregation are filtered to only include
sectors that would be in the “Medium” or “High” tier. This is done in order to look only at the
additional costs from the tiered leakage approach. Sectors that are in the “Low” tier already have this
benefit from disaggregation in the current situation whereas sectors that are in the “Very high” tier
have no incentive to disaggregate.
Figure 8: Two areas of analysis: borderline cases and sectors that benefit from sub-sectoral assessments
The additional costs for determining and updating the allocation are estimated by building on the
previous analysis. We start from the assumption that product benchmarks remain linked one-to-one
with a single Carbon Leakage status (this may not be correct for a few benchmarks, but overall a
quite fair assumption). Hence, there are no additional costs assumed for installations covered fully by
one or more product benchmarks. For installations covered by one or more fall-back benchmarks,
more sub-installations may be possible in case it produces products residing in different Carbon
Leakage tiers. How many of these cases would be possible in a worst case scenario? This can be
estimated by counting the number of fall-back sub-installations that are applicable in the NACE codes
that could actually benefit from sub-sectoral differentiation (determined in the previous task). Note
that we also need to take NACE sectors in the “Low” tier into account, as a differentiation could result
in products ending up in different tiers. Under a tiered approach, the number of fall-back sub-
installations could in theory quadruple. We do not think this to be a realistic worst case assumption,
given that the highest CL tier is not easily reached and not all NACE4-sectors will be successful in
sub-sectoral CL assessments. Therefore, a doubling of sub-installations is assumed as a worst case
scenario. Again, we make use of the dataset with Dutch ETS-installations.

MARNL15562 16
Our analysis is complemented by interviews with competent authorities and ETS operators.
3.3 Results
3.3.1 A tiered leakage approach leads to limited additional carbon leakage assessments at
sectoral or sub-sectoral level
Figure 9: Sectors in each of the CL categories being proposed (left) or discussed under a possible tiered approach (right)
Figure 9 displays the results of the NACE borderline analysis. The three borderline areas are indicated
in red. Note that most borderline sectors are in the bottom borderline area. The other two borderline
areas only add 1 borderline sector each. This means that there is an increase of 2 sectors qualifying
for a qualitative carbon leakage assessment under a tiered leakage approach.
The NACE4 disaggregation analysis – based on 55 NACE sectors active in The Netherlands - showed
that about half of the sectors (27 out of 55) can potentially benefit from carbon leakage assessment
at disaggregated levels. Of these 27 sectors, 13 are in the “Low” tier, while the “Medium” and “High”
categories include 9 and 5 sectors, respectively (the full list is provided in Annex III). This means that
the amount of sectors that may have an incentive to pursue a PRODCOM8 level assessment more
than doubles from 13 in the current situation to 27 under a tiered approach (see Figure 10). Although
the current sample is not necessarily representative for the whole EU, we estimate that the doubling
is a good proxy for the situation at EU level considering that most large sectors are active in the
Netherlands.

MARNL15562 17
Figure 10: NACE sectors that may benefit from a sub-sectoral carbon leakage assessment in the tiered leakage
approach
Summary of interview findings
Competent authorities in two countries argue that more carbon leakage categories will lead to more
assessments at sub-sectoral level. Two authorities note that it makes sense and is fairer to differentiate
to sub-sectoral level, and to use PRODCOM instead of NACE code level. However, the other one
underlines that in a number of sectors (paper, chemicals, heat networks), one installation can be
subject to several PRODCOMs, which will lead to increased complexity and administrative effort. It also
points out that if the carbon leakage list is reviewed within the next trading period, the tiered approach
would lead to exponential increase in changes to be implemented. A third competent authority in
contrast, does not expect a significant increase of analyses at PRODCOM level, even with a tiered
carbon leakage list.
Private operators agree with competent authorities that there will be more assessments at sub-sectoral
level, and expect that this will increase complexity (especially when assigning historical emissions) for
operators.
3.3.2 Determining allocation based on a tiered list could increase administrative costs by
about 20% as compared to a non-tiered list
The tiered carbon leakage approach results in a doubling in the amount of CL categories, from two to
four. This in turn can create higher chances that different parts of an operators’ installation will fall
into different CL tiers, creating more sub-installations. In a worst case scenario, an installation that
was in one CL category in Phase III, may have sub-installations in four different categories in Phase
IV. This would lead to more work for operators to collect data, as well as for verifiers and competent
authorities to verify and check these data. A milk factory, for example, can produce milk powder,
casein, lactose and milk. In Phase III these products are either classified as CL (milk powder, casein,
lactose) or non-CL (milk), but they could potentially get classified in three or four different CL
categories under a tiered approach.

MARNL15562 18
Additionally, a tiered approach can result in more disaggregated calculations, because sub-
installations using the same heat source, should then attribute the heat consumption to the different
sub-installations. This would not only be a matter of more work, but can also involve more
complexity.
There are several cases possible that lead to more sub-installations. The first case has been analysed
in the previous paragraph, i.e. PRODCOMs within a NACE code having a different CL status. We
estimated that in the Netherlands at maximum 14 NACE codes may have to deal with this scenario.
For the Netherlands, this would be relevant for 103 ETS installations. In total, these installations have
138 fall-back benchmark sub-installations. While in theory they could get multiplied by 4, a doubling
is estimated as maximum impact, as explained earlier. This would, in a worst case situation, increase
the number of sub-installations by about 140, from the current total of 711, an increase of about
+20%.
In addition, we need to recognize the case where an installation produces products in two different
NACE codes that are currently in one CL category, but in the future in two. In heterogeneous sectors
like the chemical sector or the food sector, this may happen, but the number of possible cases is
most likely limited and therefore we do not further quantify this effect.
A third situation is the heat producer that provides heat to multiple (non-ETS) installations being in
different CL tiers. This situation is not leading to much additional complexity, as cross-boundary heat
flows are well-measured (invoices) and instead of combining the heat flows into one sub-installation,
it may end up in 2 or 3 sub-installations. Of course this leads to additional administrative costs, but
again, we estimate the number of cases to be fairly limited, and therefore we do not further quantify
this effect.
Thus, at maximum, we estimate the higher number of sub-installations can lead to about +20%
additional costs for determining the allocation. As a result of more sub-installations also more
production changes need to be processed, which is addressed in the next section.
Summary of interview findings
Surveyed competent authorities believe that more carbon leakage categories will indeed lead to
additional work for operators and authorities. Overall, they expect it will require an increased effort for
operators in order to determine their carbon leakage risk category, although the methodology will
remain the same (i.e. more detailed calculations, but not necessarily more complexity). This also
increases the risk of error, the data gaps and the verification costs. For competent authorities, it will
become more complex to check the data reports. However, competent authorities estimate that this
workload increase will remain manageable for both operators and authorities. One competent authority
underlines that it would be welcome to simplify the calculation methods for new installations and
capacity changes to production level in Phase IV to reduce complexity.

MARNL15562 19
Operators believe that, while the administrative burden will not be significantly increased on average,
operators and competent authorities will face added complexity in the case of heat consuming
installations.
Competent authorities in two countries forecast slightly increasing costs for operators and competent
authorities. One of them estimates additional administrative costs at 40% on average.
Diverging opinions on increasing complexity for heat linked to the tiered approach may be due to
different experiences with measuring heat. Those countries with more extensive data availability in
measuring heat and/or comprehensive related data collection (such as Sweden and Germany), probably
already have the necessary processes in place to cope with a tiered approach. Authorities in other
countries, with less positive experiences with heat, may need to invest more to deal with increased
complexity. Surveyed operators believe that they will have to increase the level of effort (in case of
installations consuming heat).
3.3.3 Updating allocation based on a tiered list increases administrative costs
Allocation may be updated on an annual basis in case of significant production changes. For the
purpose of this analysis, we assume that significant production increases are determined per sub-
installation, as is the case under the current rules. This interpretation needs to be made explicit in
implementing legislation.
Under a four-tier approach, it is likely that more sub-installations will be created (see previous
paragraph) and therefore sub-installations will get smaller in scope on average. Since a relative
change is more easily reached in smaller units, it is highly likely that significant production changes
will happen more frequently. This is illustrated in Figure 11, where random production changes5 at
sub-installation level do not exceed a 15% threshold at installation-level, while at sub-installation
level the baseline production level is exceeded by more than 15% four times.
The frequency at which significant production changes occur will depend on the relative size of the
sub-installation, but will also depend on the threshold level (which is discussed in paragraph 2.4). A
combination of a relatively low threshold level (strong increase of administrative costs), more sub-
installations due to a four-tier list (number increases by +20%) and smaller sub-installations
(increasing number of sub-installations, but not quantified), may have the potential to exponentially
increase administrative costs.
5 In reality, production levels between sub-installations are often correlated positively (growth or shrinkage affecting all sub-installations) or
negatively (one product replaces the other). With a negative correlation, all sub-installations may experience a significant change, while total
production levels may not change.

MARNL15562 20
Figure 11: Significant production level changes (red circles) occur more frequently in smaller units (i.e. sub-installations) than in larger units (i.e. total installation). Compared to the baseline production level (average of year 1-3), this installation - with random variations in production levels - experiences four significant production level changes in its sub-installations, but no significant change in its total production level.
A possible way to limit administrative costs from a four-tier list in combination with low threshold
levels would be to only change the allocations if the net effect at installation level (in terms of
production or allocation) exceeds a certain threshold. This way, the hypothetical installation depicted
in Figure 11 would not have to report any change.
Summary of interview findings
Regarding the annual monitoring of changes in allocation, competent authorities expect the workload
to increase as there will be more sub-installations and therefore more occurrences of sub-installations
reaching the threshold for allocation change. One competent authority estimates that the workload
increase should not be dramatic, and should not require any staff increase. Another authority expects
a more significant increase, and lower compliance by companies. It suggests to apply netting:
companies would only have to report in case there is an overall (installation-level) change in allocation
of x%, including discounting the CL factor.
One competent authority expressed appreciation for the fact that it is not envisaged that the Carbon
Leakage List will be amended during Phase IV.
Surveyed operators estimate that they have the required processes in place to ensure a yearly update
of allocations, even in the framework of a tiered list, but that it will increase their workload. They
believe that it will similarly increase the competent authorities’ workload, as they will have to do more
detailed checks if the installations’ products fall into different carbon leakage categories.
MARNL15562 21
4 Quality and feasibility of the data collection
process
4.1 Introduction
The EC proposal for the EU ETS Phase IV suggests to determine the level of free allocation, based on
data collection at the level of individual sub-installations. The data collected will feed into the process
to determine the amount of free allocation to each installation and into the benchmark updates and
plays a role in the determination of the cross-sectoral correction factor6.
Details on how to collect the data and guidance on how to ensure an adequate quality level of the
data are still to be defined. Also the timeline for starting the data gathering process and in turn being
able to meet the specified deadline of submitting these data by September 2018 to the EC will
ultimately depend on how fast the details, including guidance documents and templates, for the data
collection process can be agreed upon. In this Chapter, we will focus on two questions:
1. How can the quality of data be guaranteed given the absence of a clear regulation on the
data collection and data quality?
2. What are adequate and realistic time periods for the data collection process?
The aspects that will be investigated in this section are the current proposal for the data collection,
how it compares to the process implemented in Phase III and to what extent lessons could be learnt
from Phase III. Existing caveats will be identified and solutions will be discussed on how to overcome
these in Phase IV.
4.2 Approach
In order to analyse the feasibility of the data collection, we use a framework commonly used in
project management: the project management triangle. This triangle is displayed in Figure 12. It
displays the key aspects in every project: costs, time, scope and quality. The quality of the project
outcomes is depending on the three other factors. In the case of the EU ETS baseline data collection,
the costs and scope are assumed to be given variables (as indicated in Figure 12). While the proposal
already proposes specific deadlines for the data collection process, time can be considered to be the
other important variable that can be adjusted in order to influence the quality of the data. The
balance between these two is the focus of our analysis.
6 The Carbon Leakage list for Phase IV will, under the current proposal, not be based on this data collection, as it will rely on sectoral
(NACE4-level) data collected from Eurostat, Member States and the EU Transaction Log.

MARNL15562 22
Figure 12: The project management triangle
The desk review undertaken for this assessment is complemented by Ecofys’ experience in related
activities, such as supporting operators in the application process for free allocation in Phase III, and
through interviews with experts from competent authorities and operators.
4.3 Time
4.3.1 Timeline Phase III
The timeline of each step from determining the new rules for free allocation in Phase III to the actual
issuance of these allowances is illustrated in Figure 13. The data collection process in Phase III was
characterised by many overlaps between the subsequent steps. We make the following observations:
It took around two years to go from the adoption of the revised EU ETS Directive in April
2009 to defining the implementing legislation (harmonised free allocation rules) in April 2011.
In parallel to the legislative process the work on the guidance documents and the data
collection template started and was finalised by mid-2011.
MS already started beginning of 2011, while the guidance was still under development, to
disseminate the requirements of the data collection process and did so until the collection by
operators was completed.
Operators had about 3-4 months for the collection and another 2-3 months for
verification and submission to competent authorities.
It took MS at least 3 months to check the submitted data. In the end most competent
authorities had been struggling to meet the submission deadline for the NIMs on 30
September 2011 and did not make it in time and only submitted end of 2012 (EC, 2011). In
some cases this was due to national legal requirements, such as a perusal phase during
which operators could file a complaint against the preliminary decision on their free
allocation.
The Commission’s assessment of the data took more than 1 year. In the end free allocations
for 2013 could not be handed out by end of February 2013. The CSCF got determined later
that year and was published on 5 September 2013, after which national authorities could
start handing out free allocations to ETS installations in their MS.

MARNL15562 23
While overall the collection and assessment process of the allocation data of Phase III has
functioned, and free allocation was provided to operators before the deadline to surrender
allowances by 30 April 2014 in order to meet their compliance obligations for 2013,
installations did not have certainty on their allocations 2013 - 2020 until late 2013 due to the
late notification of the CSCF.
Figure 13: Actual timeline for determining the allocation for EU ETS Phase III
4.3.2 Timeline Phase IV
Figure 14 below depicts the timeline of the legislative process and implementation of new allocation
procedures based on the timeline provided in the Directive proposal, views expressed by interviewed
competent authorities, progress being observed within the involved committees of the European
Parliament and given the experience from Phase III.

MARNL15562 24
Figure 14: Timeline towards EU ETS Phase IV. Triangles are proposed deadlines, bars are assumed time periods required for each task
Member States are envisaged to collect data at sub-installation level over the years 2013 - 2017,
which is to be submitted by 30 September 2018 to the European Commission. The Commission will
then have time until 31 December 2019 to determine the new Carbon Leakage list, and until early
2020 to determine new allocation levels for 2021 based on the data collection, the new Carbon
Leakage list, updated benchmark levels and the level of the cross-sectoral correction factor. The
allocation has to be transferred to installation’s registries by February 2021. For the final decision on
the free allocation for Phase IV on 31 January 2021, reported production changes from 2019 are
assumed to be taken into account.
Interview findings
Surveyed competent authorities consider that the timeline for submission of data at sub-installation
level to the European Commission in September 2018, is either very tight or not achievable. Two of
them underline that prior adoption of CIMs is needed in order for data collection to take place. On
authority also points out that delayed submission will leave only limited time for the European
Commission to conduct verifications. Surveyed operators also consider this timeline very challenging.
One of them points out that companies would have six months to collect the data while the member
states would have seventeen months to check it. Thus it would be more realistic to give more time to
operators for data collection. Another operator questions the necessity to collect data over five years
(2013 - 2017) and suggests three years instead.
MARNL15562 25
Regarding adequate and realistic time periods for the data collection exercise and the subsequent
process to update the benchmark levels, and determine the CSCF, competent authorities have
diverging opinions. One of them estimates that the proposed timeline is realistic if the necessary
resources are devoted at Member State and European Commission level. Another competent
authority estimates that competent authorities should have more time to check the allocation
applications than for Phase III, and that there should be strict deadlines on the European Commission
to update the CIMs in parallel with the Directive and to complete the benchmark updates and adopt
the final allocation decision. One operator suggests March 2019 as deadline for companies to submit
their data to competent authorities.
4.3.3 Issues
Key assumption of the presented timeline above is that the legislation will be adopted by early 2017.
If this assumption does not hold true each subsequent step will need to be shifted back, making the
deadline of issuing allowances on time for Phase IV more difficult to meet. Given the current
progress, adoption by early 2017 is a rather optimistic assumption. Hence, the adoption of the
revised EU ETS Directive can be considered to be the first bottleneck in this process.
Following the adoption of the EU ETS Directive in early 2017 the EC would have to develop the
implementing legislation by the end of 2017. The data collection template and the guidance
documents would have to be updated and additional guidance documents be developed
simultaneously in 2017. While this was to some extent also the case in Phase III, the finalisation of
the guidance documents and the template stretched into the phase where data collection already
took place. As this is not desirable it should be the aim to have the guidance documents in place well
before operators will need to apply them. This can be regarded a second bottleneck, in particular if
the Directive is not adopted by early 2017.
The third bottleneck occurs in 2018: MS will have 2–3 months at maximum to disseminate and
possibly translate the final requirements and provide national specific guidance for operators. The
experience from Phase III has shown that the quality and accuracy of data improves with the
provided guidance. Therefore, the available time window for this step appears to be too limited.
Subsequently, there are 6 months available for data collection, reporting, verification, and the checks
that need to be done by the national authorities. This is about the same time window as in Phase III.
If for Phase IV the level of detail of the data collection would increase (e.g. more data to be collected
at sub-installation level or more sub-installations), this would become an unrealistic timeline.
Interviewed MS expressed that the deadline of submitting NIMs for Phase IV by 30 September 2018
is very hard to meet and it is not even taken as a serious deadline by some MS, as it is bound to be
breached, even by MS that are considered to have well-staffed competent authorities.
National circumstances, such as the perusal phase required in the Netherlands during which
operators can file objections to the preliminary decision on the free allocation, will, given the
described timeline, almost certainly lead to later submissions of the data to the Commission. In the
case of the Netherlands it took from the deadline for submission for operators to the actual
submission of the NIMs eight months.
MARNL15562 26
A fourth issue is that the carbon leakage list is scheduled for publication only after the data
collection process, while in Phase III it was known before. The new carbon leakage list will be based
on new data and most likely using new criteria; it may even consist of four tiers. Therefore, the
question arises on who will assign the carbon leakage status to each sub-installation in Phase IV, if
there is no carbon leakage list? In Phase III this was the operator, for phase IV it is unknown how
this process should work.
In the absence of updated Carbon Leakage categories, MS states will not be able to determine the
preliminary amount of free allocation. For some MS this will mean that the period during which
operators can object to the decision will need to be incorporated at a later stage in the process, e.g.
mid 2020 after the assessment by the Commission took place, adding another potential (fifth)
bottleneck to the process.
A sixth bottleneck may happen in 2020, when the Commission has to determine the benchmark
updates, the updates to the allocation based on 2019 data (assuming this takes place), and the
cross-sectoral correction factor. These steps will all need to be concluded by the end of 2020.
4.4 Data quality
4.4.1 Experience Phase III
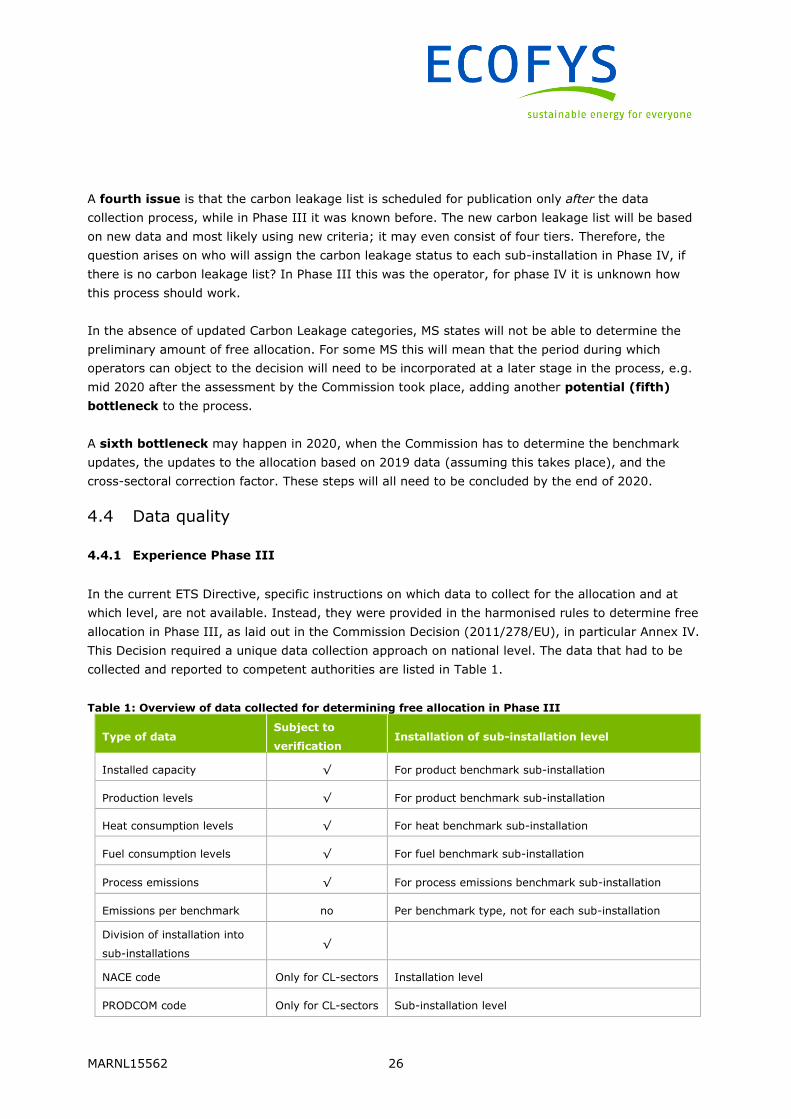
In the current ETS Directive, specific instructions on which data to collect for the allocation and at
which level, are not available. Instead, they were provided in the harmonised rules to determine free
allocation in Phase III, as laid out in the Commission Decision (2011/278/EU), in particular Annex IV.
This Decision required a unique data collection approach on national level. The data that had to be
collected and reported to competent authorities are listed in Table 1.
Table 1: Overview of data collected for determining free allocation in Phase III
Type of data Subject to
verification Installation of sub-installation level
Installed capacity √ For product benchmark sub-installation
Production levels √ For product benchmark sub-installation
Heat consumption levels √ For heat benchmark sub-installation
Fuel consumption levels √ For fuel benchmark sub-installation
Process emissions √ For process emissions benchmark sub-installation
Emissions per benchmark no Per benchmark type, not for each sub-installation
Division of installation into
sub-installations √
NACE code Only for CL-sectors Installation level
PRODCOM code Only for CL-sectors Sub-installation level

MARNL15562 27
To ensure a great degree of harmonisation this data has been reported through a template provided
by the Commission, or equivalent national templates. The baseline data then had been subject to
verification. Next to the report with the operational data, the operator also needed to present a
methodology report, which outlined how the data has been gathered. Both reports had to be
assessed by a third party verifier in regards to whether the presented data are free from material
misstatements, the division into sub-installations is correct and the methodology report is compliant
with the requirements of the CIMs. After receiving the baseline data competent authorities had to
undertake a review of the applications for free allocation and subsequently determined the
preliminary free allocation to their installations and handed in the data to the Commission as so-
called National Implementing Measures (NIMs).
Responses from competent authorities indicate that the quality and accuracy of the baseline data
depended very much on whether guidance was provided to operators, e.g. in the form of translated
EC guidance or national specific guidance and capacities of competent authorities to first instruct
operators about the requirements and to accurately check the received data. Also, the quality and
accuracy of data also seem to deteriorate when fall-back approaches are being applied as compared
to data relating to product benchmarks. Operators often lacked clarity on what and where to measure
especially when the heat benchmark has been applied.
Interview findings
(Q2.1 a) Regarding accuracy and quality of reported data at sub-installation level, competent
authorities have diverging views. One authority identifies new entrants applications as the most
problematic because of complex rules and lack of adequate guidance. Another authority points at the
need for generic rules to make the system clearer. A third highlights the importance of information
dissemination to operators. Operators also stress that clear definitions are important for good data
quality. A helpdesk may also help operators better understand the requirements. An operator points
out that quality of data gathering varies greatly across the EU and calls for guidance to ensure
convergence. It also underlines that less accurate reporting (fall-back approach) should not allow for
higher level of compensation than more detailed one.
(Q2.1 b) On additional guidance, authorities’ views are also split. One of them suggests that no new
guidance is required, except for benchmark update, where new data will need to be gathered.
Another authority estimates that rules rather than guidance are needed. A third authority suggests to
update the current guidance documents and add one guidance on how to fill in the application form
for new entrants and closures.
(Q2.1 c) One competent authorities foresees a lack of data for the heat benchmark, given that data is
to be collected for the years 2013 - 2017, meaning operators may have to report data points in
compliance with requirements that they are not aware of yet. The other two authorities believe that
this should not be a problem and that all necessary data is available.
MARNL15562 28
Annual reporting of operational data
Under the current procedures for determining free allocation competent authorities are requiring
annual updates from operators in regards to planned or effective changes to the capacity, activity
levels and operations. Relevant information needs to be provided by 31 December of each year7. It is
within this process that about half of the MS‘s competent authorities are requesting operators to
report activity data on sub-installation level already (EC, 2015c). While this has been identified as
best practice this is not commonly applied as it is not formally required. National requirements range
from requiring the submissions only in case the operators states that changes have occurred in the
respective calendar year8 to MS requiring their operators to submit data on sub-installation level on
an annual basis even in absence of an actual or planned change. Only in some cases the reported
data get verified indirectly during the verification process of annual emission reports. Therefore, the
quality and accuracy of this gathered information should be scrutinised.
While not directly related to the baseline data gathering process, the procedures implemented by
some MS show that baseline data can also be collected in more frequent intervals, e.g. annually, and
on a more detailed level, such as sub-installation level.
4.4.2 Proposed Phase IV
The EC proposal specifies the data collection that should take place before the start of Phase IV. The
following text will be added to the current Article 11(1) and becomes part of the new Directive text:
“A list of installations covered by this Directive for the five years beginning on 1 January 2021
shall be submitted by 30 September 2018, and lists for the subsequent five years shall be
submitted every five years thereafter. Each list shall include information on production
activity, transfers of heat and gases, electricity production and emissions at sub-installation
level over the five calendar years preceding its submission. Free allocations shall only be
given to installations where such information is provided.”
The proposal therefore envisages a more detailed, frequent and comprehensive data gathering
exercise as compared to Phase III. Each type of data will need to be disaggregated and provided for
each sub-installation. The process will be done once before the start of Phase IV and be repeated
again after five years to gain updated baseline data for an updated allocation half way of Phase IV.
Also, data will have to be collected over a longer baseline period, namely five years. No choice over
the baseline period is envisaged.
Given these changes to the baseline data collection the question arises of how the quality of data can
be ensured, or even improved as compared to the process in Phase III, in light of the limited
timeline.
7 Article 24, Commission Decision (2011/278/EU) 8 As is the case in the Netherlands
MARNL15562 29
Actual benchmark updates (or something similar to that), instead of a default update by 1% requires
data collection that has not been done in Phase III, as verified emissions were not collected per sub-
installation.
4.4.3 Issues
The experience with the process during Phase III shows that the quality and accuracy of baseline
data varies across MS and that there is room for improvement in terms of harmonising the level of
quality and accuracy of data. Both aspects would benefit from providing further guidelines to
operators and competent authorities on what data are required and how these should be gathered
and reported. To ensure a great degree of harmonisation, the key guidance should come from the
Commission. At the same time, MS should invest in dissemination of these guidelines, e.g. in form of
translating Commission guidance or developing additional guidance in accordance to national
circumstances, e.g. specific to the national electronic reporting system or issues found to be
challenging in the national context. Given the envisaged timeline discussed above, MS are expected
to have only two to three months to inform operators of the requirements. This will not allow for real
improvements compared to Phase III.
A second point for improvement is to provide a legal framework for the validation and approval of the
quality of the methodology report (MR), just as the Monitoring and Reporting Regulation provides a
framework for validation and approval of the Monitoring Plan9. In Phase III, verifiers were required to
give an opinion about the quality of the MR, but in absence of any legal framework and clear criteria
for best available data, this led to unclarity about the verification approach towards the MR, in
particular the level of assurance.
A third point of improvement would be to enable competent authorities to perform appropriate
checks. Yet, besides the capacity constraints that some competent authorities are already facing, e.g.
in the form of low staffing or the absence of an electronic reporting system, each competent authority
is constrained by the tight deadline for performing these checks. Hence, the issue of ensuring data
quality and accuracy is closely linked to the issue of the timeline discussed in section 4.3.
4.5 Solutions
Given the experience with the process for gathering baseline data, the following suggestions should
be considered when developing the process for Phase IV:
One of the identified issues is that the new Carbon Leakage list is published after the data
collection process in 2018, which complicates the data collection. We see three possible
solutions:
9 The Methodology Report describes the methodology for determining the allocation to an installation, including the split into sub-
installations and the quality of data. The Monitoring Plan describes the methodology of determining the annual emissions of an installation,
including the quality of data.
MARNL15562 30
1) Publication of the new carbon leakage list is brought forward by two years, as compared to
the planning in the proposal, i.e. to the end of 2017. 2) Data collection for the fall-back
benchmarks is done per NACE4-level or even at PRODCOM level10. This will allow to assign
the relevant carbon leakage status after the data collection. 3) The data collection in 2018 is
done based on the current carbon leakage list and only for sectors changing status an update
is done in 2019/20, potentially involving some new data collection. We note that both option
2 and 3 give rise to additional administrative costs for data collection and verification, as data
need to be provided at more disaggregated levels (option 2) or need to be re-collected
(option 3). This impact is not further quantified in this study.
Revised guidance should be drafted to clarify issues that operators and competent authorities
have been facing in Phase III, e.g. in regards to fall-back approaches. Additional guidance will
need to be available to elaborate on the requirements of collecting data on sub-installation
level.
MS should invest in the dissemination of the guidance, e.g. by investing in translation of the
documents, to establish a help-desk before and during the time of the data collection.
MS should be provided with a more realistic timeframe for assessing the submitted baseline
data, e.g. 30 March 2019. Alternatively, the timeline could be made dynamic in order to take
account of delays, e.g. during the legislative proposal. MS should also assess whether and
how national legal requirements will impact this process.
As a consequence of additional guidance, better national dissemination and more realistic
timelines for competent authorities to assess the data, the quality of the data to be submitted
to the Commission can be expected to be higher. In turn the timeline for assessing the data
by the Commission could be shortened to a maximum of one year.
It should be considered to define clear deadlines for the tasks undertaken by the
Commission, such as assessment of the baseline data, updating the benchmarks, determining
the required CSCF and in turn the final total of free allocation, in order to ensure that these
will not lead to delays in the process.
Quality of data could be increased by providing a legal framework for verification of the
methodology report accompanying the data collection. Yet, this would require the
development of detailed verification requirements, e.g. in line with the current AVR.
10 We assume that product benchmarks will stay linked one on one to a unique carbon leakage status, although this may not be evident for
those product benchmarks comprising products produced in different NACE codes, e.g. mineral wool.
MARNL15562 31
How to implement the data gathering exercise for Phase IV
Based on the assessment of the process in Phase III and the interviews we identify two viable options
to proceed for the implementation of the proposed Article 11(1), which we elaborate below. One
option is to maintain the process as it was being introduced for Phase III with amendments to allow
for the more detailed and frequent data gathering, and to make certain improvements. Alternatively
it should be considered to make a cut compared to the process in Phase III and incorporate the
baseline data gathering exercise in the annual MRV cycle.
Option 1: integrate the baseline collection exercise in the annual MRV cycle
In light of the fact that operators find it cumbersome to collect baseline data for Phase III
retroactively and competent authorities are not always convinced about the quality and accuracy of
the received data (and lack legal ground for enforcement) it might be worth exploring the option of
including this data collection process into the well-established framework of monitoring, reporting and
verification (MRV) of emissions. In the end, emissions and allocations have the same monetary and
hence, environmental value; putting them under the same EU-harmonized assurance umbrella would
make sense from that point of view.
The basis for the monitoring activity of each operator is a monitoring plan, which is approved by the
relevant competent authority. The monitoring plan describes the installation, its activities and
emission sources. It furthermore describes the system boundaries and processes for measuring
instruments, data flow and quality control of calculating annual emissions. For Phase IV each
monitoring plan of an installation eligible to free allocation could also include these elements for
activity data, i.e. data required in accordance to the proposed Article 11(1), To facilitate the data
collection for phase IV, the extension of the monitoring plan to activity data should be ideally readily
available and approved before the data collection starts. Instead of collecting allocation relevant data
retroactively over periods of five years twice for Phase IV, operators could be obliged to collect, get
verified and report this data on an annual basis together with annual emissions by 31 March each
year, based on an approved monitoring plan.
Verification of the annual emissions report, before it is submitted to the competent authority, would
then also have to include verification of the production data. This approach would link up to the
current best practice in a few MS, in which operators are required to get their data on capacity
changes, which is due by the end of each year, to be indirectly verified during the verification process
of annual emissions.
The advantage of this approach would be that the MRR and AVR provide a strong legislative
framework for monitoring and reporting emissions of better quality and in a greatly harmonised way
as compared to Phase II. While the regulations in themselves did not provide the required level of
detail they were accompanied by extensive guidance to enable this harmonisation. Extending the
MRR and AVR to reporting of allocation relevant data would be needed as a framework to approve the
monitoring plan to collect activity data for allocation.

MARNL15562 32
Repeating the data collection process for an updated allocation baseline after five years would be less
cumbersome – or may even not be needed - as data had been collected and verified and reviewed
over the relevant years already. Hence, operators and competent authorities would not be faced with
another collection process. The data could be easily compiled by installations and submitted to the
Commission, which then calculates the final number of free allocation for the years to come.
Yet, there are issues that would require further investigation. In order to issue the free allowances to
eligible installations on time for Phase IV by end of February, enough baseline data have to be
collected over a sufficiently long time period. For the inception of Phase IV therefore the collection of
retroactive data seems to be unavoidable, even if the MRR and AVR were to be amended in parallel to
the EU ETS Directive to include the baseline data collection process.
Secondly, as operators, verifiers and competent authorities would benefit from a certain continuity of
the processes within the EU ETS, a change to the allocation data collection process may not be
desirable. This issue is actually less serious than it seems: the proposed change would make use of
an existing and established system with which operators, verifiers and competent authorities are very
familiar.
In line of the tight timeline, it would be worth investigating this option presented above in greater
detail in light of its implications on the timeline. Aspects to be investigated are whether the inclusion
of the data collection process into the MRR and AVR could be implemented in a timelier manner than
providing the legislative basis in a Commissions decision or a delegated act. If the inclusion would not
be feasible before the first data collection for 2021 - 2025 allocation, it may still be useful to develop
this approach towards the second data collection for 2026 - 2030.
Option 2: improve the current system
The existing process for determining the baseline for free allocation has worked but with weak spots
in data quality and therefore weak spots in equal treatment of operators in the same sectors. In
addition, the best practice by some MS to request reporting of data on sub-installation level within
the process of checking for significant changes to operations also shows that the requirement for
more detailed data, i.e. on sub-installation level, and more frequent reporting is feasible with
manageable additional administrative burden. Yet, the additional burden will weigh heavier on some
MS’ competent authorities than on others. To ensure that the quality and accuracy of data will be
harmonised additional guidance will be needed, in general for fall-back approaches. For this guidance
to be effected competent authorities will need to identify their weak spots in the data gathering
process to be able to establish where additional guidance is needed. Also best practices from MS on
the baseline data collection exercise and the annual reporting on capacity changes should be
communicated widely and be incorporated in additional guidance. Competent authorities should
consider investing in translating Commission guidance to facilitate dissemination of available
information.

MARNL15562 33
Operators, verifiers and competent authorities would benefit from the stability and continuity of the
data gathering exercise. Fine-tuning the requirements and providing more guidance can be rolled out
relatively easily given that the underlying process would not change. From a short to mid-term
perspective this option is a viable approach to implement.
Option 1 would be in line with the current proposal and envisaged timeline. It would however, require
that more time is being spent on the dissemination of guidance, as discussed above in the presented
suggestions.

MARNL15562 34
5 Conclusions and recommendations
In this report a number of design options related to the EU ETS Phase IV and their impact on
administrative costs have been addressed. The main questions and their conclusions and
recommendations are provided below.
What are the consequences of choosing certain thresholds for significant production increases
and decreases for the number of installations that will use this provision and, hence, the
amount of administrative costs?
The production threshold that will trigger additional/reduced free allocation is key for understanding
and valuing administrative costs, both politically (from an "empty" article to fully responsive
allocation) and practically (additional administrative costs). Based on our analysis, a threshold of
50% can affect at least 16% of ETS installations with free allocations per year (i.e. 1,514
installations), while a 15% threshold would affect at least 44% of installations per year. The latter
implies that most of the installations will already have to report a significant change for 2021,
because 2013 - 2017 production data serving as the baseline for that year will likely be outdated. A
15% threshold corresponds to about €90 million additional administrative costs over the phase IV
trading period compared to the impact assessments estimate. Administrative costs would not
significantly increase compared to the current rules if a threshold of around 40-50% would be taken.
More detailed discussions on this threshold are warranted, including the consideration of alternative
options like a differentiation between installation and sub-installation thresholds.
What are the added administrative costs and related added complexities of a tiered leakage
list?
Administrative costs could increase by 20% at maximum due to additional sub-installations being
created in ETS-installations. However, combined with a low threshold level for annual production
changes, administrative costs may increase exponentially. This would be caused by the combination
of a low threshold level (strong increase of administrative costs, see previous section), more sub-
installations (+20% costs) and smaller sub-installations (increased costs, but not quantified).
Openness from the EC on whether sub-sectoral assessments will be allowed unlimitedly under a
tiered system will be needed.
What are adequate and realistic time periods for the data collection under Phase IV?
Several bottlenecks and issues appear for the timeline between now and the start of the new trading
period in 2021, in which data collection and determination of the allocation needs to take place. In
case the revised Directive is not adopted by early 2017, less time would be available compared to
Phase III, while more detailed data is to be collected. To streamline and improve this process, we
recommend to bring the decision on the carbon leakage list for Phase IV forward to the end of 2017.
MARNL15562 35
In addition, we recommend providing Member States with a more realistic timeframe for assessing
the submitted baseline data, e.g. 30 March 2019 or a dynamic deadline.
How can the quality of data be guaranteed given the absence of clear guidelines on the data
collection?
More detailed data collection at sub-installation level can widen the quality gap between countries
with well-developed data handling capacity and those without. Quality of the data collection could be
increased in several ways:
1. Through providing a legal framework for verification of the methodology report accompanying
the data collection.
2. By providing updated guidance documents to clarify issues that operators and competent
authorities have been facing in Phase III, e.g. in regard to fall-back approaches.
3. To build in more time for Member States to invest in the dissemination of guidance
documents, e.g. by investing in translations of the documents, establishing a help-desk
before and during the time of the data collection etc., and by adjusting the timelines for
submitting the data to the EC accordingly.
In addition, we recommend exploring the option of including the data collection process into the
well-established framework of monitoring, reporting and verification (MRV) of emissions. If the
inclusion would not be feasible before the first data collection of 2021 - 2025 allocation, it may still be
useful to develop this approach towards the second data collection for 2026 - 2030.

MARNL15562 36
6 References
EC. (2011). 27th Meeting of the Informal Technical Working Group on Benchmarks for the ETS.
Brussels: European Commission. Retrieved from
http://ec.europa.eu/clima/policies/ets/cap/allocation/docs/110915_minutes_en.pdf
EC. (2014). Results of carbon leakage assessments for 2015-19 list (based on NACE Rev.2).
Brussels: European Commission. Retrieved from
http://ec.europa.eu/clima/policies/ets/cap/leakage/docs/carbon_leakage_detailed_info_en.pd
f
EC. (2015a). Proposal for a Directive of the European Parliament and of the Council amending
Directive 2003/87/EC to enhance cost-effective emission reductions and low-carbon
investments (COM(2015) 337 final). Brussels: European Commission. Retrieved from
http://eur-lex.europa.eu/resource.html?uri=cellar:a556e9fb-5153-11e5-9f5a-
01aa75ed71a1.0014.02/DOC_1&format=PDF
EC. (2015b). Impact Assessment Accompanying the document Proposal for a Directive of the
European Parliament and of the Council amending Directive 2003/87/EC to enhance cost-
effective emission reductions and low-carbon investments (SWD(2015) 136 final). Brussels:
European Commission. Retrieved from
http://ec.europa.eu/clima/policies/ets/revision/docs/impact_assessment_en.pdf
EC. (2015c). Best practices for promoting compliance with the harmonised rules on significant
capacity reductions and (partial) cessations of operations.
EUCO. (2014). European Council Conclusions 23/24 October (EUCO 169/14). Brussels: European
Council. Retrieved from
http://www.consilium.europa.eu/uedocs/cms_data/docs/pressdata/en/ec/145397.pdf
Sandbag. (2014). Slaying the Dragon: Vanquish the surplus and rescue the ETS. London: Sandbag.
Retrieved from https://sandbag.org.uk/site_media/pdfs/reports/Sandbag-ETS2014-
SlayingTheDragon.pdf

MARNL15562 37
Annex I. Administrative costs in the EC impact
assessment
I.1 Background
The impact assessment (IA) that accompanies the Commission’s proposal for a revised ETS directive
presents a detailed analysis of various impacts of the proposed ETS system post-2020 (EC, 2015b).
Chapter 8.1 of the IA deals with the administrative burden of the policy. The IA defines
administrative costs as the costs incurred by operators and regulators to maintain the system. These
do not include compliance costs required for purchasing allowances. The EU Standard Cost Model is
used to quantify the administrative burden.
The results of this assessment are displayed in Figure 15. In this figure, the additional costs of the
current EC proposal compared to the continuation of current policies (“baseline B”) are depicted. Both
one-off costs and annual costs are taken into account. The administrative costs related to the
benchmark update and the establishment of a new carbon leakage list are not taken into account.
The benchmark update is assumed by the Commission to have hardly any impact on administrative
costs “if the data collection is combined with the NIMs data collection”. This argument assumes that
the benchmark update would not require additional data to be collected nor any additional verification
of otherwise non-verified data.
Figure 15: From the EC impact assessment: Additional administrative costs of an additional data collection (so-called NIMs data collection) and using production level adjustments, following EC IA
(p. 186-187)
As shown in Figure 15, the total additional costs of the proposed policy are mostly caused by the
administrative costs for additional NIMs exercises. Production level adjustments only account for a
small share (3%) of the additional costs according to the impact assessment.
Based on the EC’s previous experience, the EC estimates that the assignment of sectors and sub-
sectors into carbon leakage groups requires resources in the order of magnitude of up to €2 million
(same order of magnitude as NIMs data check).

MARNL15562 38
I.2 Administrative costs of annual production adjustments
Figure 16 shows the annual cost breakdown that leads to the €7.9 million annual costs for annual
production level adjustments. The costs are broken down into four different processes: data collecting
and reporting per installation, verification per installation, data check and allocation decision by
competent authorities, and data check and (non-)rejection by the Commission. The cost difference
with a system based on capacity changes and partial cessation rules is €275,000 per year which
equals €2.8 million in the 2021 – 2030 period as given in Figure 15.
Figure 16: Additional administrative burden of annual production adjustments according to the EC impact assessment (p. 187)
The administrative costs depend on the assumed number of installations that need to report a
capacity change, partial cessation or annual production adjustment. In the IA it is assumed that there
are about 300 capacity changes and 500 partial cessations per year, compared to about 2,000
installations that need to report a production adjustment annually. We assume that the number of
2,000 installations is based on a 15% production threshold, following footnote 70 on p.35 of the IA.
The administrative costs also depend on the assumed costs per installation. These specific costs
appear to be lower for annual production adjustments than for capacity changes and partial
cessations, as is shown in Figure 17. At first sight one would assume that the costs per installation
would be the same for partial cessations as compared to annual production adjustments, because in
both cases essentially a production level change is reported which leads to a change in allocation. The
costs are indeed the same, except for the “data check and allocation decision” which is a task done
by the competent authorities. We do not know the reason why the costs to competent authorities
would be twice as high in the case of partial cessation compared to annual production adjustments.
The costs for annual production adjustments seem to be a more realistic estimate.

MARNL15562 39
In this report, we have used the specific costs for annual production adjustments to calculate the
administrative cost impact for different production threshold levels.
Coincidentally, these lower specific costs for annual production adjustments combined with the higher
amount of installations that need to report, lead to about the same costs (+4%) as compared to the
capacity changes and cessations option (Figure 16).
Figure 17: Specific administrative costs per reporting installation, based on the EC impact assessment (p. 187)
I.3 Summary of data used
The Commission uses default cost values to arrive at administrative costs estimation. These values
are the following:
Table 2: Default values for assessment of administrative burden
Activity Actor Unit Unit cost
Data collecting and reporting Installation person-day € 300
Verification Installation person-day € 800
Data check and allocation decision Competent
authorities person-year € 100,000
Data check and (non-)rejection Commission person-year € 150,000
These costs are multiplied with the estimated amount of actors, and the required units per actor,
which can vary with different policy measures. The estimations and their constituents are depicted in
Table 3.

MARNL15562 40
Table 3: Total administrative costs for different policy measures to determine the amount of free allocation (p. 187)
Policy
measure
Sub-
measure Activity Actor
No. of
actors
No. of
cost
units
Unit Unit cost Total cost
Administrative costs for
additional NIMs exercises
Data collecting and
reporting Installation 11,000 10 Person-day € 300 € 33,000,000
Verification Installation 11,000 2 Person-day € 800 € 17,600,000
Data check and
allocation decision
Competent
authorities 28 10 Person-year € 100,000 € 28,000,000
data check and (non-
)rejection Commission 1 10 Person-year € 150,000 € 1,500,000
Production
level
adjustments
Annual
adjustments
Data collecting and
reporting Installation 2,000 2 Person-day € 300 € 1,200,000
Verification Installation 2,000 0.5 Person-day € 800 € 800,000
Data check and
allocation decision
Competent
authorities 28 2 Person-year € 100,000 € 5,600,000
data check and (non-
)rejection Commission 1 2 Person-year € 150,000 € 300,000
Capacity
changes
Data collecting and
reporting Installation 300 10 Person-day € 300 € 900,000
Verification Installation 100 5 Person-day € 800 € 400,000
Data check and
allocation decision
Competent
authorities 28 1 Person-year € 100,000 € 2,800,000
data check and (non-
)rejection Commission 1 1 Person-year € 150,000 € 150,000
Partial cessations
Data collecting and
reporting Installation 500 2 Person-day € 300 € 300,000
Verification Installation 500 0.5 Person-day € 800 € 200,000
Data check and allocation decision
Competent authorities
28 1 Person-year € 100,000 € 2,800,000
data check and (non-
)rejection Commission 1 0.5 Person-year € 150,000 € 75,000
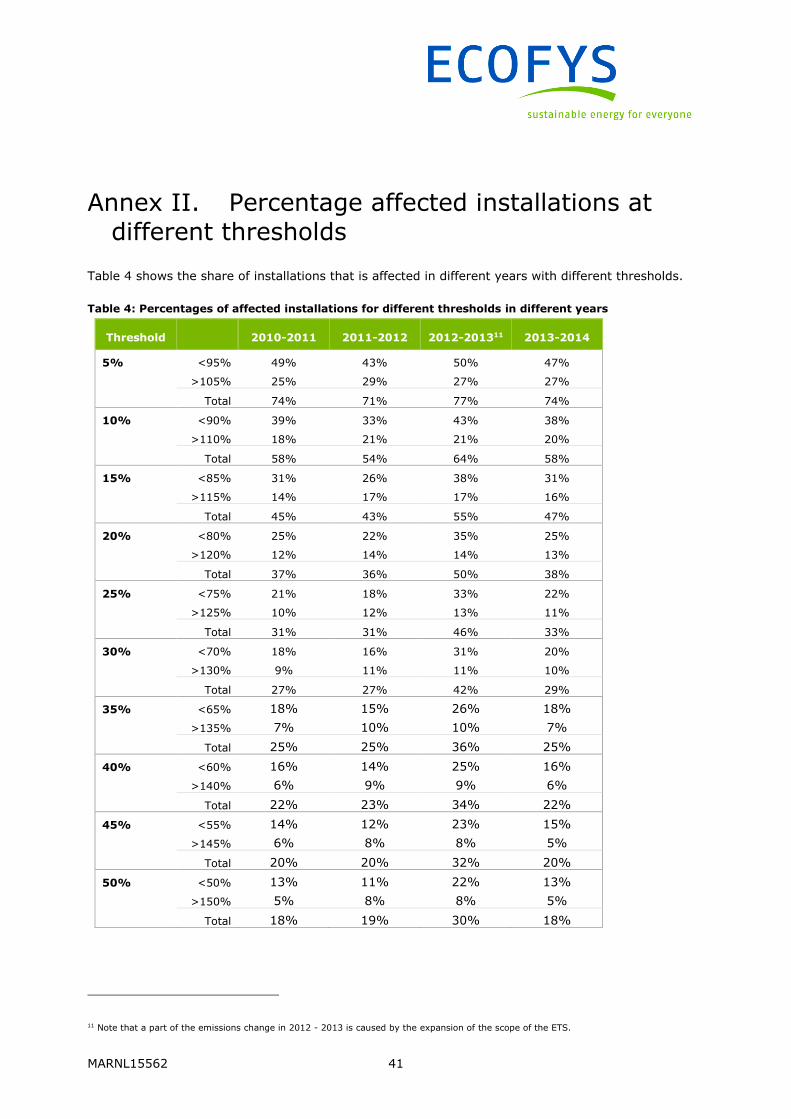
MARNL15562 41
Annex II. Percentage affected installations at
different thresholds
Table 4 shows the share of installations that is affected in different years with different thresholds.
Table 4: Percentages of affected installations for different thresholds in different years
Threshold 2010-2011 2011-2012 2012-201311 2013-2014
5% <95% 49% 43% 50% 47%
>105% 25% 29% 27% 27%
Total 74% 71% 77% 74%
10% <90% 39% 33% 43% 38%
>110% 18% 21% 21% 20%
Total 58% 54% 64% 58%
15% <85% 31% 26% 38% 31%
>115% 14% 17% 17% 16%
Total 45% 43% 55% 47%
20% <80% 25% 22% 35% 25%
>120% 12% 14% 14% 13%
Total 37% 36% 50% 38%
25% <75% 21% 18% 33% 22%
>125% 10% 12% 13% 11%
Total 31% 31% 46% 33%
30% <70% 18% 16% 31% 20%
>130% 9% 11% 11% 10%
Total 27% 27% 42% 29%
35% <65% 18% 15% 26% 18%
>135% 7% 10% 10% 7%
Total 25% 25% 36% 25%
40% <60% 16% 14% 25% 16%
>140% 6% 9% 9% 6%
Total 22% 23% 34% 22%
45% <55% 14% 12% 23% 15%
>145% 6% 8% 8% 5%
Total 20% 20% 32% 20%
50% <50% 13% 11% 22% 13%
>150% 5% 8% 8% 5%
Total 18% 19% 30% 18%
11 Note that a part of the emissions change in 2012 - 2013 is caused by the expansion of the scope of the ETS.
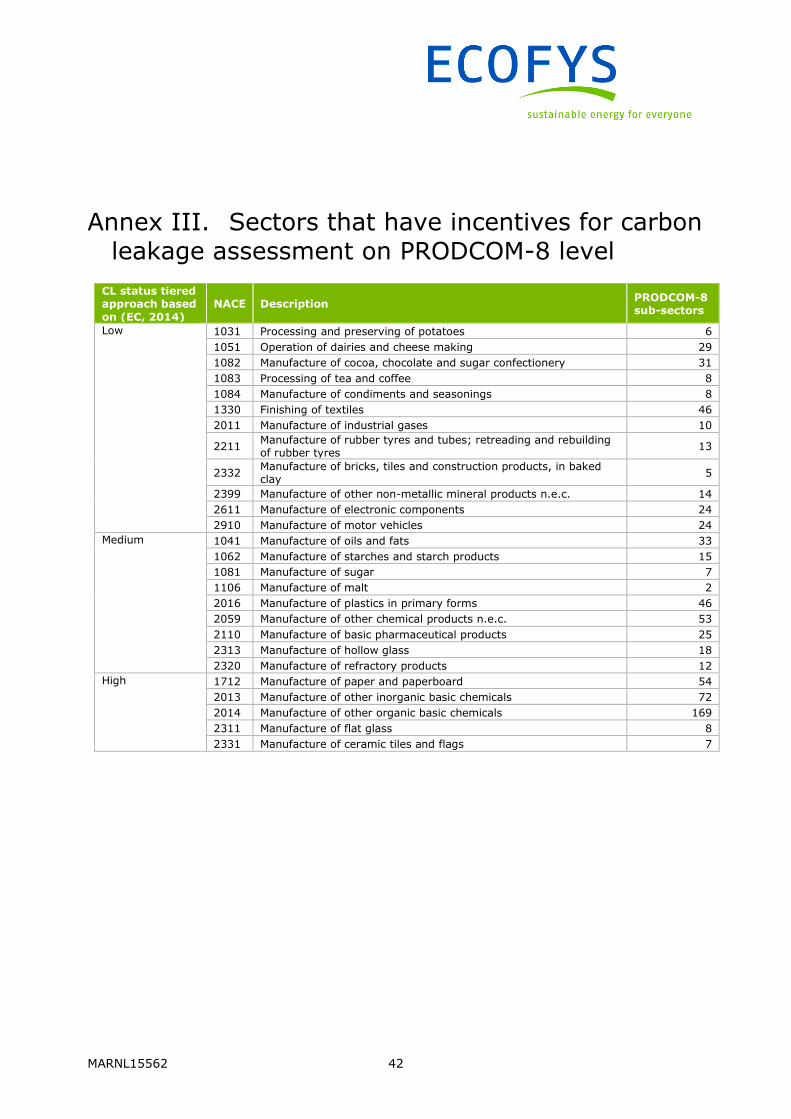
MARNL15562 42
Annex III. Sectors that have incentives for carbon leakage assessment on PRODCOM-8 level
CL status tiered approach based
on (EC, 2014)
NACE Description PRODCOM-8 sub-sectors
Low
1031 Processing and preserving of potatoes 6
1051 Operation of dairies and cheese making 29
1082 Manufacture of cocoa, chocolate and sugar confectionery 31
1083 Processing of tea and coffee 8
1084 Manufacture of condiments and seasonings 8
1330 Finishing of textiles 46
2011 Manufacture of industrial gases 10
2211 Manufacture of rubber tyres and tubes; retreading and rebuilding of rubber tyres
13
2332 Manufacture of bricks, tiles and construction products, in baked clay
5
2399 Manufacture of other non-metallic mineral products n.e.c. 14
2611 Manufacture of electronic components 24
2910 Manufacture of motor vehicles 24
Medium
1041 Manufacture of oils and fats 33
1062 Manufacture of starches and starch products 15
1081 Manufacture of sugar 7
1106 Manufacture of malt 2
2016 Manufacture of plastics in primary forms 46
2059 Manufacture of other chemical products n.e.c. 53
2110 Manufacture of basic pharmaceutical products 25
2313 Manufacture of hollow glass 18
2320 Manufacture of refractory products 12
High
1712 Manufacture of paper and paperboard 54
2013 Manufacture of other inorganic basic chemicals 72
2014 Manufacture of other organic basic chemicals 169
2311 Manufacture of flat glass 8
2331 Manufacture of ceramic tiles and flags 7

ECOFYS Netherlands B.V. | Kanaalweg 15G | 3526 KL Utrecht| T +31 (0)30 662-3300 | F +31 (0)30 662-3301 | E [email protected] | I www.ecofys.com

ECOFYS Netherlands B.V.
Kanaalweg 15G
3526 KL Utrecht
T: +31 (0) 30 662-3300
F: +31 (0) 30 662-3301
I: www.ecofys.com