impact of fringe benefits on job satisfaction...
TRANSCRIPT
http://www.iaeme.com/ijmhrm.asp 46 [email protected]
International Journal of Marketing and Human Resource Management (IJMHRM)
Volume 6, Issue 3, Sep-Dec (2015), pp. 46-67, Article ID: IJMHRM_06_03_006
Available online at http://
http://www.iaeme.com/currentissue.asp?JType=IJMHRM&VType=6&IType=3
ISSN Print: ISSN 0976 – 6421 and ISSN Online: 0976 – 643X
© IAEME Publication
___________________________________________________________________________
IMPACT OF FRINGE BENEFITS ON JOB
SATISFACTION IN MINING AND
CONSTRUCTION COMPANIES IN INDIA
Dr. B. Charith
Associate Professor, AMET Business School, AMET University,
Cite This Article: Dr. B. Charith, Impact of Fringe Benefits on Job
Satisfaction In Mining and Construction Companies In India. International
Journal of Marketing and Human Resource Management, 6(3), 2015, pp. 46-
67. http://www.iaeme.com/currentissue.asp?JType=IJMHRM&VType=6&IType=3
Fringe benefits, or that part of the total compensation package other than pay for
time worked provided to employees in whole or in part by employer payments, play a
major role in the structuring of compensation packages (Williams, 1995:1097). If
asked about their organization’s compensation programs, most managers criticize
them as not working (Jensen & McMullen, 2007:2). This statement reflects the
opinion of various managers in the corporate world, as they are powerless with
regards to the compensation of their employees and the limitations which are placed
by the laws of the organization on the structuring of their employee’s remuneration
packages. Managers have the authority to make major business decisions sometimes
worth millions of Rupees, but they don’t always have the authority to change the
structure of their employees’ remuneration packages (Jensen & McMullen, 2007:2).
Most remuneration packages are based on market related information, and one can
ask the question – do these market related rewards reflect the contribution that a
specific employee makes to an organization? (Jensen & McMullen, 2007:2).
Today’s managers do not believe that their organization’s compensation programs
are effective in getting the desired results for which they are held accountable (Jensen
& McMullen, 2007:2). For most managers, compensation is their largest controllable
operating expense. If it is successfully managed, the compensation offered to
employees gives them a great tool to achieve the best possible business results. When
managers or employees criticize the organization’s remuneration packages or reward
structures, it is often assumed that money is the reason. But people or employees are
motivated by more than just money. According to Jensen and McMullen (2007:5),
some people say that money is not a motivator for them at all. According to
McCaffery and Harvey (1997:1), there are six key reasons why remuneration
packages need to be structured, and why fringe benefits will not be eliminated.
Impact of Fringe Benefits on Job Satisfaction In Mining and Construction Companies In India
http://www.iaeme.com/ijmhrm.asp 47 [email protected]
It’s the law: Certain fringe benefits are required by law. In the United States Social
Security, Medicare, and Family and Medical Leave are mandated federally. All the
states require workers’ compensation coverage and unemployment insurance. A few
states have non-occupational temporary disability benefit laws and mandatory health
benefit coverage.
Duty to bargain with unions: Virtually every conceivable employee benefit qualifies
as a “mandatory subject for bargaining” under federal labour law. This means that in
collective bargaining, employers cannot ignore union proposals or eliminate benefit
coverage unilaterally.
Competition: Even most small employers now sponsor some benefit plans for their
employees – if only paid-time-off allowances and employee-pay-all coverage. A
company opting for an “all cash” compensation program certainly would be
disadvantaged competitively in the employment marketplace.
Benefits are tax-advantaged: Unlike pay, which is subject to federal and state taxes,
most benefits enjoy either a tax-exempt or tax-deferred status. This enables employers
to take current-year tax deductions for expenditures without directly or immediately
increasing employees’ taxable income.
Employees want benefits: Employees are accustomed to receiving benefit coverage
as part of their total compensation. They realize that because of tax advantages and
economies-of-scale, they are better off having their employers provide benefits. This
is evident especially in flexible (cafeteria) plans where most employees forego cash
pay-outs for benefit choices.
Benefits support employer strategies: Companies find that certain benefits are often
more effective than pay in helping to achieve objectives related to recruitment,
retention and motivation of employees, cost management, and social responsibility.
Examples of this are profit-sharing plans, work-and-family programs and flexible
benefit plans.
The bottom line is every organization is different – different employees with
different cultures, different needs and different objectives (Jensen & McMullen,
2007:157). Effective benefits will align employee needs with the organization’s goals,
and this is based on careful research into what employees want what the organization
offers, what it wants to offer, and ultimately what it can afford to offer.
PROBLEM STATEMENT
The study addresses the impact that fringe benefits have on the level of job
satisfaction and engagement of the employees of Mining Services. In the mining and
construction industries all over the world the remuneration of employees differs from
country to country within the organization and this can lead to confrontations when
employees compare remuneration packages amongst one another. The study aims to
compare job satisfaction and engagement of employees working in India.
To determine the appropriate compensation for the value of the work becomes
even more difficult when dealing with a global organization. This matter becomes
even more complicated when an organization’s boundaries stretch across country
borders. It is therefore important to compensate employees according to the market
value in each individual country as well as keeping in mind cultural diversities when
remuneration packages are structured.
Job satisfaction can only exist when the interests of both the employee and the
organization are in equilibrium. The organization relies on the manager to evaluate
Dr. B. Charith
http://www.iaeme.com/ijmhrm.asp 48 [email protected]
the value of the work performed by an employee, and with the interest of the s at
heart, to determine the appropriate remuneration for this work. In order to offer the
employee compensation which is competitive with other companies’ and appropriate
for the employee’s duties, the manager needs to have an in-depth understanding of the
real value of the work.
RESEARCH OBJECTIVES
The research objectives are divided into general objectives and specific objectives.
General objectives
The general objective of this research is to determine the impact of fringe benefits on
job satisfaction and engagement for employees working for mining and construction
in India.
Specific objectives
The specific objectives of this study are:
To determine the importance of fringe benefits amongst employees
To determine the impact of fringe benefits on employee engagement
To determine the impact of fringe benefits on job satisfaction
To gain better knowledge of the structuring of remuneration packages
RESEARCH METHOD
The research method consists of a literature review and an empirical study.
Literature review
The literature review focuses on the structuring of remuneration packages, fringe
benefits and their impact on job satisfaction and engagement.
Research design
One of the most popular and effective measurement tools to determine the impact that
fringe benefits have on job satisfaction and engagement is a research survey.
Therefore, a questionnaire was designed specifically for employees to obtain
information regarding their perceptions on job satisfaction, engagement, remuneration
and benefits. A questionnaire of four sections was developed. Section A consisted of
fifteen questions regarding job satisfaction. Section B consisted of fifteen questions
regarding engagement. Section C comprised of fifteen questions about fringe benefits
and remuneration. Section D consisted of seven questions regarding the participant’s
biographical information. The participants, employees, were informed that the
purpose of the questionnaire was to gather responses on how they perceived the
impact that remuneration packages and fringe benefits have on job satisfaction and
engagement.
Participants of survey
The participants represent the total of all employees of a global mining services
company. Participation was supported by management and made compulsory. All 57
employees completed questionnaires that were collected for analysis. Employees from
different areas, gender, age, academic levels and income groups participated. The
Impact of Fringe Benefits on Job Satisfaction In Mining and Construction Companies In India
http://www.iaeme.com/ijmhrm.asp 49 [email protected]
majority of the respondents were in the age group 36 – 40 (28.1%). Educational levels
revealed that the majority (68.4%) of participants have a Grade 12 and/or higher
qualification.
Measuring instrument
Questions were answered based upon the five-point agreement-disagreement Likert
format, varying from strongly agree to strongly disagree. However, for the purpose of
this study, the scaling was adapted to a four-point scale to force the participants to
select a definite opinion rather than choosing the middle option of “Neither agree nor
disagree”. Likert’s scaling is based on a bipolar scaling method.
The questionnaire comprised of four sections. The first part consisted of fifteen
statements directly related to job satisfaction. The second section had fifteen questions
about the organization’s commitment towards the participant, and the third part
contained the last fifteen statements regarding the remuneration and benefits that
participants receive at mining and construction industries. Questions in the last section
were specifically included to gather demographic characteristics of the participants
such as gender, nationality, age group, residential area, academic background and
years of service at mining and construction industries.
RESEARCH PROCEDURE
Responses were gathered from participants on all the items of the questionnaire.
Participants consisted of employees of mining and construction companies who are
working in Mumbai, Delhi and Delhi. All responses were used for data and statistical
analysis.
LIMITATIONS
It was anticipated that a limited number of employees in mining and construction
would be available for participation in this comparative study. The structure of
remuneration packages is confidential and therefore employees might have been
hesitant to answer questions regarding fringe benefits and remuneration. The level of
literacy in India differs immensely and therefore the completion of questionnaires by
certain individuals might have been problematic, and could require the services of a
translator.
LITERATURE STUDY
A thorough literature study needs to be conducted to form a complete
conceptualization of the terms job satisfaction, engagement, fringe benefits and
remuneration. For the purpose of clarification the following definitions will be apply
to this study.
DEFINITIONS
For the purpose of this research, terms used in the chapter are defined as follows:
Basic Salary: This is the cash compensation that the employee receives for the duties
that he performs. This component normally reflects the value of the work that is
performed and does not reflect the experience or performance of the individual.
Car Allowance: This includes the benefit to the employee of a cash component in his
salary for the purpose of buying and maintaining a vehicle suitable for performing his
duties, or the use of a company vehicle that would assist him in performing his duties,
or the use of a pool vehicle that would assist him in performing his duties.
Dr. B. Charith
http://www.iaeme.com/ijmhrm.asp 50 [email protected]
Contract Employee: Defined in the Conditions of Service as employees engaged for
a stated period of time with or without an option for renewal. Employee: Defined in the Practical Guide to Remuneration Packaging as:
i) Any person (other than a company) who receives any remuneration or to
whom any remuneration accrues.
ii) Any person who received remuneration or to whom any remuneration accrues
by reason of any services rendered by such person to or on behalf of a labour broker.
Employer: Defined in the Practical Guide to Remuneration Packaging as any person
who pays or is liable to pay to any person any amount by way of remuneration, and
any person responsible for the payment of any amount by way of remuneration to any
person under the provisions of any law.
Family of an employee: Defined in the Conditions of Service as the employee, one
spouse and a maximum of four unmarried children or dependants until they are no
longer dependant. These, however, must be registered with the company. Children or
dependants who have offspring of their own will be automatically excluded from any
benefits.
Gross income: Defined in the Practical Guide to Remuneration Packaging as in
relation to any year or period of assessment means:
In the case of any resident, the total amount, in cash or otherwise, received by or
accrued to in favor of such resident; or
In the case of any person other than a resident, the total amount, in cash or otherwise,
received by or accrued to or in favor of such person from a source within or deemed
to be within the Republic.
Group Life Insurance: This includes the contribution that the employer pays on
behalf of the employee for the purpose of life insurance or disability insurance of the
employee whilst the employee is performing his duties.
Housing Allowance: This includes the cash component that the employee receives
for the purpose of contributing to the rental of suitable accommodation, or the
contribution to paying for his own accommodation.
Medical Aid Contribution: This includes the contribution that the employer pays on
behalf of the employee for the medical aid cover of the employee as well as his
immediate family members that are also covered by this medical aid cover.
Pension: It is defined in the Practical Guide to Remuneration Packaging as an annuity
payable under any law or under the rules of a pension fund or provident fund or by an
employer to a former employee of that employer or to the dependant or nominee of a
deceased person who was employed by such employer.
Pension Fund Contribution: This includes the contribution that the employer pays
on behalf of the employee for the purpose of having a pension fund or provident fund,
or any fund or insurance that has the same intend, for the employee.
Permanent Employee: Defined in the Conditions of Service as employees engaged
with a view to long-term employment in the organization.
Remuneration: The term “remuneration” as explained in the Practical Guide to
Remuneration Packaging, includes salary, advances to directors, leave pay,
allowances, overtime pay, bonuses, taxable section 8A, 8B and 8C share options,
disposals and gains, commissions, gratuities, pensions, annuity and retirement
payments and any of the special taxable benefits described in the Seventh Schedule.
Impact of Fringe Benefits on Job Satisfaction In Mining and Construction Companies In India
http://www.iaeme.com/ijmhrm.asp 51 [email protected]
The term “remuneration” excludes amounts or benefits received in a trade carried on
independently, that is, with no control or supervision of the manner in which the
duties are performed or of the hours of work, provided payment is made at irregular
intervals. A director of a company is specially deemed to be in receipt of
remuneration for the purpose of fringe benefit tax.
Salary: defined in the Practical Guide to Remuneration Packaging as salary, wages or
similar remuneration payable by an employer to an employee, but does not include
any bonus or any other amount.
Temporary Employee: defined in the Conditions of Service as employees engaged
for relatively short periods of time, for particular jobs or assignments, the duration of
which is not stated, and whose services may no longer be required on the completion
of the particular job or assignment.
JOB AND BENEFIT SATISFACTION
As a manager in the modern organization, one must be fully aware of the diverse
cultures in the organization as well as the human resources practices needed to
establish the best workable solutions for an optimal reward strategy. If one has all
these aspects successfully implemented in the organization, it would ultimately lead to
better individual and organizational performance (Jensen & McMullen 2007:38).
The manager cannot force people to perform nor can he satisfy all their needs, but
he is, however, able to create a motivating climate in which his employees are
motivated to perform well and to experience job satisfaction (Coetsee, 2003:58).
According to Milkovich and Newman (2005:272), some of the advantages of a
successful compensation structure are:
People join a firm because of pay structures
People stay in a firm because of pay structures
People agree to develop job skills because of pay
People perform better on their jobs because of pay
Most well-known theories on the principle of motivation revolve around the idea
that an employee’s needs influence his motivation. An employee’s needs could be
characterized as physiological or psychological deficiencies that trigger specific
behavior from the employee. The needs of employees could vary over time and place
and are subject to the influence of external and environmental factors. This implies
that people will react to satisfy those needs that are not fully satisfied (Kreitner &
Kinicki, 2007: 236).
Motivation of employees
Employers tend to utilize default remuneration styles despite the histl and failure of
the tried and true solutions that have been used to address conditions in the new
organization (Tropman, 2001:18). It is worth noting that organizations depend on the
commitment and motivation of their employees. Overloading them, stressing them,
micro-managing them, or letting work spill over into their private lives does not
develop the engagement and loyalty organizations need to succeed (Cooper, 2008:18).
According to Tropman (2001:18), repeated attempts are sustained in part by false
theories about the employees, which form an integral element in the resistance to
change.
These false theories are explained by Tropman (2001:18) as follows:
Dr. B. Charith
http://www.iaeme.com/ijmhrm.asp 52 [email protected]
Misunderstanding of the motivational component of performance
Misunderstanding of the importance of Theory Y
Misunderstanding of job structures and the order of satisfaction with work and the
completion of good work
Misunderstanding of job satisfiers and job dissatisfies
Misunderstanding of the motivational structure of the employee
Misunderstanding of the cultural conflict between achievement and equality in the
workplace
For the purpose of this paper, the importance of these theories can be explained as
follows:
Components of performance: The employer’s obligation towards the organization is
not only limited to recruiting the suitable employee, but also to develop existing
employees. Employers regularly underestimate their own responsibility towards
employees and their performance. Employees with lesser ability can be motivated in
order to achieve their performance targets whereas those employees with greater
ability do not have to be motivated as much to achieve or exceed the same
performance targets. Employers often overestimate the importance of training, which,
in turn can contribute immensely to the aptitude of employees. It is also an integral
role of the employer to create an organization where employees want to come to work
and understand the importance of their work towards the performance of the
organization (Tropman, 2001:18).
According to Tropman (2001:19), management styles can be divided into either
Theory X or Theory Y styles. The Theory X managers believe that employees are
lazy and do not want to work and that it is the obligation of the employer to either
reward or punish such employees to ensure that they show up and shape up. Theory Y
managers believe the opposite in that employees want to work and that they will get
ultimate job satisfaction from doing a good job. The purpose of the employer is not to
control the employee, but to provide him with the necessary resources to perform his
duties. According to Tropman (2001:19), one of the biggest problems is that
organizations have Theory X mindsets in a Theory Y environment. Old compensation
systems are still, in many ways, driven by Theory X thinking.
Structure of the job: Employers tend to believe that satisfied employees produce
good work, hence they try to create an improved morale with the expectation that it
will lead to improved quality. The employer should instead improve the structure of
the job, which will lead to satisfied employees, which in turn lead to higher quality
and improved productivity. Elements that contribute to employee satisfaction are
meaningful work, successful completion of a task, variety by using different skills,
ability to work on his own and responsibility (Tropman, 2001:20).
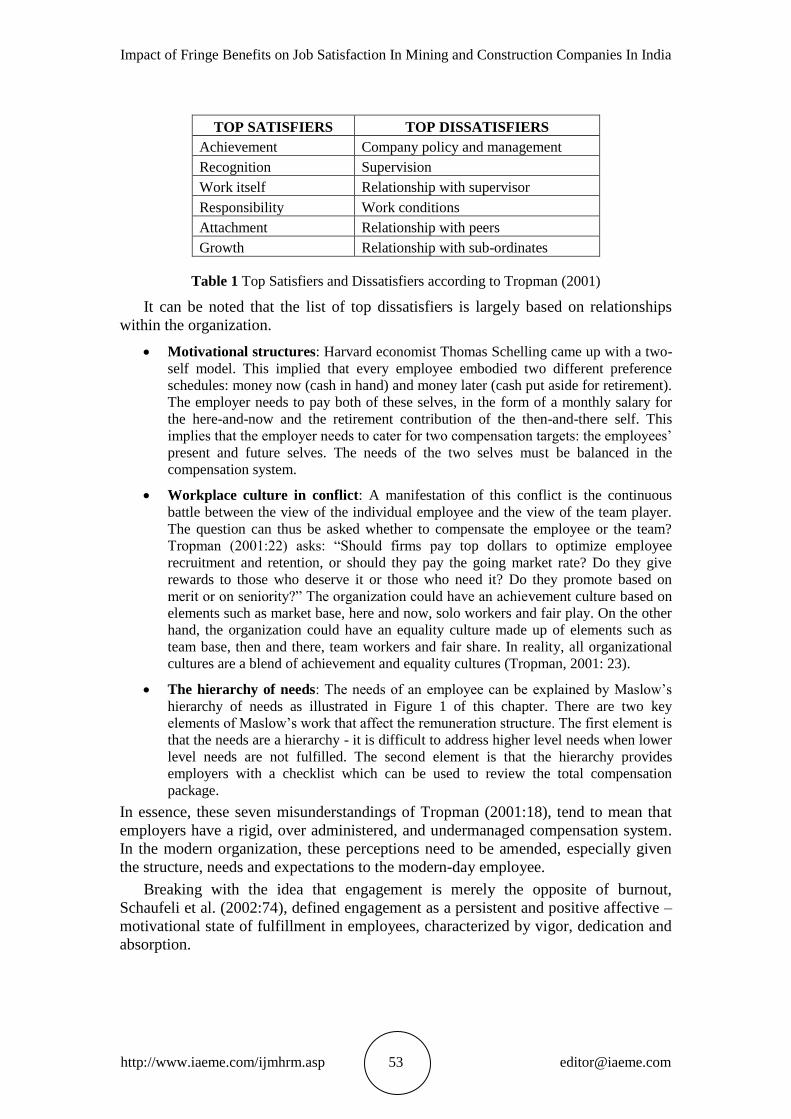
Satisfiers and dissatisfiers: One of the common mistakes made by employers is that
they believe that satisfiers and dissatisfiers are the same thing. When an element is
present, it can act as a satisfier, but if the same element is missing, it does not
necessarily mean that it is a dissatisfier and vice versa. Table 1 provides a list of
elements that employees like and dislike, as proposed by (Tropman, 2001:21).
Impact of Fringe Benefits on Job Satisfaction In Mining and Construction Companies In India
http://www.iaeme.com/ijmhrm.asp 53 [email protected]
TOP SATISFIERS TOP DISSATISFIERS
Achievement Company policy and management
Recognition Supervision
Work itself Relationship with supervisor
Responsibility Work conditions
Attachment Relationship with peers
Growth Relationship with sub-ordinates
Table 1 Top Satisfiers and Dissatisfiers according to Tropman (2001)
It can be noted that the list of top dissatisfiers is largely based on relationships
within the organization.
Motivational structures: Harvard economist Thomas Schelling came up with a two-
self model. This implied that every employee embodied two different preference
schedules: money now (cash in hand) and money later (cash put aside for retirement).
The employer needs to pay both of these selves, in the form of a monthly salary for
the here-and-now and the retirement contribution of the then-and-there self. This
implies that the employer needs to cater for two compensation targets: the employees’
present and future selves. The needs of the two selves must be balanced in the
compensation system.
Workplace culture in conflict: A manifestation of this conflict is the continuous
battle between the view of the individual employee and the view of the team player.
The question can thus be asked whether to compensate the employee or the team?
Tropman (2001:22) asks: “Should firms pay top dollars to optimize employee
recruitment and retention, or should they pay the going market rate? Do they give
rewards to those who deserve it or those who need it? Do they promote based on
merit or on seniority?” The organization could have an achievement culture based on
elements such as market base, here and now, solo workers and fair play. On the other
hand, the organization could have an equality culture made up of elements such as
team base, then and there, team workers and fair share. In reality, all organizational
cultures are a blend of achievement and equality cultures (Tropman, 2001: 23).
The hierarchy of needs: The needs of an employee can be explained by Maslow’s
hierarchy of needs as illustrated in Figure 1 of this chapter. There are two key
elements of Maslow’s work that affect the remuneration structure. The first element is
that the needs are a hierarchy - it is difficult to address higher level needs when lower
level needs are not fulfilled. The second element is that the hierarchy provides
employers with a checklist which can be used to review the total compensation
package.
In essence, these seven misunderstandings of Tropman (2001:18), tend to mean that
employers have a rigid, over administered, and undermanaged compensation system.
In the modern organization, these perceptions need to be amended, especially given
the structure, needs and expectations to the modern-day employee.
Breaking with the idea that engagement is merely the opposite of burnout,
Schaufeli et al. (2002:74), defined engagement as a persistent and positive affective –
motivational state of fulfillment in employees, characterized by vigor, dedication and
absorption.
Dr. B. Charith
http://www.iaeme.com/ijmhrm.asp 54 [email protected]
Benefit Satisfaction
Basic benefit satisfaction can be defined as an employee’s attitude towards
organizational benefits focusing on employee safety and security-related needs (Blau
et al., 2001:671). Benefits included under basic benefit satisfaction can be classified
as:
Vacation
Sick Leave
Retirement
Life Insurance
Disability Health x Maternity/Family leave
Career enrichment satisfaction was defined by Blau et al. (2001:671) as “an
employee’s attitude towards organizational benefits focusing on employee
employability and skill development needs.” The benefits included under career
enrichment satisfaction can be classified as:
Release time for continuing education or professional meetings
Educational assistance or reimbursement for tuition
Special work schedules
Rewards for advanced degrees or certification
According to Williams (1995:1098,) benefit satisfaction is important for two reasons:
The costs of employee benefits are high to companies and because costs increases and
generally exceed inflation, therefore companies have implemented changes in
benefits programmes to control costs.
Benefit satisfaction is of theoretical importance because of its potential links with
other important constructs.
Benefit satisfaction may be related to various behavioral attitudes such as
organizational commitment. According to Williams (1995:1098), employee attitudes
towards benefits have been found to be significant determinants of pay satisfaction
and have been linked to behavioral outcomes such as absenteeism and turnover.
Therefore, an understanding of benefit satisfaction may lead to an increased
understanding of other important employee attitudes and behaviours. In a study
conducted by Lust (1990:92) the findings about benefit satisfaction were no surprise:
employees who are more satisfied with their pay are also more satisfied with their
benefits. It goes hand in hand and make up the total compensation package.
ENGAGEMENT
The origin of the term “employee engagement” lies in research into the extent to
which people employ, or leave out, their personal selves when performing their work
roles. When people are engaged, they tend to express themselves physically,
cognitively and emotionally during role performances (Kahn,1990:692).
Engagement is a controversial subject and there are various definitions for this
term. According to Schneider et al. (2009:23), some of the definitions are:
The individual’s involvement and satisfaction as well as enthusiasm for work
Impact of Fringe Benefits on Job Satisfaction In Mining and Construction Companies In India
http://www.iaeme.com/ijmhrm.asp 55 [email protected]
A result that is achieved by stimulating employees’ enthusiasm for their work and
directing it towards organizational success
The extent to which people value, enjoy and believe in what they do
The capability and willingness to help the company succeed, i.e., discretionary
performance
A heightened emotional and intellectual connection that employees have for their job,
organization, manager or co-workers that in turn influences them to apply additional
discretionary effort to their work
Employee engagement is the key to human capital management because it focuses
on managing employees to produce for the organization rather than focusing on what
the organization does for the employees. Employee engagement is different from
employee satisfaction with the latter connoting satiation and the former connoting
energy (Schneider et al., 2009:27). An engaged employee is aware of business
context, and works with colleagues to improve performance within the job for the
benefit of the organization. The organization must work to develop and nurture
engagement, which requires a two-way relationship between employer and employee.
Therefore, employee engagement will be the barometer that determines the
association of a person with the organization (Vazirani, 2007:3).
Research has shown that higher employee engagement is associated with gains in
employee retention and performance, customer service and satisfaction, and business
performance (Wiley, 2009:58).
Engagement challenges
According to Robinson (2008:57), the potential challenges facing the theory behind
engagement include:
Engagement typically goes down as length of service goes up
Experienced people are an asset, so how can organizations engage people who have
been with them for a while and may have had disappointments, such as not being
promoted?
Professionals usually owe their engagement to their profession, not their organization
According to Truss (2009:47), high levels of engagement create a statistically
significant improvement to personal well-being, loyalty, job satisfaction and
performance as well as a reduction in likelihood of leaving.
Truss (2009:47) also states that it is of utmost importance to focus on the
employee job fit, management style, involvement and communication in order to
increase levels of engagement. It should be noted that engagement strategies should
vary depending on the context.
Engagement measurement
According to Schneider et al. (2009:23), the most common measure of employee
engagement used by companies contains four traditional survey items, namely:
How satisfied are you with working for this organization?
Do you plan on working for this organization a year from now?
How proud are you that you work for this organization?
Would you recommend to a friend that he or she come work for this organization?
Dr. B. Charith
http://www.iaeme.com/ijmhrm.asp 56 [email protected]
These questions are normally asked in order to form an index of engagement. These
questions are more inclined to measure the satisfaction that a person experience when
he or she works for an organization.
According to Schneider et al. (2009:23), these questions measure the following three
aspects:
The level of satisfaction with the job security
The level of satisfaction with fringe benefits
The opportunities
No one can argue that the level of satisfaction is not important, but it does not
indicate the level of engagement of the employees. It is important to measure and
manage the level of engagement, as it is the engagement of the employees that costs
the organization money. When the employee is not fully engaged, the organization
still needs to pay his full salary, even though he has not earned it.
In organizations with only average levels of employee engagement, between 30%
and 50% of their payroll is going down the drain (Ayers, 2007:16). The level of
engagement is important for the organization because it needs to maximize the output
it gets from employees, thus maximizing their engagement.
Engagement drivers
Schneider et al. (2009:23) defined engagement as having two major components:
Feelings for engagement - this implies the heightened state of energy and
enthusiasm associated with work and the organization.
Engagement behaviours - this implies the demonstration in the service of
accomplishing organizational goals.
It is obvious that employee engagement feelings and behaviours are different from job
satisfaction - they address different kinds of issues and have different drivers.
According to Schneider et al. (2009:23), the three strongest drivers for feeling of
engagement are:
Feeling that there is full utilization of one’s skill and abilities Seeing that there is a
link between one’s work and the objectives of the organization Being encouraged to
innovate According to Schneider et al. (2009:23), the three strongest drivers for
engagement behaviours are:
Quality of relationships with co-workers
Feeling trusted and respected
Supervisor credibility
In a research study done by Wiley (2009:58), the top ten drivers of employee
engagement are:
Confidence in the organization’s future
A promising future for the employee x Support for work-life balance x Safety is a
priority
Excitement about work
Confidence in the organization’s senior leaders
Satisfaction with recognition
Impact of Fringe Benefits on Job Satisfaction In Mining and Construction Companies In India
http://www.iaeme.com/ijmhrm.asp 57 [email protected]
Corporate responsibility efforts that increase overall satisfaction
Satisfaction with on-the-job training
A manager who treats employees with respect and dignity
From the list of drivers mentioned above, it could be concluded that offering
praise for a job well done is a simple and inexpensive way to encourage employee
engagement.
RESEARCH METHODOLOGY
INTRODUCTION
The main objective of this comparative study is to assess whether there is a definite
correlation between the type of fringe benefits that are included in the remuneration
package of an employee and the level of job satisfaction that the employee
experiences at the workplace, as well as the level of engagement the employee
displays towards his position and the organization.
RESEARCH DESIGN
One of the most popular and effective measurement tools to determine the impact that
fringe benefits have on job satisfaction and engagement is a research survey.
Therefore, a questionnaire was designed specifically for mining and construction
employees to obtain information regarding their perceptions on job satisfaction,
engagement, remuneration and benefits. A questionnaire was developed consisting of
four sections. Section A consisted of fifteen questions regarding job satisfaction.
Section B consisted of fifteen questions regarding engagement. Section C comprised
of fifteen questions about fringe benefits and remuneration. Section D consisted of
seven questions regarding the participant’s biographical information. The participants,
employees, were informed that the purpose of the questionnaire was to gather
responses on how they perceived the impact that remuneration packages and fringe
benefits have on job satisfaction and engagement.
Survey Distribution
The survey distribution is limited to the employees of mining and construction
companies in India. All the employees completed questionnaires, thus representing
the full population. The population distribution is as follows:
All the employees working in the regional office in Mumbai, India
All the employees working in the factory in Delhi, India
Population description
For this study, all employees across all levels in the organization were requested to
complete a questionnaire. In India, the population was divided into two groups:
The employees in the regional office in Mumbai
The employees in the factory in Delhi
The population of the employees in the regional office in Mumbai consists mainly
of middle management and senior management employees. This group of employees
are sub-divided into two groups. The first sub-group is the majority and consists of
Indian, who support the sales and after-sales service of the products in India. The
second sub-group consists of foreign employees who represent several countries from
Dr. B. Charith
http://www.iaeme.com/ijmhrm.asp 58 [email protected]
all over the world. These employees are involved in the administrative support of the
Asian business for the organization. The regional office in Mumbai consists of highly
educated employees who are specialists in their field of expertise and who are brought
to this office for specific functions.
The population of the employees in the factory in Delhi mainly consists of local
employees from that area who are employed in junior positions in the organization.
The employees build components for the construction of electronic detonators and
control equipment, and have limited education. Except for the three people in
management positions, these employees do not have any formal tertiary
qualifications. The population could also be characterized by some permanent
employees and some contract employees who are employed on a six month contract
period.
STATISTICAL ANALYSIS
A total of 57 questionnaires were distributed to three different demographical areas.
The Statistica Version 9.1 (Statsoft, 2005), SPSS (SPSS Inc. 2009) and SAS (SAS
Institute Inc., 2005) programmes were used.
The statistical analysis was divided into six sections:
x Frequency distribution and descriptive statistics of the individual items x
Cronbach’s Coefficient Alpha for each section x Descriptive statistics for the selected
sections x Test for correlation between sections x Test for differences between
demographical areas
Tests for differences in gender, age, experience, academic qualifications and level
in the organization
Frequency Distribution and Descriptive Statistics of the Individual Items
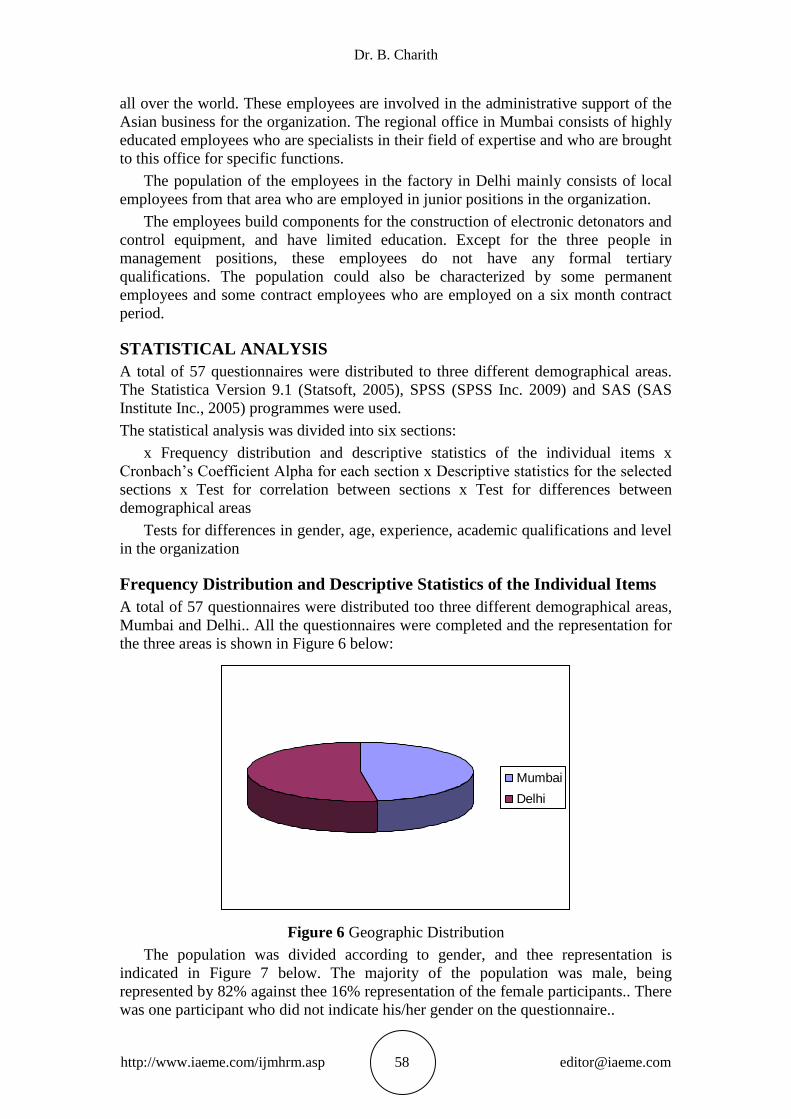
A total of 57 questionnaires were distributed too three different demographical areas,
Mumbai and Delhi.. All the questionnaires were completed and the representation for
the three areas is shown in Figure 6 below:
Figure 6 Geographic Distribution
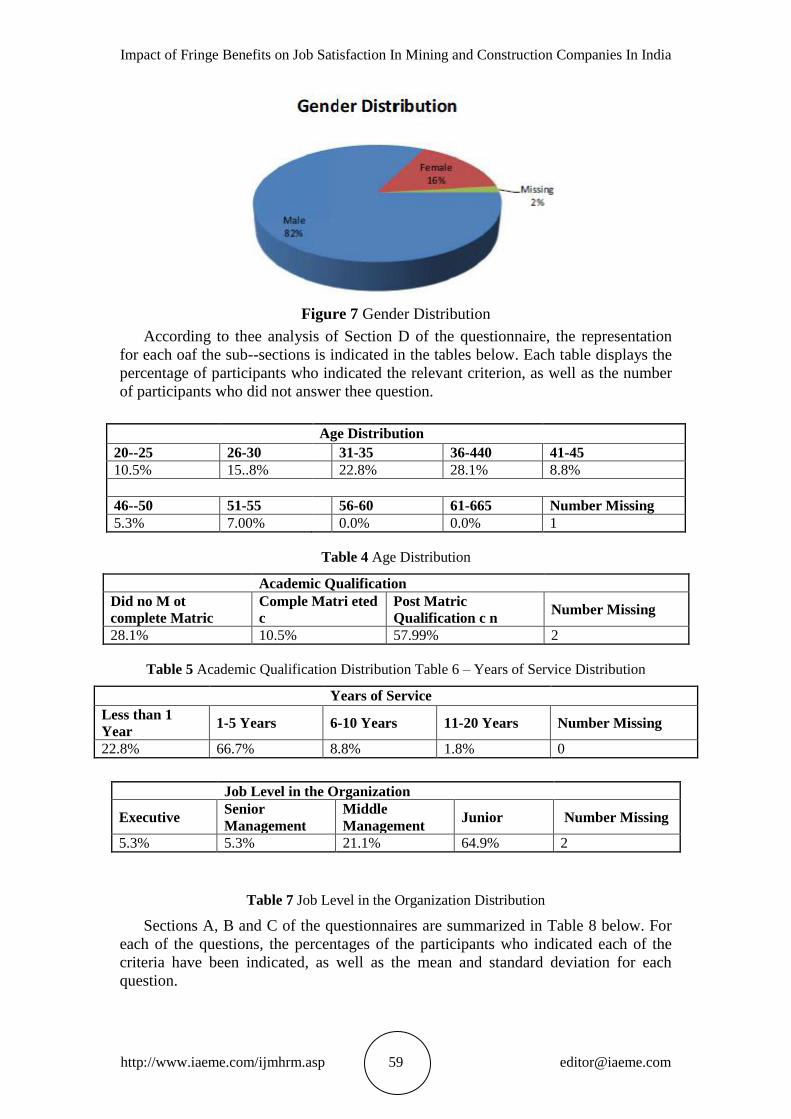
The population was divided according to gender, and thee representation is
indicated in Figure 7 below. The majority of the population was male, being
represented by 82% against thee 16% representation of the female participants.. There
was one participant who did not indicate his/her gender on the questionnaire..
Mumbai
Delhi
Impact of Fringe Benefits on Job Satisfaction In Mining and Construction Companies In India
http://www.iaeme.com/ijmhrm.asp 59 [email protected]
Figure 7 Gender Distribution
According to thee analysis of Section D of the questionnaire, the representation
for each oaf the sub--sections is indicated in the tables below. Each table displays the
percentage of participants who indicated the relevant criterion, as well as the number
of participants who did not answer thee question.
Age Distribution
20--25 26-30 31-35 36-440 41-45
10.5% 15..8% 22.8% 28.1% 8.8%
46--50 51-55 56-60 61-665 Number Missing
5.3% 7.00% 0.0% 0.0% 1
Table 4 Age Distribution
Academic Qualification
Did no M ot
complete Matric
Comple Matri eted
c
Post Matric
Qualification c n Number Missing
28.1% 10.5% 57.99% 2
Table 5 Academic Qualification Distribution Table 6 – Years of Service Distribution
Years of Service
Less than 1
Year 1-5 Years 6-10 Years 11-20 Years Number Missing
22.8% 66.7% 8.8% 1.8% 0
Job Level in the Organization
Executive Senior
Management
Middle
Management Junior Number Missing
5.3% 5.3% 21.1% 64.9% 2
Table 7 Job Level in the Organization Distribution
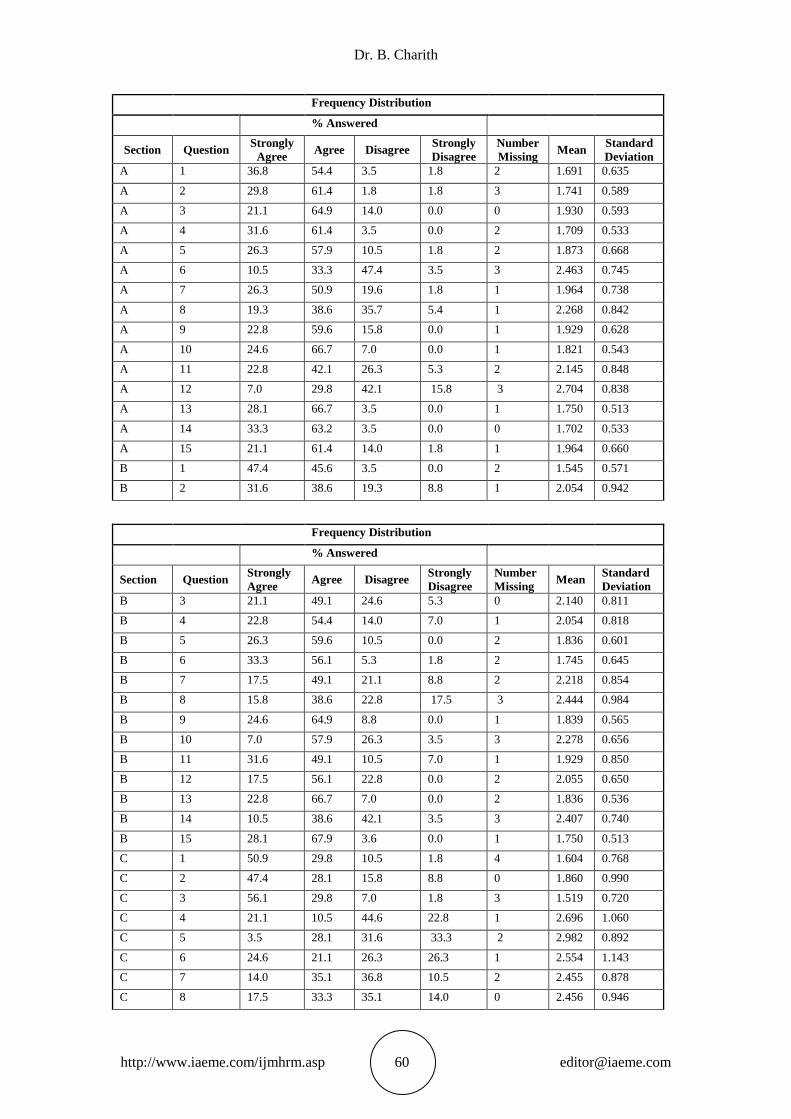
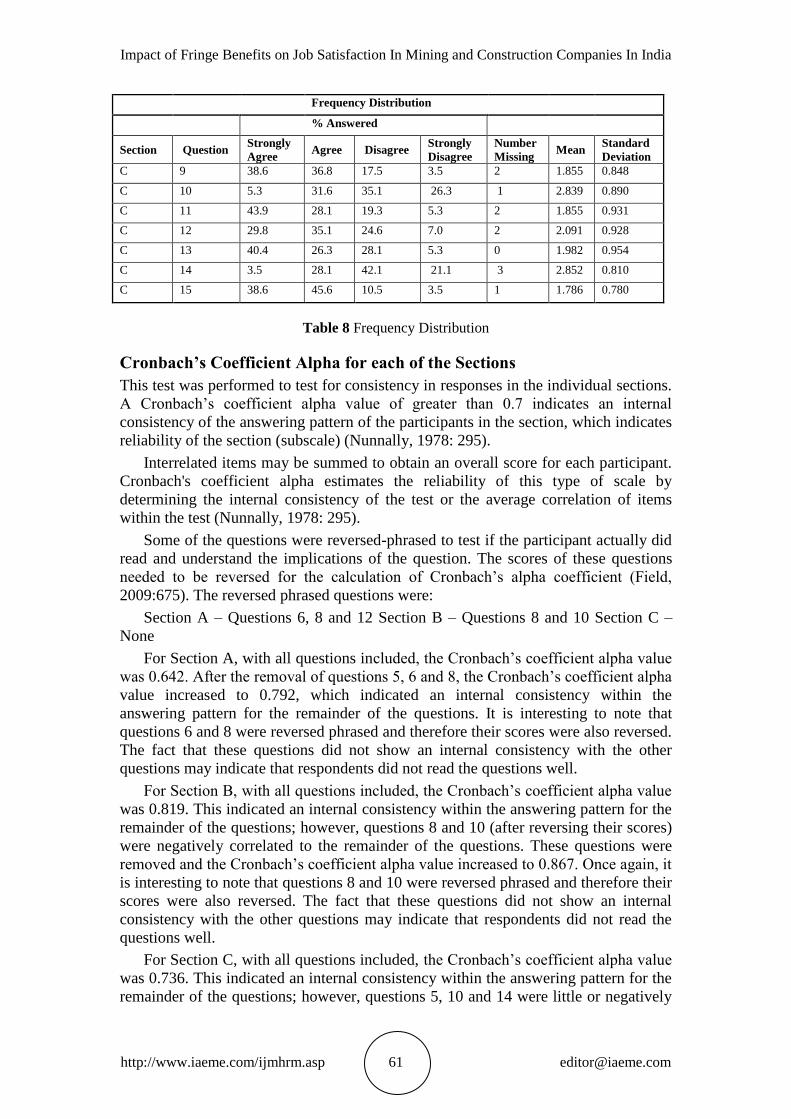
Sections A, B and C of the questionnaires are summarized in Table 8 below. For
each of the questions, the percentages of the participants who indicated each of the
criteria have been indicated, as well as the mean and standard deviation for each
question.
Dr. B. Charith
http://www.iaeme.com/ijmhrm.asp 60 [email protected]
Frequency Distribution
% Answered
Section Question Strongly
Agree Agree Disagree
Strongly
Disagree
Number
Missing Mean
Standard
Deviation
A 1 36.8 54.4 3.5 1.8 2 1.691 0.635
A 2 29.8 61.4 1.8 1.8 3 1.741 0.589
A 3 21.1 64.9 14.0 0.0 0 1.930 0.593
A 4 31.6 61.4 3.5 0.0 2 1.709 0.533
A 5 26.3 57.9 10.5 1.8 2 1.873 0.668
A 6 10.5 33.3 47.4 3.5 3 2.463 0.745
A 7 26.3 50.9 19.6 1.8 1 1.964 0.738
A 8 19.3 38.6 35.7 5.4 1 2.268 0.842
A 9 22.8 59.6 15.8 0.0 1 1.929 0.628
A 10 24.6 66.7 7.0 0.0 1 1.821 0.543
A 11 22.8 42.1 26.3 5.3 2 2.145 0.848
A 12 7.0 29.8 42.1 15.8 3 2.704 0.838
A 13 28.1 66.7 3.5 0.0 1 1.750 0.513
A 14 33.3 63.2 3.5 0.0 0 1.702 0.533
A 15 21.1 61.4 14.0 1.8 1 1.964 0.660
B 1 47.4 45.6 3.5 0.0 2 1.545 0.571
B 2 31.6 38.6 19.3 8.8 1 2.054 0.942
Frequency Distribution
% Answered
Section Question Strongly
Agree Agree Disagree
Strongly
Disagree
Number
Missing Mean
Standard
Deviation
B 3 21.1 49.1 24.6 5.3 0 2.140 0.811
B 4 22.8 54.4 14.0 7.0 1 2.054 0.818
B 5 26.3 59.6 10.5 0.0 2 1.836 0.601
B 6 33.3 56.1 5.3 1.8 2 1.745 0.645
B 7 17.5 49.1 21.1 8.8 2 2.218 0.854
B 8 15.8 38.6 22.8 17.5 3 2.444 0.984
B 9 24.6 64.9 8.8 0.0 1 1.839 0.565
B 10 7.0 57.9 26.3 3.5 3 2.278 0.656
B 11 31.6 49.1 10.5 7.0 1 1.929 0.850
B 12 17.5 56.1 22.8 0.0 2 2.055 0.650
B 13 22.8 66.7 7.0 0.0 2 1.836 0.536
B 14 10.5 38.6 42.1 3.5 3 2.407 0.740
B 15 28.1 67.9 3.6 0.0 1 1.750 0.513
C 1 50.9 29.8 10.5 1.8 4 1.604 0.768
C 2 47.4 28.1 15.8 8.8 0 1.860 0.990
C 3 56.1 29.8 7.0 1.8 3 1.519 0.720
C 4 21.1 10.5 44.6 22.8 1 2.696 1.060
C 5 3.5 28.1 31.6 33.3 2 2.982 0.892
C 6 24.6 21.1 26.3 26.3 1 2.554 1.143
C 7 14.0 35.1 36.8 10.5 2 2.455 0.878
C 8 17.5 33.3 35.1 14.0 0 2.456 0.946
Impact of Fringe Benefits on Job Satisfaction In Mining and Construction Companies In India
http://www.iaeme.com/ijmhrm.asp 61 [email protected]
Frequency Distribution
% Answered
Section Question Strongly
Agree Agree Disagree
Strongly
Disagree
Number
Missing Mean
Standard
Deviation
C 9 38.6 36.8 17.5 3.5 2 1.855 0.848
C 10 5.3 31.6 35.1 26.3 1 2.839 0.890
C 11 43.9 28.1 19.3 5.3 2 1.855 0.931
C 12 29.8 35.1 24.6 7.0 2 2.091 0.928
C 13 40.4 26.3 28.1 5.3 0 1.982 0.954
C 14 3.5 28.1 42.1 21.1 3 2.852 0.810
C 15 38.6 45.6 10.5 3.5 1 1.786 0.780
Table 8 Frequency Distribution
Cronbach’s Coefficient Alpha for each of the Sections
This test was performed to test for consistency in responses in the individual sections.
A Cronbach’s coefficient alpha value of greater than 0.7 indicates an internal
consistency of the answering pattern of the participants in the section, which indicates
reliability of the section (subscale) (Nunnally, 1978: 295).
Interrelated items may be summed to obtain an overall score for each participant.
Cronbach's coefficient alpha estimates the reliability of this type of scale by
determining the internal consistency of the test or the average correlation of items
within the test (Nunnally, 1978: 295).
Some of the questions were reversed-phrased to test if the participant actually did
read and understand the implications of the question. The scores of these questions
needed to be reversed for the calculation of Cronbach’s alpha coefficient (Field,
2009:675). The reversed phrased questions were:
Section A – Questions 6, 8 and 12 Section B – Questions 8 and 10 Section C –
None
For Section A, with all questions included, the Cronbach’s coefficient alpha value
was 0.642. After the removal of questions 5, 6 and 8, the Cronbach’s coefficient alpha
value increased to 0.792, which indicated an internal consistency within the
answering pattern for the remainder of the questions. It is interesting to note that
questions 6 and 8 were reversed phrased and therefore their scores were also reversed.
The fact that these questions did not show an internal consistency with the other
questions may indicate that respondents did not read the questions well.
For Section B, with all questions included, the Cronbach’s coefficient alpha value
was 0.819. This indicated an internal consistency within the answering pattern for the
remainder of the questions; however, questions 8 and 10 (after reversing their scores)
were negatively correlated to the remainder of the questions. These questions were
removed and the Cronbach’s coefficient alpha value increased to 0.867. Once again, it
is interesting to note that questions 8 and 10 were reversed phrased and therefore their
scores were also reversed. The fact that these questions did not show an internal
consistency with the other questions may indicate that respondents did not read the
questions well.
For Section C, with all questions included, the Cronbach’s coefficient alpha value
was 0.736. This indicated an internal consistency within the answering pattern for the
remainder of the questions; however, questions 5, 10 and 14 were little or negatively
Dr. B. Charith
http://www.iaeme.com/ijmhrm.asp 62 [email protected]
correlated to the remainder of the questions. These three questions indicated a high
correlation with one another. After the exclusion of these questions, Cronbach’s
coefficient alpha value increased to 0.799. Due to the high correlation amongst the
three questions, the decision was made to keep questions 5, 10 and 14 as a separate
section with a Cronbach’s coefficient alpha value of 0.860. Section C was thus
divided into two sub-sections; Section C fringe benefits and Section C remuneration.
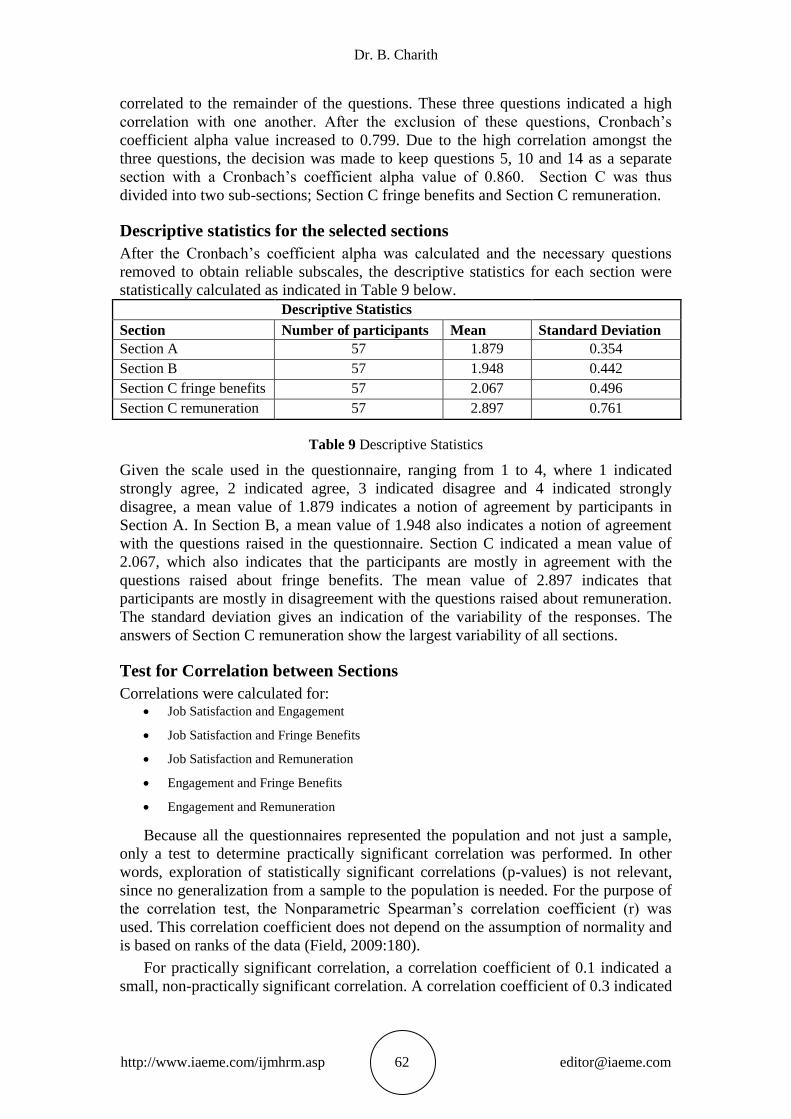
Descriptive statistics for the selected sections
After the Cronbach’s coefficient alpha was calculated and the necessary questions
removed to obtain reliable subscales, the descriptive statistics for each section were
statistically calculated as indicated in Table 9 below.
Descriptive Statistics
Section Number of participants Mean Standard Deviation
Section A 57 1.879 0.354
Section B 57 1.948 0.442
Section C fringe benefits 57 2.067 0.496
Section C remuneration 57 2.897 0.761
Table 9 Descriptive Statistics
Given the scale used in the questionnaire, ranging from 1 to 4, where 1 indicated
strongly agree, 2 indicated agree, 3 indicated disagree and 4 indicated strongly
disagree, a mean value of 1.879 indicates a notion of agreement by participants in
Section A. In Section B, a mean value of 1.948 also indicates a notion of agreement
with the questions raised in the questionnaire. Section C indicated a mean value of
2.067, which also indicates that the participants are mostly in agreement with the
questions raised about fringe benefits. The mean value of 2.897 indicates that
participants are mostly in disagreement with the questions raised about remuneration.
The standard deviation gives an indication of the variability of the responses. The
answers of Section C remuneration show the largest variability of all sections.
Test for Correlation between Sections
Correlations were calculated for: Job Satisfaction and Engagement
Job Satisfaction and Fringe Benefits
Job Satisfaction and Remuneration
Engagement and Fringe Benefits
Engagement and Remuneration
Because all the questionnaires represented the population and not just a sample,
only a test to determine practically significant correlation was performed. In other
words, exploration of statistically significant correlations (p-values) is not relevant,
since no generalization from a sample to the population is needed. For the purpose of
the correlation test, the Nonparametric Spearman’s correlation coefficient (r) was
used. This correlation coefficient does not depend on the assumption of normality and
is based on ranks of the data (Field, 2009:180).
For practically significant correlation, a correlation coefficient of 0.1 indicated a
small, non-practically significant correlation. A correlation coefficient of 0.3 indicated
Impact of Fringe Benefits on Job Satisfaction In Mining and Construction Companies In India
http://www.iaeme.com/ijmhrm.asp 63 [email protected]
a medium, practically visible correlation. A correlation coefficient of 0.5 indicated a
large, practically important correlation (Steyn, 2009:4).
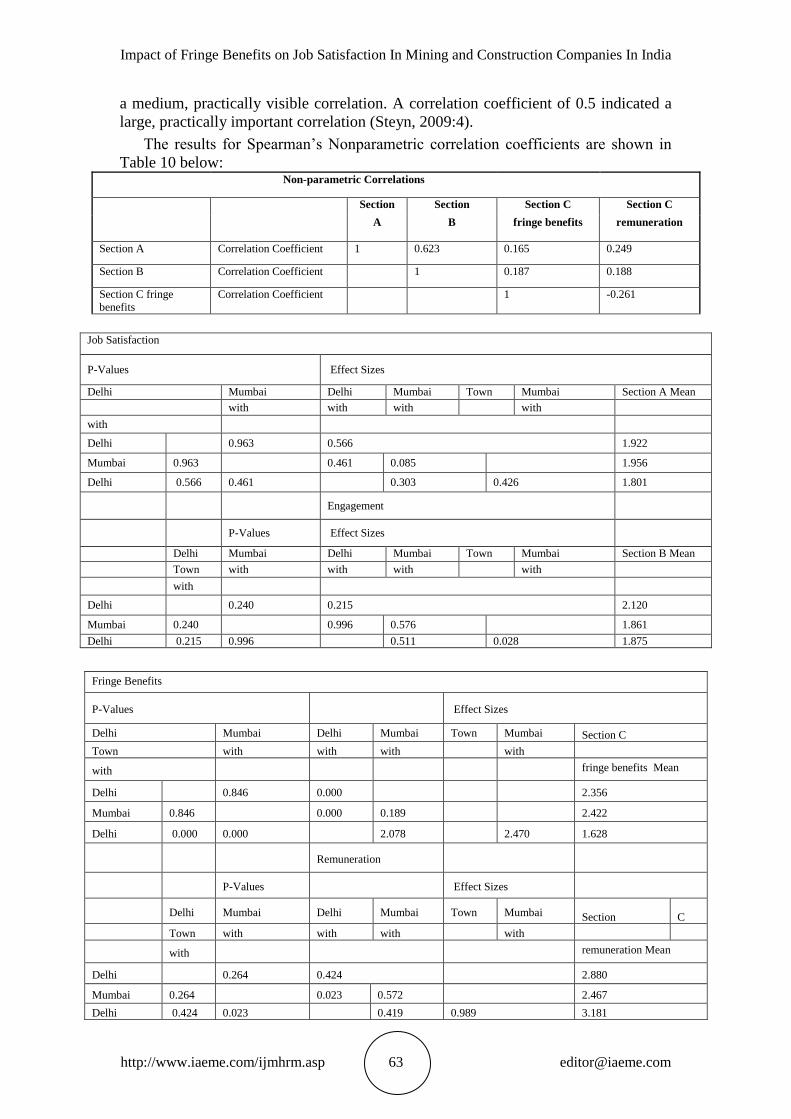
The results for Spearman’s Nonparametric correlation coefficients are shown in
Table 10 below: Non-parametric Correlations
Section Section Section C Section C
A B fringe benefits remuneration
Section A Correlation Coefficient 1 0.623 0.165 0.249
Section B Correlation Coefficient 1 0.187 0.188
Section C fringe
benefits
Correlation Coefficient 1 -0.261
Job Satisfaction
P-Values Effect Sizes
Delhi Mumbai Delhi Mumbai Town Mumbai Section A Mean
with with with with
with
Delhi 0.963 0.566 1.922
Mumbai 0.963 0.461 0.085 1.956
Delhi 0.566 0.461 0.303 0.426 1.801
Engagement
P-Values Effect Sizes
Delhi Mumbai Delhi Mumbai Town Mumbai Section B Mean
Town with with with with
with
Delhi 0.240 0.215 2.120
Mumbai 0.240 0.996 0.576 1.861
Delhi 0.215 0.996 0.511 0.028 1.875
Fringe Benefits
P-Values
Effect Sizes
Delhi Mumbai Delhi Mumbai Town Mumbai Section C
Town with with with with
with fringe benefits Mean
Delhi 0.846 0.000 2.356
Mumbai 0.846 0.000 0.189 2.422
Delhi 0.000 0.000 2.078 2.470 1.628
Remuneration
P-Values Effect Sizes
Delhi Mumbai Delhi Mumbai Town Mumbai Section C
Town with with with with
with remuneration Mean
Delhi 0.264 0.424 2.880
Mumbai 0.264 0.023 0.572 2.467
Delhi 0.424 0.023 0.419 0.989 3.181
Dr. B. Charith
http://www.iaeme.com/ijmhrm.asp 64 [email protected]
Effect sizes for Demographic areas
When the effect sizes for the job satisfaction are reviewed, it can be noted that the
effect size for Delhi with Mumbai is; d = 0.084, which is small, and indicates a small,
non-practically significant difference. This implies that the twodemographical areas
have answered the questions in the section about job satisfaction in the same manner.
When the same effect size for Delhi with Mumbai is reviewed, it indicates a d-value
of 0.303, which is between the small andmedium intervals on the scale. The value is
closer to the small, non-practically significant difference. For the purpose of this
study, this difference is too small to be considered practically significant. The effect
size for Mumbai with Delhi indicates a d-value of 0.426. This d-value is closer to the
practically visible difference value and can be considered practically visible for the
purpose of this paper. The mean values for the three demographical areas indicate that
the employees in Delhi are experiencing an ever so slightly higher level of job
satisfaction than the employees in Mumbai and Delhi.
Test for differences in gender, age, experience, academic qualificationsand
level in the organization
Gender
A t-test was conducted to test whether males and females responded differently to the
sections. The p-value and d-values (effect sizes) of the t-test are shown in Table 13
below. Once again, p-values are reported and interpreted for the sake of completeness.
However, emphasis in interpretation and conclusions should be placed on the effect
sizes (d-values). The questionnaire was completed by 47 males and 9 females.
People perform better on their jobs because of pay
Given the scale used in the questionnaire, ranging from 1 to 4, where 1 indicated
strongly agree, 2 indicated agree, 3 indicated disagree and 4 indicated strongly
disagree, a mean value of 1.879 indicates a notion of agreement by participants in
Section A. In Section B, a mean value of 1.948 also indicates an agreement with the
questions raised in the questionnaire. Section C indicated a mean value of 2.067,
which also indicates that the participants are in agreement with the questions raised
about fringe benefits. The mean value of 2.897 indicates that the participants are in
disagreement with the questions raised about remuneration.
Because all the questionnaires represented the population and not just a sample,
only a test to determine practical correlation was performed. For the purpose of the
correlation test, the Nonparametric Spearman’s correlation coefficient (r) was used.
For practical correlation, a correlation coefficient of 0.1 indicated a small, non-
practically significant correlation. A correlation coefficient of 0.3 indicated a medium,
practically visible correlation. A correlation coefficient of 0.5 indicated a large,
practically important correlation (Steyn, 2009:4).
Job Satisfaction and Engagement: r-value = 0.623, indicating a highly important
correlation. Thus a high level of job satisfaction will imply a high level of
engagement and vice versa.
Job Satisfaction and Fringe Benefits: r-value = 0.165, indicating a low to medium
correlation. Therefore, these two variables show a low practically visible correlation.
This can indicate that the level of job satisfaction of an employee is not dependent on
the fringe benefits an employee receives from the organization.
Impact of Fringe Benefits on Job Satisfaction In Mining and Construction Companies In India
http://www.iaeme.com/ijmhrm.asp 65 [email protected]
Job Satisfaction and Remuneration: r-value = 0.249, indicating a practically
significant correlation. This can indicate that the level of job satisfaction an employee
experiences in the organization is influenced by his remuneration package.
Engagement and Fringe Benefits: r-value = 0.187, indicating a low to medium
correlation. Therefore, these two variables show a low practically significant
correlation. This can indicate that the level of engagement of an employee is not
dependent on the fringe benefits an employee receives from the organization.
Engagement and Remuneration: r-value = 0.188, indicating a low to medium
correlation. Therefore, these two variables show a low practically significant
correlation. This can indicate that the level of engagement of an employee is not
dependent on the remuneration an employee receives from the organization.
Note that the p-values are reported and interpreted in and below this table for
completeness. Since the study was conducted on the entire population, p-values
(statistical significance) are actually not relevant (Ellis & Steyn, 2003:51). For the
post hoc tests effect sizes (practical significance) are calculated and reported, which
can be interpreted for a study of an entire population where generalization from a
sample to a population is not necessary.
The ANOVA test was performed to test for differences. This test consists of the
Omnibus test which is an analysis of variance and which tests whether all the groups
are the same, as well as post hoc tests which make pair-wise comparisons between the
groups. A p-value of less than 0.05 indicates that the three demographic areas did not
answer the questions in each section in the same manner. For the purpose of this
paper, only Section C for both the fringe benefits and the remuneration indicated a
significant difference between the three demographic areas in the answered questions.
Post hoc tests were applied to pair-wise compare the demographic areas and
determine where the differences lie. Because the questionnaires represent the
complete population, will indicate the effect sizes of the post hoc tests will be given
(i.e. p-values of post hoc tests will not be reported).
When the effect sizes for job satisfaction are reviewed, it can be noted that the
effect size for Delhi with Mumbai is d = 0.084, which is small, and indicates a small,
non-practically significant difference. This implies that the two demographical areas
answered the questions in the section about job satisfaction in the same manner. When
the same effect size for Delhi with Delhi is reviewed, it indicates a d-value of 0.303,
which is between the small and medium intervals on the scale. The value is closer to
the small, non-practically significant difference. For the purpose of this study, this
difference is too small to be considered practically significant. The effect size for
Mumbai with Delhi indicates a d-value of 0.426. This d-value is closer to the
practically significant difference value and can be considered practically significant
for the purpose of this paper. The mean values for the three demographical areas
indicate that the employees in Delhi experience an ever so slightly higher level of job
satisfaction than the employees in Mumbai and Delhi.
When the effect sizes for job engagement are reviewed, it can be noted that the
effect size for Delhi with Mumbai is d = 0.576, which is indicates a medium,
practically significant difference. This implies that the two demographical areas
answered the questions in the section about engagement in two different manners.
When the same effect size for Delhi with Delhi is reviewed, it indicates a d-value of
0.511, which again indicates a practically significant difference. The effect size for
Mumbai with Delhi indicates a d-value of 0.028. This value is small and indicates a
non-practically visible difference. The mean values for the three demographical areas
Dr. B. Charith
http://www.iaeme.com/ijmhrm.asp 66 [email protected]
indicate that the employees in Delhi are experiencing a lower level of engagement
than the employees in Mumbai and Delhi.
When the effect sizes for fringe benefits are reviewed, it can be noted that the
effect size for Delhi with Mumbai is d = 0.188, which indicates a small, non-
practically significant difference. This implies that the two demographical areas
experience the same level of motivation from the fringe benefits on their job
satisfaction and engagement. When the same effect size for Delhi with Delhi is
reviewed, it indicates a d-value of 2.078, which is extremely high on the effect size
scale, and indicates practically important difference. The effect size for Mumbai with
Delhi indicates a d-value of 2.469. This d-value again indicates a high practically
important difference. The mean values for the three demographical areas indicate that
the employees in Delhi experience a higher level of motivation from their fringe
benefits than the employees in Mumbai and Delhi.
When the effect sizes for remuneration are reviewed, it can be noted that the effect
size for Delhi with Mumbai is; d = 0.572, which indicates a medium, practically
significant difference. This implies that the two demographical areas experience a
different level of motivation from their remuneration packages on their job
satisfaction and engagement. When the same effect size for Delhi with Delhi is
reviewed, it indicates a d-value of 0.419, which again indicates practically visible
difference. The effect size for Mumbai with Delhi indicates a d-value of 0.989. This
d-value is high, and indicates a high practically important difference. The mean values
for the three demographical areas indicate that the employees in Mumbai experience a
lower level of motivation from their remuneration packages than the employees in
Delhi and Delhi.
A test for differences was done between the various categories of the five sub-
sections within section D: Age, Academic Qualification, Years’ Experience, Level in
the Organization and Gender. This was done to determine whether there were any
differences in the levels of job satisfaction, engagement, fringe benefits and
remuneration for the employees answering the questionnaires with different age,
academic qualifications, years’ experience, level in the organization and gender.
These criteria did not form part of the main focus of the study, thus, they will not be
reported to the same level of detail as the demographical areas.
RECOMMENDATIONS
The effect sizes for the job satisfaction between Delhi and Mumbai indicate a small,
non-practically significant difference. The effect size between Delhi and Delhi
indicate a small, non-practically significant difference. The effect size for Mumbai
with Delhi indicates practically significant. The mean values for the three
demographical areas indicate that the employees in Delhi experience an ever so
slightly higher level of job satisfaction than the employees in Mumbai and Delhi.
These indicators can be used and examined to determine this is so and to carry these
learning events over to Mumbai and Delhi.
The effect sizes for job engagement between Delhi and Mumbai indicate a
medium, practically significant difference. The effect size between Delhi and Delhi
indicates a practically significant difference. The effect size between Mumbai and
Delhi indicates a non-practically significant difference. The mean values for the three
demographical areas indicate that the employees in Delhi experience a lower level of
engagement than the employees in Mumbai and Delhi. These indicators can again be
Impact of Fringe Benefits on Job Satisfaction In Mining and Construction Companies In India
http://www.iaeme.com/ijmhrm.asp 67 [email protected]
studied to identify the drivers behind the higher levels of engagement. These drivers
can then be applied to promote higher levels of engagement in Delhi.
The effect sizes for fringe benefits between Delhi and Mumbai indicate a small,
non-practically significant difference. The effect size between Delhi and Delhi
indicate a practically important difference. The effect size between Mumbai and Delhi
indicates a high practically important difference. The mean values for the three
demographical areas indicate that the employees in Delhi experience a higher level of
motivation from their fringe benefits than the employees in Mumbai and Delhi. These
indicators can be analyzed to determine the fringe benefits that cause the employees
in Delhi to be more satisfied. The remuneration packages of the employees in
Mumbai and Delhi can then be amended with the fringe benefits similar to that of the
employees in Delhi.
The effect sizes for the remuneration between Delhi and Mumbai indicate a
medium, practically significant difference. The effect size between Delhi and Delhi
indicates a practically visible difference. The effect size between Mumbai and Delhi
indicates a high practically important difference. The mean values for the three
demographical areas indicate that the employees in Mumbai experience a lower level
of motivation from their remuneration packages than the employees in Delhi and
Delhi. These indicators can again be studied to determine if the employees in Mumbai
are under the impression that they receive market related salaries. These indicators
can be compared with those of the employees of Delhi and Delhi to determine if
changes will be possible in the remuneration of the employees in Mumbai. From the
statistical data it can be concluded that all employees seem to be overall satisfied with
their fringe benefits and the way that they are structured to the total cost-to-company
packages that are offered to the different demographical areas. The statistical data also
indicates that all employees are overall motivated with an acceptable level of job
satisfaction and engagement. The proposed area that needs to receive additional focus
is that of the cash component of the remuneration package.
REFERENCES
[1] Fred Luthans (2008), Organizational Behavior, McGraw Hill Ltd.
[2] Gary Dessler (2007), Human Resource Management, Pearson Education
Incorporation.
[3] John W. Newstrom (2007), Organizational Behavior – Human Behavior at Work,
Tata McGraw Hill Publishing Co. Ltd.
[4] Kalpan R A, Boshoff A B, Kellerman A M (2005), Job involvement and job
satisfaction of South African Nurses, MEDLINE, PMID: 1845612
[5] Paul Hersey, Kenneth H. Blanchard, Dewey E. Johnson (2005), Management of
Organisational Behavior – Leading Human Resources, Pearson Education
[6] Robert Knoop (1995) Relationships among the job involvement, job satisfaction,
and Organizational commitment of thenurses, The Journal of Psychology, Vol.
129, Issue: 6, page 643.
[7] Singh Mira (1990), Job Satisfaction, Job Involvement and Participation Amongst
Different Categories of Bank Employees, Indian Institute of Management,
Ahmedabad working Papers, 891.
[8] Susan J. Linz, Anastasia Semykina (2005), Attitudes and Performance: An
analysis of Russian Workers, William Davidson Institute Working Paper No.
758.