impact of geochemical characteristics on groundwater
TRANSCRIPT
Impact of Geochemical Characteristics on Groundwater Occurrences and Quality of an Area Underlain by
Weathered Basement and Sandstones Aquifers
1 1 2Sikakwe, G.U. , Ozibo, B.N. and Eyong, G.A.1Department of Physics/Geology/Geophysics, Federal University, Ndufu-Alike Ikwo,
P.M.B 1010 Abakaliki, Nigeria.2Department of Geology, University of Calabar, P.M.B 1115, Calabar, Nigeria.
Corresponding E-mail: [email protected]
Introduction
An adequate knowledge of geochemical characteristics of groundwater is germane to appreciate the geochemical processes and integrated water flow of a geologic environment. This knowledge is useful to identify groundwater sources and sinks, before prognostication of contaminant fate, migration and quality analysis (Pitkanen, et al. 1999, Farn, et al. 2006).
2+ 2+ + + -Major cations (Mg Ca , Na , K and anions (HCO , 32-SO , Cl-) have been used extensively to trace the 4
geochemical evolution of groundwater (Starzynski, 1998). The analysis of water for geochemical characteristics provides much important groundwater occurrence information that is useful in groundwater management and guides the mode of utilization based on quality (Ettazarini, 2005). Existing works on hydrogeochemical investigations of groundwater quality and occurrence studies done elsewhere can be found in Tonetto and Bonotto (2005), Ettazarini, (2005), Edmunds, et al. (1982), Etu-Efeortor, (1998), Udom, et al. (1998), Ozler, (2003) and Lee, et al. (2004).
Preceding works on hydrogeochemical analysis in the study area, Oban Massif can be found in Ushie and Amadi, (2008), Ekwere, (2010), Ekwere and Edet, (2012) and Edet and Ekpo, (2008). In this study, physical and chemical properties are considered. Hydrochemical facies of the area are identified and water quality indices are analyzed to reveal geochemical factors controlling groundwater occurrence and suitability of the water for domestic, industrial and irrigation purposes. The study also determine sources and sinks as a guide for waste disposal in the study area. The study will be a valuable guide to groundwater developers and water quality experts in terms of planning groundwater development and monitoring of water quality due to existing agricultural and mining operations within the study area.
Study Area Description
The study area covers the Precambrian Oban Massif and parts of the Mamfe Embayment in Akamkpa and Biase
AbstractThis study examined the impact of geochemical processes on groundwater quality in Oban Massif and Mamfe Embayment in southeastern Nigeria. This was to assess how geochemical species influence water quality necessary for potability and other domestic uses. Boreholes, dug wells and springs water samples collected from the study area. Physical parameters such as pH, temperature, Eh, Total Dissolved Solids (TDS), and turbidity were measured insitu using standard field equipment. Anions, (SO , HCO , NO , PO and Cl) were analysed in the laboratory using titration 4 3 3 4
2+ 2+ + +and chromatography. Major cations (Mg , Ca , K and Na ) were assayed using AAS and inductively coupled plasma Argon spectrophotometry. Cluster and correlation analysis were used for statistical treatment of data. Trilinear plot identify hydrochemical facies. Comparison of physicochemical parameters with WHO standard for potable water shows that the parameters are within acceptable limits for potable water. Parameters such as pH (5.61-7.20) and fluorine (20mg/L) were above WHO (2006) standard of 6.5-8.5 and 1.5mg/L for potable water respectively.
2-Physicochemical Parameters showing significant correlation at<0.01 are Ec and Alk (r=0.830), SO and Ec 4
(r=0.9000), HCO and Alk (r=0.855), Cl and SO (r=0.990), HCO and PO (0.820) TDS and Cl(r=0.900), Na and 3 4 3 4
B(r=0.930), Ca and S(r=0.800) and F and PO (0.910). Four hydrogeochemical facies: Ca + Mg, Cl+SO , Cl+SO , Na 4 4 4
+ K, Ca + Mg, HCO and HCO , Ca + Mg, predominated by Ca + Mg, Cl+SO characterized the study. HCO , Ca + Mg 3 3 4 3
characterize groundwater recharge zones while Cl+SO -Na+K are probable discharge zones. Sodium absorption ratio 4
values fall within the range suitable for irrigation purpose (<10mg/L). Low TDS and EC values evidenced fresh water condition. Combination of hydrochemical facies HCO , Ca + Mg of basement origin with Cl+SO , Na + K at the 3 4
sedimentary zone is evidence of groundwater-rock interaction, flow and mixing along flow paths. Oxidized and reduced waters are common in the area. Two redox boundaries are in the area. The water sources are potable and suitable for irrigation and other domestic uses.
Keywords: Geochemical characteristics, Groundwater occurrence, Groundwater recharge, Redox boundaries, Hydrochemical facies
Journal of Mining and Geology Vol. 55(2) 2019. pp. 229 - 241
229
Journal of Mining and Geology Vol. 51(2) 2019.230
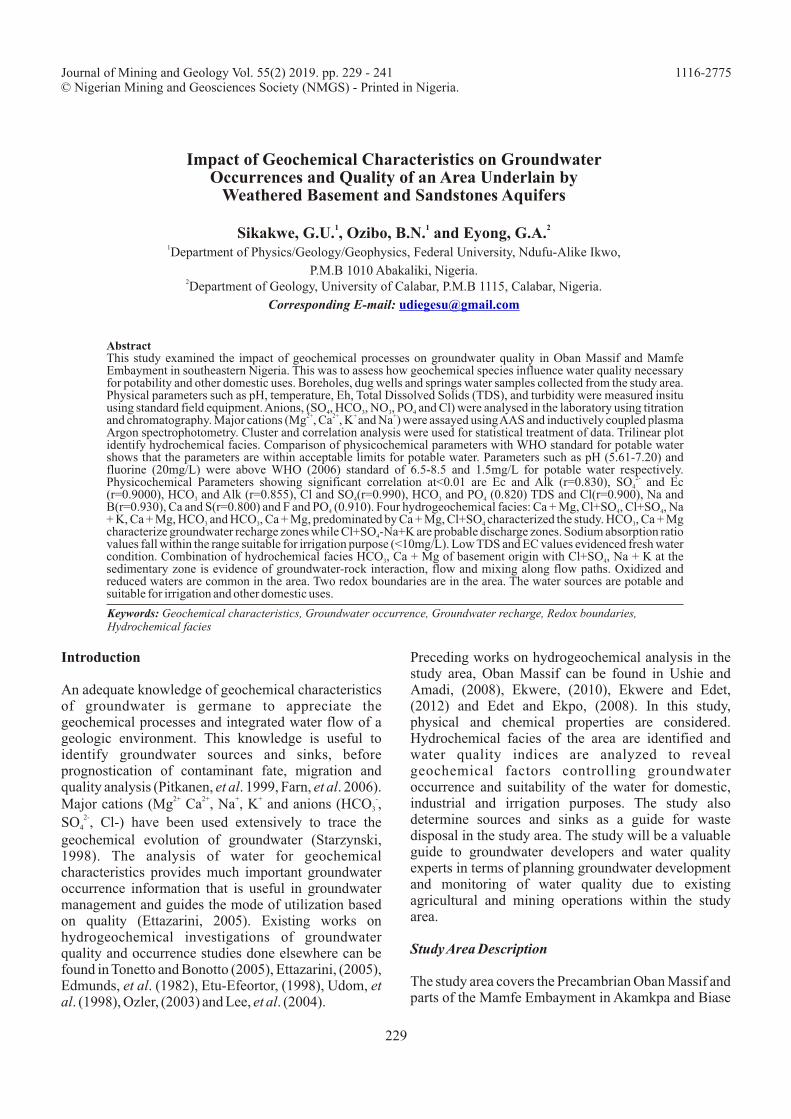
Local Government Areas in Cross River State Nigeria. 0 The study is situated between latitudes N05 18'57.7''
0 0 0 and N05 45' 26.8'' and longitude 08 34' 39.4'' and 08 5' 20.5'' (Fig. 1). The study covers the Oban Hills and forest with a common boundary with Cameroon Republic in the east. In the west, the study is bounded by Ebonyi state along the Cross River channel. Calabar Flank and Mamfe Mbayment respectively (Fig. 1) also bound it in the south and north.
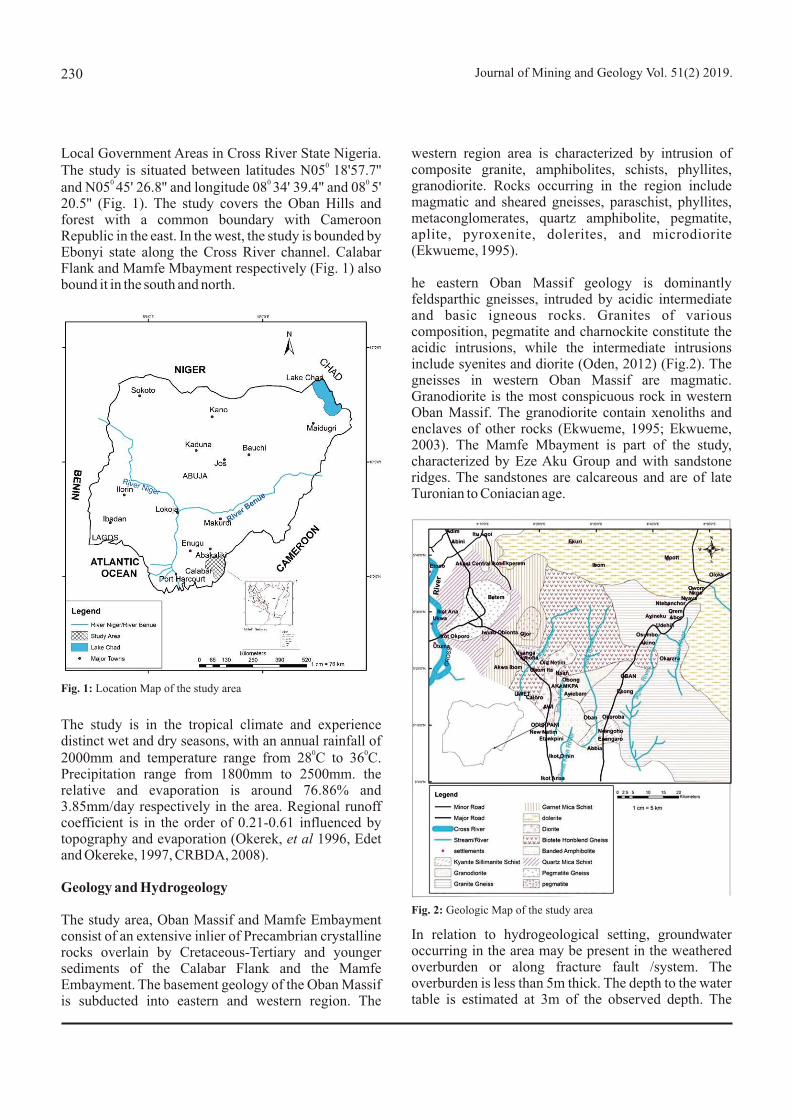
western region area is characterized by intrusion of composite granite, amphibolites, schists, phyllites, granodiorite. Rocks occurring in the region include magmatic and sheared gneisses, paraschist, phyllites, metaconglomerates, quartz amphibolite, pegmatite, aplite, pyroxenite, dolerites, and microdiorite (Ekwueme, 1995).
he eastern Oban Massif geology is dominantly feldsparthic gneisses, intruded by acidic intermediate and basic igneous rocks. Granites of various composition, pegmatite and charnockite constitute the acidic intrusions, while the intermediate intrusions include syenites and diorite (Oden, 2012) (Fig.2). The gneisses in western Oban Massif are magmatic. Granodiorite is the most conspicuous rock in western Oban Massif. The granodiorite contain xenoliths and enclaves of other rocks (Ekwueme, 1995; Ekwueme, 2003). The Mamfe Mbayment is part of the study, characterized by Eze Aku Group and with sandstone ridges. The sandstones are calcareous and are of late Turonian to Coniacian age.
Fig. 1: Location Map of the study area
The study is in the tropical climate and experience distinct wet and dry seasons, with an annual rainfall of
0 02000mm and temperature range from 28 C to 36 C. Precipitation range from 1800mm to 2500mm. the relative and evaporation is around 76.86% and 3.85mm/day respectively in the area. Regional runoff coefficient is in the order of 0.21-0.61 influenced by topography and evaporation (Okerek, et al 1996, Edet and Okereke, 1997, CRBDA, 2008).
Geology and Hydrogeology
The study area, Oban Massif and Mamfe Embayment consist of an extensive inlier of Precambrian crystalline rocks overlain by Cretaceous-Tertiary and younger sediments of the Calabar Flank and the Mamfe Embayment. The basement geology of the Oban Massif is subducted into eastern and western region. The
Fig. 2: Geologic Map of the study area
In relation to hydrogeological setting, groundwater occurring in the area may be present in the weathered overburden or along fracture fault /system. The overburden is less than 5m thick. The depth to the water table is estimated at 3m of the observed depth. The
Journal of Mining and Geology Vol. 55(2) 2019. 231
determined using titration and ion chromatography techniques that permit uncertainty below +4%, while
-the cations. Analysis of 4 anions such as nitrate (NO ), 3
- - -Chloride (Cl ), Bicarbonate (HCO ) sulphate (SO ) and 3 2
3-Phosphate (PO ) were as follows: Nitrate was 4
determined using PD303UV spectrophotometer. A known volume of 50mL of sample was pipette into porcelain dish and evaporated to dryness in a hot water bath. Add 2mL of phenol disulphonic acid to dissolve the residue by constant stirring with a glass rod. Add concentrated solution of sodium hydroxide and distilled water with stirring to make it alkaline. Filter into Nessler's tube and made up to 50mL with distilled water. Read the absorbance at 410nm a spectrophotometer after the development colour. Compare absorbance of sample with the standard curve and expressed in mg/L to find the value of nitrate. For chloride determination, 100mL of the clear sample was pipette into an Erlenmeyer flask and the pH adjusted to 7-10m with
2-either H SO or NaOH solution. Add K CrO radiator 2 4 2 4
solution and titrated against with standard solution of AgNO in a permanent reddish brown coloration. The 3
AgNO titrant was standardized and a reagent blank 3
established. A blank of 0.2-0.3mL is usual for the 3
method. In determining sulphate a 250cm of the water was evaporated to dryness on a dish. Moistened the
3residue with few drops of concentrated HCl and 30cm distilled water added. This was boiled and filtered. Raised the dish and the filtered paper, washed with several portions of distilled water and both filtered titrate and washings added together. Heat to boiling and
3then add 10cm of 10% BaCl solution drop by drop with 2
aquifer is confined with an overburden thickness of varying between 15m to 70m and recharged by direct precipitation from rainfall. The hydraulic conductivity is of 8.53-13.18m/day and transmissivity values ranges
2from 410.65-725.88m /day (Edet and Okereke, 1996; Okereke, et al 1996). Boreholes of drilled depth 24m with an overburden thickness of 60m with a yield of 1.9l/s are common in the area. George and Okwueze, (2002) established that Oban Massif has low aquifer parameters which is a strong indication of poor water storage potential in the basement complex. However, jointing and cracks may occur in the bedrock, still its water potential is poor.
Field Samples Collection
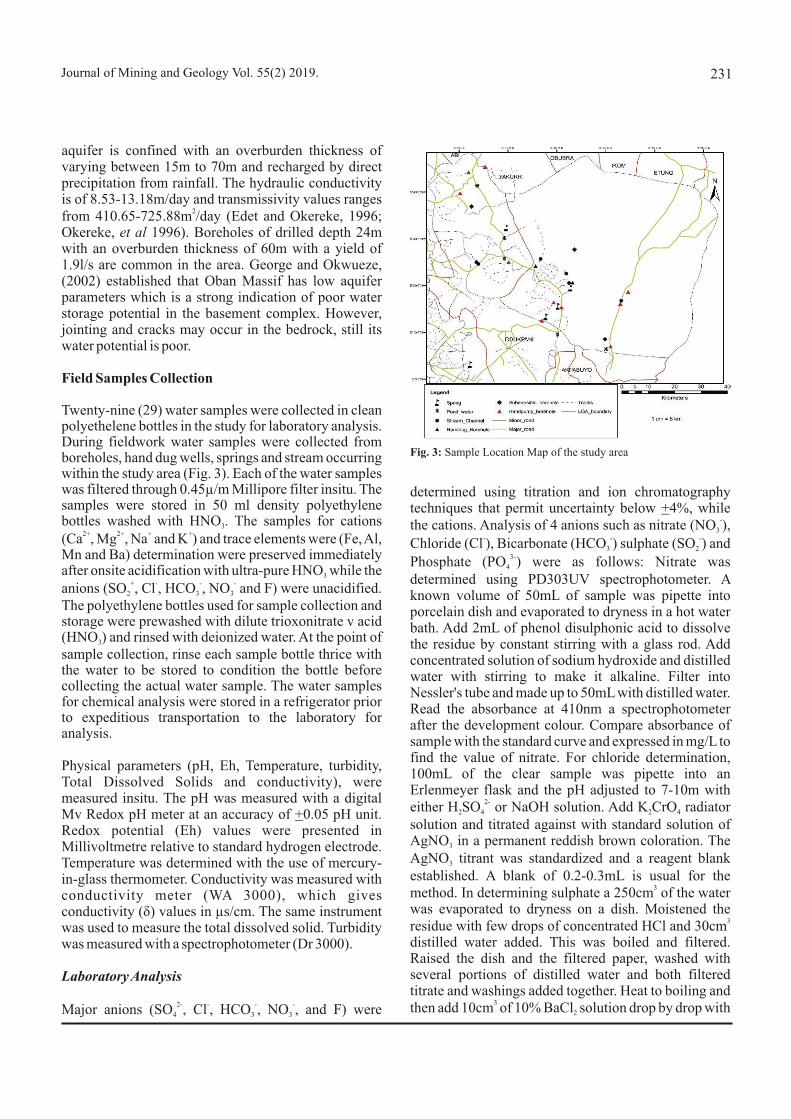
Twenty-nine (29) water samples were collected in clean polyethelene bottles in the study for laboratory analysis. During fieldwork water samples were collected from boreholes, hand dug wells, springs and stream occurring within the study area (Fig. 3). Each of the water samples was filtered through 0.45µ/m Millipore filter insitu. The samples were stored in 50 ml density polyethylene bottles washed with HNO . The samples for cations 3
2+ 2+ + +(Ca , Mg , Na and K ) and trace elements were (Fe, Al, Mn and Ba) determination were preserved immediately after onsite acidification with ultra-pure HNO while the 3
+ - - -anions (SO , Cl , HCO , NO and F) were unacidified. 2 3 3
The polyethylene bottles used for sample collection and storage were prewashed with dilute trioxonitrate v acid (HNO ) and rinsed with deionized water. At the point of 3
sample collection, rinse each sample bottle thrice with the water to be stored to condition the bottle before collecting the actual water sample. The water samples for chemical analysis were stored in a refrigerator prior to expeditious transportation to the laboratory for analysis.
Physical parameters (pH, Eh, Temperature, turbidity, Total Dissolved Solids and conductivity), were measured insitu. The pH was measured with a digital Mv Redox pH meter at an accuracy of +0.05 pH unit. Redox potential (Eh) values were presented in Millivoltmetre relative to standard hydrogen electrode. Temperature was determined with the use of mercury-in-glass thermometer. Conductivity was measured with conductivity meter (WA 3000), which gives conductivity (ä) values in µs/cm. The same instrument was used to measure the total dissolved solid. Turbidity was measured with a spectrophotometer (Dr 3000).
Laboratory Analysis
2- - - -Major anions (SO , Cl , HCO , NO , and F) were 4 3 3
Fig. 3: Sample Location Map of the study area
Journal of Mining and Geology Vol. 55(2) 2019.232
constant stirring. Digested the mixture for about 30minutes, filtered and the filter paper washed with warm distilled water. Then ignite cooled and weighed in an already weighed crucible. Adopt similar procedure for other anions. The calculated values of Sodium absorption ratio (Table 3) estimated from the formula SAR=Na/ (Ca + Mg)0.2 ranged from 0.1097-
12.8719meq/L (Table 3).Inductively coupled Plasma Atomic Emission Spectroscopy (ICP-AES) and flame test analyzed magnesium (Mg2+), calcium (Ca2+), Sodium (Na+) and potassium (K+). The analyses were performed the ACME Analytical Laboratories, Vancourver BC, Canada.
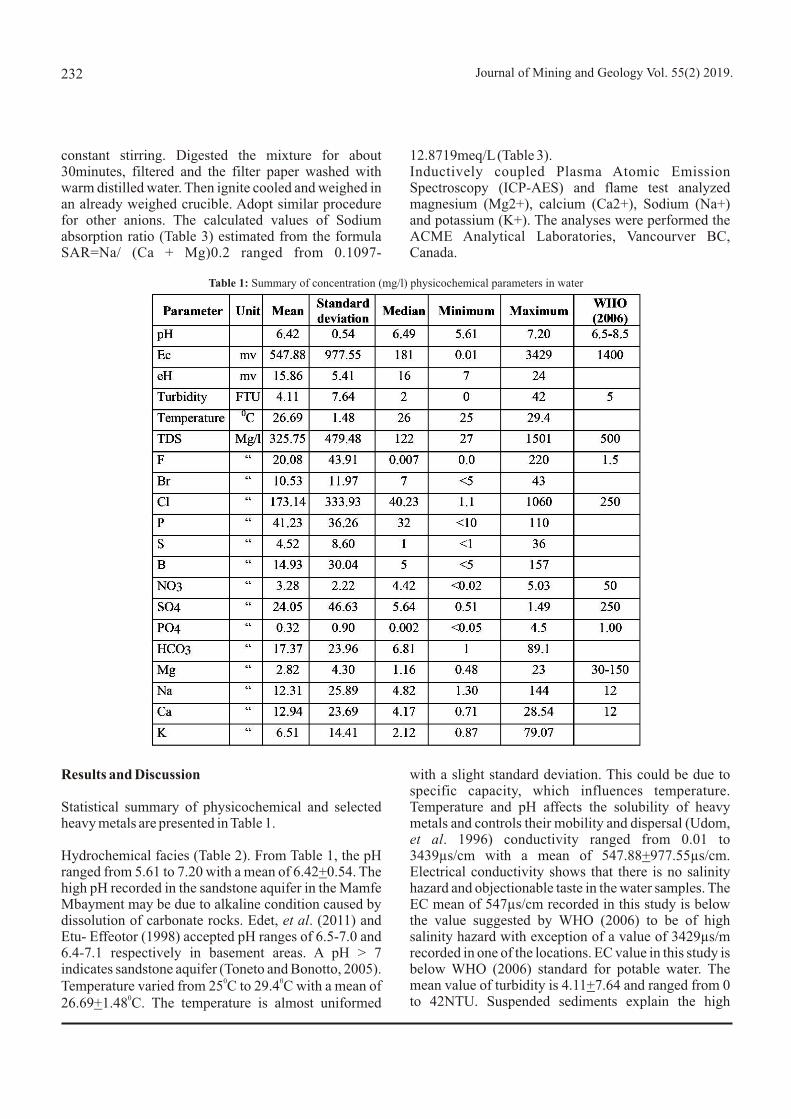
Table 1: Summary of concentration (mg/l) physicochemical parameters in water
Results and Discussion
Statistical summary of physicochemical and selected heavy metals are presented in Table 1.
Hydrochemical facies (Table 2). From Table 1, the pH ranged from 5.61 to 7.20 with a mean of 6.42+0.54. The high pH recorded in the sandstone aquifer in the Mamfe Mbayment may be due to alkaline condition caused by dissolution of carbonate rocks. Edet, et al. (2011) and Etu- Effeotor (1998) accepted pH ranges of 6.5-7.0 and 6.4-7.1 respectively in basement areas. A pH > 7 indicates sandstone aquifer (Toneto and Bonotto, 2005).
0 0Temperature varied from 25 C to 29.4 C with a mean of 026.69+1.48 C. The temperature is almost uniformed
with a slight standard deviation. This could be due to specific capacity, which influences temperature. Temperature and pH affects the solubility of heavy metals and controls their mobility and dispersal (Udom, et al. 1996) conductivity ranged from 0.01 to 3439µs/cm with a mean of 547.88+977.55µs/cm. Electrical conductivity shows that there is no salinity hazard and objectionable taste in the water samples. The EC mean of 547µs/cm recorded in this study is below the value suggested by WHO (2006) to be of high salinity hazard with exception of a value of 3429µs/m recorded in one of the locations. EC value in this study is below WHO (2006) standard for potable water. The mean value of turbidity is 4.11+7.64 and ranged from 0 to 42NTU. Suspended sediments explain the high
Journal of Mining and Geology Vol. 55(2) 2019. 233
The major dissolved cation composition of the +
groundwater include Mg(2.82+4.30mg/L), Na +
(12.31+25.89mg/L), Ca (12.94+23.69mg/L) and K (6.51+14.41mg/L) (Table 1). Calcium is the dominant cation next to sodium. Calcium is associated with dissolution of anhydrite or gypsum (Smellie and Wilkberg, 1990). Calcium is also one of the abundant cation in subsurface water (Elueze, et al. 2004).
+ 2+Elevated levels of Na = and Ca ions in the area can be attributed to ion- exchange reactions where sodium is substituted for calcium (Lyons, et al. 1992). Low value of potassium could be due to the tendency for it to be fixed by clay minerals and participate in the formation of secondary minerals (Edet and Ekpo, 2008).
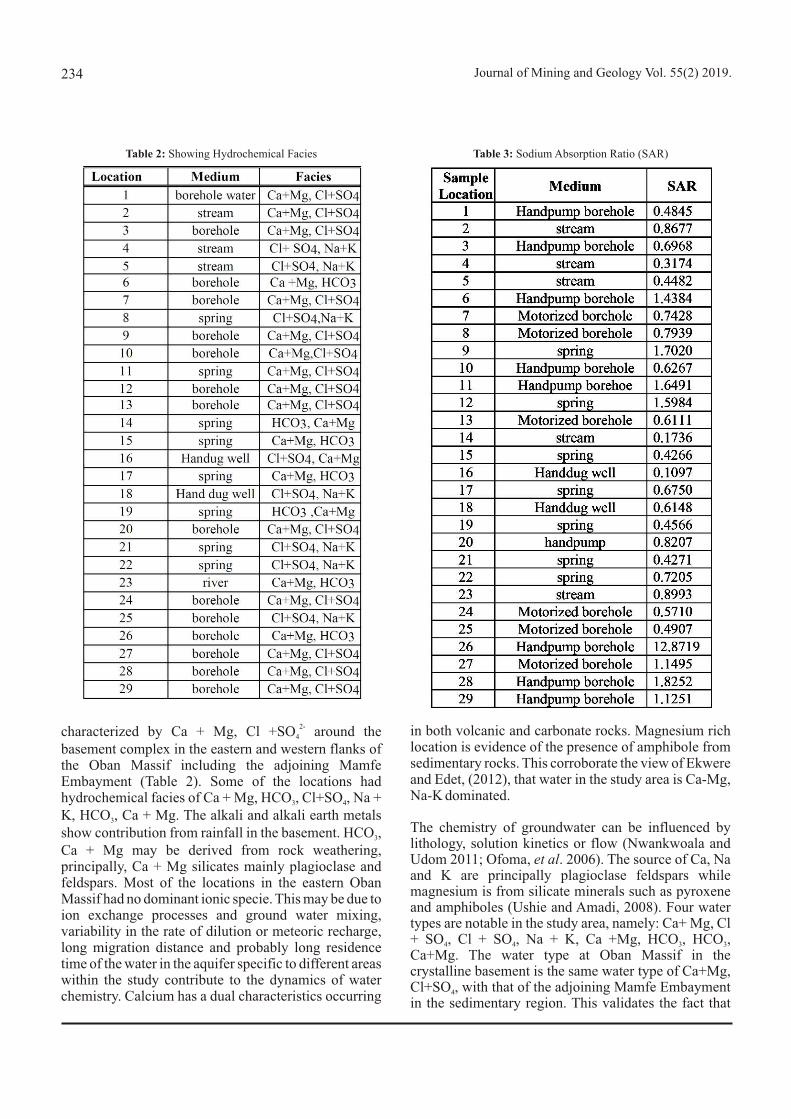
Hydrochemical Facies
The hydrochemical facies of the study area is summarized in Table 2. Water sample in location 1 (borehole) is sodium dominated, while locations 2, 3, 4 and 5 have no dominant ion type in the eastern Oban Massif (Fig. 1). Their hydrochemical facies is of the type Ca+Mg-Cl+SO type with exception of location 4 4
and 5 which has Cl+SO -Na+K water type and also 4
location 6 which has Ca+Mg-HCO water type (Fig. 5). 3-The water type; Ca + Mg, Cl+SO and Na + K, Cl SO 4 4
shows that the groundwater is mainly made up of mixtures of alkali and alkali earth metals. Chlorine is
+ +dominant followed by SO , while there is Na and K and 42+ 2+Ca +Mg . Location 7(borehole) is sodium dominated
with Cl+SO -Na+K water type.4
Locations 9, 10, 11, 12, 13 and 19 possess Ca+Mg-Cl+SO water type with no dominant ionic specie, with 4
exception of locations 9 and 13, which are Na and Mg dominated respectively. Location 14 is HCO , Ca + Mg 3
and bicarbonate dominated. Locations 15, 17, 23 and 26 had the facies Ca + Mg, HCO . Locations 15 and 17 had 3
no dominant ionic specie (Fig. 3), while location 23 is chloride dominated type and location 26 is sodium type (Fig. 3 and Table 2). Location 18 is of Cl+SO , Na+K 4
facie and has no dominant ionic specie (Fig. 3). Location 19 has HCO , Ca + Mg, water type and sodium type is of 3
Ca + Mg, Cl+SO . Location 20 is calcium dominated 4
while locations 23, 24 and 27 are chloride dominated. Location 28 and 29 are sodium dominated. Locations 16, 18, 21, 22 and 25 are of Cl+SO , Na + K water type. 4
Location 16 is bicarbonate dominated, while locations 18 21 and 22 has no dominant ionic specie, but location 25 is calcium dominated.
The hydrochemical specie of water in the study area is
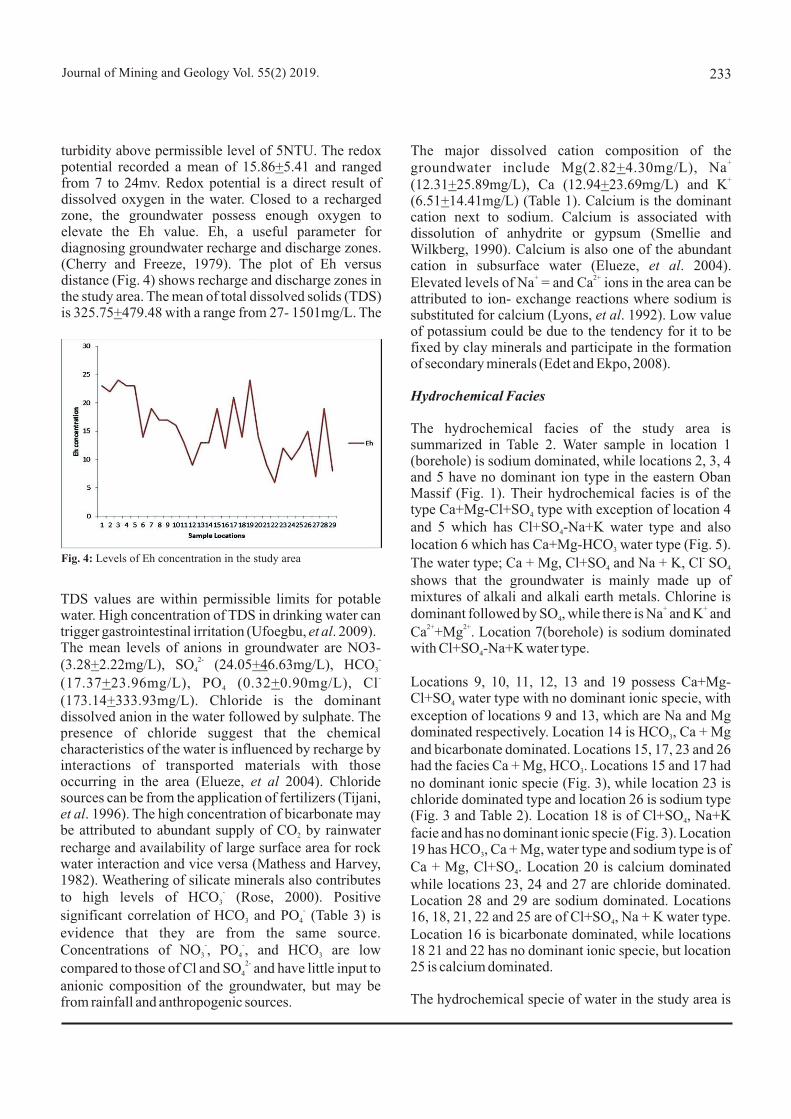
turbidity above permissible level of 5NTU. The redox potential recorded a mean of 15.86+5.41 and ranged from 7 to 24mv. Redox potential is a direct result of dissolved oxygen in the water. Closed to a recharged zone, the groundwater possess enough oxygen to elevate the Eh value. Eh, a useful parameter for diagnosing groundwater recharge and discharge zones. (Cherry and Freeze, 1979). The plot of Eh versus distance (Fig. 4) shows recharge and discharge zones in the study area. The mean of total dissolved solids (TDS) is 325.75+479.48 with a range from 27- 1501mg/L. The
Fig. 4: Levels of Eh concentration in the study area
TDS values are within permissible limits for potable water. High concentration of TDS in drinking water can trigger gastrointestinal irritation (Ufoegbu, et al. 2009).The mean levels of anions in groundwater are NO3-
2- -(3.28+2.22mg/L), SO (24.05+46.63mg/L), HCO 4 3
-(17.37+23.96mg/L), PO (0.32+0.90mg/L), Cl4
(173.14+333.93mg/L). Chloride is the dominant dissolved anion in the water followed by sulphate. The presence of chloride suggest that the chemical characteristics of the water is influenced by recharge by interactions of transported materials with those occurring in the area (Elueze, et al 2004). Chloride sources can be from the application of fertilizers (Tijani, et al. 1996). The high concentration of bicarbonate may be attributed to abundant supply of CO by rainwater 2
recharge and availability of large surface area for rock water interaction and vice versa (Mathess and Harvey, 1982). Weathering of silicate minerals also contributes
-to high levels of HCO (Rose, 2000). Positive 3-
significant correlation of HCO and PO (Table 3) is 3 4
evidence that they are from the same source. - -Concentrations of NO , PO , and HCO are low 3 4 3
2-compared to those of Cl and SO and have little input to 4
anionic composition of the groundwater, but may be from rainfall and anthropogenic sources.
Journal of Mining and Geology Vol. 55(2) 2019.234
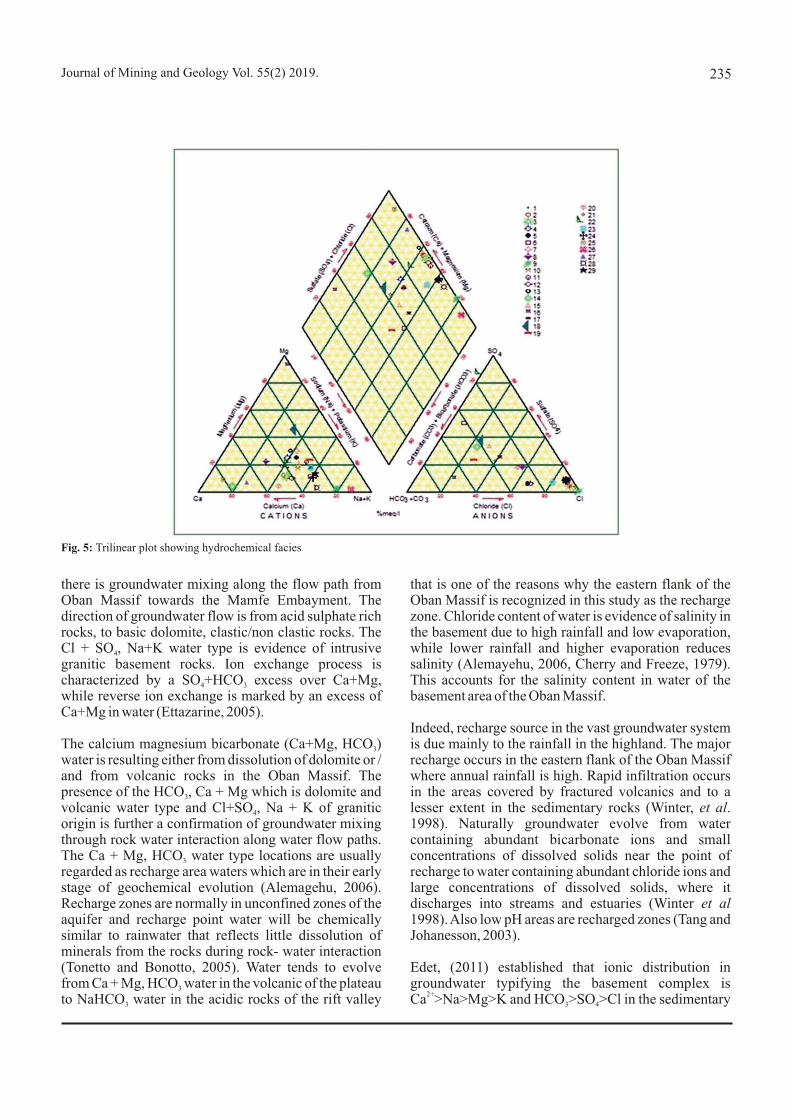
2-characterized by Ca + Mg, Cl +SO around the 4
basement complex in the eastern and western flanks of the Oban Massif including the adjoining Mamfe Embayment (Table 2). Some of the locations had hydrochemical facies of Ca + Mg, HCO , Cl+SO , Na + 3 4
K, HCO , Ca + Mg. The alkali and alkali earth metals 3
show contribution from rainfall in the basement. HCO , 3
Ca + Mg may be derived from rock weathering, principally, Ca + Mg silicates mainly plagioclase and feldspars. Most of the locations in the eastern Oban Massif had no dominant ionic specie. This may be due to ion exchange processes and ground water mixing, variability in the rate of dilution or meteoric recharge, long migration distance and probably long residence time of the water in the aquifer specific to different areas within the study contribute to the dynamics of water chemistry. Calcium has a dual characteristics occurring
Table 2: Showing Hydrochemical Facies
in both volcanic and carbonate rocks. Magnesium rich location is evidence of the presence of amphibole from sedimentary rocks. This corroborate the view of Ekwere and Edet, (2012), that water in the study area is Ca-Mg, Na-K dominated.
The chemistry of groundwater can be influenced by lithology, solution kinetics or flow (Nwankwoala and Udom 2011; Ofoma, et al. 2006). The source of Ca, Na and K are principally plagioclase feldspars while magnesium is from silicate minerals such as pyroxene and amphiboles (Ushie and Amadi, 2008). Four water types are notable in the study area, namely: Ca+ Mg, Cl + SO , Cl + SO , Na + K, Ca +Mg, HCO , HCO , 4 4 3 3
Ca+Mg. The water type at Oban Massif in the crystalline basement is the same water type of Ca+Mg, Cl+SO , with that of the adjoining Mamfe Embayment 4
in the sedimentary region. This validates the fact that
Table 3: Sodium Absorption Ratio (SAR)
Journal of Mining and Geology Vol. 55(2) 2019. 235
Fig. 5: Trilinear plot showing hydrochemical facies
there is groundwater mixing along the flow path from Oban Massif towards the Mamfe Embayment. The direction of groundwater flow is from acid sulphate rich rocks, to basic dolomite, clastic/non clastic rocks. The Cl + SO , Na+K water type is evidence of intrusive 4
granitic basement rocks. Ion exchange process is characterized by a SO +HCO excess over Ca+Mg, 4 3
while reverse ion exchange is marked by an excess of Ca+Mg in water (Ettazarine, 2005).
The calcium magnesium bicarbonate (Ca+Mg, HCO ) 3
water is resulting either from dissolution of dolomite or / and from volcanic rocks in the Oban Massif. The presence of the HCO , Ca + Mg which is dolomite and 3
volcanic water type and Cl+SO , Na + K of granitic 4
origin is further a confirmation of groundwater mixing through rock water interaction along water flow paths. The Ca + Mg, HCO water type locations are usually 3
regarded as recharge area waters which are in their early stage of geochemical evolution (Alemagehu, 2006). Recharge zones are normally in unconfined zones of the aquifer and recharge point water will be chemically similar to rainwater that reflects little dissolution of minerals from the rocks during rock- water interaction (Tonetto and Bonotto, 2005). Water tends to evolve from Ca + Mg, HCO water in the volcanic of the plateau 3
to NaHCO water in the acidic rocks of the rift valley 3
that is one of the reasons why the eastern flank of the Oban Massif is recognized in this study as the recharge zone. Chloride content of water is evidence of salinity in the basement due to high rainfall and low evaporation, while lower rainfall and higher evaporation reduces salinity (Alemayehu, 2006, Cherry and Freeze, 1979). This accounts for the salinity content in water of the basement area of the Oban Massif.
Indeed, recharge source in the vast groundwater system is due mainly to the rainfall in the highland. The major recharge occurs in the eastern flank of the Oban Massif where annual rainfall is high. Rapid infiltration occurs in the areas covered by fractured volcanics and to a lesser extent in the sedimentary rocks (Winter, et al. 1998). Naturally groundwater evolve from water containing abundant bicarbonate ions and small concentrations of dissolved solids near the point of recharge to water containing abundant chloride ions and large concentrations of dissolved solids, where it discharges into streams and estuaries (Winter et al 1998). Also low pH areas are recharged zones (Tang and Johanesson, 2003).
Edet, (2011) established that ionic distribution in groundwater typifying the basement complex is
2+Ca >Na>Mg>K and HCO >SO >Cl in the sedimentary 3 4
region. Nganje, et al. (2011) identified Na>Ca>K>Mg and HCO >Cl>SO to characterize basement and 3 4
sedimentary terrains respectively. This is in agreement with the findings of this research with respect to basement, with exception of K that was slightly higher than Mg ion. As groundwater flows through sediments, the process of cation exchange in clay layers causes a decrease of calcium, magnesium, and increase in sodium, resulting to gain or loss in total equivalence of cations (Ahmed and Ali, 2009). This explains the increase in sodium content in this study.
Redox Chemistry
The measured potential in ground water declined in low solubility mineral phases (Langmuir, 1978) underwater as they migrate from recharge to discharge areas of the unconfined aquifers. It was also noticed that a progressive change in groundwater from oxidized state at recharge to a reduced state at discharge indicates that oxidation-reduction has taken place. Champ, et al. (1979), also made this observation elsewhere. The factors that account for these redox changes are variation in pH with concentration of elements such as
Journal of Mining and Geology Vol. 55(2) 2019.236
O , NO , SO , Fe, Mn (Edmunds, et al. 1982). Elements 2 3 4
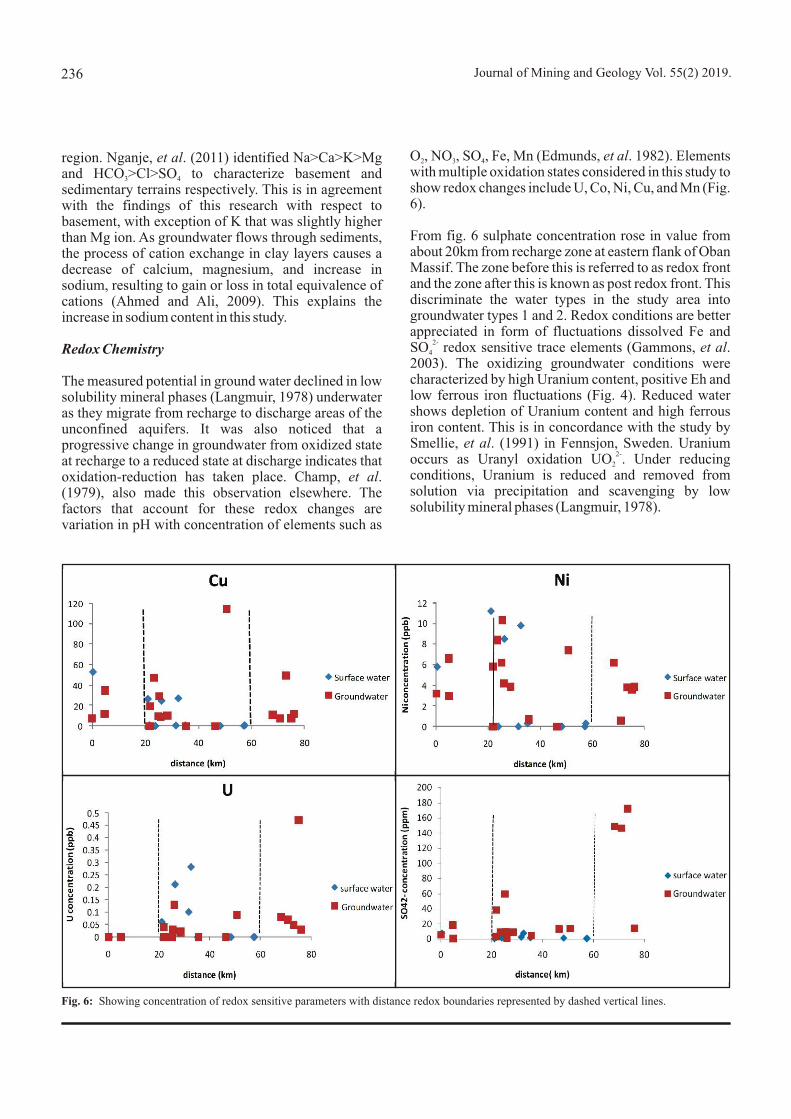
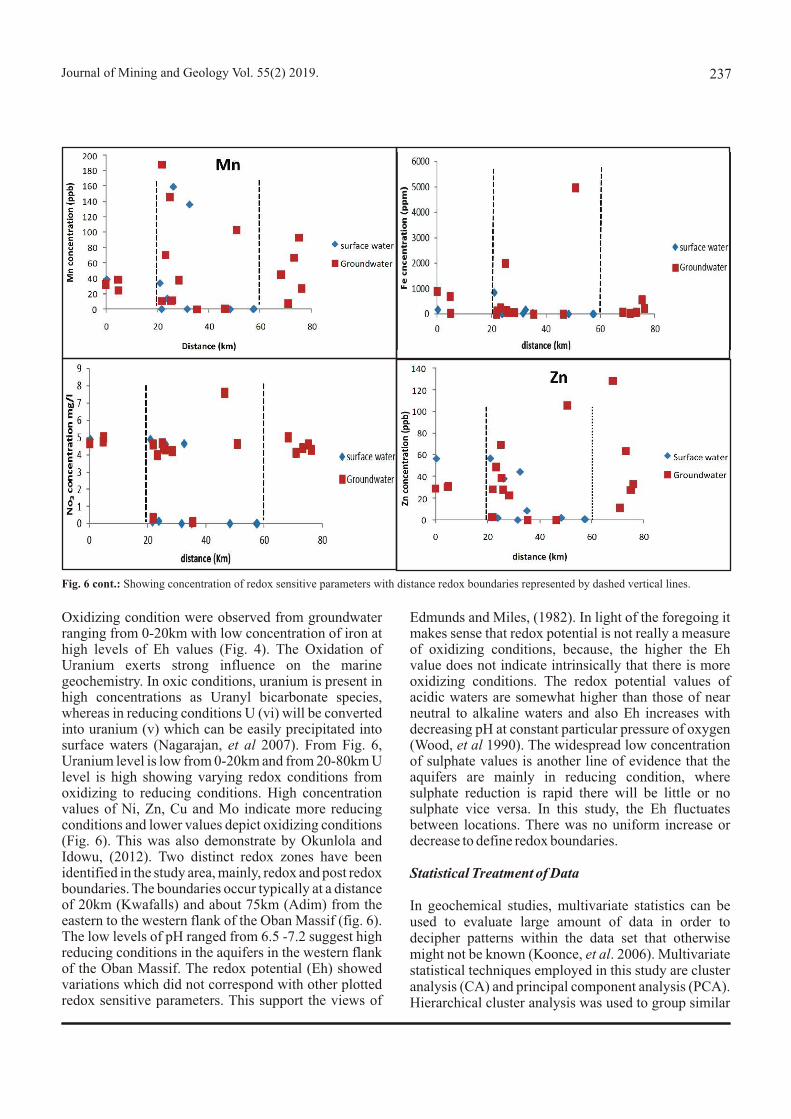
with multiple oxidation states considered in this study to show redox changes include U, Co, Ni, Cu, and Mn (Fig. 6).
From fig. 6 sulphate concentration rose in value from about 20km from recharge zone at eastern flank of Oban Massif. The zone before this is referred to as redox front and the zone after this is known as post redox front. This discriminate the water types in the study area into groundwater types 1 and 2. Redox conditions are better appreciated in form of fluctuations dissolved Fe and
2-SO redox sensitive trace elements (Gammons, et al. 4
2003). The oxidizing groundwater conditions were characterized by high Uranium content, positive Eh and low ferrous iron fluctuations (Fig. 4). Reduced water shows depletion of Uranium content and high ferrous iron content. This is in concordance with the study by Smellie, et al. (1991) in Fennsjon, Sweden. Uranium
2-occurs as Uranyl oxidation UO . Under reducing 2
conditions, Uranium is reduced and removed from solution via precipitation and scavenging by low solubility mineral phases (Langmuir, 1978).
Fig. 6: Showing concentration of redox sensitive parameters with distance redox boundaries represented by dashed vertical lines.
Journal of Mining and Geology Vol. 55(2) 2019. 237
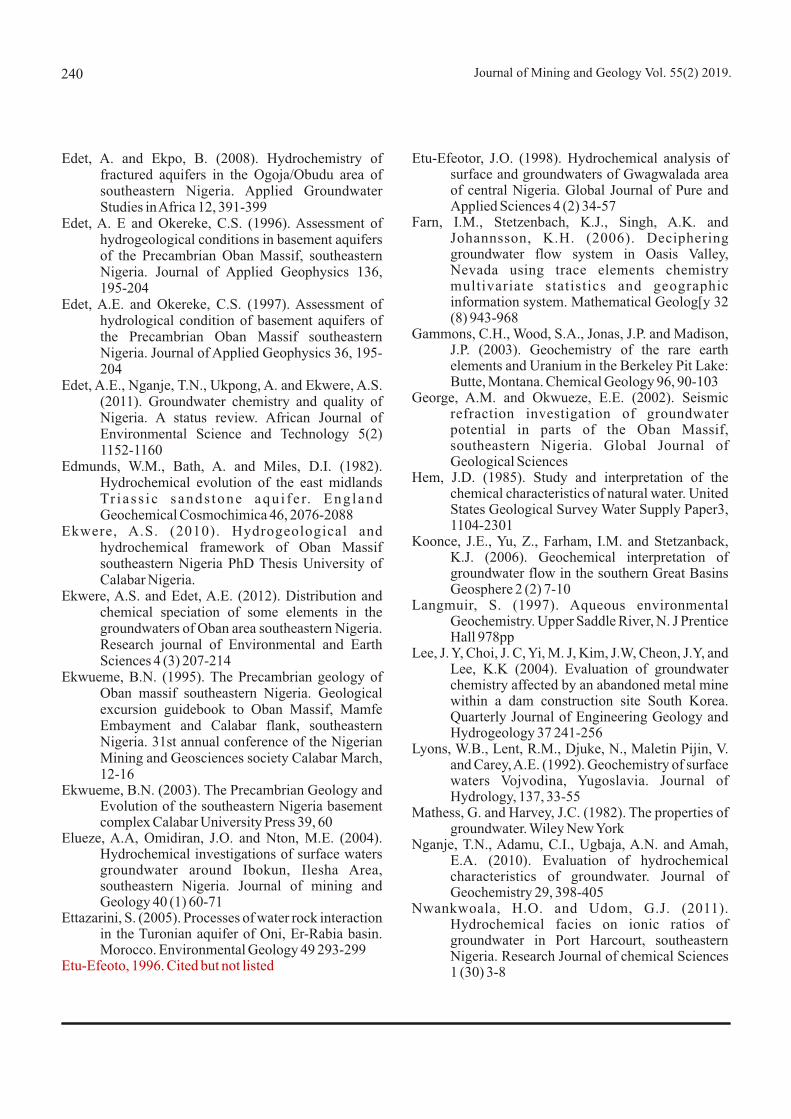
Oxidizing condition were observed from groundwater ranging from 0-20km with low concentration of iron at high levels of Eh values (Fig. 4). The Oxidation of Uranium exerts strong influence on the marine geochemistry. In oxic conditions, uranium is present in high concentrations as Uranyl bicarbonate species, whereas in reducing conditions U (vi) will be converted into uranium (v) which can be easily precipitated into surface waters (Nagarajan, et al 2007). From Fig. 6, Uranium level is low from 0-20km and from 20-80km U level is high showing varying redox conditions from oxidizing to reducing conditions. High concentration values of Ni, Zn, Cu and Mo indicate more reducing conditions and lower values depict oxidizing conditions (Fig. 6). This was also demonstrate by Okunlola and Idowu, (2012). Two distinct redox zones have been identified in the study area, mainly, redox and post redox boundaries. The boundaries occur typically at a distance of 20km (Kwafalls) and about 75km (Adim) from the eastern to the western flank of the Oban Massif (fig. 6). The low levels of pH ranged from 6.5 -7.2 suggest high reducing conditions in the aquifers in the western flank of the Oban Massif. The redox potential (Eh) showed variations which did not correspond with other plotted redox sensitive parameters. This support the views of
Edmunds and Miles, (1982). In light of the foregoing it makes sense that redox potential is not really a measure of oxidizing conditions, because, the higher the Eh value does not indicate intrinsically that there is more oxidizing conditions. The redox potential values of acidic waters are somewhat higher than those of near neutral to alkaline waters and also Eh increases with decreasing pH at constant particular pressure of oxygen (Wood, et al 1990). The widespread low concentration of sulphate values is another line of evidence that the aquifers are mainly in reducing condition, where sulphate reduction is rapid there will be little or no sulphate vice versa. In this study, the Eh fluctuates between locations. There was no uniform increase or decrease to define redox boundaries.
Statistical Treatment of Data
In geochemical studies, multivariate statistics can be used to evaluate large amount of data in order to decipher patterns within the data set that otherwise might not be known (Koonce, et al. 2006). Multivariate statistical techniques employed in this study are cluster analysis (CA) and principal component analysis (PCA). Hierarchical cluster analysis was used to group similar
Fig. 6 cont.: Showing concentration of redox sensitive parameters with distance redox boundaries represented by dashed vertical lines.
Journal of Mining and Geology Vol. 55(2) 2019.238
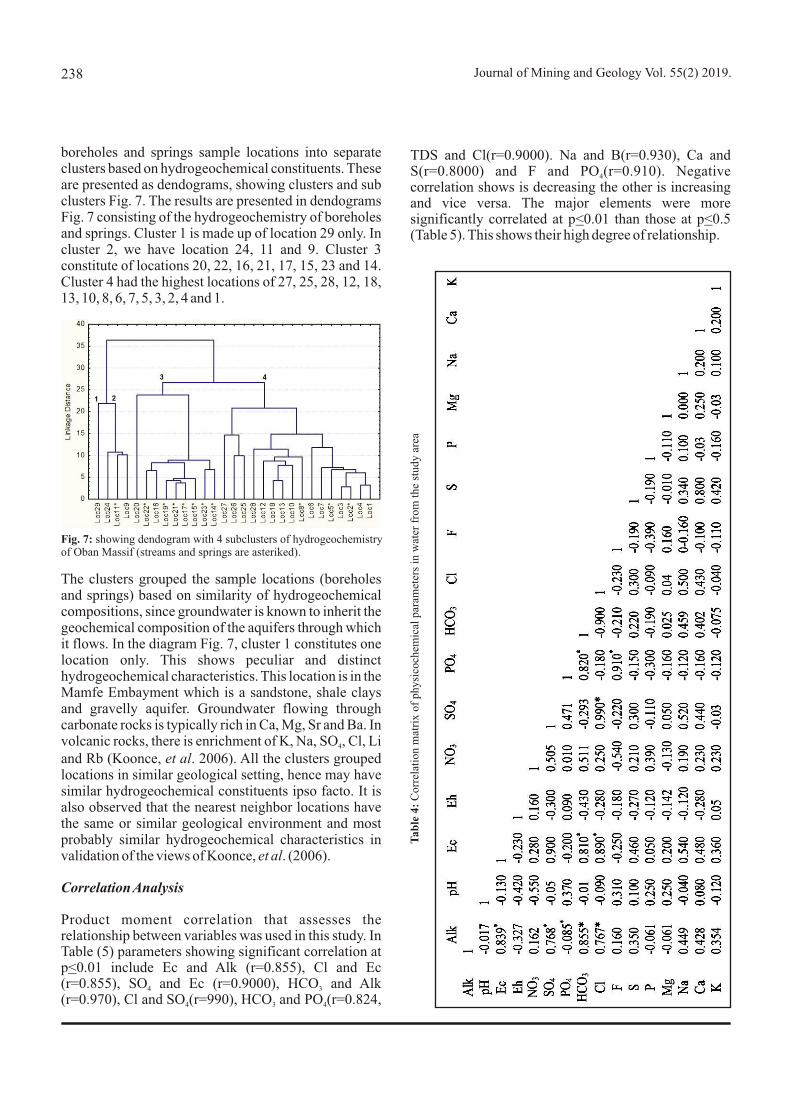
boreholes and springs sample locations into separate clusters based on hydrogeochemical constituents. These are presented as dendograms, showing clusters and sub clusters Fig. 7. The results are presented in dendograms Fig. 7 consisting of the hydrogeochemistry of boreholes and springs. Cluster 1 is made up of location 29 only. In cluster 2, we have location 24, 11 and 9. Cluster 3 constitute of locations 20, 22, 16, 21, 17, 15, 23 and 14. Cluster 4 had the highest locations of 27, 25, 28, 12, 18, 13, 10, 8, 6, 7, 5, 3, 2, 4 and 1.
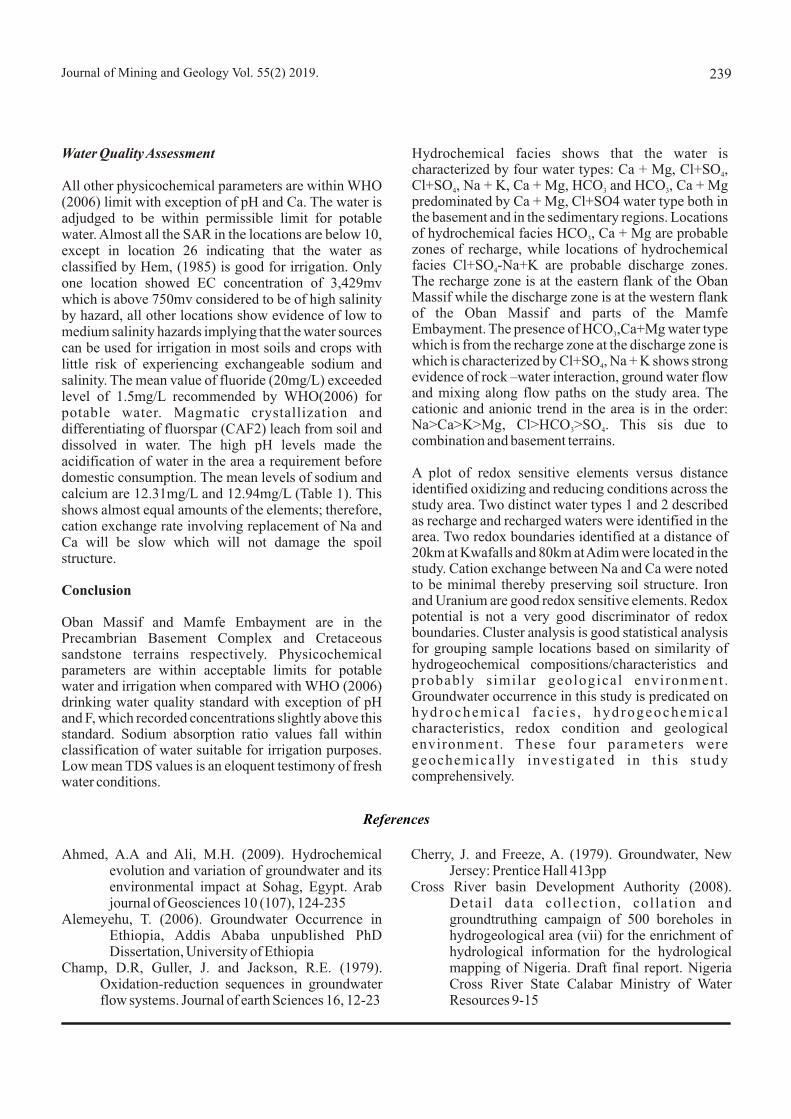
TDS and Cl(r=0.9000). Na and B(r=0.930), Ca and S(r=0.8000) and F and PO (r=0.910). Negative 4
correlation shows is decreasing the other is increasing and vice versa. The major elements were more significantly correlated at p<0.01 than those at p<0.5 (Table 5). This shows their high degree of relationship.
Fig. 7: showing dendogram with 4 subclusters of hydrogeochemistry of Oban Massif (streams and springs are asteriked).
The clusters grouped the sample locations (boreholes and springs) based on similarity of hydrogeochemical compositions, since groundwater is known to inherit the geochemical composition of the aquifers through which it flows. In the diagram Fig. 7, cluster 1 constitutes one location only. This shows peculiar and distinct hydrogeochemical characteristics. This location is in the Mamfe Embayment which is a sandstone, shale clays and gravelly aquifer. Groundwater flowing through carbonate rocks is typically rich in Ca, Mg, Sr and Ba. In volcanic rocks, there is enrichment of K, Na, SO , Cl, Li 4
and Rb (Koonce, et al. 2006). All the clusters grouped locations in similar geological setting, hence may have similar hydrogeochemical constituents ipso facto. It is also observed that the nearest neighbor locations have the same or similar geological environment and most probably similar hydrogeochemical characteristics in validation of the views of Koonce, et al. (2006).
Correlation Analysis
Product moment correlation that assesses the relationship between variables was used in this study. In Table (5) parameters showing significant correlation at p<0.01 include Ec and Alk (r=0.855), Cl and Ec (r=0.855), SO and Ec (r=0.9000), HCO and Alk 4 3
(r=0.970), Cl and SO (r=990), HCO and PO (r=0.824, 4 3 4
Tab
le 4
: C
orre
lati
on m
atri
x of
phy
sico
chem
ical
par
amet
ers
in w
ater
fro
m t
he s
tudy
are
a
Journal of Mining and Geology Vol. 55(2) 2019. 239
Water Quality Assessment
All other physicochemical parameters are within WHO (2006) limit with exception of pH and Ca. The water is adjudged to be within permissible limit for potable water. Almost all the SAR in the locations are below 10, except in location 26 indicating that the water as classified by Hem, (1985) is good for irrigation. Only one location showed EC concentration of 3,429mv which is above 750mv considered to be of high salinity by hazard, all other locations show evidence of low to medium salinity hazards implying that the water sources can be used for irrigation in most soils and crops with little risk of experiencing exchangeable sodium and salinity. The mean value of fluoride (20mg/L) exceeded level of 1.5mg/L recommended by WHO(2006) for potable water. Magmatic crystallization and differentiating of fluorspar (CAF2) leach from soil and dissolved in water. The high pH levels made the acidification of water in the area a requirement before domestic consumption. The mean levels of sodium and calcium are 12.31mg/L and 12.94mg/L (Table 1). This shows almost equal amounts of the elements; therefore, cation exchange rate involving replacement of Na and Ca will be slow which will not damage the spoil structure.
Conclusion
Oban Massif and Mamfe Embayment are in the Precambrian Basement Complex and Cretaceous sandstone terrains respectively. Physicochemical parameters are within acceptable limits for potable water and irrigation when compared with WHO (2006) drinking water quality standard with exception of pH and F, which recorded concentrations slightly above this standard. Sodium absorption ratio values fall within classification of water suitable for irrigation purposes. Low mean TDS values is an eloquent testimony of fresh water conditions.
Hydrochemical facies shows that the water is characterized by four water types: Ca + Mg, Cl+SO , 4
Cl+SO , Na + K, Ca + Mg, HCO and HCO , Ca + Mg 4 3 3
predominated by Ca + Mg, Cl+SO4 water type both in the basement and in the sedimentary regions. Locations of hydrochemical facies HCO , Ca + Mg are probable 3
zones of recharge, while locations of hydrochemical facies Cl+SO -Na+K are probable discharge zones. 4
The recharge zone is at the eastern flank of the Oban Massif while the discharge zone is at the western flank of the Oban Massif and parts of the Mamfe Embayment. The presence of HCO ,Ca+Mg water type 3
which is from the recharge zone at the discharge zone is which is characterized by Cl+SO , Na + K shows strong 4
evidence of rock –water interaction, ground water flow and mixing along flow paths on the study area. The cationic and anionic trend in the area is in the order: Na>Ca>K>Mg, Cl>HCO >SO . This sis due to 3 4
combination and basement terrains.
A plot of redox sensitive elements versus distance identified oxidizing and reducing conditions across the study area. Two distinct water types 1 and 2 described as recharge and recharged waters were identified in the area. Two redox boundaries identified at a distance of 20km at Kwafalls and 80km at Adim were located in the study. Cation exchange between Na and Ca were noted to be minimal thereby preserving soil structure. Iron and Uranium are good redox sensitive elements. Redox potential is not a very good discriminator of redox boundaries. Cluster analysis is good statistical analysis for grouping sample locations based on similarity of hydrogeochemical compositions/characteristics and probably s imilar geological environment . Groundwater occurrence in this study is predicated on hydrochemica l f ac i e s , hydrogeochemica l characteristics, redox condition and geological environment. These four parameters were geochemical ly invest igated in this s tudy comprehensively.
Ahmed, A.A and Ali, M.H. (2009). Hydrochemical evolution and variation of groundwater and its environmental impact at Sohag, Egypt. Arab journal of Geosciences 10 (107), 124-235
Alemeyehu, T. (2006). Groundwater Occurrence in Ethiopia, Addis Ababa unpublished PhD Dissertation, University of Ethiopia
Champ, D.R, Guller, J. and Jackson, R.E. (1979). Oxidation-reduction sequences in groundwater flow systems. Journal of earth Sciences 16, 12-23
Cherry, J. and Freeze, A. (1979). Groundwater, New Jersey: Prentice Hall 413pp
Cross River basin Development Authority (2008). Detai l data collect ion, col lat ion and groundtruthing campaign of 500 boreholes in hydrogeological area (vii) for the enrichment of hydrological information for the hydrological mapping of Nigeria. Draft final report. Nigeria Cross River State Calabar Ministry of Water Resources 9-15
References
Journal of Mining and Geology Vol. 55(2) 2019.240
Edet, A. and Ekpo, B. (2008). Hydrochemistry of fractured aquifers in the Ogoja/Obudu area of southeastern Nigeria. Applied Groundwater Studies in Africa 12, 391-399
Edet, A. E and Okereke, C.S. (1996). Assessment of hydrogeological conditions in basement aquifers of the Precambrian Oban Massif, southeastern Nigeria. Journal of Applied Geophysics 136, 195-204
Edet, A.E. and Okereke, C.S. (1997). Assessment of hydrological condition of basement aquifers of the Precambrian Oban Massif southeastern Nigeria. Journal of Applied Geophysics 36, 195-204
Edet, A.E., Nganje, T.N., Ukpong, A. and Ekwere, A.S. (2011). Groundwater chemistry and quality of Nigeria. A status review. African Journal of Environmental Science and Technology 5(2) 1152-1160
Edmunds, W.M., Bath, A. and Miles, D.I. (1982). Hydrochemical evolution of the east midlands Tr iass ic sands tone aqu i fe r. Eng land Geochemical Cosmochimica 46, 2076-2088
Ekwere, A.S. (2010). Hydrogeological and hydrochemical framework of Oban Massif southeastern Nigeria PhD Thesis University of Calabar Nigeria.
Ekwere, A.S. and Edet, A.E. (2012). Distribution and chemical speciation of some elements in the groundwaters of Oban area southeastern Nigeria. Research journal of Environmental and Earth Sciences 4 (3) 207-214
Ekwueme, B.N. (1995). The Precambrian geology of Oban massif southeastern Nigeria. Geological excursion guidebook to Oban Massif, Mamfe Embayment and Calabar flank, southeastern Nigeria. 31st annual conference of the Nigerian Mining and Geosciences society Calabar March, 12-16
Ekwueme, B.N. (2003). The Precambrian Geology and Evolution of the southeastern Nigeria basement complex Calabar University Press 39, 60
Elueze, A.A, Omidiran, J.O. and Nton, M.E. (2004). Hydrochemical investigations of surface waters groundwater around Ibokun, Ilesha Area, southeastern Nigeria. Journal of mining and Geology 40 (1) 60-71
Ettazarini, S. (2005). Processes of water rock interaction in the Turonian aquifer of Oni, Er-Rabia basin. Morocco. Environmental Geology 49 293-299
Etu-Efeoto, 1996. Cited but not listed
Etu-Efeotor, J.O. (1998). Hydrochemical analysis of surface and groundwaters of Gwagwalada area of central Nigeria. Global Journal of Pure and Applied Sciences 4 (2) 34-57
Farn, I.M., Stetzenbach, K.J., Singh, A.K. and Johannsson, K.H. (2006). Deciphering groundwater flow system in Oasis Valley, Nevada using trace elements chemistry multivariate statistics and geographic information system. Mathematical Geolog[y 32 (8) 943-968
Gammons, C.H., Wood, S.A., Jonas, J.P. and Madison, J.P. (2003). Geochemistry of the rare earthelements and Uranium in the Berkeley Pit Lake: Butte, Montana. Chemical Geology 96, 90-103
George, A.M. and Okwueze, E.E. (2002). Seismic refraction investigation of groundwater potential in parts of the Oban Massif, southeastern Nigeria. Global Journal of Geological Sciences
Hem, J.D. (1985). Study and interpretation of the chemical characteristics of natural water. United States Geological Survey Water Supply Paper3, 1104-2301
Koonce, J.E., Yu, Z., Farham, I.M. and Stetzanback, K.J. (2006). Geochemical interpretation of groundwater flow in the southern Great Basins Geosphere 2 (2) 7-10
Langmuir, S. (1997). Aqueous environmental Geochemistry. Upper Saddle River, N. J Prentice Hall 978pp
Lee, J. Y, Choi, J. C, Yi, M. J, Kim, J.W, Cheon, J.Y, and Lee, K.K (2004). Evaluation of groundwater chemistry affected by an abandoned metal mine within a dam construction site South Korea. Quarterly Journal of Engineering Geology and Hydrogeology 37 241-256
Lyons, W.B., Lent, R.M., Djuke, N., Maletin Pijin, V. and Carey, A.E. (1992). Geochemistry of surface waters Vojvodina, Yugoslavia. Journal of Hydrology, 137, 33-55
Mathess, G. and Harvey, J.C. (1982). The properties of groundwater. Wiley New York
Nganje, T.N., Adamu, C.I., Ugbaja, A.N. and Amah, E.A. (2010). Evaluation of hydrochemical characteristics of groundwater. Journal of Geochemistry 29, 398-405
Nwankwoala, H.O. and Udom, G.J. (2011). Hydrochemical facies on ionic ratios of groundwater in Port Harcourt, southeastern Nigeria. Research Journal of chemical Sciences 1 (30) 3-8
Journal of Mining and Geology Vol. 55(2) 2019. 241
Tang, J. and Johannesson, K.H. (2005). Rare earth elements, concentration, speciation and fractionation along groundwater flow paths. The Carizo sand (Texas) and Upper Florida aquifers. Rare earth elements in groundwater flow systems 223-251
Tijani, M.N., Lochurt, E.P. and Uma, K.O. (1996). Groundwater in the Ogoja area, Lower Benue Trough Nigeria. African Journal of Earth Sciences
Toneto, E.M. and Bonot to , D.M. (2005) . Hydrochemical relationships in groundwater from central Sao Paulo-state Brazi l . Environmental Geology 47, 942-955
Udom, G.J., Esu, E.O. and Ekwere, S.J. (1996). Quality status of groundwater in Calabar Municipality southeastern Nigeria. Global journal of Pure and Applied Sciences 2(2) 14-15
Ushie, F.A. and Amadi, P.A. (2008). Chemical characteristics of groundwater from parts of the basement complex of Oban Massif, southeastern Nigeria. Science Africana 7 (2) 81- 88
Winter, T.C., Harvey, J.W., Frank, O.L. and Alley, W.M. (1998). Groundwater and surface water a single resource. United States Department of Interior, United geological Survey Circular 1139, 54-67
Wood, S.A. (1990). The aqueous geochemistry of rare earth elements and Ytterium. Review of available low temperature data for inorganic complexes and the inorganic rare earth elements speciation of natural waters. Chemical Geology 82, 159-167
Oden, M. I (2012). The pegmatite veins of western Oban massif. Tectonic and lithological controls o n physical properties of rocks. Journal of Environmental and Earth Sciences 4 (4) 381- 389
Ofoma, A.E., Onwuka, O.S. and Ngah, I. (2006). Salinity problems in coastal aquifers. A case study from Port Harcourt city southeastern Nigeria. Applied Groundwater studies in Africa
Okereke, C.S., Esu, E.O. and Edet, A.E. (19 96). Determination of potential groundwater sites using geological and geophysical techniques in the Cross River State southeastern Nigeria. Journal of African Earth Sciences 27 (1) 149-163
Ozler, H.M. (2003). Hydrochemistry and salt water intrusion in the Van aquifer, east Turkey. Environmental Geology 43 759-775
Pitkanen, P., Luukkonen, A., Routsalainen, P., Leino-Forseman, H. and Vuorinen, U. (1999). Geochemical modeling of groundwater evolution and residence time at the Kivetty site, Chemical Technology Posiva Report Mikonkatu Helsinki Finland 6, 98-10
Rose, S. (2000). Comparative major ion geochemistry piedmont terrain in the Atlantic Georgia region poss ib le e ffec t s o f underes t imat ion . Environmental Geology 42, 102-113
Smellie, J.A. and Wikberg, P. (1991). Hydrochemical investigation at Funsjon, Sweden. Journal of Hydrology, 126, 143
Starzynski, M.A. (1998). Trace elements geochemistry of Milk River aquifer groundwater AlbertaCanada, unpublished M.Sc. Thesis University of Saskatchewan Saskatoon, Sasktachewan

Journal of Mining and Geology Vol. 55(2) 2019.242