impact of high density hot aisles on it personnel work ... · pdf fileimpact of high density...
TRANSCRIPT

Impact of High Density Hot Aisles on IT Personnel Work Conditions
Revision 1
by Jim Fink
Introduction 2
Traditional and modern approaches to cooling data centers
2
The CFD experiment 5
Conclusion 9
Resources 10
Appendices 11
Click on a section to jump to it Contents
White Paper 123
The use of modern enclosed hot aisles to address increasing power densities in the data center has brought into question the suitability of working condi-tions in these hot aisle environments. In this paper, it is determined that the additional heat stress imposed by such high density IT environments is of minimal con-cern.
Executive summary>
white papers are now part of the Schneider Electric white paper libraryproduced by Schneider Electric’s Data Center Science Center [email protected]

Impact of High Density Hot Aisles on IT Personnel Work Conditions
Schneider Electric – Data Center Science Center White Paper 123 Rev 1 2
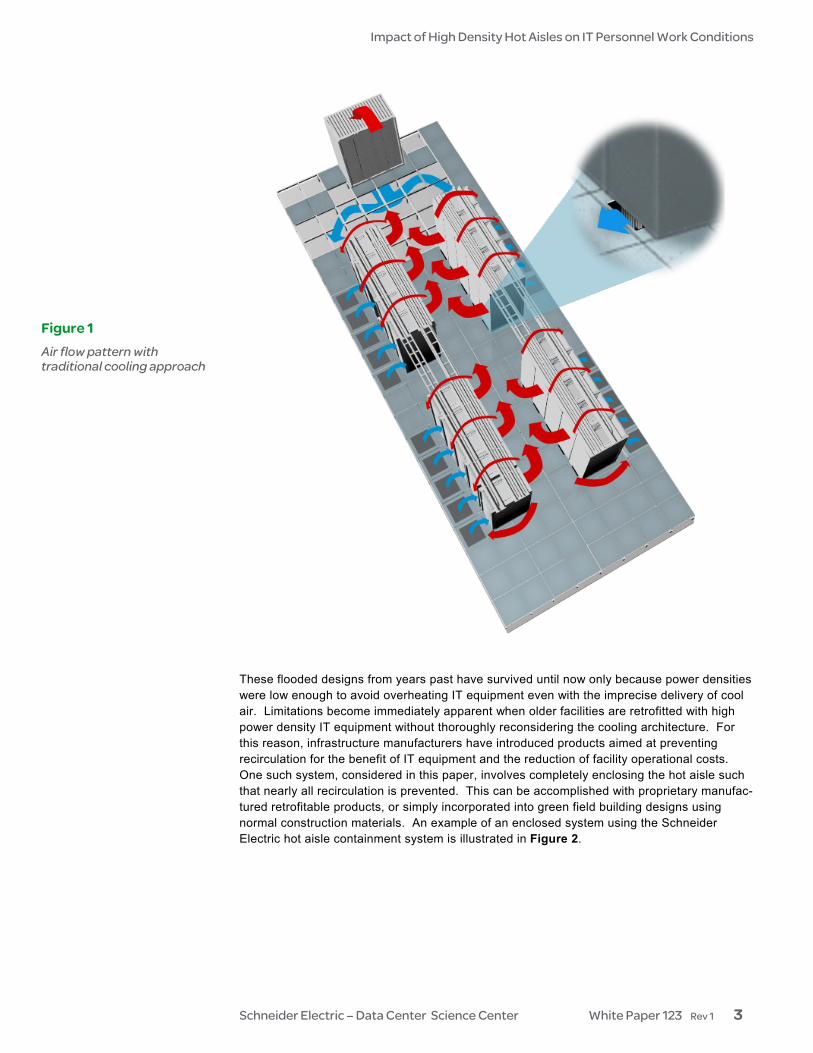
The primary purpose of a computer room and associated infrastructure is to support the operation of critical IT equipment. Traditionally, most owners of large critical data centers have been more than willing to accept a reasonable amount of computer room worker discomfort if necessary to support critical IT systems. This is evidenced in nearly every data center by the presence of elevated noise, hot and cool regions, high-velocity air, and sometimes less than ideal lighting as compared with adjoining office space. However, in recent years the rising power density of IT equipment has demanded new approaches to computer room cooling. In some cases these new approaches raise questions about the ability of workers to comfortably and safely work in the computer room. The traditional approach to cooling a data center uses a loosely coupled method of conveying air to and from the load. This means that cooling system supply air is widely dispersed within the room, generally via raised floor. There are no rigid boundaries to prevent cool air from mixing freely with air throughout the entire volume of the room. This is done as an attempt to hold the average bulk temperature of the room down to a level acceptable to IT equipment and personnel. The return air stream to the cooling system in such a room is representative of bulk room conditions, usually around 72°F (22°C). If a hot aisle / cold aisle layout is used in the room, temperatures observed should be higher than 72°F (22°C) in the hot aisle and lower than 72°F (22°C) in the cold aisle. In practice, these deviations from the overall average room temperature are almost never as large as desired. This is because traditional designs often allow a large portion of cool supply air to bypass its intended delivery points and directly enter the hot aisle, usually through cable hole penetrations in the floor. This lowers the hot aisle temperature. Similarly, legacy facilities generally contain no provisions to prevent hot IT equipment exhaust air from being drawn over the tops of racks or around the ends of rows into the cold aisle. While this is unarguably detrimental to the IT equipment in the room, the cool air leakage serves to lessen the heat stress experienced by an individual working in the hot aisle, and the hot air leakage might warm an uncomfortably cold aisle. Both recirculation flow paths are primarily undesirable because they increase average IT equipment operating temperatures and decrease cooling system efficiency. Figure 1 illustrates the data center and its air flow pattern when this traditional approach to cooling is used.
Introduction
Traditional and modern approaches to cooling data centers
Impact of High Density Hot Aisles on IT Personnel Work Conditions
Schneider Electric – Data Center Science Center White Paper 123 Rev 1 3
These flooded designs from years past have survived until now only because power densities were low enough to avoid overheating IT equipment even with the imprecise delivery of cool air. Limitations become immediately apparent when older facilities are retrofitted with high power density IT equipment without thoroughly reconsidering the cooling architecture. For this reason, infrastructure manufacturers have introduced products aimed at preventing recirculation for the benefit of IT equipment and the reduction of facility operational costs. One such system, considered in this paper, involves completely enclosing the hot aisle such that nearly all recirculation is prevented. This can be accomplished with proprietary manufac-tured retrofitable products, or simply incorporated into green field building designs using normal construction materials. An example of an enclosed system using the Schneider Electric hot aisle containment system is illustrated in Figure 2.
Figure 1 Air flow pattern with traditional cooling approach

Impact of High Density Hot Aisles on IT Personnel Work Conditions
Schneider Electric – Data Center Science Center White Paper 123 Rev 1 4
Some users of these new cooling systems have expressed interest in quantifying the level of heat stress that workers are being subjected to in order to ensure compliance with local worker safety standards. This paper intends to answer this question in both an absolute and relative sense. A conservative set of assumptions are made and comparisons are drawn between worker heat stress in a legacy data center and a modern zero recirculation data center. Heat and mass transfer analysis helps to illustrate the potential effects of recirculation on worker heat stress. By enforcing conservation of mass and energy, it is shown that for a worker standing in the hot aisle, heat stress could either decrease or increase as recirculation is reduced or eliminated. The actual result depends on where the worker is standing in relation to the onset of air mixing. If the worker positions himself such that he is mostly exposed to unmixed server exhaust air, he will be exposed to higher temperatures when recirculation is occuring than when it is not. This would likely be the case for someone working in very close proximity to the exhaust vents on servers. However, a worker whose job involved moving around in the general volume bounded by the hot aisle would likely experience lower temperatures in a data center where recirculation is allowed to occur. This is because the air to which this worker is exposed has had more of an opportunity to be tempered by cool supply air leaking into the hot aisle. Appendix A steps through the energy balance equations to illustrate this point. Meaningful conclusions cannot be drawn upon this dependency alone because turbulent mixing is somewhat like the weather. It is nearly impossible to perfectly predict, and you’ll never find two facilities where it happens the same way. However, with the competing effects well understood, an experiment with appropriate assumptions can be designed to best approximate worker heat stress in a real world data center.
Figure 2 Modern cooling approach

Impact of High Density Hot Aisles on IT Personnel Work Conditions
Schneider Electric – Data Center Science Center White Paper 123 Rev 1 5
The experiment involves comparison of two model data centers using Computational Fluid Dynamics (CFD) simulation models. The models are constructed and assumptions applied so as to most nearly represent typical installations of a legacy raised floor type data center and a modern enclosed hot aisle data center. Figures 3 and 4 illustrate the layout for each simulation.
The simulations differ as little as possible so as to isolate the effect of the hot aisle enclosure on worker heat stress. The size of the room has been chosen so as to represent a small 40 kW data center, or one zone of a much larger data center. Power density for both models
PDU UPS IT Enclosures
Enclosed Hot Aisle
Horizontal Flow Cooling Unit
DownflowCooling Unit
Perforated Tiles
PDU UPS
IT Enclosures Raised Floor
The CFD experiment
Figure 3 Top view of legacy data center floor plan
Figure 4 Top view of modern enclosed hot aisle data center floor plan

Impact of High Density Hot Aisles on IT Personnel Work Conditions
Schneider Electric – Data Center Science Center White Paper 123 Rev 1 6
was fixed to 3 kW per rack. Variables such as cooling system air flow, IT equipment air flow, UPS air flow and inefficiencies, and room dimensions and layout are held constant. By doing so, the CFD can focus on the impact of re-circulation in a raised floor environment in contrast to a zero circulation, enclosed hot aisle environment. The exact specifications used in each model are listed in Appendix B. For both models, “virtual thermocouples” are placed immediately behind each rack from floor level to six feet (1.83 meters) above the floor in one foot (0.30 meter) increments. The average temperature of all hot aisle sensing points is used to estimate bulk hot aisle dry bulb temperature to which a worker would be exposed. However, the dry bulb temperature alone is a poor measure of worker heat stress because it does not take into account the physiological effect of humidity levels or the presence of radiant heat. A much better measure of heat stress is wet bulb globe temperature, or WBGT. WBGT is different from a normal thermometer reading in that it takes into consideration air temperature, humidity, and radiant heat. Each of these factors can contribute to heat stress experienced by a worker. Guidance for maximum WBGT exposure for a variety of conditions is provided in the Occupational Safety & Health Administration (OSHA) Technical Manual Section III, Chapter 4. Other heat indices include the Effective Temperature Index (ET), and Heat Stress Index (HSI), also known as the Belding & Hatch Index. ET should be applied only when humidity is very high (IT equipment exhaust air is normally less than 20% RH humidity), and HSI is difficult to use and not a satisfactory indication of individual worker heat stress1 Equation 1 is for WBGT when no solar radiation is present, as is assumed to be the case in data centers. WBGT = .7 NWB + .3 GT (Equation 1) where; NWB is the natural wet bulb temperature GT is the globe temperature The natural wet bulb, NWB, temperature is a function of both the dry bulb temperature and relative humidity in a room. It is measured by placing a water-soaked wick type material over the bulb of a normal mercury thermometer. The latent heat removed from the thermometer bulb by evaporation of the water reduces the temperature relative to dry bulb, and is a direct representation of the ease with which a worker can disipate heat by sweating. A psychrometric chart can also be used to indicate wet bulb temperature if relative humidity is known. It has been assumed that both data centers are controlled to 45% RH. The globe temperature, GT, is defined as the reading of a temperature sensor in the center of a thin-walled blackened copper sphere. Both radiant heat and ambient dry bulb temperature contribute to this reading. The level of radiant heat absorbed by an individual standing in the hot aisle is negligible because visible solid surfaces are not substantially hotter than the worker’s body temperature. Because of this, the dry bulb temperature from the CFD simulation can be used in place of globe temperature without compromising accuracy. NWB and GT are then summed using Equation 1 to arrive at WBGT. The experiment results are judged for acceptability against OSHA (US) and ISO (international) guidelines. Table 1 represents these OSHA guidelines. 1 OSHA Technical Manual Section III, Ch. 4, Table III:4-2

Impact of High Density Hot Aisles on IT Personnel Work Conditions
Schneider Electric – Data Center Science Center White Paper 123 Rev 1 7
Work / rest regimen (hourly duty cycles)
Light work load Max permissible WGBT
Moderate work load Max permissible WGBT
Heavy work load Mass permissible
WGBT
Continuous 86F (30C) 80F (26.7C) 77F (25C)
75% work / 25% rest 87F (30.6C) 82F (27.8C) 78F (25.6C)
50% work / 50% rest 89F (31.7C) 85F (29.4C) 82F (27.8C)
25% work / 75% rest 90F (32.2C) 88F (31.1C) 86F (30C)
OSHA provides adjustments for a number of other conditions such as clothing type and work classification in order to make WBGT a usable quantity accross a diverse range of industries. Additionally, OSHA guidelines for heat stress apply to individuals in generally good health, receiving adequate water and electrolyte intake. The OSHA description of “light work load” is thought to most nearly match the work of a typical IT worker task such as installing rack mounted equipment, or routing network cables, and the worker is assumed to be dressed in normal single layer clothes. For comparison, OSHA defines “heavy work load” as heavy full body work, and cites ”laying railroad ties” as an example of work fitting this category. Regulations and directives regarding occupational safety generally differ from country to country, so it is important to be familiar with the local requirements. ISO 7243, “Hot environments – Estimation of the heat stress on working man based on WBGT index” provides similar guidance for the international community. Figure 5 shows a graph from Annex B of ISO 7243 relating maximum WBGT for various metabolic rates and duty cycles.
Table 1 OSHA guidelines (US only)
Figure 5 ISO guidelines (International)
Impact of High Density Hot Aisles on IT Personnel Work Conditions
Schneider Electric – Data Center Science Center White Paper 123 Rev 1 8
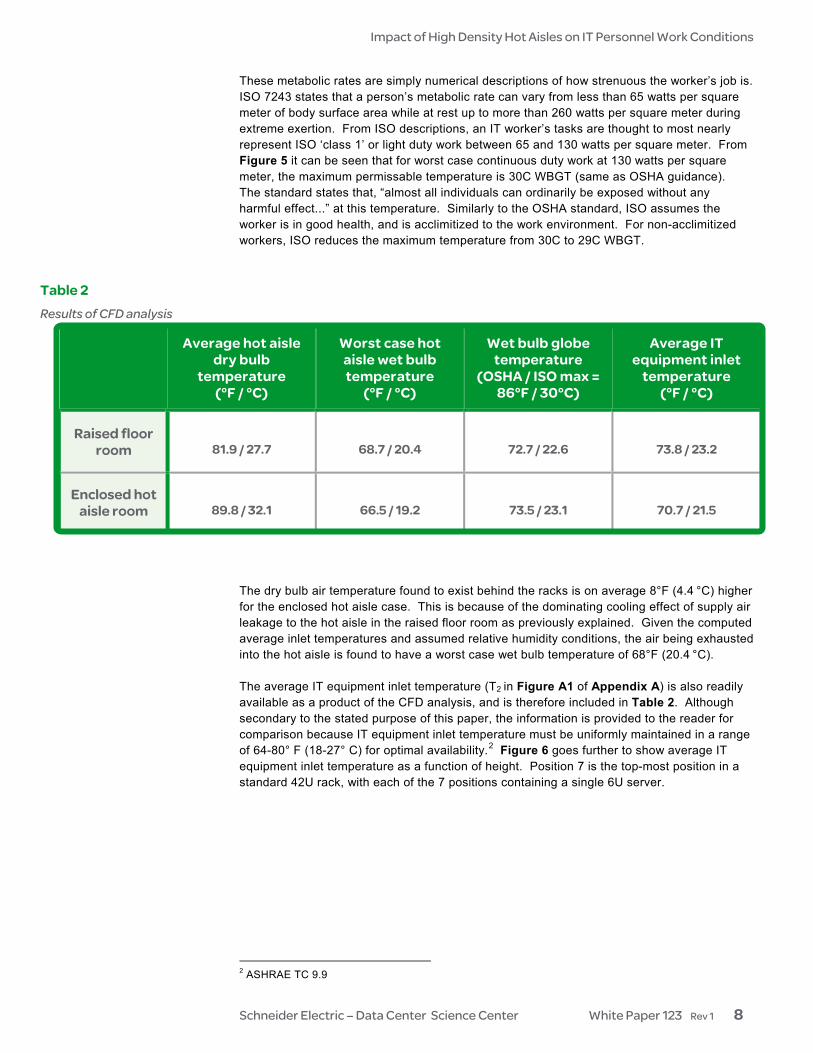
These metabolic rates are simply numerical descriptions of how strenuous the worker’s job is. ISO 7243 states that a person’s metabolic rate can vary from less than 65 watts per square meter of body surface area while at rest up to more than 260 watts per square meter during extreme exertion. From ISO descriptions, an IT worker’s tasks are thought to most nearly represent ISO ‘class 1’ or light duty work between 65 and 130 watts per square meter. From Figure 5 it can be seen that for worst case continuous duty work at 130 watts per square meter, the maximum permissable temperature is 30C WBGT (same as OSHA guidance). The standard states that, “almost all individuals can ordinarily be exposed without any harmful effect...” at this temperature. Similarly to the OSHA standard, ISO assumes the worker is in good health, and is acclimitized to the work environment. For non-acclimitized workers, ISO reduces the maximum temperature from 30C to 29C WBGT.
Average hot aisle dry bulb
temperature (°F / °C)
Worst case hot aisle wet bulb temperature
(°F / °C)
Wet bulb globe temperature
(OSHA / ISO max = 86°F / 30°C)
Average IT equipment inlet
temperature (°F / °C)
Raised floor room
81.9 / 27.7
68.7 / 20.4
72.7 / 22.6
73.8 / 23.2
Enclosed hot aisle room
89.8 / 32.1
66.5 / 19.2
73.5 / 23.1
70.7 / 21.5
The dry bulb air temperature found to exist behind the racks is on average 8°F (4.4 °C) higher for the enclosed hot aisle case. This is because of the dominating cooling effect of supply air leakage to the hot aisle in the raised floor room as previously explained. Given the computed average inlet temperatures and assumed relative humidity conditions, the air being exhausted into the hot aisle is found to have a worst case wet bulb temperature of 68°F (20.4 °C). The average IT equipment inlet temperature (T2 in Figure A1 of Appendix A) is also readily available as a product of the CFD analysis, and is therefore included in Table 2. Although secondary to the stated purpose of this paper, the information is provided to the reader for comparison because IT equipment inlet temperature must be uniformly maintained in a range of 64-80° F (18-27° C) for optimal availability.2 Figure 6 goes further to show average IT equipment inlet temperature as a function of height. Position 7 is the top-most position in a standard 42U rack, with each of the 7 positions containing a single 6U server. 2 ASHRAE TC 9.9
Table 2 Results of CFD analysis

Impact of High Density Hot Aisles on IT Personnel Work Conditions
Schneider Electric – Data Center Science Center White Paper 123 Rev 1 9
Although both average temperatures fall within desired range, Figure 6 shows that the legacy raised floor data center has a very undesirable temperature gradient, subjecting equipment installed near the top of racks (shown as server positions 6 and 7) to excessive temperatures of 80.9°F (27.2°C) and 91°F (32.8 °C) respectively. Recirculation prevention is a desirable condition that results in colder cold aisles and hotter hot aisles. While this characteristic benefits the facility from the standpoint of availability, power density capacity, and energy efficiency, it does result in slightly increased heat stress (approximately 1 degree WBGT F) to individuals exposed to hot aisle conditions. However, the anticipated heat stress remains well below OSHA / ISO imposed limitations. The small rise in WBGT occurs because mixing in the raised floor facility acts to lower hot aisle WBGT slightly more than the increased IT exhaust temperature acts to raise it. Although conserva-tive assumptions were made, individual data center performance will vary. For example, a sufficiently deep (36 inches or 0.91 meter) unobstructed raised floor was used in this experiment to be conservative. If a shallower raised floor with partial blockage were simu-lated, the results could differ significantly.
Conclusion
Jim Fink is a licensed professional engineer and electrical forensics practitioner. Jim is a BSEE graduate of Union College in 1994, and obtained his MBA at University of Rhode Island in 2005. Jim has 16 years of critical facility infrastructure design and operational experience ranging from nuclear plants to data centers. He also serves as the chairman of the Rhode Island state Electrical Code committee. In 2008 Jim was selected by the local chapter of National Society of Professional Engineers to receive the "Young Engineer of the Year" award.
About the author
Average IT Inlet Temperatures
91.0
80.9
1
2
3
4
5
6
7
65.0 70.0 75.0 80.0 85.0 90.0 95.0
Temperature (deg F)
Serv
er P
ositi
on Enclosed Hot Aisle RoomRaised Floor Room
Figure 6 IT equipment inlet temperature as a function of mounting position in rack

Impact of High Density Hot Aisles on IT Personnel Work Conditions
Schneider Electric – Data Center Science Center White Paper 123 Rev 1 10
White Paper Library whitepapers.apc.com
TradeOff Tools™ tools.apc.com
Resources Click on icon to link to resource
For feedback and comments about the content of this white paper: Data Center Science Center [email protected] If you are a customer and have questions specific to your data center project: Contact your Schneider Electric representative
Contact us

Impact of High Density Hot Aisles on IT Personnel Work Conditions
Schneider Electric – Data Center Science Center White Paper 123 Rev 1 11
The effect of recirculation on hot aisle worker heat stress is unclear because of competing effects. Figure A1 shows a flow diagram representing intended and recirculation air flow paths in a computer room. It is assumed that the system is heat and flow balanced, meaning the total heat rejected from the cooling system is equal to the total heat dissipated by the IT equipment, and the total flow rate of air supplied by the cooling equipment is equal to the
total air ingested by the IT equipment, or 1V& + 2V& .
An energy balance written for both stream mixing processes reveals:
21
32112 VV
TVTVT
&&
&&
+⋅+⋅
= Equation 1
21
12314 VV
TVTVT
&&
&&
+⋅+⋅
= Equation 2
Equations 1 and 2 are rearranged so that the effect of recirculation on 2T and 4T is apparent.
⎟⎟⎠
⎞⎜⎜⎝
⎛Δ+=
1
212 V
VTTT&
& Equation 3
⎟⎟⎠
⎞⎜⎜⎝
⎛Δ−=
1
234 V
VTTT&
& Equation 4
Equation 3 and 4 show that as recirculation decreases, IT equipment supply air temperture
2T is minimized, and cooling system return air temperature 4T is maximized. For previously
mentioned reasons, these are both generally desirable conditions with respect to facility availability and energy efficiency. A worker directly exposed to IT equipment exhaust air would experience temperature 3T .
This may occur for example if the worker’s job required he or she to actually stand in the back of the IT enclosure, thereby being completely surrounded by hot exhaust air. Writing equation 3 in terms of 3T yields;
⎟⎟⎠
⎞⎜⎜⎝
⎛ +Δ+=
1
2113 V
VVTTT&
&& Equation 5
Appendix A – heat & mass transfer theory
ITEquipment
CoolingEquipment
Mixing
Mixing1V&
2V& 2V&
1V&
1T 2T
4T3T
1T : Cooling equipment supply air
temperature
2T : IT equipment inlet air temperature
3T : IT equipment exhaust air temperature
4T : Cooling equipment return air tempera-
ture
2314 TTTTT −=−=Δ
1V& : Volumetric flow rate of air in intended
flow path
2V& : Volumetric flow rate of recirculation air

Impact of High Density Hot Aisles on IT Personnel Work Conditions
Schneider Electric – Data Center Science Center White Paper 123 Rev 1 12
Equation 5 shows that temperature 3T and hence the worker’s heat stress would decrease
as recirculation ( 2V& ) is reduced or eliminated. In simple terms this can be explained by
saying that the air around the worker’s body has only been heated from 1 pass, not multiple passes through IT equipment, therefore it is cooler than it would be had recirculation been occuring. However, in a typical raised floor computer room, the return air mixing shown just upstream of the cooling system in Figure A1 often occurs further upstream (closer to the IT equipment exhaust). In other words, cool supply air entering the hot aisle actually begins to mix with hot server exhaust air well before travelling all the way back to the cooling system. This suggests that a worker standing in the hot aisle would be more nearly exposed to 4T ,
the post mixing return air tempurature, rather than 3T , the unmixed IT equipment exhaust air
temperature. Equation 4 shows that a worker standing in air at temperature 4T would endure
increased heat stress if recirculation were reduced or eliminated. Thus, the net effect of recirculation prevention on a worker’s heat stress level depends on just where the worker is standing in relation to where the two air streams begin mixing. Meaningful conclusions cannot be drawn upon this dependency alone because turbulent mixing is somewhat like the weather. It’s nearly impossible to perfectly predict, and you’ll never find two facilities where it happens the same way. However, with the competing effects well understood, an experiment with appropriate assumptions can be designed to best approximate worker heat stress in a real world data center.

Impact of High Density Hot Aisles on IT Personnel Work Conditions
Schneider Electric – Data Center Science Center White Paper 123 Rev 1 13
Specifications common to both data center models
IT racks 13
Power per IT rack 3.08 kW uniformly distributed amongst 7 x 6U servers per rack
Total IT power 40 kW
UPS inefficiencies 3.2 kW
PDU inefficiencies 800 W
IT air flow per rack 391 cfm (664 m3/h)
UPS air flow 513cfm (872 m3/h)
Room dimensions H x W x D = 10 x 23.4 x 14 feet (3 x 7.1 x 4.3 meters)
IT intake relative humidity 45%
Cooling system air flow 6,500cfm (11,043 m3/h)
Specifications unique to raised floor data centers
Raised-floor plenum A 3 foot (0.91 meter) under-floor plenum is used to minimize effects of under-floor pressure gradient
Recirculation 40% recirculation occurs by way of uniformly distributed leakage from the raised floor Note: most large raised floor installations observed in the field are found to exhibit at least this much recirculation.
Cooling system Down-flow cooling unit
Specifications unique to raised floor data centers
Specifications unique to enclosed hot aisle data centers
Hot aisle Enclosed on tops and ends, but not hermetically sealed
Cooling system Rear return front discharge cooling unit (horizontal flow)
Specifications unique to raised floor data centers
Appendix B – data used in CFD models