impact of ict on development of automotive industry
TRANSCRIPT

Impact of ICT on Development of Automotive Industry
Vučina, Toma
Master's thesis / Diplomski rad
2020
Degree Grantor / Ustanova koja je dodijelila akademski / stručni stupanj: University of Zagreb, Faculty of Economics and Business / Sveučilište u Zagrebu, Ekonomski fakultet
Permanent link / Trajna poveznica: https://urn.nsk.hr/urn:nbn:hr:148:232968
Rights / Prava: Attribution-NonCommercial-ShareAlike 4.0 International
Download date / Datum preuzimanja: 2021-12-05
Repository / Repozitorij:
REPEFZG - Digital Repository - Faculty of Economcs & Business Zagreb

University of Zagreb
Faculty of Economics and Business
Master in Managerial Informatics
Impact of ICT on Development of Automotive Industry Master Thesis
Toma Vučina, 0054039462
Mentor: Assistant Professor Jovana Zoroja, Ph.D.
Zagreb, September 2020

STATEMENT ON ACADEMIC INTEGRITY
I hereby declare and confirm with my signature that the master thesis
is exclusively the result of my own autonomous work based on my research and literature
published, which is seen in the notes and bibliography used.
I also declare that no part of the paper submitted has been made in an inappropriate way,
whether by plagiarizing or infringing on any third person's copyright.
Finally, I declare that no part of the paper submitted has been used for any other paper in
another higher education institution, research institution or educational institution.
With this signature I confirm that in preparing this thesis have complied fully with the Code of
Ethics of the University of Zagreb.
Student signature:

Contents 1. Introduction .................................................................................................................................... 1
1.1. Topic and Goals of the Thesis ................................................................................................. 1
1.2. Explanation of Methodology................................................................................................... 2
1.3. Structure of the Thesis ............................................................................................................ 3
2. Automotive Industry ....................................................................................................................... 4
2.1. Development of the Automotive Industry .............................................................................. 4
2.2. Market Trends of the Automotive Industry ............................................................................ 5
2.2.1. Statistics Data for European Market ............................................................................... 7
2.2.2. Statistics Data for Croatia ............................................................................................. 12
2.2.3. Comparison and Discussion .......................................................................................... 19
3. Impact of ICT on Automotive Industry .......................................................................................... 21
3.1. Application of ICT in Automotive Industry ............................................................................ 21
3.2. Advantages and Disadvantages of ICT Impact on Automotive Industry ............................... 25
3.3. Future Trends of ICT Usage in the Automotive Industry ...................................................... 27
3.3.1. Electric Vehicles ............................................................................................................ 27
3.3.2. Autonomous Vehicles ................................................................................................... 31
3.3.3. Application of “Internet of Things” in Automotive Industry ......................................... 34
4. Analysis of Research Results regarding ICT Usage in Automotive Industry .................................. 36
4.1. Research Methodology ......................................................................................................... 36
4.2. Research Results ................................................................................................................... 37
4.3. Discussion .............................................................................................................................. 62
5. Conclusion ..................................................................................................................................... 64
6. List of References .......................................................................................................................... 65
7. Appendix ....................................................................................................................................... 68

1
1. Introduction
An important cognition to have in mind while approaching this thesis is that personal vehicles,
specifically cars are objects of great financial value, which makes a big difference in the
approach of consumers. Unlike the approach of purchasing an accessory such as sunglasses or
shoes where consumers can be quite pliable and rash when making a decision, cars are products
that the consumer will own somewhere in the range of five to ten years and will have to invest
approximately a year worth of salaries. In this situation any rational buyer will think twice
about going for a 7- or 10-inch display, since car parts are drastically overpriced. Knowing this,
retailers can gain a significant advantage by analysing sales data in order to tailor their
assortment according to the buyers needs and wishes.
There are many points of pressure being placed upon manufacturers and retailers alike that will
inevitably instigate changes in their business models. The European Union is pushing more
and more regulations and policies regarding fuel consumption and carbon dioxide emissions;
public transportation is becoming more and more convenient; various taxi services are
improving their services with the competition putting pressure on prices; car-sharing and car-
pooling models and emerging and becoming more prominent in Europe.
Automotive industry has taken some big turns in the last 5-7 years with the goal of reducing
the negative effects on the environment that it inherently leaves. There is an ongoing inception
of a new trend where consumers are starting to realize the benefits of electric vehicles and
switch to them. However, this evolution of personal vehicles would not be possible without all
the ICT support enabling new features and functionalities.
It is common knowledge that consumers in Croatia have different preferences when purchasing
personal vehicles and the research done for this thesis will try to objectify and quantify that
knowledge.
1.1. Topic and Goals of the Thesis
The automotive industry has long surpassed the stage where pistons, engine displacement and
carburettors were the only factors. In this day and age, majority of vehicles have the same two
or three engines and everything else depends on modern technology and the usage of ICT
systems. In fact, electric vehicles are making their entrance into the European market with the
battery technology still in development, with much room for improvement. On today’s
automotive market the real dealbreaker when it comes to making a sale are ICT features the
2
car can offer. This thesis will emphasise on explaining the usage of those tech features in
modern vehicles, such as advanced systems for adaptive cruise control, emergency braking,
parking cameras and sensors, smartphone integration, infotainment, self-parking and all the
way to full autonomy. However, every additional piece of equipment brings about more
complexity and added costs and maintenance. Because of that, advantages and disadvantages
of ICT usage will be broken down and explained. Furthermore, Croatian car market, although
completely reliant on the European market, differs in many aspects, which will be investigated
in this thesis.
In this thesis, development of automotive industry will be presented as well as future trends
regarding usage of latest ICT trends in automotive industry. The purpose of thesis is to present
influence of the ICT on development of the automotive industry. Beside theoretical framework,
statistical data collected from Eurostat about automotive industry in Europe will be presented.
CVH (Centar za Vozila Hrvatska) also provide data on vehicles in the M1 category from 2019
which will give an overview of average age of vehicles, average CO2 emissions and average
price in Croatia. This information will provide detailed statistics on the current state of the
automotive industry mainly in the EU and a comparison with Croatia.
The goal of the thesis is to determine the impact of ICT on development of automotive industry.
A questionnaire will be conducted in order to investigate respondents’ preferences when
purchasing a vehicle especially regarding ICT application and to determine which technology
is used the most in the automotive industry in Croatia.
1.2. Explanation of Methodology
In order to achieve research goal, literature review regarding automotive industry and impact
of ICT to automotive industry will be presented. In addition, descriptive analysis will be
applied to analyse collected data. Data will be collected via online questionnaire in order to
investigate respondents’ preferences when purchasing a vehicle especially regarding ICT
application and to determine which technology is used the most in the automotive industry in
Croatia. Questionnaire consists of following parts: (i) respondents’ demographic
characteristics; (ii) respondents’ preferences when purchasing a vehicle (brand, price, age, co2,
…); (iii) respondents’ preferences regarding technology usage in vehicle; (iv) respondents’
opinion regarding ICT trends in automotive industry. Survey will be distributed via Internet,
social media and online forums. The survey was carried out on a sample of Croatian citizens
who are Internet users.

3
1.3. Structure of the Thesis
The first chapter is Introduction which will include description of Topic and Goal of the Thesis.
Furthermore, Data and Methodology will be presented. At the end of the Introduction, Structure
of Thesis will be described.
The second chapter is Automotive Industry. This chapter will include description of
Development of the Automotive Industry, market Trends of Automotive Industry and statistics
Review of the Automotive Industry. In the last subsection of the second chapter, statistics data
for EU and Croatia market regarding automotive industry will be presented.
The third chapter is about the Impact of ICT on Automotive Industry. This chapter will start
off by explaining the Application of ICT in Automotive Industry, followed by a breakdown of
Advantages and Disadvantages of ICT Impact on Automotive Industry. The last subsection of
the third chapter will present Future Trends of ICT Usage in the Automotive Industry, divided
into three subsections about Electric Vehicles, Autonomous Vehicles and Application of
“Internet of Things” in Automotive Industry.
The fourth chapter is Analysis of Research Results regarding ICT Usage in Automotive
Industry, where the sub-chapters will explain and present the Research Methodology, Research
Results followed by a Discussion.
After this, a Conclusion will be brought forth. Followed by the final three chapters, which are
List of References, List of Graphs and Tables and the Appendix.

4
2. Automotive Industry
2.1. Development of the Automotive Industry
Many individuals throughout history can be credited with some sort of an idea for a self-
propelled personal passenger vehicle. The idea occurred to Homer while writing the Iliad where
he stated that Vulcan had made some kind of self-moved tricycles; Leonardo da Vinci also
proposed an idea in the 15th century; in 1760 a Swiss clergyman thought it clever to mount
small windmills to a cart. Most historians will, however, agree that Nicolas-Joseph Cugnot, a
French military engineer, contracted the first “true” automobile. All of this is not very relevant
to this thesis, and this chapter will focus on major developments after the invention of the
internal combustion engine, more precisely, since Henry Ford’s assembly line started rolling
in 1913.
Although, the entire industry and a large part of the todays world can be thanked to Karl Benz
or Gottlieb Daimler for the invention of the internal combustion engine and the four-stroke
cycle, based on which to this day vehicles are constructed, the real inception to the automotive
industry started with Ford’s assembly line.1 In 1913, Henry Ford came up with an idea for the
first moving assembly line for mass production. He took inspiration for this concept from the
continuous-flow production methods used by flour mills, breweries, canneries and industrial
bakeries. This concept reduced the time it took to build a car from over 12 hours to just two
and a half hours, which is more than a quadruple time reduction without even considering the
cost reduction and increase in efficiency. His model T was in no way an exquisite product, it
was in fact simple, sturdy and cheap. His business idea was not based on the vehicle itself but
on perfecting the efficiency at which his workers could assemble the vehicles. From the
introduction in 1913 to 1914 his factory produced and sold 10 million cars to the public.2
1 Purdy, K., W., Foster, C., G., Britannica: History Of The Automobile
https://www.britannica.com/technology/automobile/History-of-the-automobile 2 History.com (2009): Ford’s assembly line starts rolling https://www.history.com/this-day-in-history/fords-
assembly-line-starts-
rolling#:~:text=On%20December%201%2C%201913%2C%20Henry,two%20hours%20and%2030%20minutes
.

5
2.2. Market Trends of the Automotive Industry
This chapter will break down the most significant trends in the automotive industry in the recent
years, which is important for analysis of the Croatian market since it is completely dependent
on EU regulations and foreign manufacturers, which are also mostly European.
It was shown in the previous chapter how the amount of funding pumped into research and
development has constantly been rising for the past 10 years and it can only be expected that
that trend will continue, only in greater numbers. Encouraged by Tesla’s emergence on the
market, many other manufacturers have been dabbling in electric vehicles recently. BMW
released their sporty and expensive hybrid i8 model in June 2014 and their every-day fully
electric i3 model in July 2016. Volkswagen have their e-Golf and e-Up fully electric versions,
the Golf from 2014 and Up from last year, 2019. However, the fully electric trend is picking
up and Volkswagen decided to release a whole new electric model named ID.3. The name of
the model represents the third model in history to mark a new direction of their identity, first
one being the Beetle in the 50s, followed by the Golf in the 70s.
However, looking at this chart, provided by acea.be it is obvious that only 3.4% of all passenger
cars in Europe are not powered by either diesel of petrol (Figure 1).
Figure 1: Distribution by fuel type (Source: acea.ne)
Alternatively-powered petrol Diesel Unknown
6
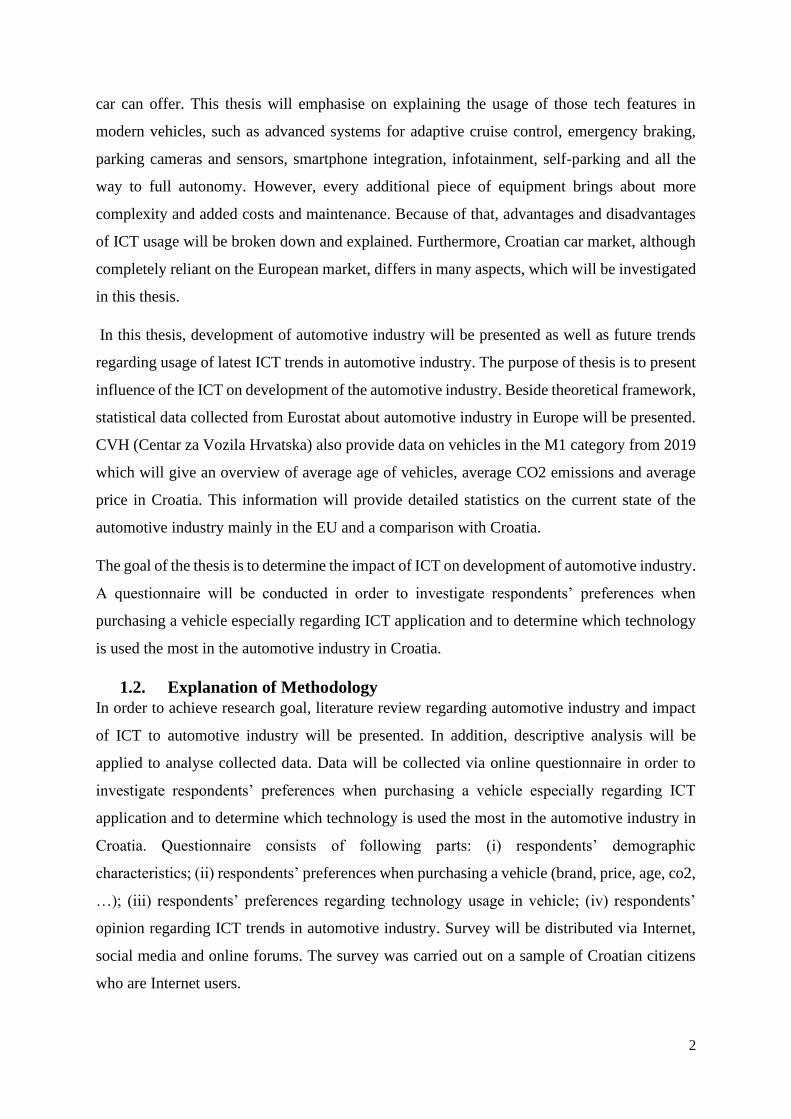
This chart can even be broken down into more detail with data taken from Statista, where the
distribution of fuel types in European countries can be observed (Table 1). Aside from Norway,
Netherlands and France no countries have over 4% share of electric cars. Norway setting the
bar very high at 50.52%.
Petrol Diesel
Battery
electric Hybrid
APV
other
Plug in
hybrid
Austria 46.13% 38.99% 4.45% 8.07% 0.19% 2.17%
Czechia 63.97% 28.46% 1.66% 4.08% 0.92% 0.90%
France 48.70% 33.18% 7.12% 8.26% 0.16% 2.58%
Germany 51.25% 31.94% 3.71% 9.00% 0.33% 3.77%
Ireland 38.13% 43.81% 3.31% 12.68% 0.00% 2.06%
Italy 45.03% 34.11% 1.55% 10.00% 8.46% 0.85%
Netherlands 71.81% 5.30% 8.43% 11.18% 0.11% 3.17%
Romania 60.99% 29.68% 0.97% 8.03% 0.33% 0.00%
Slovakia 64.38% 26.29% 0.88% 7.03% 0.59% 0.83%
Slovenia 60.91% 33.82% 2.93% 2.84% 0.03% 0.00%
Spain 54.88% 27.29% 1.81% 13.45% 1.07% 1.51%
EU 52.30% 29.91% 3.72% 9.42% 1.60% 3.05%
Norway 9.50% 10.79% 50.52% 9.96% 0.00% 19.23%
United Kingdom 60.39% 18.91% 3.78% 14.11% 0.00% 2.83% Table 1: Distribution by fuel type per country (Source: acea.be)
It can also be noticed that in all countries except Ireland, the majority of people drive petrol
cars. This fact will be useful in the later chapter when the data in Croatia is introduced. Ireland
is the only country on this list that has more diesel cars than petrol cars. Here is the data shown
from the table illustrated in a graph (Figure 2)
0.00%
20.00%
40.00%
60.00%
80.00%
100.00%
120.00%
Petrol Diesel Battery electric Hybrid APV other Plug in hybridFigure 2: Distribution by fuel type per country (Source: acea.be)
7
2.2.1. Statistics Data for European Market
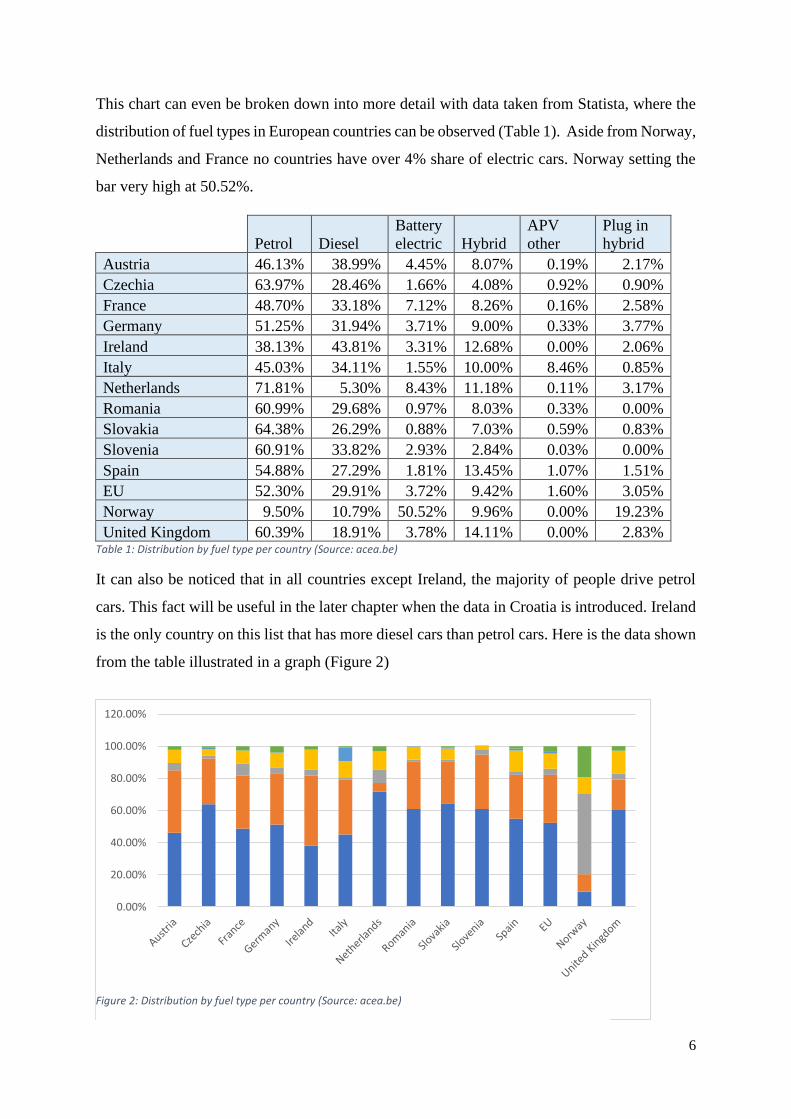
According to a paper for the European Commission, by Egil Juliussen and Richard Robinson,
the automotive industry is a major European manufacturing and service industry and is one of
the backbones of the European economy. The following table will show the statistics presented
by the European Automobile Manufacturers’ Association (ACEA) (Table 2).
Key Information Other Information
Employment Direct jobs: 2.2 million
6.5% of manufacturing
jobs
Total jobs: 12.1 million 6% of all jobs
Revenue Worldwide: €551 billion ACEA members
R&D Investment Europe: €20 billion 4% of sales
Worldwide: €40 billion 7% of sales
Automotive
production
19.7 million vehicles Cars, vans, trucks, buses
17.1 million passenger vehicles 27% of worldwide total
Exports €42.8 billion net trade
Leading EU export
industry
Vehicle taxes
€281 billion in government
revenue 3.5% of European GDP Table 2:State of auto industry for EU, year 2007 (Source: acea.be)
This table (Figure 2) is taken from the year 2007 and it shows us that 2.2 million jobs are
provided directly by manufacturers, while 12.1 million people are employed in the automotive
industry indirectly, 551 billion euros of total revenue was produced, 17.1 million passenger
cars were produced and 40 billion euros were invested in research and development. The
automotive industry has contributed with 3.5% of the entire European GDP which is 381 billion
euros. The automotive industry is EU’s leading export industry.3
3 European Automobile Manufacturers Association (2020): The Automobile Industry Pocket Guide

8
Now, this table from 2018. /2019. can be taken and compared with 11/12 years’ time in
between. (Table 3)
Employment
Manufacturing of motor vehicles
(EU)
2.7 million people = 8.5% of
EU employment in
manufacturing
Production
Total (EU manufacturing, services
and construction)
14.6 million people = 6.7% of
total EU employment
Motor vehicles (world) 92.8 million units
Motor vehicles (EU)
18.5 million units = 20% of
global motor vehicle
production
Passenger cars (world) 74.2 million units
Passenger cars (EU)
15.8 million units = 21% of
global passenger car
production
Trade
Motor vehicle exports (extra-EU) €135.9 billion
Motor vehicle imports (extra-EU) €62.0 billion
Trade surplus €73.9 billion
Environment
Average CO2 emissions new cars
(EU) 123g CO2/km
R&D Investment
Automotive R&D investment €60.9 billion
Vehicle taxes
Fiscal income from motor vehicles €440.4 billion Table 3:State of auto industry for EU, year 2019 (Source: acea.be)
It can be observed that direct employment provided by the automotive industry increased by
2% and total employment increased by 0.7%. Furthermore, an increase of 50% is visible in
research and development and revenue increased from 381 billion euros to 440.4 billion euros
which is a 15% increase. Interestingly, a decrease in production is noticeable which can be
connected to the claim made in the introduction of the thesis regarding the pressures placed
upon the manufacturers.
Table 4 will show the number of employed people in different sectors of the industry. Direct
manufacturing encapsulates jobs in: motor vehicles, bodies (coachwork), trailers and semi-
trailers and parts and accessories. Indirect manufacturing represents jobs in: Rubber tyres and
tubes, rethreading and rebuilding tyres; computers and peripheral equipment; electric motors,

9
generators and transformers; bearings, gears etc; cooling and ventilation equipment.
Automobile use represents jobs in: sales, maintenance, sales of parts and accessories, sales of
fuel, renting and leasing. Construction represents jobs in construction of roads, motorways,
bridges and tunnels. The Table 4 will show these numbers for years 2014-2018.
It can be observed that in every of these fields of employment, year after year there is a steady
increase in the number of jobs. The key field for this thesis is indirect manufacturing as it
contains the jobs on development of on-board computers and various other tech. The increase
from 2017 to 2018 is actually the smallest which is why the percentage change in every year
and a total change from 2014 to 2018 should be observed. (Table 5)
Year
% change in
indirect
manufacturing
18/17 1.02%
17/16 6.50%
16/15 -1.14%
15/14 1.92%
18/14 8.40% Table 5: Percentage change in indirect manufacturing employment (Source: acea.be)
Surprisingly there is a decrease in employment in indirect manufacturing in 2016 in regards to
2015. One possible reason for this atypical decrease could be the diesel emissions scandal in
the third quarter of 2015 and the first quarter of 2016 where many car manufacturers had been
caught dabbling with their numbers, such as: Renault, Nissan, Hyundai, Fiat, Volvo and others.
EU
automotive
employment
2014 2015 2016 2017 2018
%
change
18/17
Direct
manufacturing 2,369,951 2,441,910 2,491,693 2,597,345 2,685,478 3.39%
Indirect
manufacturing 892,885 910,004 899,647 958,152 967,925 1.02%
Automobile
use 4,264,490 4,304,382 4,453,169 4,531,379 4,657,198 2.78%
Transport 4,980,618 5,047,587 5,229,789 5,390,441 5,591,549 3.73%
Construction 641,931 675,338 650,011 705,199 727,230 3.12%
TOTAL 13,149,875 13,379,221 13,724,309 14,182,516 14,629,380 3.15%
Table 4: EU automotive employment 2014-2018 (Source: acea.be)

10
Many manufacturers had to pay large fines and subsequently cut costs by laying off workers.4
A large sudden increase from 2016 to 2017 can also be observed, which can be attributed to
the fact that 2017 and late 2016 were big years for new model releases and existing model
facelifts. The number of employees in indirect manufacturing increased by 8.4% from 2014 to
2018.
The total increase in employment in those 4 years is 11.25%. The following chart (Figure 3)
will display the data:
Figure 3: EU automotive employment 2014-2018 (Source: acea.be)
The following table (Table 6) shows that Croatia’s part in the direct manufacturing employment
is 1.1%, which is higher only than Greece and Cyprus at 0.5%3
Austria 39,569 Estonia 2,880 Italy 176,303 Slovakia 81,273
Belgium 28,768 Finland 10,199 Latvia 2,317 Slovenia 15,887
Bulgaria 23,777 France 229,422 Lithuania 6,163 Spain 162,634
Croatia 2,919 Germany 882,046 Netherlands 25,204 Sweden 90,473
Cyprus 168
Greece 1,737 Poland 213,708
United
Kingdom 166,228
Czech Republic 181,415
Hungary 101,865 Portugal 42,358
European
Union 2,685,478
Denmark 4,317 Ireland 3,000 Romania 190,848 Table 6:Croatian direct manufacturing employment (Source: acea.be)
4 Carrington, D., The Guardian (2015): Wide range of cars emit more pollution in realistic driving tests, data
shows https://www.theguardian.com/environment/2015/sep/30/wide-range-of-cars-emit-more-pollution-in-real-
driving-conditions-tests-show
0
2000000
4000000
6000000
8000000
10000000
12000000
14000000
16000000
Directmanufacturing
Indirectmanufacturing
Automobile use Transport Construction TOTAL
Sum of 2014
Sum of 2015
Sum of 2016
Sum of 2017
Sum of 2018
11
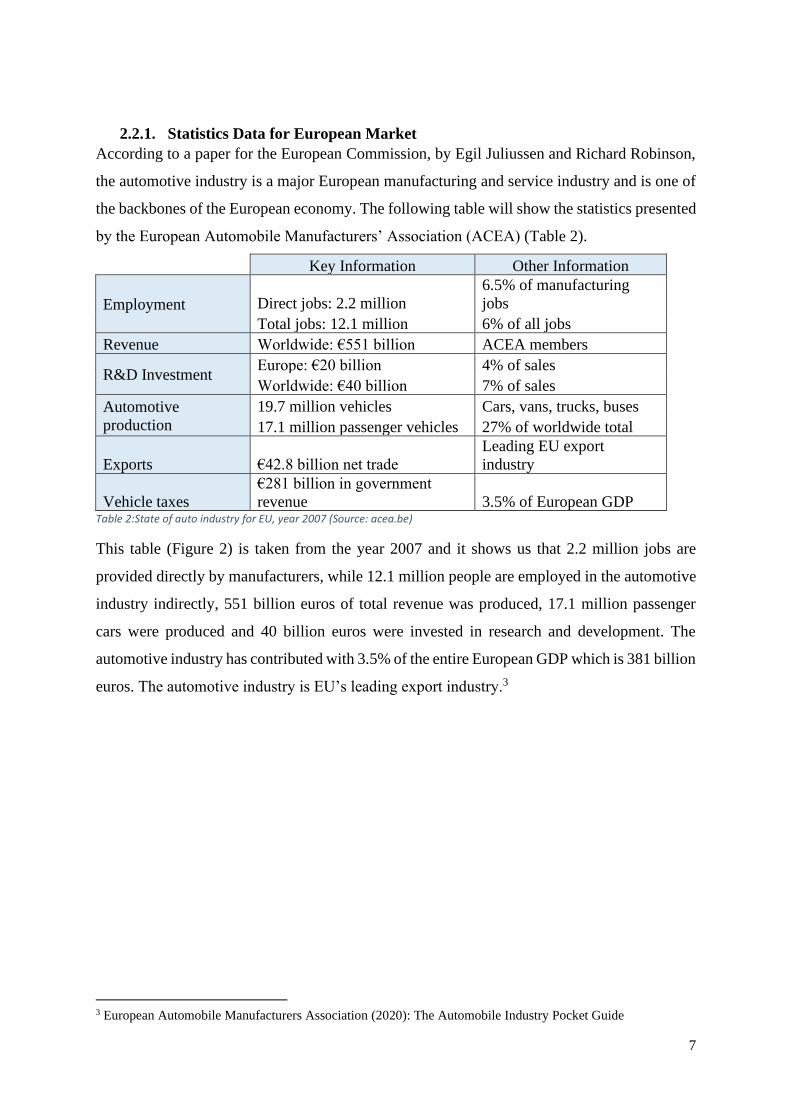
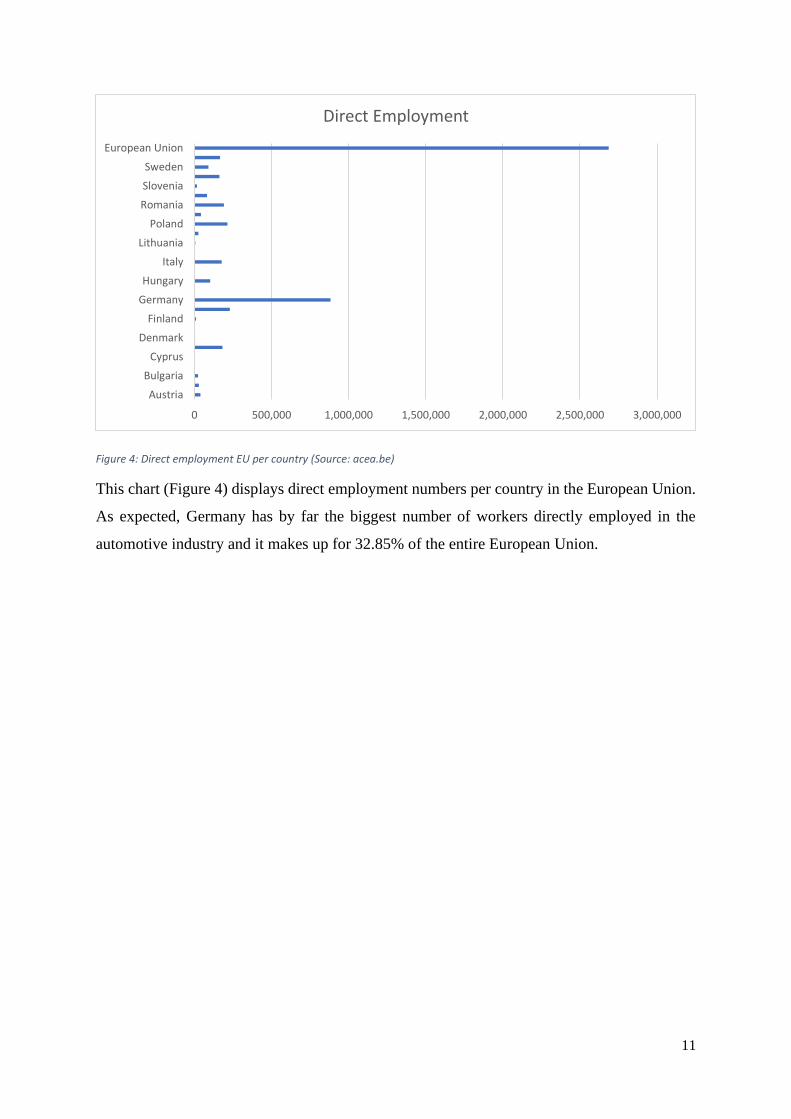
Figure 4: Direct employment EU per country (Source: acea.be)
This chart (Figure 4) displays direct employment numbers per country in the European Union.
As expected, Germany has by far the biggest number of workers directly employed in the
automotive industry and it makes up for 32.85% of the entire European Union.
0 500,000 1,000,000 1,500,000 2,000,000 2,500,000 3,000,000
Austria
Bulgaria
Cyprus
Denmark
Finland
Germany
Hungary
Italy
Lithuania
Poland
Romania
Slovenia
Sweden
European Union
Direct Employment

12
2.2.2. Statistics Data for Croatia
This subchapter will analyse the data provided by Centar za Vozila Hrvatska (CVH). The data
provided by them is for the year 2019. for the M1 category (passenger automobiles), as well as
some data taken off their official website. Here is a table (Table 7) containing the information
on every new registered passenger vehicle in Croatia in 2019. The first thing to point out here
is that the ten most popular car makes in Croatia are in order: Volkswagen, Renault, Opel,
Škoda, Peugeot, Dacia, Suzuki, Hyundai, Fiat and finally Toyota. The rest of car makes are
denoted in the “Other car makes total” row.
Car Make
Number
of
Vehicles
Average
Year of
Production
Average
Age
Average
CO2
Average
Purchase
Price
(HRK)
VOLKSWAGEN 8579 2018.98 0.02 117.36 176,234.61
RENAULT 6043 2018.86 0.14 117.26 123,849.10
OPEL 5801 2018.96 0.04 125.08 138,003.45
ŠKODA 5763 2018.99 0.01 118.01 168,864.04
PEUGEOT 3705 2018.86 0.14 109.72 152,057.60
DACIA 3687 2018.86 0.14 124.62 108,005.43
SUZUKI 3670 2018.89 0.11 123.26 124,956.99
HYUNDAI 3161 2018.65 0.35 121.53 126,466.41
FIAT 2687 2018.88 0.12 125.30 97,464.83
TOYOTA 2615 2018.84 0.16 100.79 149,422.60
OTHER CAR MAKES
TOTAL 18638 2018.79 0.21 125.05 221,685.39
TOTAL 64349 2018.87 0.13 120.51 165,323.48 Table 7: Registration of new vehicles 2019 (Source: CVH)
The first column denotes the make of the vehicle, second is the number of vehicles, third
denotes the average year of manufacture of that particular make, then there is the average age

13
(which is in this table very low since all the vehicles are new), after that there is the average
carbon-dioxide emissions and finally, average purchase price.
This graph (Figure 5) shows second row of the table, which is the quantity of registered vehicles
for every make. It can be observed that Volkswagen is the obvious leader on the Croatian
market. Volkswagen makes up for 13.33% of the total count of registered vehicles for 2019. If
the fact that Škoda is owned by the Volkswagen group is taken into account and added to the
count it would make up for 22.29% of all the vehicles. This is only in the top ten list, without
Audi, Seat and Porsche and some other less significant makes. A grand total of 64,349 new
vehicles have been registered in Croatia in 2019.
Figure 5: Number of new registered vehicles in 2019 (Source: CVH)
02000400060008000
100001200014000160001800020000
Number of Vehicles

14
This is a graph (Figure 6) illustrating the average purchase price of new vehicles for the year.
Volkswagen and Škoda are most prominent, but also most expensive on the list.
The column which represents the rest of car makes which don’t make it on the top ten list is
actually the highest regarding the price. This really makes sense since the more expensive
vehicles are purchased rarely. This is also the reason why there aren’t any big manufactures on
this list like BMW, Mercedes, Audi, Alfa Romeo etc. Those makes are among the more
expensive and luxurious.
The following graph (Figure 7) shows the average CO2 emissions for every car make. They
are all very much similar, with Toyota leading the top ten. This is because Toyota pushes
0.00
20.00
40.00
60.00
80.00
100.00
120.00
140.00
160.00
Average CO2
Figure 7: Average CO2 emissions 2019 (Source: CVH)
Figure 6: Average purchase price (HRK) (Source: CVH)
0.00
20,000.00
40,000.00
60,000.00
80,000.00
100,000.00
120,000.00
140,000.00
Average purchase price (HRK)
15
their hybrid and electric models as their major products and it is the business direction of the
company. Average age of new vehicles will not be represented in a graph because that
information isn’t particularly relevant.
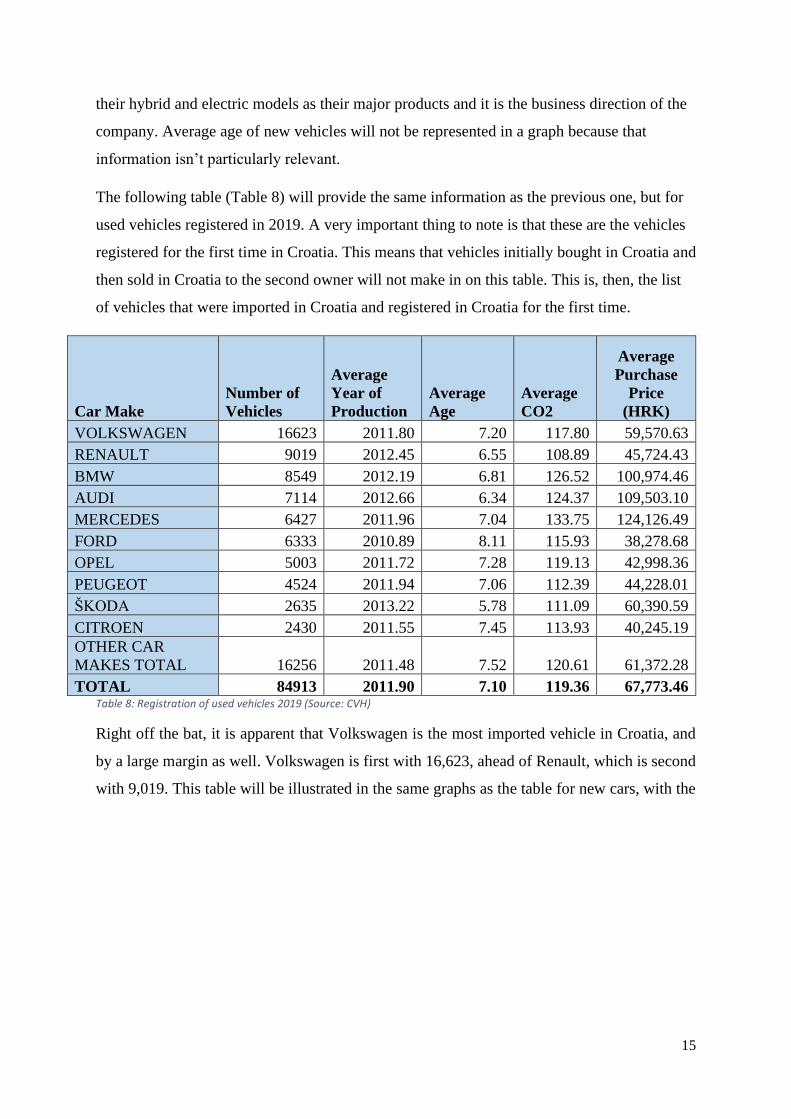
The following table (Table 8) will provide the same information as the previous one, but for
used vehicles registered in 2019. A very important thing to note is that these are the vehicles
registered for the first time in Croatia. This means that vehicles initially bought in Croatia and
then sold in Croatia to the second owner will not make in on this table. This is, then, the list
of vehicles that were imported in Croatia and registered in Croatia for the first time.
Car Make
Number of
Vehicles
Average
Year of
Production
Average
Age
Average
CO2
Average
Purchase
Price
(HRK)
VOLKSWAGEN 16623 2011.80 7.20 117.80 59,570.63
RENAULT 9019 2012.45 6.55 108.89 45,724.43
BMW 8549 2012.19 6.81 126.52 100,974.46
AUDI 7114 2012.66 6.34 124.37 109,503.10
MERCEDES 6427 2011.96 7.04 133.75 124,126.49
FORD 6333 2010.89 8.11 115.93 38,278.68
OPEL 5003 2011.72 7.28 119.13 42,998.36
PEUGEOT 4524 2011.94 7.06 112.39 44,228.01
ŠKODA 2635 2013.22 5.78 111.09 60,390.59
CITROEN 2430 2011.55 7.45 113.93 40,245.19
OTHER CAR
MAKES TOTAL 16256 2011.48 7.52 120.61 61,372.28
TOTAL 84913 2011.90 7.10 119.36 67,773.46 Table 8: Registration of used vehicles 2019 (Source: CVH)
Right off the bat, it is apparent that Volkswagen is the most imported vehicle in Croatia, and
by a large margin as well. Volkswagen is first with 16,623, ahead of Renault, which is second
with 9,019. This table will be illustrated in the same graphs as the table for new cars, with the

16
addition of a graph showing the average age for each make. This first graph (Figure 8) is
showing the number of vehicles imported and registered in 2019.
As it can be seen the car makes are lined up starting from the biggest number to the lowest and
cumulative rest of the makes at the end. Volkswagen is imported in such quantities that there
are actually more of them than all of the other makes that don’t make the top ten. There is a
couple of new ones here, as was expected, BMW, Audi and Mercedes are very popular makes
for import, but due to their high prices, they are not so popular in Croatian retail. Dacia, Fiat,
Toyota and Suzuki are apparently not very popular among consumers who decide to import
their vehicle.
Figure 8: Number of used registered vehicles in 2019 (Source: CVH)
02000400060008000
1000012000140001600018000
Number of Vehicles

17
The next graph (Figure 9) represents the average price for each make is presented.
As expected, Mercedes, BMW and Audi are the three most expensive car makes on the
import market, in that exact order. Mercedes is averaging 124,126 kn, which is more than
double than Volkswagens 59,570 kn.
0.00
20,000.00
40,000.00
60,000.00
80,000.00
100,000.00
120,000.00
140,000.00
Average purchase price (HRK)
Figure 9: Average price of used vehicles 2019 (Source: CVH)

18
On this graph (Figure 10) there is a comparison of average prices between new and used. Blue
colour shows all the new car makes and their respective prices, green shows the same makes,
but used and orange shows used cars that aren’t on the list of new cars. It can be observed, that
prices of used Mercedes’, with the average age of 7 years are more expensive, or same as brand
new Renaults, Dacias, Suzukis and Hyundais.
The next chart (Figure 11) represents the average age of used vehicles. Fords are oldest
followed by Citroen, Opel, Volkswagen and Mercedes, which is also the most expensive.
Figure 10: Average price comparison between used and new (Source:CVH)
Figure 11: Average age of used vehicles 2019 (Source: CVH)
0.00
50,000.00
100,000.00
150,000.00
200,000.00
250,000.00
Average Purchase Price (HRK)
0.001.002.003.004.005.006.007.008.009.00
Average age

19
The next chart (Figure 12) contains the average CO2 emissions per each make. Mercedes, as
the most expensive, has the highest CO2 emissions of all the vehicles.
2.2.3. Comparison and Discussion
While exploring the European statistics, it was discovered that fiscal income from motor
vehicles (from taxes) in 2019 was €440.4 billion. For comparison, here is a table (Table 9) for
all registered new and imported vehicles in Croatia for 2019:
New/Used
Number of Vehicles
Average Year of Production
Average Age
Average CO2
Average Purchase Price (HRK)
Used 84913 2011.90 7.10 119.36 67,773.46
New 64349 2018.87 0.13 120.51 165,323.48
TOTAL 149262 2014.91 4.09 119.85 109,828.68 Table 9: All registered vehicles summary 2019 (Source: CVH)
A total of 149,262 vehicles were registered averaging a price of 109,828.68 kn, which is around
16,393,656.63. That is €2,174,909.37. If it is taken into account that average Croatian taxes are
around 30%, this makes up for €652,251,272.81 of government fiscal income in 2019.
Furthermore, the European Union has 3.72% of electric vehicles, 9.43% hybrid vehicles and
3.05% plug-in hybrid vehicles.5 In 2019., in Croatia, 730 electric vehicles, 5,547 hybrid and
352 plug-in hybrid vehicles were registered. Electric vehicles make up for 0.49%, hybrids
3.72% and plug-in hybrids 0.24% of all vehicles. That is a total of 4.44%, which means that
5 Statistics provided by Centar za Vozila Hrvatska (2020)
0.00
20.00
40.00
60.00
80.00
100.00
120.00
140.00
160.00
Prosječni CO2
Figure 12: Average CO2 emissions on used cars 2019 (Source: CVH)

20
95.56% of all vehicles on Croatian roads are fuelled by either diesel of petrol.6 Compared to
Norway’s 20.29% of petrols and diesels, that is shameful number. That is mostly thanks to the
severe lack of government incentive and charging station infrastructure.
6 CVH https://www.cvh.hr/tehnicki-pregled/statistika/

21
3. Impact of ICT on Automotive Industry
3.1. Application of ICT in Automotive Industry
According to De Silva, Information and Communication Technology plays a crucial role in
creating opportunities for people in every walk of life. The integration if ICT in the automotive
industry has added an abundance of new developments. Modern day vehicles have become
safer, smarter, more efficient and more connected to the user than ever before.7This chapter
will explore some aspects of involvement of ICT in the automotive industry, ranging from ICT
usage in retail, manufacture to technological developments and safety improvements.
First thing to be talked about in this chapter is the lack of use of ICT in automobile retailers’
businesses in Croatia. Effective manipulation of big chunks of data in this day and age is
essential to running an effective business. Having workers with the appropriate know how for
manipulating big data can considerably increase sales and cut costs in even larger proportions.
Proper use of ICT to manipulate big data samples enables companies/platforms such as Netflix,
Amazon, YouTube and especially Facebook to tailor what they have in offer to match exactly
what each individual consumer wants. They have extremely advanced algorithms which
analyze consumer habits and tendencies in order to offer the user a product with the highest
likelihood of making an actual transaction. On the other hand, most automobile related web-
shops have very poorly designed websites with little effort put into user interface and more
importantly user experience. Let’s take for an example a configurator on an official website of
Volkswagen, as shown in Figure13.
7 Silva, E., P., M. (2014): Use of ICT in Automobile Industry
https://www.scribd.com/document/198789897/Use-of-ICT-in-Automobile-Industry

22
The reason for taking Volkswagen for an example is that it is the undisputed number one
company for new car sales and used car sales in Croatia, as will be shown in the following
chapters.
At the time of writing this thesis, if a consumer opens “Volkswagen Hrvatska” website and
enters the configurator option, chooses the Golf model as the most sold car model in Croatia
for the past 10+ years, they will be offered only two variants of equipment: “Life” and “Style”.
Upon picking the “Style” variant of equipment, the consumer is offered only two engine
options: a 1.5-liter, 150 horsepower petrol and a 2.0-liter 150 horsepower diesel engine, both
with a 7-speed dual-clutch automatic transmission. There is only one more option for a 6-speed
manual transmission available exclusively with the aforementioned petrol engine.8 This is an
absurdly narrow assortment of available options for their best-selling model.
This example of a lack of variety only goes to show how much room for improvement is
possible by applying some form of data mining. "We think the bigger opportunity in the auto
space is for folks to start to really look at individual, granular consumer data. Thanks to the
8 volskwagen.hr https://cc.porscheinformatik.com/cc-
hr/hr_HR_VW/V/auv/068?GrossNetSwitch=GROSS&variant=Style
Figure 13: Golf 8 variants (Source: Volkswagen Hrvatska):
23
likes of Amazon and Netflix, consumers have become accustomed to "uber-personalized
environments they go to a dealer's website and they have a completely static, non-personalized
experience." as put by Davin Daly, CEO of a car-dealer company in the US, for an article by
David Muller and Hannah Lutz. They proceed to explain that, smarter use of data can show
how online shoppers sorted search results pages and that systems can recognize which photos
of a vehicle were clicked on, or even that the shopper looked at an SUV with 65000 kilometers
and sought certain attributes such as four-wheel drive.9
The application of ICT in the automotive industry, apart from improving upon safety and
efficiency, has mainly made the largest contribution to the addition of sophisticated
functionalities and improving the user experience. Let’s talk for example about navigation.
When they were first introduced as a purely navigational tool, all GPS systems could really do
was, upon entering the destination and a starting point, map-out a route and provide the driver
with simple instructions. After years of development, modern navigation systems can do much
more. For example, today, people use navigation to get to destinations they have no trouble
finding themselves, even their everyday routes. They do this because these new systems can
identify the optimal travel routes based on a variety of factors like traffic density at a given
time, user’s preference to paying tolls or needs for gas stations, supermarkets, hotels etc. In
some areas they even have fixed police radars and speed bumps mapped in. Modern GPS
systems can also keep a record of driving activity, including the address of each destination,
names of streets travelled to and how long the vehicle remained at each location which can
assist the user in tracking the use of the vehicle, if it’s used as a company pool vehicle.6
Although the current state of the industry may be far from vehicle autonomy, which will be
explored further in an upcoming chapter, there are some aspects of vehicle autonomy being
used right now. There are some high-end, luxurious models of Volvo, Audi, BMW, Tesla,
Lexus etc., which can locate and identify an empty parking spot, add throttle, brake and steer
into the spot, all on their own. They do this using existing parking sensors and cameras. Some
cars like the BMW 7 series and Hyundai Sonata have a special key fob, which enables the user
to get out of the car and wait for it to park in, or leave the parking space, without the driver
9 D. Muller, H. Lutz (June 02, 2019): Data turns dealers into mind readers https://www.autonews.com/shift/data-
turns-dealers-mind-readers

24
even being in the vehicle. Tesla even went one step further and introduced a function which
enables the owner to summon his car within the 60-meter radius.10
Now let’s talk about safety. Safety has become a major factor in automotive industry of late,
as the technology advances. There is a vast variety of safety improvements introduced into the
modern car that elevate the quality of human life by reducing the risks a driver is exposing
himself and others to.6 Adaptive cruise control, also known as active cruise control and
intelligent cruise control, might be regarded as a quality of life improvement, but it is much
more of a safety improvement. It is a system designed to enable vehicles to maintain a safe
following distance and stay within the speed limit all on its own. ACC works by using sensory
technology installed on the vehicle like cameras, lasers and radar equipment, which creates an
idea of how close one vehicle is to another, or other objects on the road. This system can
maintain constant speed and keep its distance by adding throttle and reducing it, however when
there is a sudden change of speed of the vehicle in front the system will issue a warning for the
driver to brake hard.11 Some systems will even brake on their own if there is an object in the
way, as long as the moving speed is below 60 km/h.
Each year, a number of accidents on the road happen due to people driving tired and falling
asleep. Many car manufacturers have introduced sleep-prevention systems into their cars.
These systems can detect if the driver is sleepy based on two different inputs. There are a
number of metrics like deviations from lane position, movement of the steering wheel, pressure
on the acceleration pedal, which are constantly monitored and if a certain change threshold is
reached the systems recognises it as increased probability that the driver is sleepy. Furthermore,
the system can monitor the behaviour of the driver such as yawning, eye closure, increase in
blinking frequency, head tilt etc. The system will alert the driver if any of those symptoms are
noticed. Some studies are also being made on the correlation between physiological signals
using electrocardiogram (ECG), electrooculogram (EOG), electroencephalogram (EEG) and
electromyogram (EMG) and the driver’s sleepiness. 12
10 Brady, D. (2020): Self-Parking Cars Explained: How Does Automatic Park Assist Work?
https://www.motortrend.com/news/self-parking-cars-explained/ 11 Car and Driver Research, (2020): What Is Adaptive Cruise Control?
https://www.caranddriver.com/research/a32813983/adaptive-cruise-control/ 12 Sahayadhas, A., Sanduraj, K., Murugappan, M. (2012): Detecting Drowsiness Based on Sensors: A Review
https://www.ncbi.nlm.nih.gov/pmc/articles/PMC3571819/

25
There are many more systems that can detect pedestrians or weather conditions like icy roads
or fog, tracking of the vehicle in case it gets stolen and so on. It is also important to note that
with the development of technology, on-board computer can detect more malfunctions.
3.2. Advantages and Disadvantages of ICT Impact on Automotive Industry
This chapter will explore some major benefits that ICT brought to the modern vehicle and the
industry as a whole, as well as some drawbacks that come in hand. There are of course more
advantages as technology keeps developing, but with everything good comes a little bit of bad.
The application of ICT in automobile manufacturing brings about advantages in several aspects
such as general quality of life improvements, safety improvements, efficiency, availability of
information and data and reducing the negative effects on the environment. New cars come
with an option of a “virtual cockpit”, which basically means that they replace the old analogue
instrument cluster with an LCD screen where the owner can arrange what is displayed based
on his needs. The owner can choose to display the speedometer and the engine-rev meter with
some data on fuel consumption in the middle, or only have the speedometer and a large GPS
map covering the rest of the screen. In the last chapter, some safety systems have already been
mentioned, such as emergency braking, pedestrian detection, weather monitoring, sleep
prevention and so on. Furthermore, the use of new and improved chips and on-board computers
allows the manufacturers to enable vehicles to calculate the optimal quantity of fuel gets
pumped and at which pressure the turbine pumps the air into the cylinders. These on-board
computers can measure exact fuel consumption at any moment, but they are also fitted with
algorithms that instruct drivers how to optimally drive in order to obtain more efficiency. There
is some general quality of life improvement, like keyless cars with which the owner never even
has to take the key out of his pocket or bag. They can lock and unlock the car by just touching
the door handle and turn the engine on and off by pressing a button in the car itself. Smart LED
headlights which can recognise other vehicles coming ahead and regulate low beam and high
beam lighting. They have a grid-like layout of strong LEDs which can individually turn on and
off in order to keep maximum visibility for the driver and at the same time not obstruct other
driver’s vision.
Many car manufacturers sell little USB like data plugs which can be connected to the on-board
computers and to the owner mobile phone, which lets them keep track of important information
like the location of the vehicle, tyre change, oil change, crucial information about trips
completed. Some people tend to forget where they parked their car, these data plugs can
precisely show them where the vehicle is located at any time. It has become very common for

26
vehicles to have parking sensors, cameras and park assist software. Almost all new cars are
equipped with the start-stop system which turns of the engine whenever the vehicle comes to a
halt and in turn reduces fuel consumption by decent margins.
However, fitting cars with an abundance of electronics comes with some drawbacks as well.
Each new model that comes out is equipped with more ICT systems and features, but cars are
getting more expensive because of that. The manufacturing costs are increasing, wholesale
prices and retail prices will only keep increasing as a consequence. Furthermore, the more
systems are equipped and the more complex they get, it opens up for more potential
malfunctions and failures. The malfunctions will only get more expensive to fix since the part
are getting more expensive themselves. The knowledge required to be a car mechanic for these
evolving vehicles will keep increasing, which will lead to more expensive services and
maintenance itself. Moreover, the more new, flashy features are available to the driver, the
more the driver will be focused on the and distracted from the road. There are of course the
aforementioned safety features which should hedge these risks, but they also make drivers more
reliant on technology and gradually lower their attention and a careful state of mind. Another
issue that can be brought up is the question of security, not just safety. With all the new systems,
some of which are connected to the internet, people with malicious intent have an opportunity
to hack into the system.
27
3.3. Future Trends of ICT Usage in the Automotive Industry
3.3.1. Electric Vehicles
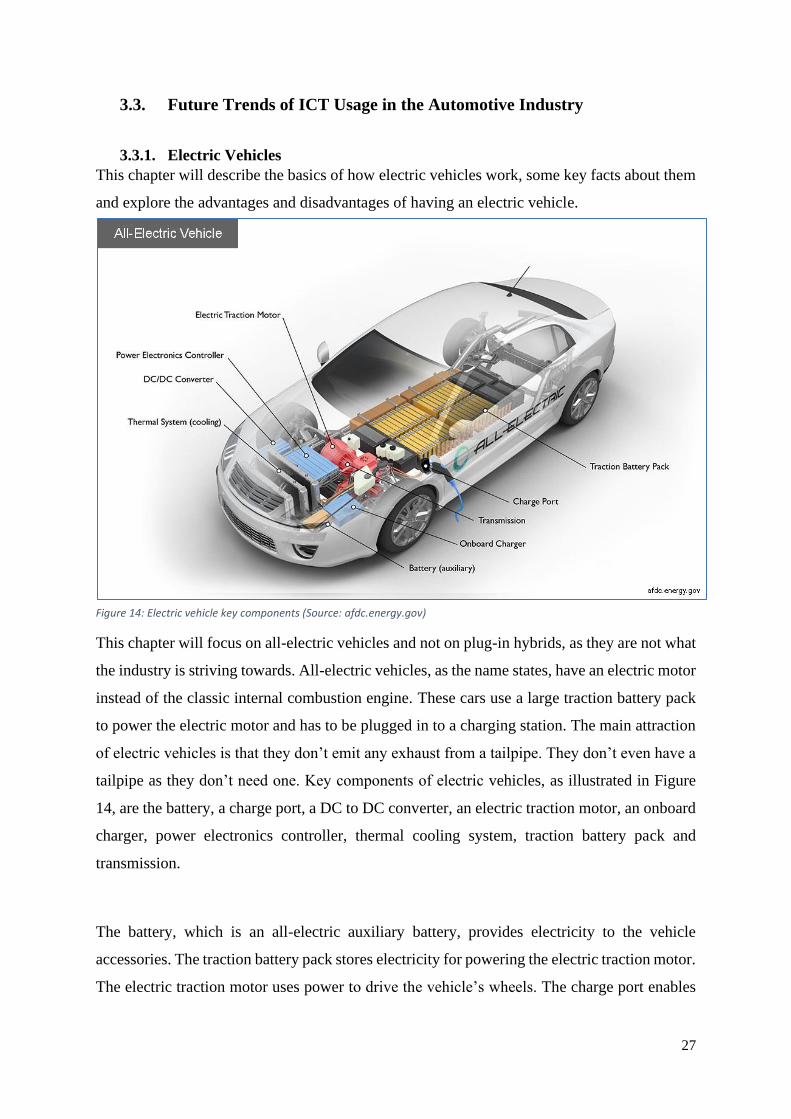
This chapter will describe the basics of how electric vehicles work, some key facts about them
and explore the advantages and disadvantages of having an electric vehicle.
This chapter will focus on all-electric vehicles and not on plug-in hybrids, as they are not what
the industry is striving towards. All-electric vehicles, as the name states, have an electric motor
instead of the classic internal combustion engine. These cars use a large traction battery pack
to power the electric motor and has to be plugged in to a charging station. The main attraction
of electric vehicles is that they don’t emit any exhaust from a tailpipe. They don’t even have a
tailpipe as they don’t need one. Key components of electric vehicles, as illustrated in Figure
14, are the battery, a charge port, a DC to DC converter, an electric traction motor, an onboard
charger, power electronics controller, thermal cooling system, traction battery pack and
transmission.
The battery, which is an all-electric auxiliary battery, provides electricity to the vehicle
accessories. The traction battery pack stores electricity for powering the electric traction motor.
The electric traction motor uses power to drive the vehicle’s wheels. The charge port enables
Figure 14: Electric vehicle key components (Source: afdc.energy.gov)

28
the owner to connect to an external power source so they can charge traction battery pack. The
DC to DC converter converts higher-voltage DC (direct current) power from the traction
battery pack to the lower-voltage DC power needed to run the vehicle accessories and recharge
the auxiliar battery. An onboard charger takes the incoming AC (alternating current) electricity
supplied through the charge port and converts it to DC power for charging the traction battery.
It also monitors battery characteristics like voltage, current, temperature and state of charge.
Power electronics controller manages the flow of electrical energy delivered by the traction
battery, controlling the speed of the electric traction motor and the torque it produces. Thermal
cooling system maintains a proper operating temperature range of the engine, electric motor,
power electronics and some other components. Finally, the transmission transfers mechanical
power from the electric traction motor to drive the wheels.13
Let’s take the Tesla Model 3 for an example. Its price tag for the Slovenian market (as it is not
yet available in Croatia) starts from around €45,000 and €55,000 for the long-range option. The
long-range version can travel at best 409 kilometres. It can get from 0 to 100 km/h in 5.6
seconds and travel at the maximum speed of 225 km/h.14 In order to recharge the battery, the
owner will have to wait for 7 hours and 45 minutes at a Type 2 charge port. If the owner can
find a fast-charging point, they can manage it in 22 minutes. Tesla Model 3 comes with rear
wheel drive, however there is an option for 4-wheel drive. It has a five-star Euro NCAP safety
rating. If the owner has no other choice and has to charge his Tesla Model 3 from a wall plug,
it will take them 37 hours for a full charge. Only type of charger that wasn’t mentioned is the
Type 1 charger, at which the owner will have to wait 12 hours.15 Most other electric vehicles
will only be able to travel anywhere between 250 km to 350 km.
It is important to mention the most notable advantages of electric vehicles. First and foremost,
they don’t run on gas and therefore the owner doesn’t have to pay expensive prices of petrol or
diesel. Another very obvious reason is not leaving negative effects on the environment and
running on a renewable power source. Electric vehicles are in some aspect less expensive for
maintenance and should have failures less frequently. For example, as electric vehicles don’t
have internal combustion engines with pistons and other moving parts, they do not require
13 Energy Efficiency & Renewable Energy, U.S. Department of Energy: How Do All-Electric Cars Work?
https://afdc.energy.gov/vehicles/how-do-all-electric-cars-work 14 Tesla.com https://www.tesla.com/sl_SI/model3/design?redirect=no#battery 15 Electric Vehicle Database: Tesla Model 3 Long Range Dual Motor https://ev-database.org/car/1138/Tesla-
Model-3-Long-Range-Dual-Motor

29
motor oil. So, owners will save up some money on oil changes. In most countries, Croatia being
one of them, there are available tax credits for owner or the buyer can receive subsidy for
purchasing one. The Croatian government offers 70,000kn for a fully electric vehicle and
35,000kn for a hybrid vehicle. In most countries public charging spots for electric vehicles
offer free electricity. Some countries even have special lanes on motorways and highways for
electric vehicles. Furthermore, electric vehicles make almost no noise compared to gas
powered vehicles, especially diesels.
Electric vehicles do have their drawbacks. For example, the most notable problem with electric
vehicles is the fact that most of them can’t travel more than 350 kilometres with one charge.
There are some exceptions, like Tesla Model S Long-Range, which can travel for 515
kilometres on one charge at best. That is till significantly less than an entry level Volkswagen
Polo. Other cars in the category of a Tesla Model S can travel 1000 kilometres on one tank of
gas. Still, to the owner, gas is infinitely more expensive than electricity. Moreover, owners of
electric cars will find it troublesome to find charging stations in most parts of Europe. Croatia
currently has 117 charging stations across the entire country. 58 of those are Tesla supercharger
stations. The following two figures (Figure 15 and Figure 16) present the charging stations
located in Croatia. There are 117 charging stations altogether, with 247 connectors. Zagreb
has 15 charging stations, none of them are superchargers. Most of them are located around the
Zagreb area and along the coastline.
Figure 15: Charging stations for electric vehicles in Croatia (Source: electromaps.com)

30
Here are the charging stations mapped out. 16
Figure 16: Map of charging stations for electric vehicles in Croatia (Source: electromaps.com)
Electric vehicles are more expensive to buy in the first place. Let’s take for an example the
Golf. Basic Golf 8 with a 2.0 litre diesel engine, as shown in a previous chapter will cost around
180,000-200,000kn, while their electric model ID.3 starts at 297,000kn.7 That’s a large price
gap. Electric vehicle will likely need a change of battery in their life span, which can turn out
to be very expensive.
Let’s loosely estimate how long will it take for the owner of an electric vehicle to break even.
The price difference between the ID.3 and the Golf is approximately 100,000kn. If the buyer
is lucky and is granted the government subsidy of 70,000 kn, that difference then becomes
30,000. Volkswagen claim their new Golf consumes 3,4-4,9 litres of diesel per 100 kilometres.
It is well known that those numbers are very hopeful and ambitious. Let’s assume that it will
consume 6 litres per 100 kilometres in city traffic. An average Croat will travel 15,000 km in
one year, thus consuming around 900 litres of diesel. At current prices 1 litre of diesel costs
around 9 kn, which means an average car owner will pay around 8,100 kn for fuel each year.
It can therefore be estimated that it would take around 4 years for an average driver to break
even on gas expenses alone, if the government subsidy is included. Without the subsidy, it
would take a little over 12 years.
16 Electromaps: Charging stations in Croatia https://www.electromaps.com/en/charging-stations/croatia
31
3.3.2. Autonomous Vehicles
Once, it was a thing of science-fiction to imagine cars driving themselves. Today, it’s just a
matter of some final touches. This may have been a slight over exaggeration, but the last 5-10
years, technology has made a giant leap towards full vehicle autonomy. All the needed
technology is already here, the only remaining challenges are perfecting the artificial
intelligence used by these cars, their machine learning capabilities and last but definitely not
least, rules, regulations and social acceptability. Firstly, the terminology has to be cleared up.
This chapter will focus on full vehicle autonomy, which refers to vehicles that are not only
automated, but can make their own rational decisions and correct their own mistakes.
According to Scott Totman, the easiest way to distinguish autonomous from automated is by
the amount of adapting, learning and decision-making capabilities of the system. Automated
systems usually only function within a pre-defined set of rules and routines and have one or a
few set tasks. All the manoeuvres, “decisions” and actions an automated system makes are pre-
determined by a set of rules and software code.
However, an autonomous system is designed to constantly learn, evolve and adapt to new and
dynamic environments full of unknown factors. Autonomous systems, thanks to AI and
machine learning, will gain experience just like humans and constantly improve upon decision
making within its programmed boundaries and rules.17
It is important to have a general understanding of how autonomous vehicles work and what
technology they use. They are fitted with cameras, radars, LiDAR sensors, various on-board
computers and many other sensors. The hardware fitted on these vehicles has stayed pretty
much the same for a number of years; it’s actually the software that was mentioned above that
is in need of constant change and improvement. Elon Musk actually claimed that cameras are
the only piece of hardware needed for achieving vehicle autonomy, once the algorithms can
fully comprehend the images received and act upon them. Teslas, for example, have eight
external cameras. The next step is to develop an algorithm that can take the feed from the
cameras and translate it to a 3D environment. Radar is a radio wave-based sensor which is
utilized to measure the distance of other objects. The main advantage of the radar is that it isn’t
obstructed by weather conditions such as heavy fog, snow, rain etc. LiDAR are sensors with a
similar purpose to radar; they emit light and use the feedback to generate a highly-detailed 3D
17 Matteson, S., Tech Republic (2019.): Autonomous vs automated: What each means and why it matters
https://www.techrepublic.com/article/autonomous-versus-automated-what-each-means-and-why-it-matters/

32
map of its surroundings. Other hardware includes more sensors like GPS, a gyroscope,
ultrasonic sensors, inertial sensors and computing power in the form of processors, graphics
cards and neural network accelerator chips introduced by Tesla. 18
The software then comes in and processes the inputs acquired from the previously mentioned
hardware, plots a path and sends instructions to the vehicle’s actuators, which control
acceleration, braking and steering. There are some hard-coded rules like obstacle avoiding
algorithms, predictive modelling and smart object discrimination (algorithm used to
differentiate bicycles and motorcycles for example), which aim the software to follow traffic
rules and navigate obstacles.
Next thing to get into are layers of driving autonomy. There are 6 layers of autonomy and this
next part will explain them. Level 1 is also called Driver Assistance, Level 2 – Partial
Automation, Level 3 – Conditional Automation, Level 4 – High Automation and Level 5 –
Complete Automation. 19At level 0, all motoric and other major systems are operated by
humans. That would, for example, be a plain Fiat Punto from 1999. At level 1, some systems
like cruise control, automatic braking are introduced. At level 2, the vehicle can manage at least
two simultaneous automated functions, like steering and acceleration. This requires human
involvement for safety. An example for this is adaptive cruise control. At level 3, the vehicle
can manage all safety-critical functions under some conditions, but it requires the driver to be
present to take over control when alerted. Level 4 autonomous vehicles can operate entirely on
their own, but in limited scenarios. Level 5 autonomy vehicles are completely capable of
driving in any conditions and scenarios.20
18 English, T. (2020.): How Do Self-Driving Cars Work? https://interestingengineering.com/how-do-self-driving-
cars-work 19 Harner, I. (2020): the 5 Autonomous Driving Levels Explained https://www.iotforall.com/5-autonomous-
driving-levels-explained/ 20 Union of Concerned Scientists (2017): Self-Driving Cars Explained https://www.ucsusa.org/resources/self-
driving-cars-101
33
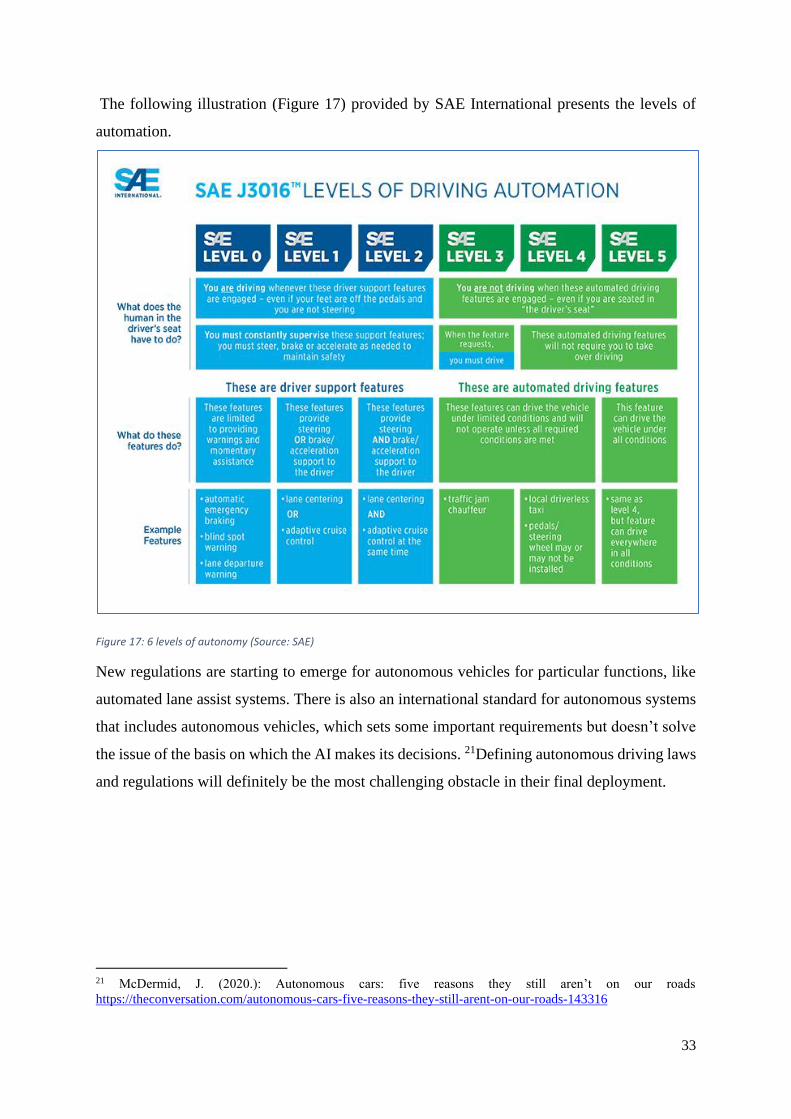
The following illustration (Figure 17) provided by SAE International presents the levels of
automation.
Figure 17: 6 levels of autonomy (Source: SAE)
New regulations are starting to emerge for autonomous vehicles for particular functions, like
automated lane assist systems. There is also an international standard for autonomous systems
that includes autonomous vehicles, which sets some important requirements but doesn’t solve
the issue of the basis on which the AI makes its decisions. 21Defining autonomous driving laws
and regulations will definitely be the most challenging obstacle in their final deployment.
21 McDermid, J. (2020.): Autonomous cars: five reasons they still aren’t on our roads
https://theconversation.com/autonomous-cars-five-reasons-they-still-arent-on-our-roads-143316

34
3.3.3. Application of “Internet of Things” in Automotive Industry
Internet of Things opens up the industry for transformational change. IoT related technologies
will mark the path for the future of the automotive industry and interconnected vehicles will
play a huge role on the roads and in the economy of the future.22 It has become apparent that
information has become a resource much more valuable than gold or oil.
As explained by Margaret Rouse, the Internet of Things, or IoT, is a system of interrelated
computing devices, mechanical and digital machines, objects, animals or people that are
provided with unique identifiers (UIDs) and the ability to transfer data over a network without
requiring human-to-human or human-to-computer interaction. A “thing” in the Internet of
Things can be a person with a pacemaker, a farm pig with a biochip transponder, a car with
built in sensors or any object that can be assigned an IP address. The following figure (Figure
18) is a simplified illustration of how an IoT ecosystem works.23
22 Ninan, S., Gangula, B., von Alten, M., Sniderman, B., Deloitte University Press: Who owns the road? The IoT-
connected car of today—and tomorrow 23 Rouse, M. (2020): internet of things (IoT) https://internetofthingsagenda.techtarget.com/definition/Internet-of-
Things-IoT
Figure 18: Example of an IoT system (Source:Internet of Things Agenda)
35
The term IoT is most often used for objects that don’t usually have an internet connection, and
can communicate with the network without human interaction.24
With the application of IoT in the vehicles, there are several major aspects in which it will
reshape the industry. If the previous chapter is taken into account, implementing IoT into
already autonomous vehicle could mean a great deal in reducing highly congested traffic. The
vehicles could communicate to each other and process the data about locations of other units
and their planned routes, in order to create their own optimal routes and in turn balancing the
traffic on city streets. With a proper analysis of the data gathered by all participants on city
streets, conclusions can be made on where the major bottlenecks are, which intersections are
problematic. Removing these issues would drastically reduce pollution, energy expenditures
and unwanted emissions. Implementing IoT would also lead to better road conditions. This can
be achieved with vehicles transmitting information about road maintenance needs to the cloud
where it can be mined for data. 25
24 Ranger, S. (2020): What is the IoT? Everything you need to know about the Internet of Things right now
https://www.zdnet.com/article/what-is-the-internet-of-things-everything-you-need-to-know-about-the-iot-right-
now/ 25 Grayson, P. (2019.): Big Ways IoT is Transforming the Automotive Industry https://futureiot.tech/5-big-ways-
iot-is-transforming-the-automotive-industry/

36
4. Analysis of Research Results regarding ICT Usage in
Automotive Industry
4.1. Research Methodology
Research method used in the following part of this thesis is an online survey made through
Google Forms. An online survey is among the most used data-collection sources. It is a set of
questions sent out via mediums like email, social media, websites, to a target group of
respondents. The respondent’s answers are saved and the data is available for further analysis.
Online surveys are popular because they are very intuitive, mostly free, much more accessible
and much simpler than traditional survey. 26Since the feedback is received in a digital format,
data processing is very easy and straightforward. This method is a quantitative research
method. The goal of this method is to collect numerical data from the group of respondents in
order to gain insight into the state of Croatian automotive industry and respondents’ opinions
on ICT in modern vehicles.27 This particular survey is made up of 30 questions divided into 4
sections. The first section is made up of questions regarding the respondent’s demographics
and personal information. The second section represents general information about the
respondent’s vehicle. The third section inquires about the respondent’s preferences regarding
ICT features in vehicles. Finally, the fourth section is about respondent’s opinions and
viewpoints regarding modern or future ICT systems. Most of the questions are in the multiple-
choice format with the purpose of keeping it straightforward; a couple of questions require a
short answer. The objective of this survey is to gain insight into respondent’s opinions,
preferences and standpoints on modern technology in the automotive industry and to learn
about key information about their personal vehicle and how it compares to previous
investigation of data. The survey was completed by 32 participants.
26 QuestionPro: Online Surveys: Definition, Characteristics, Examples, Advantages and Disadvantages
https://www.questionpro.com/blog/what-are-online-surveys/ 27 Bhatia, M. (2018.): A Complete Guide to Quantitative Research Methods
https://humansofdata.atlan.com/2018/06/quantitative-research-methods/

37
4.2. Research Results
The following table (Table 10) contains the first section of questions and their respective
answers.
Age
Group Gender
Type of
education Type of employment
What is your monthly income
(HRK)
18-25 M M.A.
Permanent
employment 15,000-20,000
18-25 M B.A. Unemployed 0
18-25 M B.A. Student contract 3,000-5,999
26-30 M A.A. Student contract 0-2,999
41-50 M M.A.
Permanent
employment 15,000-20,000
18-25 M M.A. Unemployed 0-2,999
18-25 M M.A.
Permanent
employment 6,000-9999
18-25 F A.A. Unemployed 0-2,999
18-25 M A.A.
Permanent
employment 6,000-9999
26-30 M M.A.
Permanent
employment 10,000-14,000
18-25 M B.A. Student contract 3,000-5,999
18-25 M B.A.
Permanent
employment 15,000-20,000
26-30 M M.A.
Permanent
employment 10,000-14,000
18-25 F A.A. Unemployed 0-2,999
18-25 M B.A. Student contract 3,000-5,999
18-25 M B.A.
Permanent
employment 6,000-9999
18-25 F B.A. Unemployed 0-2,999
31-40 M A.A.
Permanent
employment 15,000-20,000
18-25 M B.A.
Permanent
employment 6,000-9999
18-25 M B.A.
Permanent
employment 6,000-9999
18-25 M A.A.
Permanent
employment 3,000-5,999
18-25 F M.A. Temporary contract 6,000-9999

38
26-30 F M.A. Student contract 0-2,999
18-25 F M.A. Unemployed 0-2,999
18-25 F B.A. Unemployed 0-2,999
26-30 F M.A.
Permanent
employment 6,000-9999
31-40 M A.A. Unemployed 6,000-9999
26-30 F B.A.
Permanent
employment 15,000-20,000
26-30 F M.A.
Permanent
employment 6,000-9999
26-30 F M.A. Temporary contract 6,000-9999
26-30 M M.A. Temporary contract 6,000-9999
18-25 Ž B.A. Student contract 3,000-5,999
26-30 M M.A.
Permanent
employment 10,000-14,000
18-25 M B.A. Temporary contract 6,000-9999 Table 10: Demographics section (Source: Author’s research)

39
In the first question it can be observed that the majority of participants – 59.4%, are between
18 and 25 years old. This is expected as this survey was distributed mostly to friends and
colleagues. Out of the 32 participants, 31.3% of them are 26-30 years old. (Figure 19)
Out of 32 participants, 20 of them are male and 12 are female. (Figure 20)
Figure 19: Age groups of participants (Source: Author’s research)
Figure 20: Gender of participants (Source: Author’s research)
Age group
Gender
M
F

40
Thirteen participants have a master’s degree, twelve have a bachelor’s degree and the
remaining seven currently are high school graduates. (Figure 21)
14 participants are permanently employed, 4 are on a limited contract, 6 of them work as
students and 8 are currently unemployed. (Figure 22)
Figure 21: Education of participants (Source: Author’s research)
Figure 22: Employment type of participants (Source: Author’s research)
Type of education
A.A.
B.A.
M.A.
Type of employment
Permanent employment
Temporary employment
Student contract
Unemployed

41
This chart (Figure 23) shows us the approximate monthly net incomes of participants. This data
is important for comparison with the average price of a vehicle in Croatia, and more importantly
with the prices of vehicles of survey participants. 34.4% have a monthly net income of 6,000-
7000kn, which matches the national average monthly net income. 25% of participants make
less than 3,000kn, which matches the number of participants working on a student contract.
9.4% make 10,000-14,000kn, 12.5% make 15,000-20,000kn and one participant doesn’t have
any income.
Figure 19: Monthly incomes of participants (Source: Author’s research)
What is your monthly income

42
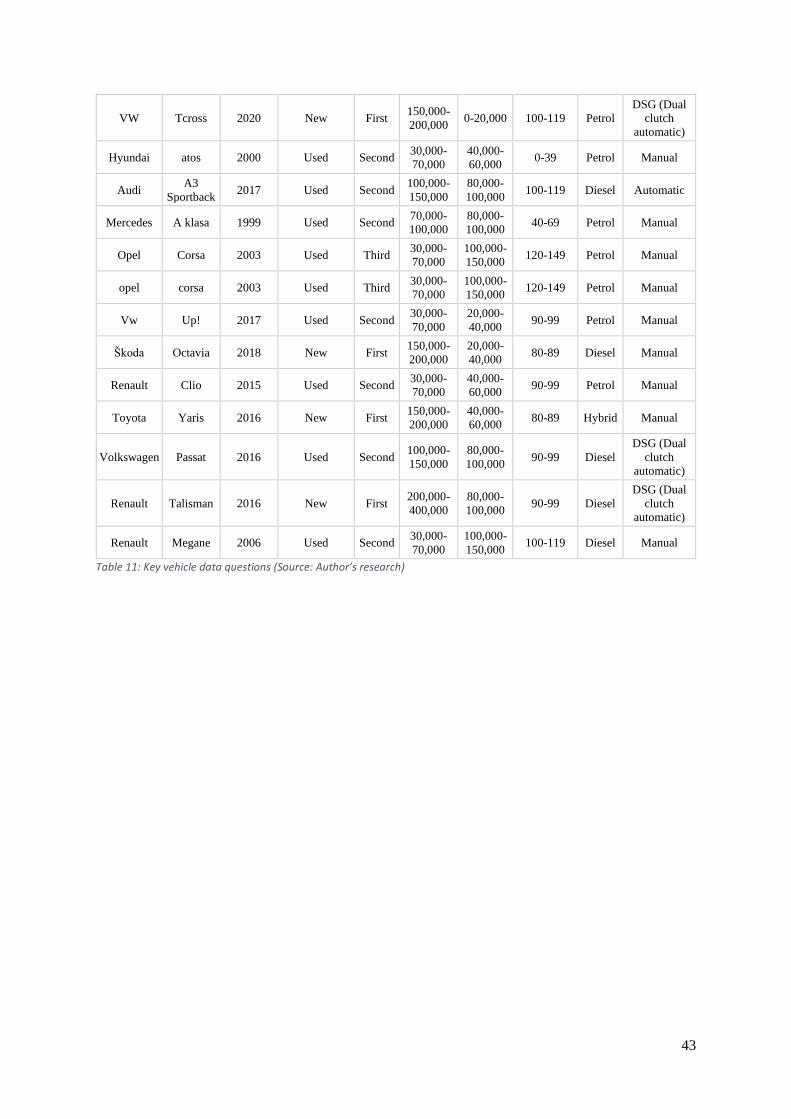
The following table (Table 11) shows the second section of questions with their answers,
regarding the general information about participants' vehicles.
Car brand Car model Year of
production
Was the car
purchased
used or new?
Which
owner
are
you?
What was
the
purchase
price of
the car
(HRK)
What is
the total
mileage?
(km)
What are
the CO2
emissions?
(g/km)
Which
type of
fuel is
used?
Which type
of
transimssion
is used?
K J 2000 New First 200,000-
400,000
200,000-
300,000 70-79 Diesel Manual
Audi A4 2002 New Second 150,000-
200,000
200,000-
300,000 120-149 Diesel Manual
Fiat Punto 1997 Used Third 30,000-
70,000
150,000-
200,000 100-119 Petrol Manual
Mercedes GLA 2015 New First 200,000-
400,000
100,000-
150,000 90-99 Diesel Automatic
Škoda Superb 2020 New First 200,000-
400,000 0-20,000 90-99 Diesel
DSG (Dual
clutch
automatic)
Suzuki sx4 2006 New Second 30,000-
70,000
60,000-
80,000 70-79 Petrol Manual
Volkswagen Polo 1.4 2001 New Second 100,000-
150,000
100,000-
150,000 150-179 Petrol Manual
Volkswagen Polo 2018 Used Second 70,000-
100,000 0-20,000 80-89 Diesel Manual
Mazda 3 2011 Used Third 30,000-
70,000
100,000-
150,000 100-119 Diesel Manual
VW Polo 2015 Used Second 30,000-
70,000
40,000-
60,000 70-79 Diesel Manual
Renault Megan 2007 Used Third 30,000-
70,000
200,000-
300,000 90-99 Diesel Manual
Renault Thalia 2002 New Second 30,000-
70,000
150,000-
200,000 100-119 Petrol Manual
Volkswagen Golf 2015 Used Second 100,000-
150,000
40,000-
60,000 0-39 Hybrid
DSG (Dual
clutch
automatic)
Nissan Juke
Juke, 1.0
DCT
TEKNA
2020 New Second 200,000-
400,000 0-20,000 100-119 Petrol Automatic
Audi A3 2016 Used Second 100,000-
150,000
60,000-
80,000 90-99 Diesel
DSG (Dual
clutch
automatic)
Golf 7 2015 New First 100,000-
150,000
60,000-
80,000 80-89 Diesel Manual
Mercedes A klasa 1999 Used Second 70,000-
100,000
80,000-
100,000 40-69 Petrol Manual
opel astra 2009 Used Third 30,000-
70,000
200,000-
300,000 70-79 Petrol Manual
Peugeot 308 2019 New First 100,000-
150,000 0-20,000 70-79 Diesel Manual
Volkswagen Golf 2015 New First 100,000-
150,000
60,000-
80,000 80-89 Diesel Manual
Renault Clio 2016 Used Second 70,000-
100,000
60,000-
80,000 80-89 Petrol Manual
43
VW Tcross 2020 New First 150,000-
200,000 0-20,000 100-119 Petrol
DSG (Dual
clutch
automatic)
Hyundai atos 2000 Used Second 30,000-
70,000
40,000-
60,000 0-39 Petrol Manual
Audi A3
Sportback 2017 Used Second
100,000-
150,000
80,000-
100,000 100-119 Diesel Automatic
Mercedes A klasa 1999 Used Second 70,000-
100,000
80,000-
100,000 40-69 Petrol Manual
Opel Corsa 2003 Used Third 30,000-
70,000
100,000-
150,000 120-149 Petrol Manual
opel corsa 2003 Used Third 30,000-
70,000
100,000-
150,000 120-149 Petrol Manual
Vw Up! 2017 Used Second 30,000-
70,000
20,000-
40,000 90-99 Petrol Manual
Škoda Octavia 2018 New First 150,000-
200,000
20,000-
40,000 80-89 Diesel Manual
Renault Clio 2015 Used Second 30,000-
70,000
40,000-
60,000 90-99 Petrol Manual
Toyota Yaris 2016 New First 150,000-
200,000
40,000-
60,000 80-89 Hybrid Manual
Volkswagen Passat 2016 Used Second 100,000-
150,000
80,000-
100,000 90-99 Diesel
DSG (Dual
clutch
automatic)
Renault Talisman 2016 New First 200,000-
400,000
80,000-
100,000 90-99 Diesel
DSG (Dual
clutch
automatic)
Renault Megane 2006 Used Second 30,000-
70,000
100,000-
150,000 100-119 Diesel Manual
Table 11: Key vehicle data questions (Source: Author’s research)

44
Figure 24 illustrates the participants’ vehicles by their brand.
As expected, Volkswagen takes first place for the highest number of vehicles – 8. Following
that, Renault with 7, Mercedes,Audi and Opel with 3. There are two Škodas and one of each
following: Fiat, Hyundai, Mazda, Nissan, Peugeot, Suzuki and Toyota. Comparing these
numbers to data from chapter 2.3.2. it can be concluded that they are closely related. In both
new and used cars tables Volkswagen and Renault were the first two, in that order, followed
by Opel and Škoda. This is actually, exactly the same order as in the official data provided by
CVH. The following chart represents the respective models for these vehicles.
Figure 20: Car make (Source: Author’s research)
Car brand

45
There are two of each of the following models: Volkswagen Golf, Audi A3, Mercedes A class,
Renault Clio and Megane and Opel Corsa. There are also three Volkswagen Polos. This result
is very expected, since the most popular car category is a hatchback, and all of these models,
without exception, are hatchbacks. (Figure 25)
Figure 21: Car model (Source: Author’s research)
Figure 22: Year of production (Source: Author’s research)
Car model
Year of production

46
This chart (Figure 26) reveals the manufacture year for each participants’ vehicle. Five vehicles
are 5 years old and 5 are 4 years old. In chapter 2.3.3., it was discovered that the average age
of all registered vehicles in 2019. Is 4.09 years, so the data from the survey matches the data
acquired from CVH. However, the data from CVH only includes registrations for new vehicles
and imported vehicles, it doesn’t contain the second, third, fourth etc. registration of the same
vehicle. The real average age of vehicles on Croatian roads is older than 4. If the age of each
participants’ vehicle is considered and the mean is calculated, the result is the average age of
9.92 years. According to Poslovni.hr, the average age for Croatian vehicles in 2018. was 12,6
years.28 The average age of vehicles in the European Union is 10,8 years.29
Here, the participants were asked if they purchased their vehicle new or used. Almost 60% of
the bought a used vehicle. (Figure 27) The following figure shows the approximate price the
participants payed for their vehicles.
28 Poslovni dnevnik/Hina (2019.): Otkrivena prosječna starost vozila u Hrvatskoj: Jedna stvar je posebno
zabrinjavajuća https://www.poslovni.hr/hrvatska/otkrivena-prosjecna-starost-vozila-u-hrvatskoj-jedna-stvar-je-
posebno-zabrinjavajuca-358349 29 ACAE.be(2020.): Average age of the EU fleet https://www.acea.be/statistics/tag/category/average-vehicle-age
Figure 23: New or used vehicle (Source: Author’s research)
Was the car purchased used or new?
New
Used

47
The majority of respondents payed between 30,000kn and 70,000kn for their cars. The second
biggest bracket of car value belongs to 21.9% participants. Three groups of 4 participants, or
12.5% payed 70,000-100,000kn, 150,000-200,000kn and 200,000-400,000kn. Nobody payed
of 400,000kn for a vehicle. (Figure 28)
This chart (Figure 29) shows us the approximate total number of kilometres each of the
participants’ cars has made. Most cars have made 100,000-150,000 kilometres. However, the
distribution is pretty even across the range.
Figure 28: Purchase price of vehicle (Source: Author’s research)
Figure 29: Total no. of kilometres (Source: Author’s research)
What was the purchase price (HRK)?
What is the total mileage? (km)

48
This question, illustrated in Figure 30, is about the average number of kilometres each of the
participants’ vehicles makes per year. As expected, the majority of vehicles make under 10,000
kilometres, and a similar share of participants’ travel between 10,000 and 15,000 kilometres
per year. The Croatian average is around 10,000-15,000 km.
In this question, shown in Figure 31, the respondents were to reveal the CO2 emissions of their
vehicles. 25% of vehicles emit between 90 and 99 grams of CO2 per kilometre. 21.9% of them
emit between 100 and 119 grams of CO2 per kilometre. The other two significant chunks
represent the 80-79 and 80-89 g/km range. This result, however, should be taken with a grain
of salt, because vehicles older than 10-12 years don’t have their CO2 emission stated in the
registration. The reason for this is that only recently the laws were introduced for manufacturers
Figure 30: Average no. of kilometres per year (Source: Author’s research)
Figure 31: CO2 emissions (Source: Author’s research)
What is the average mileage per one year?
What are the CO2 emissions? (g/km)

49
to measure the emissions of their vehicles, and Croatian technical inspection stations don’t
have the devices and machinery used for the measurements.
This chart (Figure 32) shows us the fuel type used in the participants’ vehicles. This basically
confirms the data received from CVH, or rather vice versa. 93.8% of all vehicles in the survey
are either diesel or petrol engines. To be exact, there is the same amount of diesel and petrol
vehicles – 15 for each side. The remaining two are hybrid vehicles. One Volkswagen Golf GTE
and one Toyota Yaris hybrid. Hopefully this will change in the upcoming years.
This final question of section 2, shown in Figure 33, reveals the type of transmission of each
vehicle in the survey. Vast majority of them (71.9%) use the plain manual transmission. 3
vehicles have the basic, single clutch, automatic transmission. 6 vehicles use the latest
technology, the dual clutch automatic transmission.
Figure 24: Type of fuel (Source: Author’s research)
Which type of fuel is used?
Petrol
Diesel
Hybrid
Fully electric
LPG
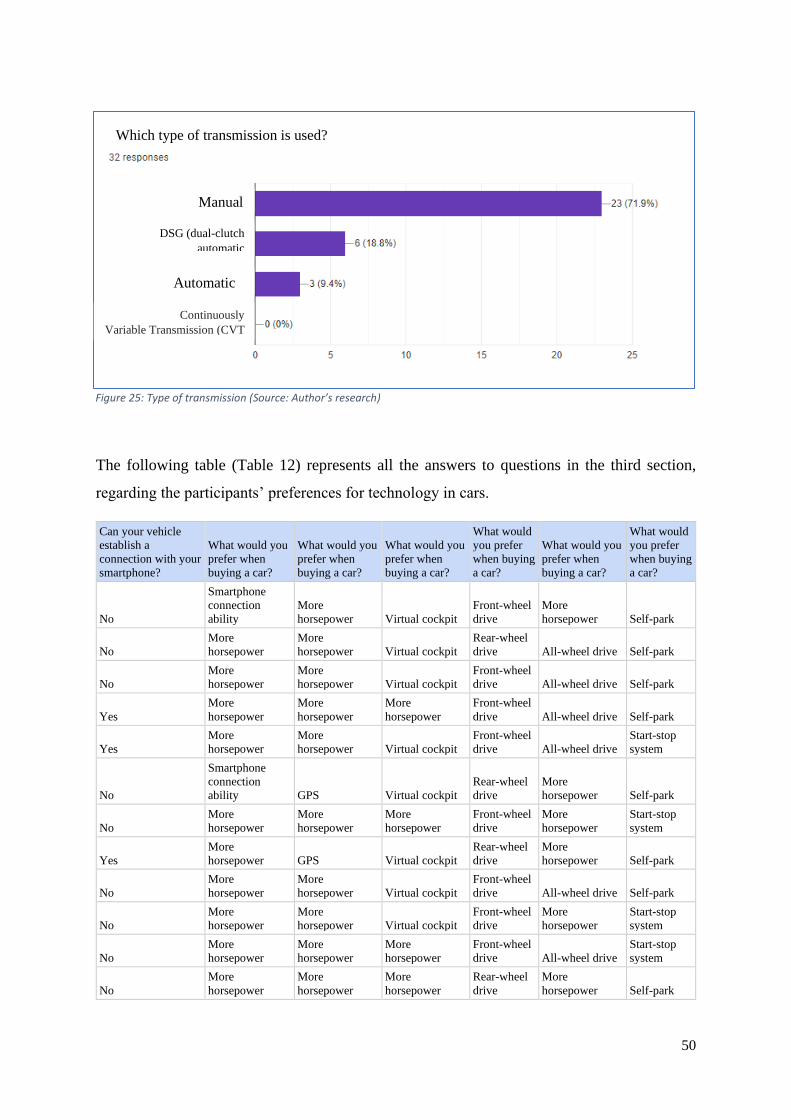
50
The following table (Table 12) represents all the answers to questions in the third section,
regarding the participants’ preferences for technology in cars.
Can your vehicle
establish a
connection with your
smartphone?
What would you
prefer when
buying a car?
What would you
prefer when
buying a car?
What would you
prefer when
buying a car?
What would
you prefer
when buying
a car?
What would you
prefer when
buying a car?
What would
you prefer
when buying
a car?
No
Smartphone
connection
ability
More
horsepower Virtual cockpit
Front-wheel
drive
More
horsepower Self-park
No
More
horsepower
More
horsepower Virtual cockpit
Rear-wheel
drive All-wheel drive Self-park
No
More
horsepower
More
horsepower Virtual cockpit
Front-wheel
drive All-wheel drive Self-park
Yes
More
horsepower
More
horsepower
More
horsepower
Front-wheel
drive All-wheel drive Self-park
Yes
More
horsepower
More
horsepower Virtual cockpit
Front-wheel
drive All-wheel drive
Start-stop
system
No
Smartphone
connection
ability GPS Virtual cockpit
Rear-wheel
drive
More
horsepower Self-park
No
More
horsepower
More
horsepower
More
horsepower
Front-wheel
drive
More
horsepower
Start-stop
system
Yes
More
horsepower GPS Virtual cockpit
Rear-wheel
drive
More
horsepower Self-park
No
More
horsepower
More
horsepower Virtual cockpit
Front-wheel
drive All-wheel drive Self-park
No
More
horsepower
More
horsepower Virtual cockpit
Front-wheel
drive
More
horsepower
Start-stop
system
No
More
horsepower
More
horsepower
More
horsepower
Front-wheel
drive All-wheel drive
Start-stop
system
No
More
horsepower
More
horsepower
More
horsepower
Rear-wheel
drive
More
horsepower Self-park
Figure 25: Type of transmission (Source: Author’s research)
Which type of transmission is used?
Manual
DSG (dual-clutch
automatic
Automatic
Continuously
Variable Transmission (CVT
)

51
Yes
More
horsepower
More
horsepower
More
horsepower
Rear-wheel
drive
More
horsepower Self-park
Yes
More
horsepower
More
horsepower Virtual cockpit
Rear-wheel
drive All-wheel drive Self-park
Yes
Smartphone
connection
ability
More
horsepower Virtual cockpit
Rear-wheel
drive All-wheel drive Self-park
Yes
Smartphone
connection
ability
More
horsepower Virtual cockpit
Front-wheel
drive All-wheel drive Self-park
No
Smartphone
connection
ability GPS Virtual cockpit
Rear-wheel
drive All-wheel drive Self-park
No
More
horsepower
More
horsepower
More
horsepower
Front-wheel
drive All-wheel drive Self-park
Yes
More
horsepower
More
horsepower
More
horsepower
Front-wheel
drive All-wheel drive Self-park
Yes
Smartphone
connection
ability GPS Virtual cockpit
Front-wheel
drive All-wheel drive Self-park
Yes
More
horsepower
More
horsepower
More
horsepower
Rear-wheel
drive
More
horsepower
Start-stop
system
Yes
Smartphone
connection
ability
More
horsepower Virtual cockpit
Rear-wheel
drive All-wheel drive Self-park
No
More
horsepower
More
horsepower
More
horsepower
Rear-wheel
drive All-wheel drive
Start-stop
system
Yes
More
horsepower
More
horsepower Virtual cockpit
Rear-wheel
drive
More
horsepower
Start-stop
system
No
Smartphone
connection
ability GPS Virtual cockpit
Rear-wheel
drive All-wheel drive Self-park
No
More
horsepower
More
horsepower
More
horsepower
Front-wheel
drive All-wheel drive Self-park
No
More
horsepower
More
horsepower
More
horsepower
Front-wheel
drive
More
horsepower
Start-stop
system
Yes
Smartphone
connection
ability
More
horsepower
More
horsepower
Front-wheel
drive All-wheel drive Self-park
Yes
Smartphone
connection
ability GPS Virtual cockpit
Front-wheel
drive All-wheel drive Self-park
Yes
More
horsepower GPS Virtual cockpit
Front-wheel
drive All-wheel drive Self-park
Yes
Smartphone
connection
ability GPS Virtual cockpit
Front-wheel
drive All-wheel drive Self-park
Yes
More
horsepower
More
horsepower Virtual cockpit
Front-wheel
drive All-wheel drive Self-park
Yes
Smartphone
connection
ability GPS Virtual cockpit
Front-wheel
drive All-wheel drive Self-park
No
Smartphone
connection
ability
More
horsepower Virtual cockpit
Front-wheel
drive All-wheel drive Self-park
Table 12: Questions regarding participants' preferences (Source: Author’s research)

52
The data from this group of questions will now be represented in charts. Starting off with the
ability of participants’ vehicles to achieve a connection with a smartphone.
The distribution is pretty even, 17 participants can connect their phones, 15 can’t. (Figure 34)
The following five questions ask the participant if they would rather choose an engine with
more horsepower, or one of the modern ICT systems available in cars. The first question asks
if the participant would rather have a stronger engine or the ability to establish a connection
with their smartphone. The majority (20 out of 32) would rather have a stronger engine. (Figure
35)
Next, the participant is asked if they would rather have a stronger engine or a navigation system.
Out of the 32 participants, 23 of them would choose a stronger engine. This was expected,
knowing that everyone uses Google Maps on their smartphones. (Figure 36)
Figure 26: Can the vehicle connect to smartphone (Source: Author’s research)
Figure 27: Preference between more engine power and smartphone connectivity (Source: Author’s research)
Can your vehicle establish a connection with your smartphone?
Yes
No
What would you prefer when buying a car?
More horsepower
Smartphone connection ability

53
The next question (Figure 37) asks the participant if they would rather have a stronger engine
or a virtual cockpit. Virtual cockpit is explained in the chapter 3.2. 62.5% of the participants
would choose a virtual cockpit. Since a virtual cockpit is nothing more than one additional
LCD screen in the place of the traditional analogue instrument cluster, which can display
various kinds of data, an assumption can be made that the participants are more inclined to
choose the latest tech system over a faster car.
Figure 28: Preference between more engine power or GPS (Source: Author’s research)
Figure 29: Preference between more engine power or virtual cockpit (Source: Author’s research)
What would you prefer when buying a car?
What would you prefer when buying a car?
More horsepower
More horsepower
Virtual cockpit

54
This is confirmed in the next question, shown in Figure 38, which asks the participant if they
would rather have a stronger engine or all-wheel drive. 71.9% of them would rather have the
latter.
Figure 30: Preference between more engine power or AWD (Source: Author’s research)
While it may not be apparent at first glance, but modern all-wheel drive vehicles, actually,
require a decent bit of technological know-how to manufacture. It is very important to know
the difference between four-wheel drive and all-wheel drive. Four-wheel drive vehicles can
only lock their front and rear driveshafts so that each axle always turns at the same speed.30
Modern vehicles, with all-wheel drive, have much cleverer systems. Some of them, actually,
have four axles instead of two and can distribute power and torque to any wheel separately,
depending on the situation. These systems make these decisions in a matter of tenths of a
second and have complex algorithms that can make calculations and sense even the slightest
30 Jacquot, J., (2016.): All-Wheel-Drive Systems Explained
https://www.caranddriver.com/features/a15102281/best-all-wheel-drive-system/
What would you prefer when buying a car?
More horsepower
All-wheel drive

55
wheel spin. The following question asks the participant if they would prioritise front-wheel
drive or rear-wheel drive in their vehicle. (Figure 39)
As the graph shows, around 60% of participants would opt for front-wheel drive. FWD is safer
and easier to manoeuvre than RWD and is technologically more complex to manufacture. In
this day and age, it is a trait of sports cars to have RWD.
This question (Figure 40) let the aprticipant choose between two different ICT systems. The
start-stop system, which turns the engine off, when the vehicle comes to a halt. That way, fuel
consumption and CO2 emissions are reduced by removing unnecesary engine work-time. Self-
park is one of the aforementioned levels of autonomy explained in a previous chapter. Self-
park is a much newer functionality, with less tangible benefits, however, it is new and exciting.
75% of participants would opt for the self-park option.
Figure 31: Preference between FWD and RWD (Source: Author’s research)
Figure 32: Preference between start-stop and self-park (Source: Author’s research)
What would you prefer when buying a car?
What would you prefer when buying a car?
Front-wheel drive
Rear-wheel drive
Start-stop system
Self-park

56
The next table (Table 13) contains the last section of questions and asnwers.
How much
would you trust full
autonomy?
How much
would you trust “lane-assist”
technology?
How much would
you trust
“emergency braking”
technology?
Would you
drive an electric
vehicle?
If you would drive
an electric vehicle, what would be your
reasons?
If you wouldn’t drive an electric vehicle, what
would be your reasons?
If you payed 100,000kn for a
diesel, how much
would you pay for an electric vehicle at
maximum?
3 3 3 Yes Bla bla Btk 120,000
1 1 3 No
High cost, short range of
battery, long charging
time
I wouldn’t buy an
electric vehicle
1 5 5 No 0 Samo benzin amigo I wouldn’t buy an electric vehicle
4 3 4 Yes Isplativost vozio bih ga 120,000
1 5 5 No 0
Nemogućnost prodaje,
velika cijena nove
baterije
I wouldn’t buy an
electric vehicle
4 4 4 Yes dobar izgled 150,000
3 4 4 Yes
Manji varijabilni
troškovi. 150,000
2 4 3 Yes
Zbog smanjenja
zagadenja okolisa Vozila bih 150,000
1 1 2 No
I wouldn’t buy an
electric vehicle
3 3 4 Yes
Premalo punjača, slaba
infrastruktura, nedostupan za one koji
nemaju kuću/dvorište i
priključak za struju 150,000
2 3 2 No Ne sviđaju mi se I wouldn’t buy an electric vehicle
4 4 3 Yes
Poticaji, niza cijena
odrzavanja
Osjecaj motora s
unutarnjim izgaranjem 170,000
4 4 4 Yes
Udobnost, brzina, praktičnost,
troskovi Zvuk 150,000
3 4 4 Yes
Ne čuje se, ne
zagaduje okoliš, jeftinije je od
goriva 150,000
3 4 4 Yes
Ne troši gorivo, tiha vožnja, veliko
ubrzanje 150,000
4 5 4 Yes
Potrošnja goriva,
državna subvencija 150,000
4 4 4 Yes 120,000
2 2 2 Yes usteda kratki domet 150,000
3 4 3 Yes Ušteda na gorivu.
Vozio bih, ali razlog koji me odbija jest pre mala
zastupljenost punjača na
hrvatskim prometnicama. 150,000
3 5 4 Yes
Ne troši gorivo, tih je, državna
subvencija
Postaje za punjenje nisu dovoljno zastupljene,
skup je 150,000
4 4 4 No / / I wouldn’t buy an electric vehicle
3 3 3 Yes
Dugoročna
isplativost 170,000
1 1 1 Yes ne zagađuje okoliš 150,000

57
2 3 4 Yes
Cuvanje okolisa,
usteda 120,000
4 4 4 Yes 120,000
3 3 3 Yes
Smanjenje emisije
stetnih plinova 120,000
3 2 2 Yes emisija CO2 170,000
3 4 4 Yes Emisija plinova 150,000
3 4 4 Yes
Državni poticaj, tih
je, ne troši gorivo Manjak punjača 150,000
2 3 2 Yes Ne mora se točiti, okoliš 120,000
3 4 4 Yes
manji troškovi,
jednostavnije
održavanje, manje kvarova
premalo mjesta za punjenje 150,000
4 4 3 Yes Ne troši gorivo Preskup 120,000
4 4 3 No
Izrazito loša infrastruktura, manjak
poticaja, prevelika cijena,
strah da kvara baterije, ne sviđaju mi se
I wouldn’t buy an electric vehicle
3 4 3 Yes
Nema troška
goriva, struja je jeftinija, tih je Nema dovoljno punjača 120,000
Table 13:Questions regarding participants' opinions on modern ICT (Source: Author’s research)
The following three questions required the participant to evaluate how much would they trust
a new ICT system on a scale from one to five. The first question asked how much would the
participant trust full vehicle autonomy.
It can be observed, that 40.6% of participants are somewhere in the middle between not trusting
it at all and completely trusting it. Not a single participant would rely on full autonomy, 15.6%
wouldn’t trust it at all. 28.1% of participants would rely on full autonomy, but wouldn’t be
completely comfortable with it. (Figure 41)
Figure 41: Level of trust towards full autonomy
How much would you trust full autonomy?

58
This question is about trusting the lane-assist technology, which is also one of the levels of
vehicle autonomy. Here it can be observed three participants who would be completely
comfortable with relying on the vehicle’s system to keep it centred. Majority (53.1%) would
also rely on it, but not completely. There are also three participants who wouldn’t trust it at all,
even though it is currently being used on the roads legally. (Figure 42)
Figure 42: Level of trust towards lane-assist technology
How much would you trust “lane-assist” technology?
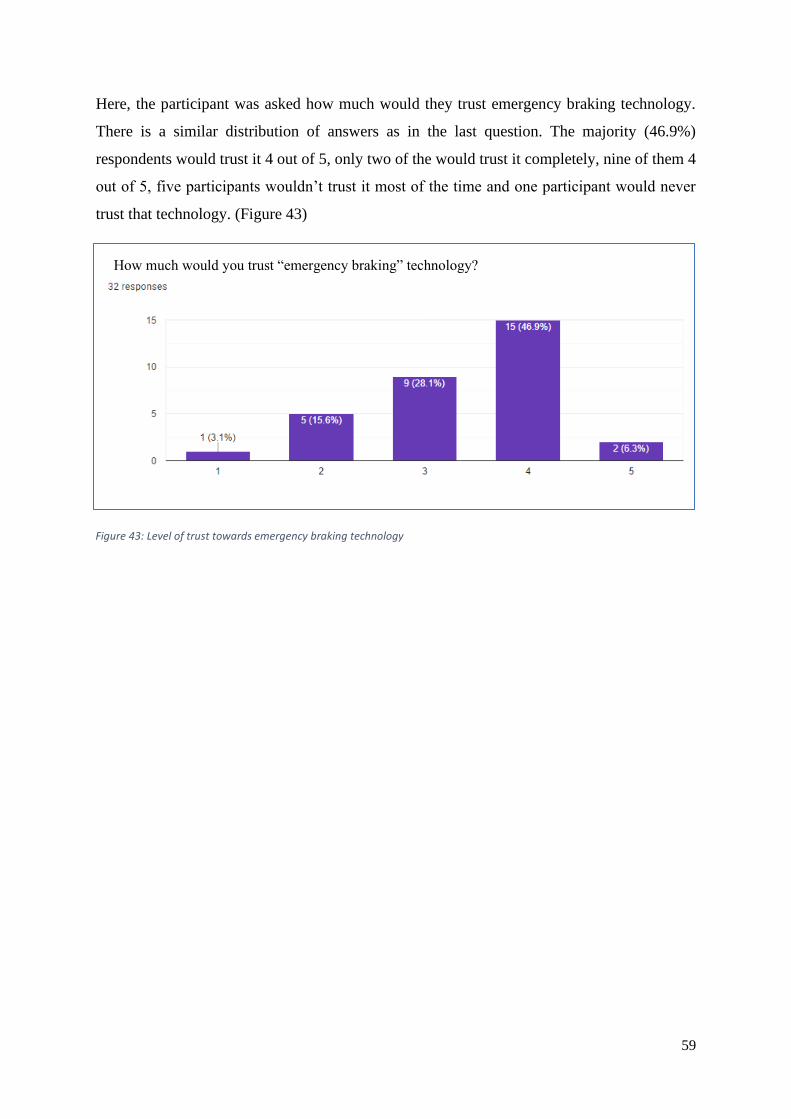
59
Here, the participant was asked how much would they trust emergency braking technology.
There is a similar distribution of answers as in the last question. The majority (46.9%)
respondents would trust it 4 out of 5, only two of the would trust it completely, nine of them 4
out of 5, five participants wouldn’t trust it most of the time and one participant would never
trust that technology. (Figure 43)
Figure 43: Level of trust towards emergency braking technology
How much would you trust “emergency braking” technology?

60
The last four questions are about participants’ opinions regarding electric vehicles. The first
question is very straight forward; it asks the participant if they would drive an electric vehicle.
Vast majority (78.1%) of participants would drive an electric vehicle, while 21.9% wouldn’t.
This question is not to be confused with asking the participants if they would purchase an
electric vehicle. (Figure 44) The next two questions require the participants to provide a couple
of reasons why they would or wouldn’t buy an electric car. Among the 23 provided responses,
5 of them mentioned that electric cars are quiet, 14 respondents mentioned cost reductions (in
form of fuel and in form of maintenance), 7 people had the environment and CO2 emissions in
mind, 3 respondents mentioned the government incentive and 2 respondents recognised the
immense acceleration that electric cars can have. The most prominent reason for not buying an
electric car are lack of infrasctructure and charging stations, they might be hard to sell, they are
expensive, it takes a long time to recharge, the short range of electric vehicles and fear of
battery malfunction and having to purchase a new one, which would prove extremely
expensive. Some respondents are, apparently, car purists and don’t appreciate the lack of sound
and internal combustion, thus they don’t deem electric vehicle as a worthy drive.
Figure 44: Question if participant would drive an electric car
Would you drive an electric vehicle?
Yes
No
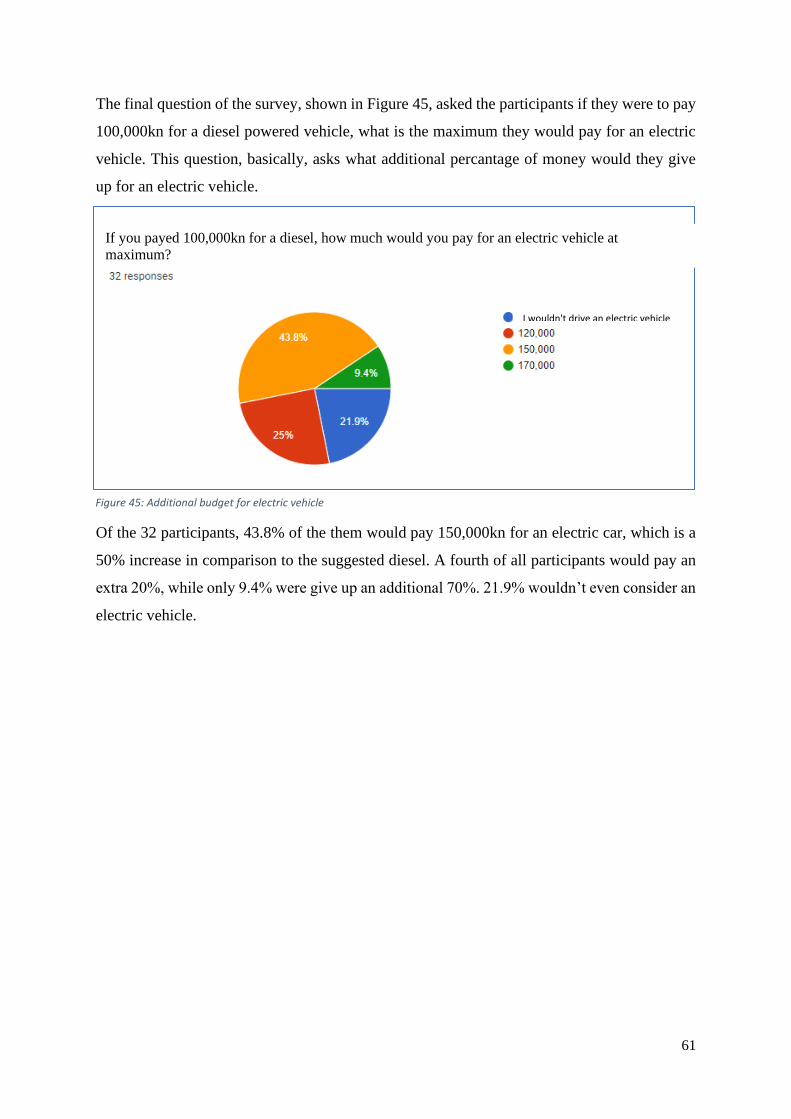
61
The final question of the survey, shown in Figure 45, asked the participants if they were to pay
100,000kn for a diesel powered vehicle, what is the maximum they would pay for an electric
vehicle. This question, basically, asks what additional percantage of money would they give
up for an electric vehicle.
Of the 32 participants, 43.8% of the them would pay 150,000kn for an electric car, which is a
50% increase in comparison to the suggested diesel. A fourth of all participants would pay an
extra 20%, while only 9.4% were give up an additional 70%. 21.9% wouldn’t even consider an
electric vehicle.
Figure 45: Additional budget for electric vehicle
If you payed 100,000kn for a diesel, how much would you pay for an electric vehicle at
maximum?
I wouldn't drive an electric vehicle

62
4.3. Discussion
Demographic characteristics
From the first section of questions it was discovered that most of the participants in the survey
are aged between 18 and 25, with the other big chunk being under 30 years old. Majority of
respondents are male. Almost 80% of participants have either bachelors or master degree,
43.8% are employed with a contract.
Brand
The data received from the survey can easily be compared to the official data received from
CVH. It was proven that the two most prominent car manufacturers in Croatia are Volkswagen
and Renault, same as in the official data. It can also be surmised that the average Croatian
consumer prefers cars manufactured in Germany like Volkswagen, Škoda, Audi, Opel and
Mercedes, with BMW being somewhat less popular. As one can see while driving on the city
streets, hatchbacks are the most common car category. That can also be seen in the survey.
Vehicle age
20 of the 32 vehicles stated in the survey are hatchbacks, with an additional few being small
city cars like Volkswagen Up!. While most of them were manufactured in 2015. and 2016., the
calculated average age of the respondents’ vehicles was 9.92 years, which is slightly less than
the European average of 10.8 and the Croatian average of 12.6 years. The majority of
respondents (75%), are not the first owner of their current vehicle. Some of them (59.5%)
purchased their vehicles used and some inherited them from their family members. Most
participants make about 10,000 km per year. There are only two participants with hybrid
vehicles and not a single electric vehicle, which matches the statistics taken off the CVH
website for 2019.
ICT preferences
If respondents’ reasons against buying an electric vehicle are taken into account, it can be
concluded that the government doesn’t give nearly enough incentive for consumers to even
consider buying an electric vehicle, aside from some consumers who are passionate about
modern technology despite the high prices. About half of the participants can connect their

63
smartphones to their cars, however most of them would rather have a more powerful engine.
Most of them would also rather have a faster car, than an integrated navigation system. This is
probably due to everyone already using Google Maps on their smartphones. Most people would
choose more advanced ICT systems like virtual cockpit, self-parking and all-wheel drive, over
a more powerful engine. This goes to show that consumers are more inclined to prefer modern
technology than traditional car enthusiast traits like speed, acceleration or sporty engine sound.
Looking at the last section, it can be surmised that people, generally, don’t trust vehicle
autonomy, however a decent portion of them would be relatively comfortable giving up control
to some automated systems like lane-assist and emergency braking. Most people would drive
an electric car, however, they see issues in current high prices, bad local infrastructure,
relatively short ranges compared to internal combustion engines and general fear of new
technology, in a sense that they fear the expensive battery will malfunction and cause a very
large expenditure. Participants would generally be comfortable with paying an additional 50%
for an electric car. A fourth of them would give an additional 20%. This goes to show that
consumers are generally interested in electric cars and can see enough benefit in them, so much
so that they pay 50% more, however they find the issues of practicality more concerning than
the actual price.
64
5. Conclusion It can be concluded that the automotive industry does not have a future without the application
of ICT. Manufacturers have already started to put the emphasis on developing new and exciting
technological solutions. Just taking a look at the Volkswagen group and all the makes in their
group, shows that all of their vehicles have the same couple of engines. They have 1.4 litre and
2 litre petrols and 2 litre diesel engines, any other engines like 2.5 litre petrols and 3.0 diesels
belong almost exclusively to sport editions and luxury cars. The engine, horsepower,
acceleration, piston alignment and similar purist traits are no longer selling points. The future
of the automotive industry lies electric vehicles, automation systems, digitalisation and vehicle
autonomy. The automotive industry creates 14.6 million jobs which makes up for 6.7% of all
employment in the European Union and accounts for 7% of EU’s total GDP. The European
auto industry is a major global player, gaining €135.9 billion from extra EU exports.
Furthermore, manufacturers have started and should emphasise more on monitoring data
collected from all of their vehicles. Serious thought should be given to the application of IoT
in the industry and all the benefits it could grant. ICT is bringing us closer and closer to full
vehicle autonomy, which will undoubtedly be a major turning point in the industry.
The Croatian government should reconsider their current incentives for electric vehicles,
especially since speculation started about Tesla starting manufacture in Croatia. Moreover,
Croatian average vehicle age is amongst the oldest, if not the oldest, in the European Union.
Finally, the research conducted revealed confirmed that consumers are generally more inclined
to be more interested in the technological capabilities of their cars than its speed and
acceleration. This trend will soon make the average car enthusiast boast about the extent of
their car’s level of autonomy rather than how long does it take to reach 100 km/h.

65
6. List of References
1. Purdy, K., W., Foster, C., G., Britannica: History Of The Automobile
https://www.britannica.com/technology/automobile/History-of-the-automobile
2. History.com (2009): Ford’s assembly line starts rolling https://www.history.com/this-
day-in-history/fords-assembly-line-starts-
rolling#:~:text=On%20December%201%2C%201913%2C%20Henry,two%20hours
%20and%2030%20minutes.
3. European Automobile Manufacturers Association (2020): The Automobile Industry
Pocket Guide
4. Carrington, D., The Guardian (2015): Wide range of cars emit more pollution in
realistic driving tests, data shows
https://www.theguardian.com/environment/2015/sep/30/wide-range-of-cars-emit-
more-pollution-in-real-driving-conditions-tests-show
5. Statistics provided by Centar za Vozila Hrvatska (2020)
6. CVH https://www.cvh.hr/tehnicki-pregled/statistika/
7. Silva, E., P., M. (2014): Use of ICT in Automobile Industry
https://www.scribd.com/document/198789897/Use-of-ICT-in-Automobile-Industry
8. volskwagen.hr https://cc.porscheinformatik.com/cc-
hr/hr_HR_VW/V/auv/068?GrossNetSwitch=GROSS&variant=Style
9. D. Muller, H. Lutz (June 02, 2019): Data turns dealers into mind readers
https://www.autonews.com/shift/data-turns-dealers-mind-readers
10. Brady, D. (2020): Self-Parking Cars Explained: How Does Automatic Park Assist
Work? https://www.motortrend.com/news/self-parking-cars-explained/
11. Car and Driver Research, (2020): What Is Adaptive Cruise Control?
https://www.caranddriver.com/research/a32813983/adaptive-cruise-control/
12. Sahayadhas, A., Sanduraj, K., Murugappan, M. (2012): Detecting Drowsiness Based
on Sensors: A Review https://www.ncbi.nlm.nih.gov/pmc/articles/PMC3571819/
13. Energy Efficiency & Renewable Energy, U.S. Department of Energy: How Do All-
Electric Cars Work? https://afdc.energy.gov/vehicles/how-do-all-electric-cars-work
14. Tesla.com https://www.tesla.com/sl_SI/model3/design?redirect=no#battery

66
15. Electric Vehicle Database: Tesla Model 3 Long Range Dual Motor https://ev-
database.org/car/1138/Tesla-Model-3-Long-Range-Dual-Motor
16. Electromaps: Charging stations in Croatia https://www.electromaps.com/en/charging-
stations/croatia
17. Matteson, S., Tech Republic (2019.): Autonomous vs automated: What each means and
why it matters https://www.techrepublic.com/article/autonomous-versus-automated-
what-each-means-and-why-it-matters/
18. English, T. (2020.): How Do Self-Driving Cars Work?
https://interestingengineering.com/how-do-self-driving-cars-work
19. Harner, I. (2020): the 5 Autonomous Driving Levels Explained
https://www.iotforall.com/5-autonomous-driving-levels-explained/
20. Union of Concerned Scientists (2017): Self-Driving Cars Explained
https://www.ucsusa.org/resources/self-driving-cars-101
21. McDermid, J. (2020.): Autonomous cars: five reasons they still aren’t on our roads
https://theconversation.com/autonomous-cars-five-reasons-they-still-arent-on-our-
roads-143316
22. Ninan, S., Gangula, B., von Alten, M., Sniderman, B., Deloitte University Press: Who
owns the road? The IoT-connected car of today—and tomorrow
23. Rouse, M. (2020): internet of things (IoT)
https://internetofthingsagenda.techtarget.com/definition/Internet-of-Things-IoT
24. Ranger, S. (2020): What is the IoT? Everything you need to know about the Internet of
Things right now https://www.zdnet.com/article/what-is-the-internet-of-things-
everything-you-need-to-know-about-the-iot-right-now/
25. Grayson, P. (2019.): Big Ways IoT is Transforming the Automotive Industry
https://futureiot.tech/5-big-ways-iot-is-transforming-the-automotive-industry/
26. QuestionPro: Online Surveys: Definition, Characteristics, Examples, Advantages and
Disadvantages https://www.questionpro.com/blog/what-are-online-surveys/
27. Bhatia, M. (2018.): A Complete Guide to Quantitative Research Methods
https://humansofdata.atlan.com/2018/06/quantitative-research-methods/
28. Poslovni dnevnik/Hina (2019.): Otkrivena prosječna starost vozila u Hrvatskoj: Jedna
stvar je posebno zabrinjavajuća https://www.poslovni.hr/hrvatska/otkrivena-prosjecna-
starost-vozila-u-hrvatskoj-jedna-stvar-je-posebno-zabrinjavajuca-358349
29. ACAE.be(2020.): Average age of the EU fleet
https://www.acea.be/statistics/tag/category/average-vehicle-age

67
30. Jacquot, J., (2016.): All-Wheel-Drive Systems Explained
https://www.caranddriver.com/features/a15102281/best-all-wheel-drive-system/

68
7. Appendix
List of figures
Figure 1: Distribution by fuel type (Source: acea.ne) ................................................................ 5
Figure 2: Distribution by fuel type per country (Source: acea.be) ............................................ 6
Figure 3: EU automotive employment 2014-2018 (Source: acea.be)...................................... 10
Figure 4: Direct employment EU per country (Source: acea.be) ............................................. 11
Figure 5: Number of new registered vehicles in 2019 (Source: CVH).................................... 13
Figure 6: Average purchase price (HRK) (Source: CVH) ....................................................... 14
Figure 7: Average CO2 emissions 2019 (Source: CVH) ......................................................... 14
Figure 8: Number of used registered vehicles in 2019 (Source: CVH) ................................... 16
Figure 9: Average price of used vehicles 2019 (Source: CVH) .............................................. 17
Figure 10: Average price comparison between used and new (Source:CVH) ........................ 18
Figure 11: Average age of used vehicles 2019 (Source: CVH) ............................................... 18
Figure 12: Average CO2 emissions on used cars 2019 (Source: CVH) .................................. 19
Figure 13: Golf 8 variants (Source: Volkswagen Hrvatska):................................................... 22
Figure 14: Electric vehicle key components (Source: afdc.energy.gov) ................................. 27
Figure 15: Charging stations for electric vehicles in Croatia (Source: electromaps.com) ...... 29
Figure 16: Map of charging stations for electric vehicles in Croatia (Source:
electromaps.com) ..................................................................................................................... 30
Figure 17: 6 levels of autonomy (Source: SAE) ...................................................................... 33
Figure 18: Example of an IoT system (Source:Internet of Things Agenda) ............................ 34
Figure 19: Gender of participants (Source: Author’s research) ............................................... 39
Figure 20: Age groups of participants (Source: Author’s research) ........................................ 39
Figure 21: Employment type of participants (Source: Author’s research) .............................. 40
Figure 22: Education of participants (Source: Author’s research) .......................................... 40
Figure 23: Monthly incomes of participants (Source: Author’s research) .............................. 41
Figure 24: Car make (Source: Author’s research) ................................................................... 44
Figure 25: Car model (Source: Author’s research) .................................................................. 45
Figure 26: Year of production (Source: Author’s research) .................................................... 45
Figure 27: New or used vehicle (Source: Author’s research) .................................................. 46
Figure 28: Total no. of kilometres (Source: Author’s research) .............................................. 47

69
Figure 29: Purchase price of vehicle (Source: Author’s research) .......................................... 47
Figure 30: CO2 emissions (Source: Author’s research) .......................................................... 48
Figure 31: Average no. of kilometres per year (Source: Author’s research) ........................... 48
Figure 32: Type of fuel (Source: Author’s research) ............................................................... 49
Figure 33: Type of transmission (Source: Author’s research) ................................................. 50
Figure 34: Can the vehicle connect to smartphone (Source: Author’s research) .................... 52
Figure 35: Preference between more engine power and smartphone connectivity (Source:
Author’s research) .................................................................................................................... 52
Figure 36: Preference between more engine power or GPS (Source: Author’s research) ....... 53
Figure 37: Preference between more engine power or virtual cockpit (Source: Author’s
research) ................................................................................................................................... 53
Figure 38: Preference between more engine power or AWD (Source: Author’s research) .... 54
Figure 39: Preference between FWD and RWD (Source: Author’s research) ........................ 55
Figure 40: Preference between start-stop and self-park (Source: Author’s research) ............. 55
Figure 41: Level of trust towards full autonomy ..................................................................... 57
Figure 42: Level of trust towards lane-assist technology ........................................................ 58
Figure 43: Level of trust towards emergency braking technology .......................................... 59
Figure 44: Question if participant would drive an electric car ................................................ 60
Figure 45: Additional budget for electric vehicle .................................................................... 61
List of Tables
Table 1: Distribution by fuel type per country (Source: acea.be) .............................................. 6
Table 2:State of auto industry for EU, year 2007 (Source: acea.be) ......................................... 7
Table 3:State of auto industry for EU, year 2019 (Source: acea.be) ......................................... 8
Table 4: EU automotive employment 2014-2018 (Source: acea.be) ......................................... 9
Table 5: Percentage change in indirect manufacturing employment (Source: acea.be) ............ 9
Table 6:Croatian direct manufacturing employment (Source: acea.be) .................................. 10
Table 7: Registration of new vehicles 2019 (Source: CVH) ................................................... 12
Table 8: Registration of used vehicles 2019 (Source: CVH) ................................................... 15
Table 9: All registered vehicles summary 2019 (Source: CVH) ............................................. 19
Table 10: Demographics section (Source: Author’s research) ................................................ 38
Table 11: Key vehicle data questions (Source: Author’s research) ......................................... 43
Table 12: Questions regarding participants' preferences (Source: Author’s research) ............ 51
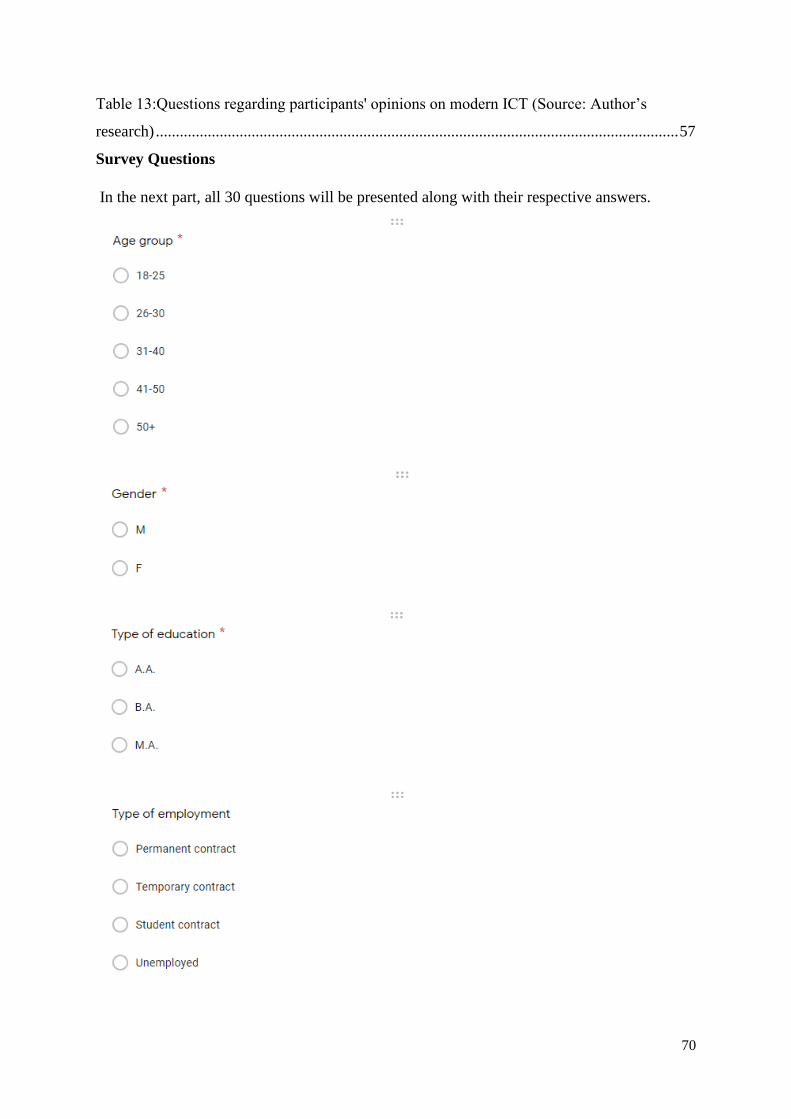
70
Table 13:Questions regarding participants' opinions on modern ICT (Source: Author’s
research) ................................................................................................................................... 57
Survey Questions
In the next part, all 30 questions will be presented along with their respective answers.
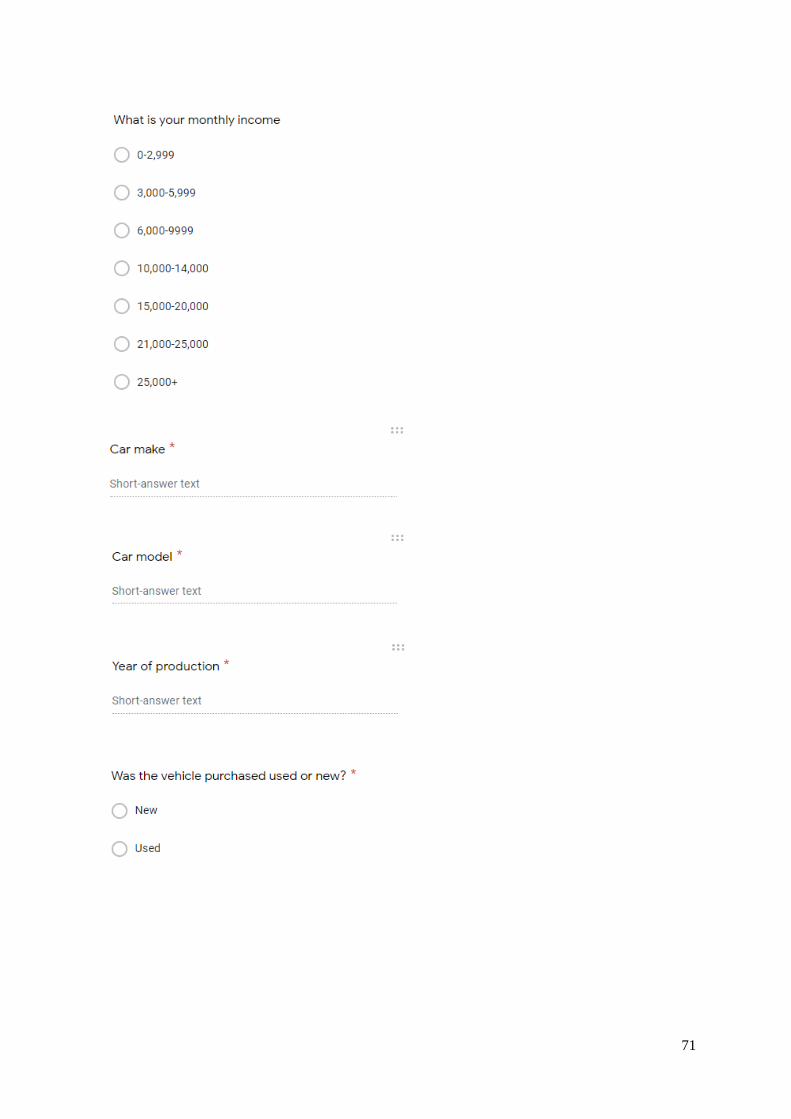
71
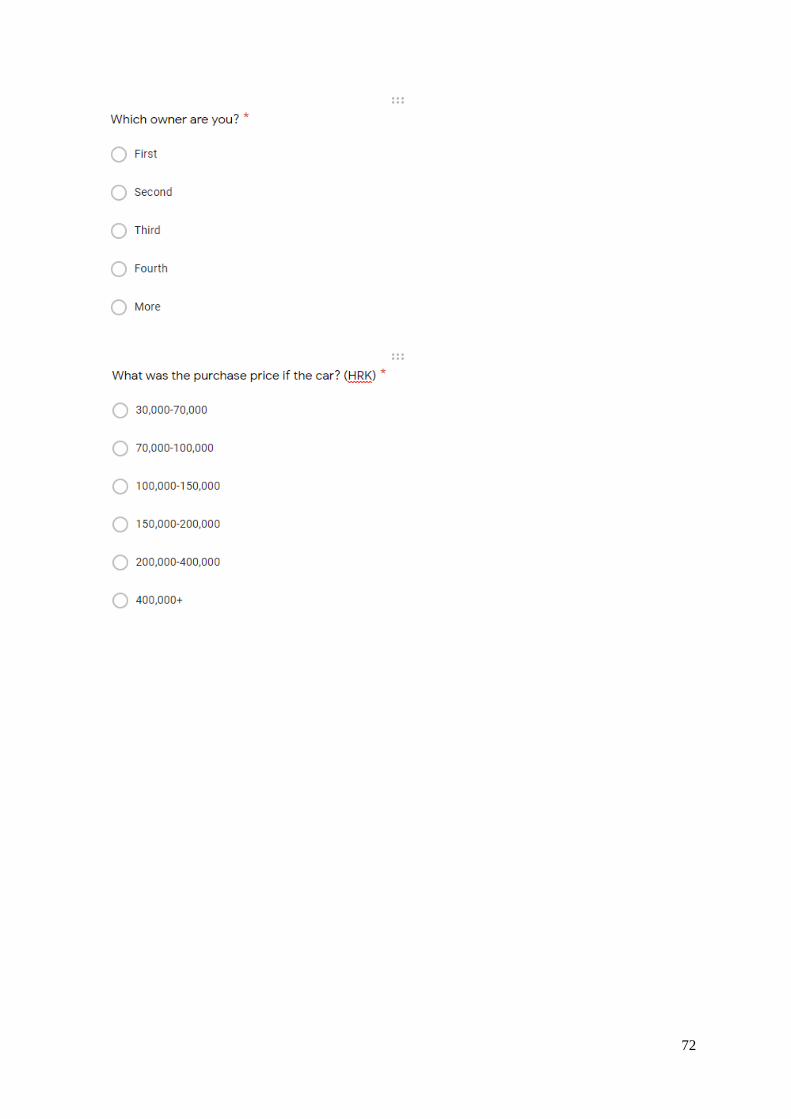
72
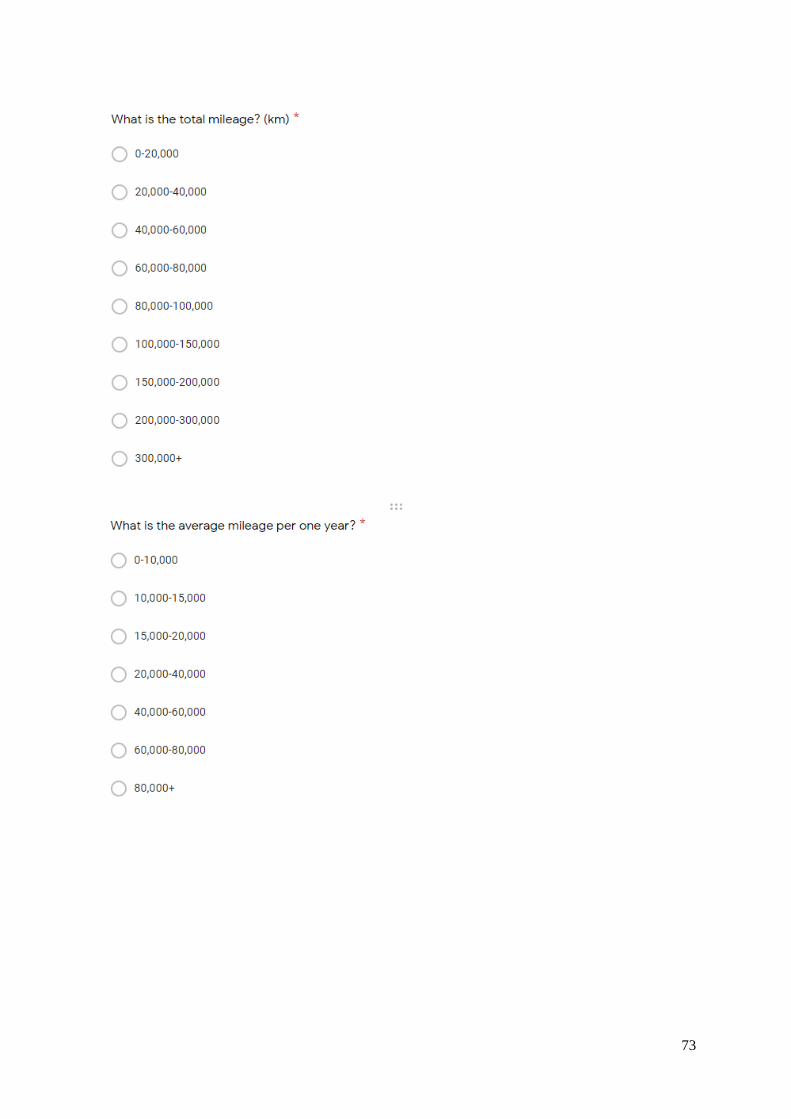
73

74

75

76

77