impact of ifrs on financial ratios
TRANSCRIPT
Accounting and Finance 49 (2009) 341–361
©
The AuthorsJournal compilation
©
2009 AFAANZ
Blackwell Publishing LtdOxford, UKACFIAccounting and Finance0810-53911467-629X© The AuthorsJournal compilation © 2008 AFAANZXXX
ORIGINAL ARTICLE
A.-M. Lantto, P. Sahlström/Accounting and Finance XX (2008) XXX–XXXA.-M. Lantto, P. Sahlström/Accounting and Finance XX (2008) XXX–XXX
Impact of International Financial Reporting Standard adoption on key financial ratios
Anna-Maija Lantto, Petri Sahlström
Department of Accounting and Finance, University of Oulu, Oulu, 90014, Finland
Abstract
Although previous research has investigated the economic consequences ofInternational Financial Reporting Standard (IFRS) adoption, there is little evidenceon the impact of IFRS adoption on key financial ratios. To fill this gap, weexamine this issue in a continental European country (Finland). Our resultsshow that the adoption of IFRS changes the magnitude of the key accountingratios. Moreover, we extend the literature by showing that the adoption of fairvalue accounting rules and stricter requirements on certain accounting issues arethe reasons for the changes observed in accounting figures and financial ratios.
Key words
: International financial reporting standards; IFRS; Financial ratios
JEL classification
: M41
doi
: 10.1111/j.1467-629X.2008.00283.x
1. Introduction
Earlier literature shows that the level of capital market orientation of a financialenvironment explains the differences in accounting systems internationally. Themost obvious illustration of this is probably the difference between the UKand USA accounting systems compared with those of continental Europe (seee.g. Nobes, 1998). D’Arcy (2001) identifies the main differences in accountingpractices between European and North American clusters, including the Inter-national Accounting Standards Committee (IASC) / International AccountingStandards Board (IASB), and reports that the North American cluster isclearly more capital market orientated than the European cluster.
We gratefully acknowledge the helpful comments from Ian Zimmer, an anonymous referee,Seppo Ikäheimo, Juha-Pekka Kallunki and participants at the Doctoral Tutorial in Accountingin Turku (2007) for their helpful comments. The financial support of OKO Bank ResearchFoundation is also greatly appreciated.
Received 10 September 2007; accepted 8 August 2008 by Ian Zimmer (Deputy Editor).
342 A.-M. Lantto, P. Sahlström/Accounting and Finance 49 (2009) 341–361
©
The AuthorsJournal compilation
©
2009 AFAANZ
However, the financial environments of the continental European countrieshave recently developed from the so-called bank-based system towards a market-orientated one.
1
In response to this development, national accounting systemshave developed, too. The biggest step in this development was taken in 2005,when all listed firms in member states of the European Union started to reporttheir financial statements according to the International Financial ReportingStandards (IFRS). Ding
et
al
. (2006) provide evidence on the significance ofthis step by reporting that domestic accounting practices differ significantlyfrom those of IFRS/IAS, especially in continental European countries.
An important question arising from this development is whether thesechanges in accounting systems really have improved the quality of financialreporting. Earlier studies report that the adoption of capital market user-orientatedstandards, such as IFRS, lead to improved accounting quality in continentalEuropean countries (e.g. Bartov
et
al
., 2005; Daske and Gebhardt, 2006; Barth
et
al
., 2008). Although the literature finds that the differences in accountingstandards affect financial reporting quality, it does not describe what kind ofimpact these differences have on the accounting numbers and key financialratios used by financial analysts, investors and other financial institutions as keyperformance indicators.
The purpose of the present paper is to fill this gap by measuring the impactof IFRS adoption on key financial ratios in a continental European country(Finland). To investigate the issue we use a three-step approach. First, we createa comprehensive database of financial statement information prepared underdomestic accounting standards (DAS) and IFRS from the published transitionreports. Second, by using the database created, we investigate whether IFRSchanges key financial ratios by considering the differences between financialratios calculated on the basis of DAS and IFRS for the same reporting period.Third, we investigate the main reasons for the differences by analysing thedifferences in the DAS-based and IFRS-based financial statement items andaccounting practices.
The data are from Finland for three main reasons. First, the transition reportingof Finnish entities is more extensive compared to that of other Europeancountries providing the data needed. Second, Finnish Accounting Standards(FAS) are similar to the DAS of other continental European countries. Therefore,Finland is a good example of a continental European country in this respect.Third, Finland has a strong system of legal enforcement and high-quality DAS(see La Porta
et
al
., 1998).
2
Therefore, we assume that the Finnish authorities providehigh-quality supervision and that the transition reporting is generally reliable.
1
The World Federation of Exchanges and the World Bank databases provide statistics onthe development of financial structures.
2
A system of legal enforcement consists of the efficiency of the judicial system, rule oflaw, corruption and risk of expropriation.

A.-M. Lantto, P. Sahlström/Accounting and Finance 49 (2009) 341–361 343
©
The AuthorsJournal compilation
©
2009 AFAANZ
The present paper contributes to the literature on the economic consequencesof IFRS adoption (e.g. Bartov
et
al
., 2005; Hope
et
al
., 2005; Daske and Gebhardt,2006; Ding
et
al
., 2006; Jones and Higgins, 2006; Barth
et
al
., 2008) byinvestigating the impact of IFRS adoption on key accounting ratios in a con-tinental European country. Moreover, we extend the existing literature (e.g.Callao
et
al
., 2007) calling for evidence about the direct effect of each standardon the accounting figures by showing which financial statement items and individualIFRS/IAS standards explain the differences in the key accounting ratios.
The results of the study indicate that the adoption of IFRS changes themagnitude of the key accounting ratios of Finnish companies. Only the value ofthe current ratio among the ratios investigated does not change significantlyafter converting from FAS to IFRS. We find that after converting financial statementsfrom FAS-based to IFRS-based, the profitability ratios increase by 9–19 per centand the price-to-earnings (PE) ratio decreases by 11 per cent. Moreover, theresults also imply a 2.9 per cent increase in gearing and a 0.7 per cent declinein equity ratio. In addition, quick ratio decreases by 0.2 per cent. Our resultsimply that the increases in the profitability ratios and decrease in the PE ratiocan be explained by increases in income statement profits. Moreover, the increasein debt items and decrease in equity explain the changes in the financial leverageratios. The decreases in liquidity ratios can mainly be explained by the increasein current liabilities. Our results indicate that the adoption of rules concern-ing fair value accounting, lease accounting and income tax accounting, as wellas rules concerning the accounting of financial instruments, explain the changesin the key accounting ratios.
The remainder of the present paper is organized as follows. The next sectionreviews the literature. Section 3 describes the research methodology, design anddata. Section 4 reports the results. Finally, concluding remarks are presented inSection 5.
2. The impact of IFRS adoption on accounting figures
Approximately 7000 publicly traded European firms were required to adoptIFRS in 2005. Most of the European adopting firms had previously appliedDAS, which differ from IFRS. Therefore, the adoption process is costly,complex and burdensome for European firms (Jermakowicz and Gornik-Tomaszewski, 2006). However, IFRS adoption is perceived to improve thefinancial transparency and comparability of financial statements betweenEuropean firms. This is supported by the finding of Hope
et
al
. (2005) thatcountries are more likely to adopt IFRS to improve investor protection, to maketheir capital market more accessible to foreign investors, and to improve thecomparativeness and comprehensiveness of their financial information. Priorstudies also show that the adoption of IFRS improves the accounting quality ofpublicly traded European firms (e.g. Daske and Gebhardt, 2006; Barth
et
al
.,2008). Overall, the adoption of IFRS seems to benefit investors, especially in

344 A.-M. Lantto, P. Sahlström/Accounting and Finance 49 (2009) 341–361
©
The AuthorsJournal compilation
©
2009 AFAANZ
countries like continental European countries where the information needs ofinvestors have not been the primary interest of standard setters.
Prior literature shows that in code-law countries, such as continental Europeancountries, capital provided by the state, banks or families tends to be moreimportant than in common-law countries, such as those of North America,where firms are mainly financed by a large number of private investors (e.g. LaPorta
et
al
., 1997). Therefore, whereas information asymmetry between capitalproviders and a firm is likely to be resolved in the continental Europeancountries by providing accounting information privately to the capital providers,in the North American countries it is likely to be resolved by providing high-quality public financial reporting (e.g. Nobes, 1998).
The accounting classification literature reports that the differences mentionedabove between financial systems across countries and the difference betweenways of resolving information asymmetry explain the differences betweenaccounting practices internationally. By investigating the financial reportingrules of 15 national systems, d’Arcy (2001) identifies two clusters: Europeanand a North American (including the IASC/IASB). D’Arcy (2001) finds that theNorth American cluster is more orientated to capital market users (i.e. accountingmethods are marked-orientated and require adequate presentation) than theEuropean cluster. Therefore, the level of differences between DAS and IFRS isespecially great in continental European countries (see Ding
et
al
., 2006).
2.1. Differences between IFRS and continental European accounting practices
By analysing Generally Accepted Accounting Principles (GAAP) 2001:‘A Survey of National Accounting Rules Benchmarked against InternationalAccounting Standards’ (Nobes, 2001), two reasons for the reported inconsistenciesbetween the DAS of continental European countries and IFRS can be found:comprehensiveness and capital market orientation. First, in many cases rulesthat are covered in IFRS are missing from DAS, or under DAS it might beoptional to follow the rules that are congruent with IFRS. Second, the domesticrules might follow the tax regulations, whereas the accounting methodsincluded in IFRS are capital market orientated. For instance, taxation is tied toaccounting in Finland, meaning that most of the tax incentives can be claimedonly if the same treatment is applied to the items in question in the commercialfinancial statements (see e.g. Näsi and Virtanen, 2003). Although IFRS emphasizesbalance sheet valuation (i.e. asset/liability recognition and measurement), DASin continental European countries are dependent on tax reporting considerationsand emphasize a prudent approach to asset valuation and liability recognition.Therefore, the domestic standards of continental European countries requiredifferent accounting and reporting treatments from IFRS in the following areas:employee benefits obligations (IAS 19), deferred tax (IAS 12), intangible assets(IAS 38), construction contracts (IAS 11), inventories (IAS 2), leases (IAS 17)and share-based payments (IFRS 2). Moreover, diverging from the DAS of

A.-M. Lantto, P. Sahlström/Accounting and Finance 49 (2009) 341–361 345
©
The AuthorsJournal compilation
©
2009 AFAANZ
continental European countries, IFRS requires/allows fair value accounting inthe following areas: property, plant and equipment (IAS 16), impairment ofassets (IAS 36), financial instruments (IAS 39), investment property (IAS 40),share-based payments (IFRS 2), biological assets (IAS 41) and pension assetsand liabilities (IAS 19).
IAS 19 requires employee benefit obligations to be measured at the presentvalue. However, rules concerning accounting for employee benefit obligationsare missing from DAS (e.g. Belgium, Denmark, Finland, France, Greece, Italyand Luxembourg) or the calculations follow tax regulations in accordance withDAS (e.g. Austria and Germany). Although IAS 12 requires a deferred taxliability to be recognized for all taxable temporary differences (some exceptions),rules concerning the treatment of deferred tax are missing from DAS (e.g.Greece, Luxembourg and Portugal) or the deferred tax is/can be calculated onthe basis of timing differences rather than temporary differences (e.g. Austria,Belgium, Finland, France, Germany and Spain). In addition, deferred tax assetsare not required/need not be recognized in accordance with many DAS (e.g.Austria, Belgium, Finland, Germany, Italy and Switzerland), while IAS 12requires a deferred tax asset to be recognized for all deductible temporarydifferences to the extent that is probable that the deductible temporary differencecan be utilized (some exceptions).
IAS 38 stipulates that an asset can be recognized when it will probably entailfuture benefits and when the cost of the asset can be reliably measured.Therefore, items such as research expenditures cannot be capitalized. However,in many cases, DAS (e.g. Austria, Belgium, Finland, France, Germany, Greece,Italy, Portugal and Spain) allow research costs and/or certain other internallygenerated intangible assets, including set-up/start-up/pre-operating costs orformation expenses, to be capitalized. Moreover, DAS (e.g. Finland) emphasizesprudent capitalization of development expenditures. As a consequence, thecapitalization of development expenditures under DAS might differ from thosecapitalized under IFRS.
Furthermore, while IAS 11 requires the costs and revenues of constructioncontracts to be recognized on a stage of completion basis, in accordance withmany DAS (e.g. Belgium, Finland, France, Greece, Italy and Portugal), recognitionby the stage of completion is optional. While IAS 2 requires inventory to bemeasured at the lower of cost and net realizable value, DAS (e.g. Austria,Finland, Germany, Greece, Italy, Luxembourg, Portugal and Spain) allows/requires inventories to be measured at the replacement cost instead of netrealizable value/costs. Moreover, according to DAS (e.g. Austria, Finland, Germanyand Luxembourg), inventories can be valued without the inclusion of productionoverheads, while IAS 2 requires inventory to be valued at full cost.
IFRS requires the transactions and events to be accounted for and presentedin accordance with their substance and economic reality and not merely theirlegal form (a concept named
substance over form
). However, DAS in continentalEuropean countries (EU) do not include the requirement and, therefore, the

346 A.-M. Lantto, P. Sahlström/Accounting and Finance 49 (2009) 341–361
©
The AuthorsJournal compilation
©
2009 AFAANZ
transactions and events might be accounted for and presented in accordancewith merely their legal form. Therefore, while IFRS (IAS 17) requires leases tobe accounted for and presented in accordance with their substance and economicreality, DAS do not include specific rules concerning accounting for leases (e.g.Italy and Portugal), DAS do not require the rules to be followed (e.g. Finlandand France) or leases are accounted for according to tax rules (e.g. Austria andGermany).
In 2003, the IASB issued the standard share-based payments (IFRS 2) tosecure a consistent way of reporting share-based payments. The standardchanged accounting practices, because few countries have standards on thetopic. It is typical that transactions in which share options are granted toemployees are not recognized in financial statements (e.g. in continentalEuropean countries). By contrast, the issued IFRS 2 requires an entity to reflectin its profit or loss and financial position the effects of share-based paymenttransactions. This includes expenses associated with transactions in whichshare-options are granted to employees.
Capital market-orientated IFRS emphasize fair value accounting, because itincorporates more information into the financial statements and, hence, makesthem more useful to investors. Therefore, the IASB considers fair value to bethe most relevant measurement basis. In addition to the above-mentionedpension liabilities (IAS 19), a substantial portion of other liabilities and assetsare required or allowed by IFRS to be measured at fair value. IFRS requiresassets/intangible assets impairments to fair value (IAS 36/IAS 38) and requiresfair value for most financial instruments (IAS 39) and for biological assets (IAS41). Moreover, IFRS requires tangible and intangible fixed assets that have beenacquired in a business combination (IFRS 3), pension assets (IAS 19) andshare-based payment liabilities (IFRS 2) to be measured at fair value. Afterinitial recognition IFRS allows investment property (IAS 40) and property,plant and equipment (IAS 16) to be measured at fair value. By contrast,accounting practices in continental European countries have traditionally beenbased on historical costs but required downward valuations for permanent impairmentsof long-term assets. In very rare cases there is a fair value measurement option.For instance, if the fair value of a land or water area or security is permanentlyand significantly higher than its historical cost, the Finnish legislation allowsthe measurement at market value. However, in 2001 the Internal MarketCouncil (EU) adopted Directive 2001/65/EC, which gives member states theoption to permit or require the use of fair value valuation methods to accountfor certain classes of financial instruments. The Directive was due to be transposedinto the national law of member states by January 2004.
In addition to fair value accounting, depreciation of assets in accordance withDAS might differ from that required by IFRS. Because IFRS emphasizes theimportance of presenting balance sheets at fair value, it requires assets withdefinite useful life to be depreciated/amortized systematically and assets withindefinite useful life to be assed for impairment. However, the DAS of continental

A.-M. Lantto, P. Sahlström/Accounting and Finance 49 (2009) 341–361 347
©
The AuthorsJournal compilation
©
2009 AFAANZ
European countries also requires assets with indefinite useful life to be amortized.Therefore, while IFRS requires goodwill to be assessed annually for impairment,DAS requires goodwill to be amortized systematically (e.g. Finland, France andItaly) or allows goodwill to be deducted immediately against equity (e.g. Austria,Germany, Greece and Luxembourg).
2.2. Impact of IFRS adoption on accounting figures in continental European countries
As earlier reported here, the domestic accounting standards of continentalEuropean countries differ considerably from the IFRS. Therefore, the adoptionof IFRS in continental European countries probably has an impact on theaccounting figures. As reported earlier, in many cases companies have an optionto report under IFRS, because DAS allows companies to use the same accountingtreatment as IFRS or, because the rules that are covered in IFRS are missing fromDAS. However, in these cases, it is impossible to predict the remaining impactof accounting reporting practice on accounting figures, because companies havean opportunity to choose whether they report under IFRS or not. Therefore, theimpact of these reported differences on accounting figures is an empirical question.
Because the DAS of continental European countries have mainly permittedvaluation of assets using historical cost methods, the adoption of fair valueaccounting probably has an impact on accounting figures. While DAS mainlyrequires downward valuations for permanent impairments of long-term assets,the adoption of fair value accounting will probably increase the balance sheetitems of adopting companies. However, the impairment accounting rules ofDAS (e.g. Austria, Finland and Germany) differ from those of IFRS (IAS 36)and, therefore, these differences could lead to different accounting figures. As aconsequence, the impact of fair value accounting adoption on accounting figures isalso an empirical question since it is impossible to predict the exact impact ofthe adoption on accounting figures.
3. Research methods, design and data
3.1. Research methods and design
The purpose of the present paper is to investigate whether there are changesin accounting numbers and key accounting ratios after conversion from DAS toIFRS. Therefore, we first analyse the differences between financial ratios calculatedbefore and after conversion from FAS to IFRS and test the statistical signi-ficances of the differences. Furthermore, if there are differences between thefinancial ratios calculated before and after the conversion, we investigate themain reasons for the differences using a two-step approach.
First, we investigate which of the financial statement items (i.e. the balancesheet items and income statement items) changed after the conversion from

348 A.-M. Lantto, P. Sahlström/Accounting and Finance 49 (2009) 341–361
©
The AuthorsJournal compilation
©
2009 AFAANZ
FAS to IFRS. Therefore, we calculate the differences between financial state-ment items before and after the conversion and test the statistical significanceof the differences. Moreover, we analyse these differences to explain which ofthem explain the differences in the financial ratios.
Second, we further investigate which of the IFRS/IAS standards cause thedifferences in the financial ratios. This is done by identifying the standardscausing the differences in the financial statement items and investigating whichof the identified IFRS/IAS cause statistically significant changes in FAS-basedfinancial ratios. To analyse the impact of the adopted standards in detail, weexamine which standards caused changes in the components of the ratio (i.e. thenumerator and denominator), separately and together. Therefore, we calculate therestated ratios by adding a specific standard, first, to the numerator of the ratio,then to the denominator of the ratio and finally to both. This allows us toexplore whether the differences between the ratios are mainly caused byrestatements in numerator, denominator or in both elements. Restated ratios canbe expressed as:
(1)
Furthermore, we calculate the difference between the FAS-based ratios and theratios restated by a specific IFRS/IAS standard. The difference between theratios can be expressed as:
=
R
IFRS/IAS
–
R
FAS
. (2)
We chose three different key economic dimensions of a firm (i.e. profitability,financial leverage and liquidity) to investigate the impact of IFRS adoption onaccounting numbers. Moreover, we investigate one financial market ratio due toits current importance in financial statement analysis. The profitability ratiosanalysed are operating profit margin (OPM), return on equity (ROE) and returnon invested capital (ROIC). Leverage is measured by equity ratio (ER) andgearing ratio (GR). In addition, liquidity ratios used in the study are currentratio (CR) and quick ratio (QR), and the market-based ratio analysed is price toearnings ratio (PE).
3.2. Data
IFRS 1 (First-time Adoption of International Financial Reporting Standards)requires entities to explain how the transition from previous GAAP to IFRSaffects its reported financial position, financial performance and cash flows. Thestandard requires, for instance, that an entity’s first IFRS financial statementsinclude reconciliations of its equity and profit or loss reported under previousGAAP to its equity and profit or loss under IFRS. IFRS 1 states the minimum
RNumerator standard
Denominator standardIFRS/IAS
FAS IFRS/IAS
FAS IFRS/IAS
.=
++

A.-M. Lantto, P. Sahlström/Accounting and Finance 49 (2009) 341–361 349
©
The AuthorsJournal compilation
©
2009 AFAANZ
requirements. In addition, the Committee of European Securities Regulators(CESR) has issued its recommendations for additional guidance regarding thetransition to IFRS. However, each national regulator could decide to go beyondand require full or partial compliance with the CESR guidelines. Therefore, thetransition reporting varies across countries.
We use the transition reports of Finnish entities in our study for three reasons.First, the Finnish Financial Supervision Authority (FIN-FSA) reports that thetransition reporting of Finnish entities was extensive compared to that of otherEuropean countries. We verified this issue by comparing the transitionreports of various European countries. The transition reports (reconciliationstatements) of Finnish entities include the FAS-based and IFRS-based financialstatement items and the differences between them. Moreover, they present theIFRS/IAS that cause those differences; that is, the effect (in euros) of eachstandard on a financial statement item. While the transition reports of Finnishentities present the effect of the IFRS/IAS on all important financial statementitems (see Panels B and C of Table 2), Italian listed companies, for example,only report the effect of IFRS/IAS on shareholders’ equity and net income (seeCordazzo, 2008). Therefore, the transition reports of Finnish entities providethe data needed to investigate not only the effect of the changes in financialstatement items, but also each IFRS/IAS, on financial ratios. Second, asreported in the earlier section, the accounting requirements of FAS are similarto the GAAP of other continental European countries. Therefore, the transitionfrom FAS to IFRS is a good example of the transition from DAS (of a continentalEuropean country) to IFRS. Third, Finland has a strong system of legal enforce-ment and high-quality DAS (see e.g. La Porta
et
al
., 1998). Therefore, weexpect that the Finnish authority will provide high-quality supervision and thatthe transition reporting is generally reliable in Finland compared to the othercountries.
The FIN-FSA required firms listed on the Helsinki Stock Exchange to reportthe effects of transition from FAS to IFRS. The data of the study were collectedfrom firms’ press releases (transition reports) where they present the majorchanges in accounting principles, convert from FAS to IFRS, and present theeffects of the transition from FAS to IFRS on consolidated financial statements(as described above). Overall, 125 firms were required to issue transitionreports in 2005. Moreover, six firms converted before 2004 and, therefore,issued their transition reports before 2005. Only the firms reporting all theinformation needed to calculate the seven financial ratios and one market-based financial ratio were included in the sample, which gives a final sampleof 91 firms. Most (i.e. 85 out of the 91 firms) converted in 2004. Five of thefirms converted in 2003 and one of the firms converted in 2002.The firmsrepresent almost all industries and all sizes (i.e. large, medium and small listedfirms).
In assessing the changes in accounting figures and the importance of eachstandard in explaining the observed chances in accounting figures, it should
350 A.-M. Lantto, P. Sahlström/Accounting and Finance 49 (2009) 341–361
©
The AuthorsJournal compilation
©
2009 AFAANZ
noted that there is a limitation in our data due to the exemptions from otherIFRS granted by IFRS 1. On the basis of IFRS 1, entities were not required toapply the standard Financial Instruments: Recognition and Measurement(IAS 39) until 1 January 2005. Therefore, our data include 24 entities that didnot apply IAS 39 until 1 January 2005. Therefore, our results might not tell thewhole truth about the consequences of IAS 39 adoption.
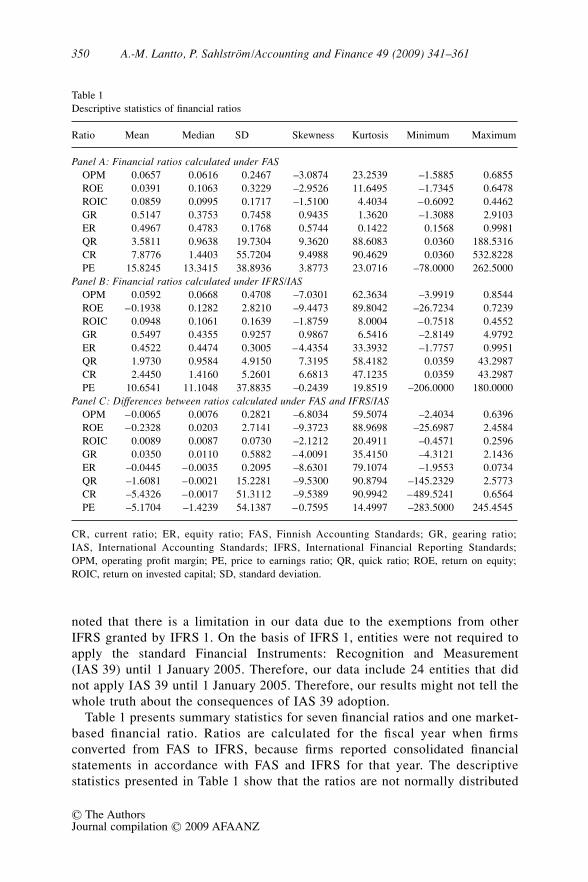
Table 1 presents summary statistics for seven financial ratios and one market-based financial ratio. Ratios are calculated for the fiscal year when firmsconverted from FAS to IFRS, because firms reported consolidated financialstatements in accordance with FAS and IFRS for that year. The descriptivestatistics presented in Table 1 show that the ratios are not normally distributed
Table 1Descriptive statistics of financial ratios
Ratio Mean Median SD Skewness Kurtosis Minimum Maximum
Panel A: Financial ratios calculated under FASOPM 0.0657 0.0616 0.2467 –3.0874 23.2539 –1.5885 0.6855ROE 0.0391 0.1063 0.3229 –2.9526 11.6495 –1.7345 0.6478ROIC 0.0859 0.0995 0.1717 –1.5100 4.4034 –0.6092 0.4462GR 0.5147 0.3753 0.7458 0.9435 1.3620 –1.3088 2.9103ER 0.4967 0.4783 0.1768 0.5744 0.1422 0.1568 0.9981QR 3.5811 0.9638 19.7304 9.3620 88.6083 0.0360 188.5316CR 7.8776 1.4403 55.7204 9.4988 90.4629 0.0360 532.8228PE 15.8245 13.3415 38.8936 3.8773 23.0716 –78.0000 262.5000
Panel B: Financial ratios calculated under IFRS/IASOPM 0.0592 0.0668 0.4708 –7.0301 62.3634 –3.9919 0.8544ROE –0.1938 0.1282 2.8210 –9.4473 89.8042 –26.7234 0.7239ROIC 0.0948 0.1061 0.1639 –1.8759 8.0004 –0.7518 0.4552GR 0.5497 0.4355 0.9257 0.9867 6.5416 –2.8149 4.9792ER 0.4522 0.4474 0.3005 –4.4354 33.3932 –1.7757 0.9951QR 1.9730 0.9584 4.9150 7.3195 58.4182 0.0359 43.2987CR 2.4450 1.4160 5.2601 6.6813 47.1235 0.0359 43.2987PE 10.6541 11.1048 37.8835 –0.2439 19.8519 –206.0000 180.0000
Panel C: Differences between ratios calculated under FAS and IFRS/IASOPM –0.0065 0.0076 0.2821 –6.8034 59.5074 –2.4034 0.6396ROE –0.2328 0.0203 2.7141 –9.3723 88.9698 –25.6987 2.4584ROIC 0.0089 0.0087 0.0730 –2.1212 20.4911 –0.4571 0.2596GR 0.0350 0.0110 0.5882 –4.0091 35.4150 –4.3121 2.1436ER –0.0445 –0.0035 0.2095 –8.6301 79.1074 –1.9553 0.0734QR –1.6081 –0.0021 15.2281 –9.5300 90.8794 –145.2329 2.5773CR –5.4326 –0.0017 51.3112 –9.5389 90.9942 –489.5241 0.6564PE –5.1704 –1.4239 54.1387 –0.7595 14.4997 –283.5000 245.4545
CR, current ratio; ER, equity ratio; FAS, Finnish Accounting Standards; GR, gearing ratio;IAS, International Accounting Standards; IFRS, International Financial Reporting Standards;OPM, operating profit margin; PE, price to earnings ratio; QR, quick ratio; ROE, return on equity;ROIC, return on invested capital; SD, standard deviation.

A.-M. Lantto, P. Sahlström/Accounting and Finance 49 (2009) 341–361 351
©
The AuthorsJournal compilation
©
2009 AFAANZ
and there is a considerable variation in ratios. Significant skewness and kurtosisclearly indicate that the data are non-normal. Prior research also reports thatfinancial ratios are non-normal (e.g. Ezzamel and Mar-Molinero, 1990).Because the descriptive statistics reveal that the distributions of ratios areextremely non-normal, non-parametric tests are used in the latter investigations.Therefore, we use the median values of the financial ratios and the financialstatement items in investigations and test the statistical significances of thedifferences using the sign test and the Wilcoxon signed-rank test. These tests donot require assumptions about the form of the distribution of the measurements.For the sign test, under the null hypothesis positive and negative changes indifferences are equally likely. The Wilcoxon test is used for testing the nullhypothesis that the sum of the positive ranks the sum of the negative ranksequally.
4. Results
4.1. Differences between the FAS-based and IFRS-based financial ratios
Panel A of Table 2 presents the median values of seven financial ratios andone market-based financial ratio calculated under FAS and IFRS. In addition,Table 2 reports the difference between the ratios and the statistical significancesof the differences. The results in Panel A indicate that only the differencebetween current ratios calculated under FAS and IFRS does not significantlydiffer from zero. However, all other differences are significantly (at the5 per cent level) different from zero. Moreover, the results indicate that afterfinancial statements have been converted from FAS-based to IFRS-based theprofitability ratios (i.e. OPM, ROE and ROIC) increase by 9–19 per cent. Theresults also imply a 2.9 per cent increase in GR and a 0.7 per cent decline inER. In addition, liquidity ratios (i.e. QR and CR) decrease by 0.1–0.2 per centand the market-based ratio (i.e. PE) decreases by 11 per cent. In general, theresults indicate that IFRS changes the magnitudes of the financial ratios andone market-based financial ratio considerably. The changes in the profitabilityratios and in the PE ratio are quite large from the practical point of view.
4.2. Explaining the differences in financial ratios by financial statement items
To investigate the main reasons for the differences between the FAS-basedand IFRS-based ratios, we first examine the differences between FAS-based andIFRS-based financial statement items. Panels B and C of Table 2 report themedian values of income statement and balance sheet items prepared in accordancewith FAS and IFRS, and the median values of the differences between them.Moreover, Table 2 also reports the statistical significances of the differences. Itmust be noted here that the change might be statistically significant eventhough the median value of the difference between FAS-based and IFRS-based

352 A.-M. Lantto, P. Sahlström/Accounting and Finance 49 (2009) 341–361
©
The AuthorsJournal compilation
©
2009 AFAANZ
item is zero due to the large number of firms in which the effect of transition iszero (e.g. sales and current debt (1 January)).
In general, the results reveal that most of the FAS-based and IFRS-based incomestatement and balance sheet items differ significantly at the 5 per cent level. Only
Table 2Medians of financial ratios and financial statement items (thousand euros)
FAS IFRS/IAS Difference P1 P2
Panel A: Financial ratiosOPM 0.0616 0.0668 0.0076 *** ***ROE 0.1063 0.1282 0.0203 *** ***ROIC 0.0995 0.1061 0.0087 *** ***GR 0.3753 0.4355 0.0110 ** ***ER 0.4783 0.4474 –0.0035 ** ***QR 0.9638 0.9584 –0.0021 ** **CR 1.4403 1.4160 –0.0017PE 13.3415 11.1048 –1.4239 *** ***
Panel B: Income statementSales 97 140 96 469 0 ** ***Operating profit 8896 9298 1064 *** ***Financial income and expenses –730 –779 –4 *** **Income taxes –2271 –2084 –20 ** **Net profit (loss) 7966 7586 800 *** ***
Panel C: Balance sheetAssetsInventories 12 290 9956 0Cash and cash equivalents 6601 6601 0Current assets 46 444 45 610 7Shareholder’s equity and liabilitiesEquity (1 January) 52 799 48 104 –627 *** ***Equity (31 December) 46 163 48 238 301Equity (average) 49 928 49 834 –8Long-term debt (1 January) 12 200 16 015 161 *** ***Long-term debt (31 December) 11 300 15 300 188 *** ***Long-term debt (average) 11 750 15 405 229 *** ***Current debt (1 January) 8161 8164 0 *** ***Current debt (31 December) 9900 10 281 61 *** ***Current debt (average) 9221 9549 48 *** ***Total equity and debt (average) 69 249 73 079 389 *** **Advances 11 600 11 600 0Total current liabilities 29 656 30 097 100 *** ***Total equity and liabilities (1 January) 79 573 83 310 1218 *** ***Total equity and liabilities (31 December) 84 848 95 247 2500 *** ***Total equity and liabilities (average) 85 442 93 844 2303 *** ***
** and *** indicate significance at 5 and 1 per cent levels, respectively. P1, probability of signstatistics; P2, probability of Wilcoxon signed-rank statistics. CR, current ratio; ER, equity ratio;FAS, Finnish Accounting Standards; GR, gearing ratio; IAS, International Accounting Standards;IFRS, International Financial Reporting Standards; OPM, operating profit margin; PE, price to earningsratio; QR, quick ratio; ROE, return on equity; ROIC, return on invested capital.

A.-M. Lantto, P. Sahlström/Accounting and Finance 49 (2009) 341–361 353
© The AuthorsJournal compilation © 2009 AFAANZ
the components of current assets (i.e. inventories, cash and cash equivalentsand current assets), equity (31 December), equity (average) and advances areunchanged. The results reveal a positive change in income statement numbers(i.e. higher profitability and lower expenses) and a negative change in balancesheet numbers (i.e. increase in debt items and decrease in equity). In addition,the results reveal that the total equity and liabilities increase after the change ofreporting standards.
After identifying the differences between the FAS-based and IFRS-basedfinancial statement items, we examine which of them explain the differencesin the financial ratios. Therefore, we compare the results presented in PanelsA–C. We find that the increase (12 per cent) in OPM is caused by a relativelygreater increase in the numerator (i.e. operating profit) than in the denominator(i.e. sales). The considerable (19 per cent) increase in ROE is explained byan increase in the numerator (i.e. net profit), meanwhile the denominator(i.e. equity (average)) of the ratio decreases, but not significantly. Moreover,ROIC increases (9 per cent) because the numerator of the ratio (i.e. operat-ing profit) increases relatively more than the denominator (i.e. total equityand debt (average)). The considerable (11 per cent) decrease in PE ratio iscaused by an increase in net profit. In general, the increases in the profitabilityratios (OPM, ROE and ROIC) and the decrease in the market-based financialratio (PE) can mainly be explained by the increases in the income statementprofits.
The negative change in balance sheet numbers (i.e. increase in debt itemsand decrease in equity) explains changes in financial leverage ratios as follows.A 2.9 per cent increase in GR is caused by a relatively greater increase in thenumerator (i.e. debt items (long-term debt and current debt)), than in thedenominator (i.e. equity (31 December)). In addition, ER decreases (0.7 per cent),because the numerator (i.e. equity (31 December)) increases, even though notsignificantly, relatively less than the denominator (i.e. total equity and liabilities(31 December)). The liquidity ratio (i.e. QR) decreases 0.2 per cent, becausethe denominator (i.e. total current liabilities) increases relatively more than thenumerator (i.e. current assets minus inventories).
4.3. Explaining the differences in financial ratios by the standards
After ascertaining which of the changes in the financial statement itemsexplain the differences in the financial ratios, we further investigate which ofthe IFRS cause the differences in the financial ratios. The results are reportedin Tables 3–5. We report all standards that changed the magnitude of the ratiossignificantly. Moreover, the effect of a standard on a numerator or a denominatorof the ratio is reported in different panels (i.e. Panels A and B). Panel C reportsthe effect of a standard on both elements of the ratio if the standard has aneffect on both of them and, finally, the effect of all standards that changed themagnitudes of the ratios significantly, together.

354 A.-M. Lantto, P. Sahlström/Accounting and Finance 49 (2009) 341–361
© The AuthorsJournal compilation © 2009 AFAANZ
4.3.1. Increases in profitability ratios and the decrease in price-to-earnings ratio
In this section we further investigate which of the IFRS explain the increasesin the profitability ratios and the decrease in the price-to-earnings ratio.Tables 3 and 4 report median values of the differences between FAS-based andIFRS-based ratios: OPM, ROE, ROIC and PE, respectively. The tables reportthe differences calculated before and after the restatement of the FAS-basedratio for a specific IFRS/IAS standard alone and all together. Moreover, thetables report the number of positive and negative values of the differences andthe statistical significances of the differences. It must be noted here that thechange might be statistically significant even though the median value of the
Table 3Impact of International Financial Reporting Standards/International Accounting Standards adoption on operating profit margin ratios, equity ratios and invested capital ratios
Standard
OPM ROE ROIC
Md1 Md2 + – P1 P2 Md1 Md2 + – P1 P2 Md1 Md2 + – P1 P2
Panel AIAS 2 0.000 0.000 7 16IAS 17 0.000 0.000 12 20IAS 19 0.000 0.004 40 5 *** *** 0.000 0.009 40 5 *** *** 0.000 0.006 40 5 *** ***IFRS 2 0.000 –0.002 2 20 *** *** 0.000 –0.005 2 20 *** *** 0.000 –0.002 2 20 *** ***IFRS 3 0.004 0.009 65 1 *** *** 0.013 0.022 64 1 *** *** 0.008 0.014 65 1 *** ***
Panel BIAS 2 0.000 –0.001 3 22 *** ***IAS 17 0.000 –0.001 15 38 *** ***IAS 19 0.000 0.001 43 12 *** *** 0.000 0.001 42 13 *** ***IFRS 2 0.000 0.000 4 5 0.000 0.000 4 5IFRS 3 0.000 –0.001 14 43 *** *** 0.000 0.000 13 44 *** ***IAS 16 0.000 0.002 19 2 *** *** 0.000 0.001 19 2 *** ***IAS 32 0.000 0.001 24 9 ** ** 0.000 0.001 21 9 ** **IAS 40 0.000 –0.003 1 7 **
Panel CIAS 2 0.000 –0.001 8 20 ** **IAS 17 0.000 –0.001 16 39 ** ***IAS 19 0.001 0.009 52 5 *** *** 0.000 0.005 51 6 *** ***IFRS 2 0.000 –0.004 2 22 *** 0.000 –0.002 2 22 *** ***IFRS 3 0.011 0.020 65 5 *** *** 0.008 0.012 66 5 *** ***
All 0.009 0.010 70 7 *** *** 0.024 0.027 71 15 *** *** 0.010 0.011 67 20 *** ***
** and *** indicate significance at the 5 and 1 per cent levels, respectively. Medians of the differencesbetween the Finnish Accounting Standards-based and the restated ratios are calculated for all firms(Md1) and by excluding those firms not affected by the adoption of the standard in question (Md2).P1, probability of sign statistics; P2, probability of Wilcoxon signed-rank statistics; IAS, InternationalAccounting Standards; IFRS, International Financial Reporting Standards; OPM, operating profitmargin; ROE, return on equity; ROIC, return on invested capital.

A.-M. Lantto, P. Sahlström/Accounting and Finance 49 (2009) 341–361 355
© The AuthorsJournal compilation © 2009 AFAANZ
difference between FAS-based and IFRS-based ratio is zero due to the largenumber of firms where the effect of transition is zero (e.g. IAS 19 and IFRS 2in Table 3). Therefore, the differences (medians) between FAS-based and IFRS-based ratios are also calculated by excluding those companies not affected bythe standard examined. Hence, these medians expressed as Md2 in the tablespresent the extent of the change more clearly.
In general, the results in Tables 3 and 4 show that restating the profitabilityratios and price-to-earnings ratio for employee benefits (IAS 19), share-basedpayment (IFRS 2) or business combinations (IFRS 3) changes the value of theratios. In other words, all these three standards have an effect on profitability
Table 4Impact of International Financial Reporting Standards/International Accounting Standards adoption on return on price to earnings ratios, quick ratios and current ratios
Standard
PE QR CR
Md1 Md2 + – P1 P2 Md1 Md2 + – P1 P2 Md1 Md2 + – P1 P2
Panel AIAS 2 0.000 0.019 24 5 *** ***IAS 17 0.000 0.013 1 1 0.000 0.013 2 2IAS 19IFRS 2IFRS 3
Panel BIAS 12 0.000 –0.030 0 4 ** **IAS 2IAS 17 0.000 0.009 20 12 ** 0.000 –0.011 0 32 *** *** 0.000 –0.016 0 32 *** ***IAS 19 0.000 –0.999 5 39 *** ***IFRS 2 0.000 0.328 20 2 ** ***IFRS 3 –0.900 –1.506 1 64 *** ***IAS 16IAS 32IAS 39 0.000 –0.023 0 6 ** ** 0.000 –0.032 0 6 *** ***IAS 40
Panel CIAS 2IAS 17 0.000 –0.424 1 31 *** 0.000 –0.016 1 31 *** ***IAS 19IFRS 2IFRS 3
All –1.407 –1.605 11 69 *** *** 0.000 –0.012 1 34 ** *** 0.000 –0.019 0 35 *** ***
** and *** indicate significance at the 5 and 1 per cent levels, respectively. Medians of the differencesbetween the Finnish Accounting Standards-based and the restated ratios are calculated for all firms(Md1) and by excluding those firms not affected by the adoption of the standard in question (Md2).P1, probability of sign statistics; P2, probability of Wilcoxon signed-rank statistics. CR, current ratio;IAS, International Accounting Standards; IFRS, International Financial Reporting Standards; PE, priceto earnings ratio; QR, quick ratio.

356 A.-M. Lantto, P. Sahlström/Accounting and Finance 49 (2009) 341–361
© The AuthorsJournal compilation © 2009 AFAANZ
ratios (i.e. OPM, ROE and ROIC) and PE ratio. The results in Table 3 showthat IAS 19 and IFRS 3 have positive and IFRS 2 negative impacts on threeprofitability ratios. By contrast, the results in Table 4 show that IAS 19 andIFRS 3 have negative and IFRS 2 positive impacts on PE ratio. The results inTables 3 and 4 show that the impact of IFRS 3 on the values of the ratios is thestrongest. In other words, after restating OPM, ROE, ROIC or PE ratio forIFRS 3, the median value of the ratio increases or decreases the most.
The results in Table 3 show that the considerable (12 per cent) increase inOPM can be mainly explained by the increasing impact of IAS 19 and IFRS 3and the decreasing impact of IFRS 2 in the numerator. The effects of IFRS onthe denominator of OPM are not statistically significant. The results in Table 3show that, in addition to these three standards, property, plant and equipment(IAS 16) and financial instruments: disclosure and presentation (IAS 32) have asignificant impact on ROE. By restating the denominator for IAS 16 or IAS 32,the value of ROE increases. Moreover, the results in Table 3 indicate thatIFRS 3 has an increasing impact on the numerator and a decreasing impact onthe denominator. However, the impact of IFRS 3 is stronger on the numeratorthan on the denominator. As a consequence, by restating ROE for IFRS 3 thevalue of the ratio increases. Overall, the considerable (19 per cent) increase inROE can be explained by the increasing impacts of IAS 19, IFRS 3, IAS 16 andIAS 32.
The results in Table 3 show that the same standards that have an increasing/decreasing impact on ROE have an increasing/decreasing impact on ROIC.However, the results also show that, in addition to these five standards, inventories(IAS 2), leases (IAS 17) and investment property (IAS 40) change the value ofROIC significantly. The results in Panel C show that by restating the numeratorand the denominator for IAS 2 or IAS 17, the value of ROIC decreases. Moreover,there is some indication that IAS 40 also has a decreasing impact on thedenominator. By restating the denominator for IAS 40, the value of ROICdecreases, even though the sign statistics do not give significant results at the5 per cent level. The results in Panels A and B show that all restatements on thenumerator or the denominator caused by IAS 2 or IAS 17 have a decreasingimpact on ROIC. Overall, due to the decreasing impact of IAS 2, IAS 17 andIAS 40, ROIC increases less than ROE after financial statements have beenconverted from FAS-based to IFRS-based.
The results in Table 4 show that the considerable (11 per cent) decrease in PEratio is mainly caused by IAS 19 and IFRS 3. In addition, the results show thatIAS 17 and IFRS 2 have an increasing impact on PE. However, the resultsindicate that the decreasing impact of IAS 19 and IFRS 3 is stronger than theincreasing impact of IAS 17 and IFRS 2. Moreover, the results show that theWilcoxon signed-rank statistics for IAS 17 do not give significant results atthe 5 per cent level.
In summary, there are four standards that explain the increases in the profitabilityratios and the decrease in the PE ratio. The adoption of the rules concerning the

A.-M. Lantto, P. Sahlström/Accounting and Finance 49 (2009) 341–361 357
© The AuthorsJournal compilation © 2009 AFAANZ
measurement of employee benefit obligations at the present value (IAS 19)increases income statement profits and decreases equity and invested capital.In addition, the adoption of fair value accounting rules concerning businesscombinations (IFRS 3) increases income statement profits considerably andequity and invested capital slightly due to the requirement to assess goodwillfor impairment annually instead of amortizing it systematically. As a consequence,the adoption of IAS 19 and IFRS 3 increases the profitability ratios anddecreases the PE ratio. In addition, the adoption of the fair value measurementrules for property, plant and equipment (IAS 16) and the classification rules forfinancial instruments (IAS 32) decrease equity and invested capital and, therefore,increase ROIC and ROE.
By contrast, there are also four standards that diminish the increasing impactof the above-mentioned four standards. The requirement to recognize share-basepayments (share options) in the financial statement and to measure them at fairvalue (IFRS 2) decreases income statement profits and decreases (increases) theprofitability ratios (PE ratio). In addition, the adoption of the measurementrules for inventories (IAS 2), accounting rules of leases (IAS 17) and fair valuemeasurement rules of investment property (IAS 40) increase invested capitaland, hence, decrease ROIC.
4.3.2. The decreases in liquidity ratios
In this section we examine which of the IFRS explain the decreases in liquidityratios. Table 4 reports the results of restating FAS-based QR and CR for threestandards. The results in Table 4 show that the 0.2 per cent decrease in QR canbe explained by the decreasing impact of IAS 17 and IAS 39 on the denominatorof QR. The results in Table 4 indicate that in addition to IAS 17 and IAS 39,IAS 12 also has a decreasing impact on CR. Moreover, the results in Panel Ashow that IAS 2 has an increasing impact on CR in the numerator. In summary,the decreases in liquidity ratios can mainly be explained by the decreasingimpact of leases (IAS 17).
4.3.3. The increase in gearing ratio and the decrease in equity ratio
In this section we examine which standards change the financial leverageratios after conversion from FAS to IFRS. Table 5 reports the results of restatingthe FAS-based financial leverage ratios (GR and ER) for nine standards. Theresults in Panel C of Table 5 show that construction contracts and revenue(IAS 11 and 18), leases (IAS 17), employee benefits (IAS 19) and financialinstruments (IAS 32 and 39) increase the value of GR. By comparing the resultsin Panels A and B we find that a 2.9 per cent increase in GR is mainly explainedby the restatement of the numerator for IAS 17 and the denominator for IAS 19and IAS 32 and 39. Moreover, the results show that IAS 11 and 18 do not havea significant effect on the numerator or the denominator individually, but there

358 A.-M. Lantto, P. Sahlström/Accounting and Finance 49 (2009) 341–361
© The AuthorsJournal compilation © 2009 AFAANZ
Table 5Impact of International Financial Reporting Standards/International Accounting Standards adoption on gearing ratios and equity ratios
Standard
GR ER
Md1 Md2 + – P1 P2 Md1 Md2 + – P1 P2
Panel AIAS 11, 18 0.000 0.178 2 0IAS 2 0.000 0.005 20 3 *** ***IAS 17 0.000 0.025 37 0 *** *** 0.000 –0.001 8 22 ** ***IAS 19 0.000 –0.033 0 4 0.000 –0.004 7 35 *** ***IAS 36 0.000 –0.021 0 15 *** ***IAS 38 0.000 0.008 12 2 ** ***IFRS 3 0.002 0.009 49 1 *** ***IAS 16 0.000 –0.006 3 15 *** ***IAS 12 0.000 0.000 33 31IAS 32, 39 0.000 0.034 14 5 *** 0.000 –0.010 1 26 *** ***
Panel BIAS 11, 18 0.000 0.002 11 4IAS 2 0.000 –0.004 5 18 ** *** 0.000 –0.002 3 20 *** ***IAS 17 0.000 0.001 18 12 0.000 –0.004 5 42 *** ***IAS 19 0.000 0.001 29 13 ** *** 0.000 –0.001 15 27 **IAS 36 0.000 0.008 15 0 *** ***IAS 38 0.000 –0.002 2 12 ** ***IFRS 3 0.000 –0.006 15 35 *** *** –0.001 –0.003 1 49 *** ***IAS 16 0.000 0.002 15 4 ** ***IAS 12 –0.001 –0.002 13 63 *** ***IAS 32, 39 0.000 0.001 34 15 *** ** 0.000 0.003 22 6 *** ***IAS 40 0.000 –0.128 0 6 ** **
Panel CIAS 11, 18 0.000 0.003 12 4 ***IAS 2 0.000 0.003 20 3 *** ***IAS 17 0.000 0.019 42 4 *** *** 0.000 –0.005 4 43 *** ***IAS 19 0.000 0.001 28 15 *** *** 0.000 –0.003 7 43 *** ***IAS 36 0.000 –0.009 0 15 *** ***IAS 38 0.000 0.003 12 2 ** ***IFRS 3 0.001 0.005 49 1 *** ***IAS 16 0.000 –0.003 3 16 *** ***IAS 12 –0.001 –0.002 26 53 *** ***IAS 32, 39 0.000 0.003 38 17 ** ** 0.000 –0.005 2 27 *** ***
All 0.006 0.009 54 29 *** *** –0.005 –0.005 23 66 *** ***
** and *** indicate significance at the 5 and 1 per cent levels, respectively. Medians of the differencesbetween the Finnish Accounting Standards-based and the restated ratios are calculated for all firms(Md1) and by excluding those firms not affected by the adoption of the standard in question (Md2).P1, probability of sign statistics; P2, probability of Wilcoxon signed-rank statistics. IAS, Inter-national Accounting Standards; IFRS, International Financial Reporting Standards; ER, equity ratio;GR, gearing ratio.

A.-M. Lantto, P. Sahlström/Accounting and Finance 49 (2009) 341–361 359
© The AuthorsJournal compilation © 2009 AFAANZ
is some indication that their combined effect increases the value of GR. Theresults in Panel B also show that restatement of the denominator for IAS 2,IAS 40 and IFRS 3 has a decreasing impact on GR.
By comparing the results in Table 5, we find that while IAS 17, IAS 19 andIAS 32 (IAS 2 and IFRS 3) have an increasing (decreasing) impact on GR, theyhave the opposite impact on ER. In addition to these five standards, property,plant and equipment (IAS 16), impairment of assets (IAS 36) and income taxes(IAS 12) have a decreasing and intangible assets (IAS 38) an increasing impacton ER. The results in Panels A and B of Table 5 show that while IAS 17 andIAS 19 have a decreasing impact on both elements of ER, the remaining sevenstandards have an opposite impact on the numerator than on the denominator.However, the impact of these seven standards is greater in the numerator thanin the denominator except for income taxes (IAS 12). The results in Panel Creveal that IAS 12 has the strongest decreasing impact on ER. In summary,the decrease in ER can mainly be explained by the decreasing impact of thesesix standards.
In summary, the increase in GR can mainly be explained by the accountingrequirements of leases (IAS 17), the requirement to measure employee benefitobligations at the present value (IAS 19) and the requirement to follow theclassification rules of financial instruments (IAS 32 and 39). Moreover, there issome indication that the requirement to recognize contract revenues andexpenses in accordance with IAS 11 and revenues arising in the course ofordinary activities in accordance with IAS 18 has an increasing impact on GR.In addition to IAS 17, IAS 19 and IAS 32 that have decreasing (increasing)impact on ER (GR), the requirement to test assets for impairment (IAS 36), theadoption of measurement rules of property, plant and equipment (IAS 16) andthe requirement to recognize deferred tax liabilities or assets for all taxabletemporary differences (some exceptions) (IAS 12) have a decreasing impact on ER.
However, the impact of the above-mentioned standards on the financial leverageratios is mitigated by the requirement/permission to measure inventories inaccordance with IAS 2, to measure investment property at fair value (IAS 40),to measure acquired assets and liabilities at fair value and to assess goodwill forimpairment annually (IFRS 3) and to recognize intangible assets in accordancewith IAS 38.
5. Summary and conclusions
Our study provides evidence of the impact of IFRS adoption on accountingnumbers and on the key financial ratios used by financial analysts, investors andother financial institutions as key performance indicators. The present papercontributes to the literature investigating the economic consequences of IFRSadoption (e.g. Bartov et al., 2005; Hope et al., 2005; Daske and Gebhardt,2006; Ding et al., 2006; Barth et al., 2008) in two respects. First, we extend theliterature by showing how key financial ratios change after the conversion from

360 A.-M. Lantto, P. Sahlström/Accounting and Finance 49 (2009) 341–361
© The AuthorsJournal compilation © 2009 AFAANZ
DAS to IFRS in Finland, in the continental European context. Second, byexamining the changes in financial statement items and identifying the IFRS/IAS standards that change the ratios, we explain the reasons for the changes inthe ratios. Whereas Ding et al. (2006) provides evidence on the significance ofIFRS adoption by reporting the main differences between DAS and IFRS, wefurther illustrate the differences in more detail in continental European countriesand demonstrate the impact of the adoption on accounting figures in Finland.
To find empirical evidence on the issue we create a comprehensive databaseof financial statement information prepared under DAS and IFRS from thepublished transition reports. We measure the impact of IFRS adoption on keyfinancial ratios in Finland, because the transition reporting of Finnish entities isextensive enough for our purposes and overall, more extensive compared to thatof other European countries. Moreover, the accounting requirements of theFAS are similar to that of the DAS of other continental European countries,meaning that Finland is a good example of a continental European country inthis respect. Furthermore, based on prior studies (e.g. La Porta et al., 1998), weassume that the Finnish Authority provides high-quality supervision and thatthe transition reporting is generally reliable.
The results of the present study indicate that the adoption of IFRS changesthe magnitudes of the key accounting ratios of Finnish companies by considerablyincreasing the profitability ratios and gearing ratio moderately, and considerablydecreasing the PE ratio and equity and quick ratios slightly. Our results indicatethat the increases in the profitability ratios and the decrease in the PE ratio canbe explained by increases in the income statement profits. Moreover, our resultsare consistent with those of Jones and Higgins (2006) suggesting that theremoval of the amortization of purchased goodwill under IFRS 3 is the mostimportant reason for a considerable increase in profitability ratios. Our resultsalso indicate that the increase in debt items and decrease in equity explain thechanges in the financial leverage ratios. Moreover, the decreases in liquidityratios can mainly be explained by the increase in current liabilities. Overall, ourresults indicate that the adoption of rules concerning fair value accounting,lease accounting and income tax accounting, as well as rules concerning theaccounting of financial instruments, explain the changes in the key accountingratios. In summary, the adoption of fair value accounting rules and stricterrequirements concerning certain accounting issues are the reasons for thechanges observed in accounting figures and financial ratios.
References
Barth, M. E., W. Landsman, and M. Lang, 2008, International Accounting Standards andaccounting quality, Journal of Accounting Research 46, 467–498.
Bartov, E., S. Goldberg, and M. Kim, 2005, Comparative value relevance among German,U.S. and International Accounting Standards: a German stock market perspective,Journal of Accounting, Auditing and Finance 20, 95–119.

A.-M. Lantto, P. Sahlström/Accounting and Finance 49 (2009) 341–361 361
© The AuthorsJournal compilation © 2009 AFAANZ
Callao, S., J. I. Jarne, and J. A. Laínez, 2007, Adoption of IFRS in Spain: effect on thecomparability and relevance of financial reporting, Journal of International Accounting,Auditing and Taxation 16, 148–178.
Cordazzo, M., 2008, The impact of IAS/IFRS on accounting practices: evidence from Italianlisted companies, working paper (Free University of Bozen-Bolzano, Bolzano, Italy).
d’Arcy, A., 2001, Accounting classification and international harmonization debate – anempirical investigation, Accounting Organization and Society 26, 327–349.
Daske, H., and G. Gebhardt, 2006, International financial reporting standards and experts’perceptions of disclosure quality, Abacus 42, 461–498.
Ding, Y., O.-K. Hope, T. Jeanjean, and H. Stolowy, 2006, Differences between domesticAccounting Standards and IAS: measurement, determinants and implications, Journal ofAccounting and Public Policy 26, 1–38.
Ezzamel, M., and C. Mar-Molinero, 1990, The distributional properties of financial ratios inUK manufacturing companies, Journal of Business Finance and Accounting 17, 1–29.
Hope, O.-K., J. Jin, and T. Kang, 2005, Empirical evidence on jurisdictions that adoptIFRS, Journal of International Accounting Research 5, 1–20.
Jermakowicz, E. K., and S. Gornik-Tomaszewski, 2006, Implementing IFRS from theperspective of EU publicly traded companies, Journal of International Accounting,Auditing and Taxation 15, 170–196.
Jones, S., and A. D. Higgins, 2006, Australia’s switch to international financial reportingstandards: a perspective from account preparers, Accounting and Finance 46, 629–652.
La Porta, R., F. Lopez-de-Silanes, A. Shleifer, and R. W. Vishny, 1997, Legal determinantsof external finance, Journal of Finance 3, 1131–1150.
La Porta, R., F. Lopez-de-Silanes, A. Shleifer, and R. W. Vishny, 1998, Law and finance,Journal of Political Economy 106, 1113–1155.
Näsi, S., and A, Virtanen, 2003, Chapter 5: Finland, in: D. Alexander and S. Archer, eds,The European Accounting Guide, 5th edn (Aspen Publishers Inc., Gathersburg), 250–288.
Nobes, C., 1998, Towards a general model of the reasons for the international differences infinancial reporting, Abacus 34, 162–187.
Nobes, C. W. (Ed.), 2001, GAAP 2001 – A Survey of National Accounting Rules BenchmarkedAgainst International Accounting Standards, available at http://www.iasplus.com/resource/gaap2001.pdf.