impact of introducing an electronic physiological …...impact of introducing an electronic...
TRANSCRIPT
Impact of introducing an electronic physiological surveillance system on hospital mortality
Paul E Schmidt, MRCP, Consultant in Acute Medicine, Portsmouth Hospitals NHS Trust, Portsmouth PO6 3LY, UK Paul Meredith, PhD, Information Analyst, Portsmouth Hospitals NHS Trust, Portsmouth PO6 3LY, UK David R Prytherch, PhD, Clinical Scientist, TEAMS centre, Portsmouth Hospitals NHS Trust, Portsmouth PO6 3LY, UK & Visiting Professor, School of Computing, University of Portsmouth, Portsmouth PO1 3HE, UK Duncan Watson, FRCA, Consultant in Intensive Care Medicine and Anaesthesia, University Hospitals Coventry and Warwickshire NHS Trust, Coventry CV2 2DX, UK Valerie Watson, RN, Lead Nurse Critical Care Outreach, University Hospitals Coventry and Warwickshire NHS Trust, Coventry CV2 2DX, UK Roger M Killen, MBA, CEO, The Learning Clinic, 7 Lyric Square, London W6 0ED, UK Peter Greengross, FFPH, Honorary Senior Clinical Research Fellow, Department of Primary Care and Public Health, Imperial College Healthcare NHS Trust, London W6 8R, UK & Medical Director, The Learning Clinic, 7 Lyric Square, London W6 0ED, UK Mohammed A Mohammed, PhD, Professor of Healthcare, Quality & Effectiveness, School of Health Studies, University of Bradford, Bradford BD7 1DP, UK Gary B Smith, FRCP, Visiting Professor, School of Health & Social Care, University of Bournemouth, Bournemouth BH1 3LT, UK Corresponding author: Professor G B Smith, FRCA, FRCP, Centre of Postgraduate Medical Research & Education (CoPMRE), The School of Health & Social Care, Bournemouth University, Royal London House, Christchurch Road, Bournemouth, Dorset BH1 3LT, United Kingdom Tel: +44 (0) 1202 962782 Email: [email protected] Word count: 3616 Figures: 4 Tables: 1 Key words: Mortality Monitoring, Physiologic Technology Vital signs Failure to rescue
1

ABSTRACT
Background: Avoidable hospital mortality is often attributable to inadequate patient vital
signs monitoring, and failure to recognise or respond to clinical deterioration. The processes
involved with vital sign collection and charting; their integration, interpretation and analysis;
and the delivery of decision support regarding subsequent clinical care are subject to potential
error and/or failure.
Objective: To determine whether introducing an electronic physiological surveillance system
(EPSS), specifically designed to improve the collection and clinical use of vital signs data,
reduced hospital mortality.
Methods: A pragmatic, retrospective, observational study of seasonally adjusted in-hospital
mortality rates in three main hospital specialties was undertaken before, during and after the
sequential deployment and ongoing use of a hospital-wide EPSS in two large unconnected
acute general hospitals in England. The EPSS, which uses wireless handheld computing
devices replaced a paper-based vital sign charting and clinical escalation system.
Results: During EPSS implementation, crude mortality fell from a baseline of 7.75%
(2168/27959) to 6.42% (1904/29676) in one hospital [estimated 397 fewer deaths], and from
7.57% (1648/21771) to 6.15% (1614/26241) at the second [estimated 372 fewer deaths]. At
both hospitals, multi-year statistical process control analyses revealed abrupt and sustained
mortality reductions, coincident with the deployment and increasing use of the system. The
cumulative total of excess deaths reduced in all specialties with increasing use of the system
across the hospital.
2

Conclusions: The use of technology specifically designed to improve the accuracy,
reliability and availability of patients’ vital signs and early warning scores, and thereby the
recognition of and response to patient deterioration, is associated with reduced mortality in
this study.
3

BACKGROUND
Failure to recognise and respond to patient deterioration in hospital is considered a major
cause of avoidable morbidity and mortality.1-5 One of the initial steps in identifying
deterioration involves the measurement of vital signs.6,7 For most patients on general wards,
routine vital signs measurement is undertaken manually and intermittently, with or without
automated machines, at intervals based on the patients’ severity of illness.4,7-9 Vital signs data
are generally recorded on paper charts placed at the end of the patients’ beds or in their
rooms. These processes are subject to potential error and/or failure, such as inadequate
monitoring frequency;1-3,5,10-12 incomplete data;1,10,13 inaccurate early warning score (EWS)
calculations;14-17 and poor legibility and interpretability of charts.18,19 ; all of which have been
implicated in the failure to recognize, or respond to, patient deterioration.1-3,5
We postulated that an appropriately designed clinical information technology (IT) system
could improve the reliability of collecting and charting vital signs; their integration,
interpretation and analysis; and the delivery of decision support regarding subsequent clinical
care. Therefore, staff from Queen Alexandra Hospital (QAH), Portsmouth and The Learning
Clinic Ltd. (TLC), London used existing knowledge, research data and National Institute for
Health and Care Excellence (NICE) recommendations4 to design an electronic physiological
surveillance system (EPSS)20 - VitalPAC - with the specific objectives of improving the
accuracy, reliability, availability and clinical impact of patients’ vital signs datasets and EWS
records. The EPSS was subsequently deployed across QAH and a second, acute general
hospital in England - University Hospital Coventry (UHC) - in phased rollouts on each site.
We report an observational study of the temporal changes in hospital mortality associated
with the implementation of the EPSS in the two hospitals.
4
METHOD
Ethical Committee Approval
The Isle of Wight, Portsmouth and South East Hampshire Research Ethics Committee (study
ref. 08/02/1394) approved the study.
The electronic physiological surveillance system (EPSS)20
The EPSS - VitalPAC - is specially designed software that prompts nurses to record a
complete set of vital signs at the patient’s bedside at appropriate intervals on handheld
computing devices. For each vital sign, the EPSS takes the measured physiological value and
the locally embedded aggregate weighted early warning scoring system (which were different
at QAH and UHC) to assign a weighting, based on the derangement of the physiological
value from an arbitrarily agreed ‘normal’ range. The EPSS automatically and accurately
calculates the patient’s EWS and provides instant bedside decision support on a graded basis
according to the EWS value to staff.20 This includes when the next set of vital signs is due;
whether care should be escalated to senior staff (e.g., rapid response team (RRT)21); and the
required speed of any response. These messages are delivered directly to the handheld device
in use by the staff at the bedside via standard colour-coded screen messages. The devices
communicate wirelessly with the hospital’s computer system. They routinely record the vital
signs data in a clear and easily interpreted electronic record that can be viewed anywhere in
the hospital by staff with the appropriate access rights, using mobile or fixed computers
linked to the hospital intranet.20 The EPSS also pulls in data from the hospital patient
administration system, laboratory results, and other clinical information stored electronically.
5

Setting and Intervention:
QAH and UHC are large (>1000 bed) acute general hospitals approximately 240km apart in
England. An acute care educational programme for ward staff,22 the use of a paper-based
EWS system23 and a RRT21 were all well established in each hospital, many years before the
implementation of the EPSS. EPSS implementation at the hospitals differed in several
aspects. Vital signs charts were viewable on wireless PC tablets and desktop PCs at QAH, but
only on desktop PCs on wards at UHC. The EPSS software used the locally embedded EWS
(which were different at QAH and UHC). The EPSS was implemented sequentially in wards,
although the speed and order differed at each hospital. As EPSS implementation proceeded to
each ward, vital signs charting there became electronic and paper-based charting ceased.
QAH
Following a pilot period of 14 months during which the system was developed, QAH
deployed the EPSS to the Acute Medicine Unit (AMU) in May 2006 and then the
Surgical Assessment Unit (SAU) in January 2007. The EPSS was implemented on a
single medical ward in June 2008 and three high-risk medical wards (cardiology,
pulmonology and elderly care) in February 2009. Further deployment across the
hospital was delayed until after the opening of a new hospital wing on 15th June 2009.
Thereafter, hospital-wide rollout continued in the following order - medical; surgical;
trauma and orthopaedic (T&O) wards - and was completed in December 2009. During
the implementation process (February - December 2009), a team of one whole time
equivalent (WTE) nurse, 0.25 WTE trainers provided by TLC, and 0.2 WTE physicians
facilitated user training at QAH. After deployment, the nurse was available for post-
deployment issues such training, support, and operational policies for a further seven
months.
6

UHC
UHC conducted a single-ward pilot (May 2007 - February 2008) before rolling out the
EPSS on all adult inpatient wards, in no particular specialty order, from March 2008.
Deployment to the UHC emergency admissions unit (EAU), which admits acute
medical emergencies, was completed in April 2009. The remaining surgical and T&O
wards implemented the EPSS late in 2009. A team of 6 WTE nurses provided user
training and support at UHC for a total of 6 months.
The EPSS was not implemented in the maternity wards, paediatric units and intensive care
units at either site.
Data collection and sources of data:
We collected two key items of data: a measure of EPSS implementation and hospital
mortality.
Measure of EPSS implementation
We used the number of observations sets recorded per month to track the
implementation of the EPSS.
Hospital mortality
The UK National Health Service (NHS) uses outcome data from 56 diagnosis groups
(which account for 83% of inpatient deaths in England) to monitor and compare
hospital performance.24 We analysed monthly observed mortality data from these
diagnosis groups at QAH and UHC from July 2004 to June 2011. Admission data were
7

obtained for both hospitals by means of the ‘Real Time Monitoring’ tool (Dr Foster
Intelligence, London).25 Our numerator is the count of deaths at the point of discharge.
Day case spells (inpatient admissions where the intention was to treat and discharge on
the same day, and this was achieved) were excluded from the denominator; day case
deaths were retained in the numerator.
The overall pre-intervention average crude mortality rate for the aforementioned
collection of 56 diagnosis groups was used to calculate the expected deaths in the
intervention and post-intervention years based on the number of admissions with the
relevant diagnoses in those years. Avoided deaths are equal to the difference between
the observed and expected deaths in each calendar year.
Data analysis:
Crude monthly and annual mortality rates were calculated with 95% confidence intervals
based on the normal approximation for binomial proportions. Statistical analyses were
performed using Microsoft Excel 2007 (Microsoft Corporation, USA), and Stata/IC 11.1
(StataCorp LP, USA). The mortality data were used in two ways:
Method 1: Multi-year trend analysis
Seasonally adjusted, monthly, statistical process control charts26 of hospital mortality
were produced for both hospitals from July 2004 to July 2011 inclusive and were
studied for a persistent change in the run of data points around the mean (i.e., evidence
of special cause change). Upper (ucl) and lower control limits (lcl) were, as usual, set at
3 standard deviations from the mean. Seasonal variation was removed to emphasise the
underlying trend and help identify any special cause change. Adjusting for seasonality
8

required the calculation of monthly factors from the seven years of data by means of a
weighted 13-month moving average used as a symmetric filter. This yielded six years
of monthly factors (since the first and last six months do not meet the centering
requirement), which were used to remove the seasonal variation in deaths. Using a
similar process, monthly admissions data were seasonally adjusted to derive a
seasonally adjusted mortality rate (SA-MR) for each hospital.
Method 2: Analysis of deaths occurring in specialties
The seasonally adjusted deaths from July 2004 to July 2011 for Medicine, Surgery, and
T&O were analysed using a CUSUM method,27 plotting the cumulative monthly
difference between expected deaths and the seasonally adjusted observed deaths. For
each month, and each specialty group, expected deaths were calculated as the product
of the mean mortality rate for the whole period over which the CUSUM is plotted (i.e.,
July 2004-July 2011) and the seasonally adjusted admissions for the month. “Medicine”
included Cardiology, Diabetic Medicine, Endocrinology, Gastroenterology, General
Medicine, Geriatric Medicine, Infectious Diseases, Nephrology, Neurology,
Respiratory Medicine, Rheumatology, Clinical Haematology and Oncology. “Surgery”
included General, Breast, Cardiothoracic, Colorectal, Hepatobiliary & Pancreatic
Surgery, Neurosurgery, Plastics, Renal Surgery, Transplantation, Upper
Gastrointestinal, Urology, and Vascular Surgery. Control limits were added using the
method described by Grunkemeier et al.28
9

RESULTS
During implementation of EPSS across QAH, crude mortality fell from 7.75% (2168/27959)
at baseline (2004) to 6.42% (1904/29676) after implementation (2010) (p <0.0001), with an
estimated 397 fewer deaths (Table 1). Similarly, at UHC, crude mortality fell from 7.57%
(1648/21771) at baseline (2006) to 6.15% (1614/26241) (2010) (p<0.0001) at UHC
[estimated 372 fewer deaths] (Table 1). In both hospitals, SA-MR fell markedly and
remained low in both hospitals within a short time of electronic physiological surveillance
being implemented for the whole hospital journey (i.e., AMU plus one or more medical
wards at QAH; EAU plus medical wards at UHC) (Figures 1a and 1b) for medical patients.
Before these points (QAH, June 2008: UHC, April 2009), seasonally adjusted mortality was
predominantly above the seven year mean (QAH 30/47 [63.8%] months; UHC 45/57
[78.9%]), whereas afterwards, it was seldom so (QAH 4/37 [10.8%] months; UHC 2/27
[7.4%]). In both hospitals, there was also less variation in SA-MR. Figures 1a and 1b also
show special cause variation indicated by 28 successive SA-MR observations below the
centerline at QAH, and two runs of 18 and 7 points at UHC.
Table 1. Annual in-patient mortality for Queen Alexandra Hospital (QAH) (2004-2010) and
University Hospital Coventry (UHC) (2006-2010).
QAH
Baselin
e After
Calendar year 2004 2005 2006 2007 2008 2009 2010
Average age of adult
inpatients
62.6
(62.4-
62.9)
63.2
(62.9-
63.1)
63.1
(62.8-
63.3)
63.7
(63.5-
64.0)
64.2
(64.0-
64.5)
64.5
(64.2-
64.7)
66.3
(64.3-
64.7)
All spells 33983 34919 36367 37963 40622 39553 38694
10

Spells excluding day
cases
27959 28575 28910 29364 30539 30427 29676
Observed deaths (O) 2168 2172 2055 2053 2132 1996 1904
Crude mortality rate
(MR)a
7.75% 7.60% 7.11% 6.99% 6.98% 6.56% 6.42%
% change in crude MR -1.98% -8.33% -9.84% -9.97% -
15.40%
-
17.26%
Relative risk (95% CI)
cf. baseline year
0.98
(0.93-
1.04)
0.92
(0.87-
0.97)
0.90
(0.85-
0.96)
0.90
(0.85-
0.95)
0.85
(0.80-
0.90)
0.83
(0.78-
0.88)
p-value for relative risk
cf. baseline year
0.497 0.003 <0.001 <0.001 <0.001 <0.001
Expected deathsb (E) 2216 2242 2277 2368 2359 2301
Deaths avoided (E-O) 44 187 224 236 363 397
UHC Baselin
e
After
Calendar year 2006 2007 2008 2009 2010
Average age of adult
inpatients
63.0
(62.7-
63.3)
63.7
(63.4-
64.0)
64.0
(63.8-
64.3)
64.3
(64.1-
64.6)
64.9
(64.6-
65.1)
All spells 30878 31990 36282 39496 40483
Spells excluding day
cases
21771 21840 23270 25585 26241
Observed deaths (O) 1648 1688 1725 1675 1614
11
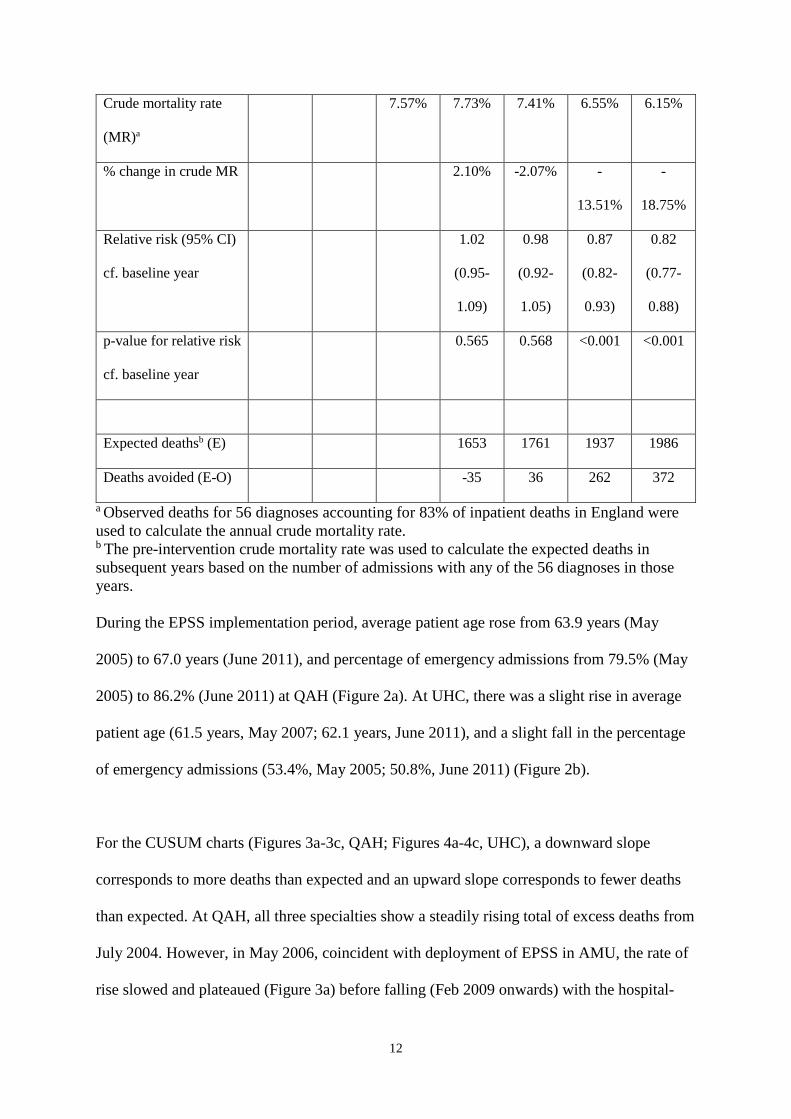
Crude mortality rate
(MR)a
7.57% 7.73% 7.41% 6.55% 6.15%
% change in crude MR 2.10% -2.07% -
13.51%
-
18.75%
Relative risk (95% CI)
cf. baseline year
1.02
(0.95-
1.09)
0.98
(0.92-
1.05)
0.87
(0.82-
0.93)
0.82
(0.77-
0.88)
p-value for relative risk
cf. baseline year
0.565 0.568 <0.001 <0.001
Expected deathsb (E) 1653 1761 1937 1986
Deaths avoided (E-O) -35 36 262 372
a Observed deaths for 56 diagnoses accounting for 83% of inpatient deaths in England were used to calculate the annual crude mortality rate. b The pre-intervention crude mortality rate was used to calculate the expected deaths in subsequent years based on the number of admissions with any of the 56 diagnoses in those years. During the EPSS implementation period, average patient age rose from 63.9 years (May
2005) to 67.0 years (June 2011), and percentage of emergency admissions from 79.5% (May
2005) to 86.2% (June 2011) at QAH (Figure 2a). At UHC, there was a slight rise in average
patient age (61.5 years, May 2007; 62.1 years, June 2011), and a slight fall in the percentage
of emergency admissions (53.4%, May 2005; 50.8%, June 2011) (Figure 2b).
For the CUSUM charts (Figures 3a-3c, QAH; Figures 4a-4c, UHC), a downward slope
corresponds to more deaths than expected and an upward slope corresponds to fewer deaths
than expected. At QAH, all three specialties show a steadily rising total of excess deaths from
July 2004. However, in May 2006, coincident with deployment of EPSS in AMU, the rate of
rise slowed and plateaued (Figure 3a) before falling (Feb 2009 onwards) with the hospital-
12
wide rollout. A more abrupt reversal was seen following EPSS implementation in SAU in
January 2007 (Figure 3b). The reduction in mortality in T&O followed immediately after full
implementation there (Figure 3c). In all three specialties, increasing use of the EPSS across
the hospital was associated with a decreasing cumulative total of excess deaths (Figures 3a-
3c).
At UHC, there was also a rising total of excess deaths from July 2004 for all three specialties
(Figures 4a-4c). For Medicine, the mortality plateaued following the first use of the EPSS,
but did not begin to fall until the EPSS was also implemented in the EAU (Figure 4a). The
increasing use of the EPSS in the surgical, and T&O wards from April 2008 onwards was
again associated with reducing mortality, although the reduction was delayed in the T&O
wards (Figures 4b and 4c).
13

DISCUSSION
This study provides evidence that the implementation of an electronic physiological
surveillance system specifically designed to increase the reliability of the collection,
documentation and display of vital signs in hospital is associated with a significant reduction
in hospital mortality. Whilst impossible to prove a direct cause-and-effect relationship
between the two, the development of the EPSS in one hospital, its subsequent implementation
in a second approximately 240km away and the almost identical results from the two sites
support our view that this is a significant finding. Importantly, there are temporal
relationships between mortality reduction, and the events at hospital and specialty level in
both hospitals. Together, the results appear to suggest that the intervention has both
reproducibility and generalisability, based on a plausible direct relationship.29
The results suggest a strong relationship between increasing use of the EPSS and the reduced
mortality in all three specialties at each hospital. The different timing of the reduction at the
two hospitals also appears to reflect the different deployment schedules in all specialty
groups except T&O at UHC, where a lag of almost 12 months is seen. We are unable to offer
a definite explanation for this latter finding, but it may be due to issues that are not addressed
directly by the EPSS and which have been reported in other hospitals, e.g., staff reluctance to
call for help with deteriorating patients.30,31
In both hospitals, most deaths occur in medical and elderly unscheduled admissions. For
medical admissions at both hospitals, achieving surveillance for the whole patient journey
appears to have been extremely important in reducing mortality (Figures 3a and 4a). This
point was reached at QAH for some medical patients in June 2008 when the EPSS was
extended beyond the AMU to a single medical ward (a stroke ward). Any impact on mortality
14

in this ward was not visible in the hospital-wide SA-MR, however, the effect of the
subsequent implementation of the EPSS on three high-risk medical wards in February 2009 is
clearly apparent (Figure 3a). At UHC, although the EPSS was deployed on the medical wards
early on, it was only deployed in the EAU in April 2009. The reduction in mortality occurred
almost instantaneously thereafter (Figure 4a). In both hospitals, SA-MR fell markedly and
remained low in both hospitals within a short time of electronic physiological surveillance
being implemented for the whole hospital journey (i.e., AMU plus one or more medical
wards at QAH; EAU plus medical wards at UHC) (Figures 1a and 1b) for medical patients.
Before these points (QAH, June 2008: UHC, April 2009), seasonally adjusted mortality was
predominantly above the mean (QAH 30/47 [63.8%] months; UHC 45/57 [78.9%]), whereas
afterwards, it was seldom so (QAH 4/37 [10.8%] months; UHC 2/27 [7.4%]). In both
hospitals, there was also less variation in SA-MR. In figures 1a and 1b the SA-MR plot also
shows special cause variation indicated by seven or more successive SA-MR observations
below the centerline at both QAH and UHC, immediately following the point at which
electronic vital signs surveillance in medical patients was complete for the whole patient
journey for at least some patients.
Of necessity, our research was a pragmatic observational study of real-world system
deployments in two large hospitals. The difficulties of undertaking randomised controlled
trials of technologies like ours - complexity, required duration and expense – have been
previously discussed.32 The possibility of undertaking a stepped wedge design study33 was
precluded by project management considerations; limited availability of project staff;
contamination by movement of some patients between wards and specialties; and the
complexity of creating matching cohorts for all inpatient specialties.
15

A weakness of our study is that we did not measure all cause mortality, but focused on that in
the 56 diagnosis groups used by the UK NHS to monitor and compare hospital
performance.24 However, there appears to be a very strong relationship between mortality in
the 56 diagnosis groups studied and that for all causes.34 Our findings could also be
accounted for by a changing admission case-mix during the study. However, age and
percentage of emergency admissions increased at QAH during this period, and at UHC there
was no real change in either. Certainly, there were no major case-mix changes synchronous
with the observed reductions in mortality. No adjustment was made in our analyses for
patients with Do-Not-Attempt-Cardiopulmonary-Resuscitation (DNACPR) decisions.
It is also possible that a range of other changes in practice other than the EPSS (e.g.,
introducing care bundles35, altering nurse staffing levels36) could have caused or contributed
to the year-on-year mortality reduction observed. However, to have this impact, it would have
been necessary for these to have been introduced at very specific, and different, times in the
given specialties at each of the hospitals. The opening of the new hospital wing at QAH (June
15th 2009) occurred four months after the observed reduction in hospital mortality and could
not explain the reduction in mortality seen at UHC. Finally, we could not identify any service
reconfigurations, new processes, or increases in palliative care admissions or discharges to
the local hospices, that might account for our results.
It is also conceivable that the focus on the EPSS within the two hospitals produced a
significant Hawthorne effect,37 which might account for some or all of the impact. However,
the project teams’ focus on the EPSS deployment in each ward was usually limited to only 1-
2 weeks and it seems improbable that this would result in an impact lasting for over 2 years.
The finding that mortality reductions for each specialty occurred at different times but on
16

each occasion coincided with the intervention in two separate hospitals also suggests that the
EPSS itself was the critical agent of change.
Why might the EPSS have reduced the hospital mortality? Before the introduction of the
EPSS, staff in the study hospitals documented vital signs on paper charts; manually
calculated EWS values; and followed escalation protocols written on paper. Given
international evidence, it is likely that vital signs measurements were undertaken
infrequently;1-3,5,10-12 datasets were incomplete;1,10,13 and there were errors in the calculation
of EWS values.14-17 Using traditional paper-based vital signs charts limited their instant
availability to their immediate vicinity, usually at the foot of the patient’s bed.
We investigated an electronic solution to these problems, as IT systems are known to
“…improve communication, make knowledge more readily accessible, require key pieces of
information (such as the dose of a drug), assist with calculations, perform checks in real
time, assist with monitoring, and provide decision support…”38 In developing the EPSS, we
deliberately ‘designed out’ errors and known system failures to improve the reliability,
efficiency and effectiveness of the vital signs collection, charting and escalation processes.
We incorporated many of the principles outlined by Bates et al., e.g., integration of the EPSS
in the user’s workflow; fast delivery of decision support; anticipation of the user’s needs;
ensuring user acceptability by incorporating user feedback during the pilot phases; use of
simple input screens; asking for data only when it was required; and enabling tracking of the
responses to the decision support.39
The EPSS requires the entry of a full vital signs dataset at each routine observation. Data
from both study sites show that ~98% of all vital signs datasets recorded by the EPSS are
17
complete. It then uses a graded response strategy recommended by NICE4 to automatically
determine the timing of the next vital signs measurement for each patient and provide highly
visible, up-to-date reminders that observations are due.20 The EPSS warns of attempts to
enter out-of-range data or erroneous values. It consistently assigns vital sign parameters to the
correct EWS weightings; automatically and accurately calculates an EWS value; and
instantly displays the EWS on the handheld devices at the bedside.20 Direct bedside entry of
the vital signs dataset makes it quicker for staff to enter the information into patients’ records
than with manual methods.15,16 The decision support provided by the EPSS to bedside staff is
both instantaneous following the input of vital signs data and explicit about the desired
escalation protocol (e.g., increase monitoring frequency, or involve RRT or critical care
staff).20 Finally, the EPSS makes the raw data and the vital signs charts instantaneously
available across the whole hospital via wireless PC tablets or desktop PCs, thereby enabling
rapid spread of the time-critical knowledge of a change in a patient’s clinical condition to
clinical teams involved in the patient’s care.20 Given that errors and failure in the processes
involved in vital signs collection, charting and escalation have been implicated in the failure
to recognize, or respond to, patient deterioration, it is intuitive that improving these processes
might reduce adverse patient outcomes.
Acute care educational programmes for ward staff,22 paper-based EWS systems23 and RRTs21
were already in place in both hospitals before implementation of the EPSS. These are
essential components of the five-ring ‘Chain of Prevention’6 (i.e., Education; Monitoring;
Recognition; Call for help; Response), which is thought to be necessary for early detection
and response to patient deterioration. By design, the EPSS improved the monitoring of
patients’ vital signs, facilitated better recognition of deterioration and increased the likelihood
that ward staff would call for help from senior clinicians and/or the RRT. Therefore, the
18

addition of the EPSS to the existing rapid response system structures is likely to have
‘strengthened’ the ‘Chain of Prevention’6, making deterioration, and death, less likely.
Finally, other research into technological solutions to improve the recognition of, and
response to, patient deterioration has been limited to small-scale implementations, studies in
specific patient groups (e.g., patients receiving RRT calls) or focuses on process measures.40-
51 Although many of these studies suggest potential benefit, ours is the first to consider a two-
centre, whole hospital implementation and to measure mortality in all major adult specialties.
Our findings suggest that implementation of technology specifically designed to improve the
processes around the recognition of, and response to, patient deterioration can change both
process and patient outcomes. The similarity of the impact in all three main specialties in two
unconnected hospitals ~240 kilometres apart provides support to this being a ‘cause and
effect’ relationship, but prospective studies are needed to confirm these results.
19

ABBREVIATION KEY EPSS Electronic physiological surveillance system EWS Early warning score IT Information technology QAH Queen Alexandra Hospital TLC The Learning Clinic Ltd NICE National Institute for Health and Care Excellence UHC University Hospital Coventry RRT Rapid response team AMU Acute Medicine Unit SAU Surgical Assessment Unit T&O Trauma and orthopaedic WTE Whole time equivalent EAU Emergency admissions unit NHS National Health Service ucl Upper control limits lcl Lower control limits SA-MR Seasonally adjusted mortality rate O Observed deaths MR Crude mortality rate CI Confidence intervals E Expected deaths PHT Portsmouth Hospitals `Trust
ACKNOWLEDGEMENTS
The authors would like to acknowledge the efforts of the medical, nursing and administrative
staff at Portsmouth Hospitals NHS Trust and University Hospitals Coventry and
Warwickshire NHS Trust who collected the data used in this study, and thank the information
systems and senior management teams at both hospitals for access and permission to use the
data for research purposes. Dr. Paul Meredith had full access to all of the data in the study
and takes responsibility for the integrity of the data and the accuracy of the data analysis.
COMPETING INTERESTS
VitalPAC is a collaborative development of The Learning Clinic Ltd (TLC) and Portsmouth
Hospitals NHS Trust (PHT). PHT has a royalty agreement with TLC to pay for the use of
20

PHT intellectual property within the VitalPAC product. PM, DP and PS are employed by
PHT. GS was an employee of PHT until 31/03/2011. MM, and the wives of GS and DP, are
minority shareholders in TLC. PS holds a minority shareholding in TLC. GS, DP, and PS are
unpaid research advisors to TLC, and have received reimbursement of travel expenses from
TLC for attending symposia in the UK. MM facilitated a pilot study of VitalPAC in a West
Midlands hospital, which subsequently established a tender process for an electronic early
warning scoring system. VF and DW have no conflicts of interest.
FUNDING
None
21

REFERENCES
1. National Confidential Enquiry into Patient Outcomes and Death. ‘‘An acute problem?’’
London: National Confidential Enquiry into Patient Outcome and Death; 2005.
2. National Patient Safety Agency. Safer care for the acutely ill patient: learning from
serious incidents. NPSA, London, 2007.
3. National Patient Safety Agency. Recognising and responding appropriately to early
signs of deterioration in hospitalised patients. NPSA, London, 2007.
4. National Institute for Health and Clinical Excellence: Acutely ill patients in hospital:
recognition of and response to acute illness in adults in hospital. NICE clinical guideline
No.50. London; 2007.
5. National Confidential Enquiry into Patient Outcomes and Death. ‘‘Time to Intervene? A
review of patients who underwent cardiopulmonary resuscitation as a result of an in-
hospital cardiorespiratory arrest" London: National Confidential Enquiry into Patient
Outcome and Death; 2012.
6. Smith GB. In-hospital cardiac arrest: Is it time for an in-hospital ‘chain of prevention’?
Resuscitation. 2010;81(9):1209-1211.
7. DeVita MA, Smith GB, Adam S et al. Consensus Conference on the Afferent Limb:
Identifying Hospitalised Patients in Crisis. Resuscitation. 2010; 81(4):375-382.
8. Evans D, Hodgkinson B, Berry J. Vital signs in hospital patients: a systematic review.
International Journal of Nursing Studies. 2001;38(6):643–650.
9. Wheatley I. The practice of taking level 1 patient observations. Int Crit Care Nurs.
2006;22(2):1150-1121
10. Chen J, Hillman K, Bellomo R et al. The impact of introducing medical emergency team
system on the documentations of vital signs. Resuscitation. 2009;80(1):35-43.
22
11. Hands C, Reid E, Meredith P et al. Patterns in the recording of vital signs and early
warning scores - time of day, day of week. BMJ Quality & Safety. 2013;22(9):719-726.
12. Buist M, Stevens S. Patient bedside observations: what could be simpler? BMJ Quality
& Safety. 2013;22(9):699-701.
13. Hillman K, Chen J, Cretikos M et al. Introduction of the medical emergency team
(MET) system: a cluster-randomised controlled trial. Lancet. 2005;365(9477):2091-
2097.
14. Smith AF, Oakey RJ. Incidence and significance of errors in a patient ‘track and trigger’
system during an epidemic of Legionnaires’ disease: retrospective case note analysis.
Anaesthesia. 2006;61(3):222-228.
15. Prytherch D. Smith G, Schmidt P et al. Calculating early warning scores – A classroom
comparison of pen and paper and hand-held computer methods. Resuscitation.
2006;70(2):173-178.
16. Mohammed M, Hayton R, Clements G et al. Improving accuracy and efficiency of early
warning scores in acute care. Br J Nurs. 2009;18(1):18-24.
17. Edwards M MH, Van Leuvan C, Mitchell I. Modified Early Warning Scores: inaccurate
summation or inaccurate summation of score? Crit Care. 2010;14(Suppl 1):S88.
18. Preece MHW, Hill A, Horswill MS, Watson MO. Supporting the detection of patient
deterioration: Observation chart design affects the recognition of abnormal vital signs.
Resuscitation. 2012;83(9):1111-1118.
19. Christofidis MJ, Hill A, Horswill MS, Watson MO. Observation charts with overlapping
blood pressure and heart rate graphs do not yield the performance advantage that health
professionals assume: an experimental study. J Adv Nurs. 2014;70(3):610-624.
23

20. Smith GB, Prytherch DR, Schmidt P, et al. Hospital-wide physiological surveillance - a
new approach to the early identification and management of the sick patient.
Resuscitation. 2006;71(1):19-29.
21. Jones DA, DeVita MA, Bellomo R. Rapid-Response Teams. N Engl J Med.
2011;365(2):139-114.
22. Smith GB, Osgood VM, Crane S. ALERT – a multiprofessional training course in the
care of the acutely ill adult patient. Resuscitation. 2002;52(3):281-286.
23. Smith GB, Prytherch DR, Schmidt P et al. Review and performance evaluation of
aggregate weighted ‘track and trigger’ systems. Resuscitation. 2008;77(2):170-179.
24. Understanding HSMRs. A Toolkit on Hospital Standardised Mortality Ratios. Version 6.
Dr. Foster Intelligence, London 2011
25. Dr Foster Intelligence. Real Time Monitoring (RTM). Enabling providers and
commissioners to benchmark and monitor clinical outcomes.
http://drfosterintelligence.co.uk/solutions/nhs-hospitals/real-time-monitoring-rtm
Accessed January 22, 2014.
26. Benneyan JC. Use and interpretation of statistical quality control charts. Int J Qual
Health Care. 1998;10(1):69-73.
27. Grigg O, Farewell VT, Spiegelhalter DJ. Use of Risk-adjusted CUSUM and RSPRT
Charts for Monitoring in Medical Contexts. Statistical Methods in Medical Research.
2003;12(2):147-170.
28. Grunkemeier GL, Jin R, Wu Y. Cumulative sum curves and their prediction limits. Ann
Thorac Surg 2009;87(2):361-4
29. Bellomo R, Bagshaw SM. Evidence-based medicine: classifying the evidence from
clinical trials--the need to consider other dimensions. Crit Care. 2006;10(5):232.
24

30. Buist M. The rapid response team paradox: Why doesn't anyone call for help? Crit Care
Med. 2008;36(2):634-6.
31. Shearer B, Marshal S, Buist MD, et al. What stops hospital clinical staff from following
protocols? An analysis of the incidence and factors behind the failure of bedside clinical
staff to activate the rapid response system in a multi-campus Australian metropolitan
healthcare service. BMJ Qual Saf. 2012;21(7):569–575.
32. Bates DW. The Effects of Health Information Technology on Inpatient Care. Arch Intern
Med. 2009;169(2):105-107.
33. Brown CA, Lilford RJ. The stepped wedge trial design: a systematic review. BMC
Medical Research Methodology. 2006;6:54.
34. Aylin P. Understanding Hospital Mortality Indicators. SEPHIG Meeting 2013.
http://www.sepho.org.uk/viewResource.aspx?id=14609 Accessed January 22, 2014.
35. Robb E, Jarman B, Suntharalingam G et al. Using care bundles to reduce in-hospital
mortality: Quantitative survey. BMJ. 2010 ;340:c1234
36. Rafferty AM, Clarke SP, Coles J et al. Outcomes of variation in hospital nurse staffing
in English hospitals: Cross-sectional analysis of survey data and discharge records. Int J
Nurs Studies, 2007;44(2):175-182.
37. Sedgwick P. The Hawthorne effect. BMJ. 2012; 344:d8262
38. Bates DW, Gawande AA. Improving safety with information technology. N Engl J Med.
2003;348(25):2526-2534.
39. Bates DW, Kuperman GJ, Wang S et al. Ten commandments for effective clinical
decision support: making the practice of evidence-based medicine a reality. J Am Med
Inform Assoc. 2003;10(6):523-530.
25
40. Watkinson PJ, Barber VS, Price JD et al. A randomised controlled trial of the effect of
continuous electronic physiological monitoring on the adverse event rate in high risk
medical and surgical patients. Anaesthesia. 2006;61(11):1031-1039.
41. Hravnak M, Edwards L, Clontz A et al. Defining the incidence of cardiorespiratory
instability in patients in step-down units using an electronic integrated monitoring
system. Arch Intern Med. 2008;168(12):1300-1308.
42. Hravnak M, DeVita MA, Clontz A et al. Cardiorespiratory instability before and after
implementing an integrated monitoring system. CCM. 2011;39(1):65–72.
43. Taenzer AH, Pyke JB, McGrath SP et al. Impact of Pulse Oximetry Surveillance on
Rescue Events and Intensive Care Unit Transfers: A Before-And-After Concurrence
Study. Anesthesiology. 2010;112(2):282-287.
44. Bellomo R, Ackerman M, Bailey M et al. Vital Signs to Identify, Target, and Assess
Level of Care Study (VITAL Care Study) Investigators. A controlled trial of electronic
automated advisory vital signs monitoring in general hospital wards. CCM.
2012;40(8):2349-2361
45. Brown H, Terrence J, Vasquez P et al. Continuous Monitoring in an Inpatient Medical-
Surgical Unit: A Controlled Clinical Trial. Am J Med. 2014;127(3):226-32.
46. Huh JW, Lim C-M, Koh Y et al. Activation of a Medical Emergency Team Using an
Electronic Medical Recording-Based Screening System. Crit Care Med. 2014;42(4):801-
8.
47. Jones S, Mullaly M, Ingleby S, et al. Bedside electronic capture of clinical observations
and automated clinical alerts to improve compliance with an Early Warning Score
protocol. Crit Care Resusc. 2011;13(2):83-88.
48. Smith LB, Banner L, Lozano D et al. Connected care: Reducing errors through
automated vital signs data upload. Comput Inform Nurs. 2009;27(5):318-323.
26

49. Gearing P, Olney CM, Davis K et al. Enhancing patient safety through electronic
medical record documentation of vital signs. J Healthc Inf Manag. 2006;20(4):40-45.
50. Meccariello M, Perkins D, Quigley LG et al. Vital Time Savings. Evaluating the Use of
an Automated Vital Signs Documentation System on a Medical/Surgical Unit. JHIM.
2010;24(4):46-51.
51. Fieler VK, Jaglowski T, Richards K. Eliminating errors in vital signs documentation.
Comput Inform Nurs. 2013;31(9):422-427.
27

LEGENDS FOR FIGURES
Figure 1: p-chart with control limits of +3 standard deviations of seasonally adjusted mortality rate (SA-MR) at QAH (Figure 1a) and UHC (Figure 1b). Observations recorded by EPSS implementation are superimposed. [ucl = upper control limit; lcl = lower control limit.]
28

Figure 2: Average patient age and percentage of emergency admissions during the EPSS implementation period shown with seasonally adjusted mortality rate (SA-MR) at QAH (Figure 2a) and UHC (Figure 2b).
29

Figure 3: CUSUM charts of cumulative monthly difference between expected and seasonally adjusted observed deaths (E-O) in three specialties (Medicine, 3a; Surgery, 3b; T&O, 3c) at QAH. Control limits added using the
30

method described by Grunkemeier et al.28 ‘T’ denotes deployment of the EPSS to the Acute Medicine Unit (AMU). ‘U’ denotes implementation to the first medical ward outside the AMU. ‘V’ denotes sequential hospital-wide deployment, beginning with three medical wards. ‘W’ denotes opening of new hospital wing. ‘X’ denotes deployment to the Surgical Assessment Unit.
Figure 4: CUSUM charts of cumulative monthly difference between expected and seasonally adjusted observed deaths (E-O) in three specialties (Medicine, 4a; Surgery, 4b; T&O, 4c) at UHC. Control limits added using the method described by Grunkemeier et al.28 ‘Y’ denotes sequential deployment of the EPSS to adult inpatient wards. ‘Z’ denotes deployment to the Emergency Admissions Unit.
31