impact of low-emission diesel engines on underground mine air quality
TRANSCRIPT
1
IMPACT OF LOW-EMISSION DIESEL ENGINES ON UNDERGROUND MINE AIR QUALITY
Susan T. Bagley1, Winthrop F. Watts, Jr.2, Jason P. Johnson2, David B. Kittelson2, John H.
Johnson3, and James J. Schauer4
National Institute for Occupational Safety and Health Grant No. R01/CCR515831-01
1 Project Director, Department of Biological Sciences, Michigan Technological University, 1400 Townsend Dr., Houghton, MI 49931-1295
2 Department of Mechanical Engineering, Center for Diesel Research, University of Minnesota, 111 Church St, S.E., Minneapolis, MN 55455
3 Department of Mechanical Engineering and Engineering Mechanics, Michigan Technological University, 1400 Townsend Dr., Houghton, MI 49931-1295
4 Environmental Chemistry and Technology Program, University of Wisconsin-Madison 660 N. Park St., Madison, WI 53706
5/2/2002 DEEP did not support, authorize or technically review this report and takes no responsibility for its content. DEEP, however, is providing the report on its Website because it is important for parties interested in diesel engine performance to be aware of the work.
i
Table of Contents LIST OF ABBREVIATIONS................................................................................................... ii LIST OF TABLES .....................................................................................................................v ABSTRACT.............................................................................................................................. 1 SIGNIFICANT FINDINGS ...................................................................................................... 3 USEFULNESS OF FINDINGS ................................................................................................ 3 SCIENTIFIC REPORT............................................................................................................. 4
BACKGROUND .................................................................................................................. 4 Occupational Health Concerns And Standards ................................................................. 4 Physical Characteristics of Diesel Aerosol....................................................................... 5 Emission Control Underground ........................................................................................ 7 Diesel Aerosol Research Focusing On Nanoparticles ...................................................... 9
SPECIFIC AIMS ................................................................................................................ 11 PROCEDURES AND METHODOLOGY......................................................................... 13
Host Mine........................................................................................................................ 13 Aerosol Sampling............................................................................................................ 13 Pre-trip And General Study Protocol.............................................................................. 18 Laboratory Analyses of High-Volume Samples ............................................................. 23 Fuel and Oil Analyses..................................................................................................... 25 Data Analyses ................................................................................................................. 26
RESULTS AND DISCUSSION......................................................................................... 28 DPM Sampling................................................................................................................ 29 High-Volume Sampler Analyses .................................................................................... 34
CONCLUSIONS................................................................................................................. 43 ACKNOWLEDGEMENTS .................................................................................................... 44 REFERENCES ....................................................................................................................... 45 LIST OF POSSIBLE PUBLICATIONS................................................................................. 52
ii
LIST OF ABBREVIATIONS ACGIH American Conference of Governmental Industrial Hygienists
CNC condensation nuclei counter
CPC condensation particle counter
DEEP Diesel Emissions Evaluation Program (Canada)
DC diffusion charger
DOC diesel oxidation catalyst
DMSO dimethyl sulfoxide
DPM diesel particulate matter
EC non-volatile, elemental carbon (component of DPM)
EC50pct 50-pct-collection efficiency point
EI Electron Ionization
EPA U.S. Environmental Protection Agency
GCMS gas chromatography/ mass spectrometry
HEI Health Effects Institute
IARC International Agency for Research on Cancer
MOUDI micro-orifice uniform deposit impactor
MSA Mine Safety Appliance
MSHA Mine Safety and Health Administration
MTU Michigan Technological University
NIOSH National Institute for Occupational Safety and Health
NIST National Institute of Standards
NO2 nitrogen dioxide
NOx oxides of nitrogen
NT Not Tested
OC adsorbed or condensed hydrocarbons (associated with EC; component of DPM)
PAH polycyclic aromatic hydrocarbon
PAS photoelectric aerosol sensor
PM10 particulate matter with diameter <10 µm
RAM-1 Real-time Aerosol Monitor

iii
RCD respirable combustible dust
RD respirable dust
RH relative humidity
S saturation ratio
SD standard deviation
SOF DPM-associated soluble organic fraction
SS size selective
TC total carbon (consisting of EC plus OC)
TLV threshold limit value
TRK technical exposure limits (translation from German)
UMN University of Minnesota
UV Ultraviolet
iv
LIST OF FIGURES Figure Title Page
Figure 1. Mass and number weighted diesel aerosol size distribution and the fraction deposited in the alveolar region of the lung. 5
Figure 2. Idealization of an atmospheric surface area distribution showing the principle modes, sources of mass, and the processes involved in mass transfer and removal. 7
Figure 3. Low emission engine technology. 9
Figure 4. Schematic of the sampling locations (B-D) during the pre-trip. 19
Figure 5. Data collected at sample location C. 19
Figure 6. Layout of the mine test section. 21
Figure 7. Leaky filter dilution ratio estimate for CPC with and without dilutor on 2/28/00. 33
Figure 8. Leaky filter dilution ratio estimate for CPC with and without dilutor on 3/1/00. 33
Figure 9. Comparison of normalized and weighted mean weekly hopane levels in the 40
downwind sampling sites between sampling weeks 1 and 2. 40
Figure 10. PAHs detected in the diesel fuel and new and used lubricating oil. 40
Figure 11. Hopanes detected in the diesel fuel and new and used lubricating oil. 41
v
LIST OF TABLES Table Title Page
Table 1. Diesel equipment evaluated during the project. 20
Table 2. General daily sampling matrix. 22
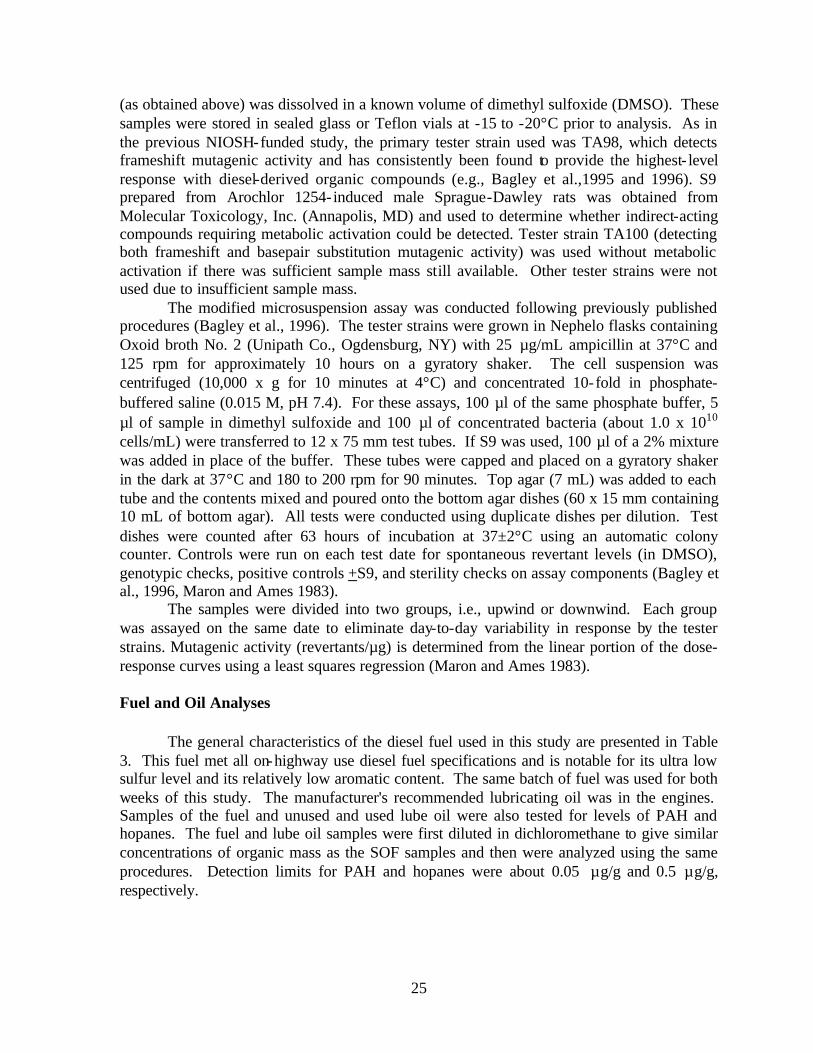
Table 3. Diesel fuel propertiesa. 26
Table 4. Number of trucks loaded with salt passing by the sampling stations. 27
Table 5. Normalized daily and weighted weekly EC, OC and TC mean concentrations. 30
Table 6. Comparison of DPM sampling results between weeks 1 and 2. 31
Table 7. SS normalized daily and weighted weekly mean concentrations. 32
Table 8. DC, PAS and CPC normalized daily and weighted weekly mean concentrations. 34
Table 9. High-volume sampler parameters. 35
Table 10. Downwind location high-volume sampler-derived DPM and DPM-component normalized daily and weekly mean (and SD) concentrations (mg/m3). 36
Table 11. Upwind location high-volume sampler-derived DPM and DPM-component normalized daily and weekly mean (and SD) concentrations (mg/m3). 36
Table 12. Comparison of high-volume sampler-derived DPM and biological activity result between weeks 1 and 2. 37
Table 13. PAH weighted weekly mean PAH concentrations (ng/m3) at the upwind and downwind sampling locations. 38
Table 14. Comparison of PAH and hopane values from weeks 1 and 2. 39
Table 15. Biological (Ames) activity detected from the downwind location. 42
Table 16. Biological (Ames) activity detected from the upwind location. 42
1
ABSTRACT The overall objective of the research project was to ensure that no new health hazards were introduced into the underground mine environment by the use of modern, electronically controlled, low emission diesel engine technology. This was accomplished by evaluating the effects these diesel engines (operated with low sulfur fuel) had on the mass concentrations, chemical composition and physical characteristics of diesel particulate matter (DPM) in a domal salt mine. The study was modeled after previous studies in which the mass concentration, chemical composition and physical characteristics of DPM were determined before and after the introduction of exhaust aftertreatment or alternative fuel to evaluate their effectiveness in reducing mass emissions.
Sampling was conducted over a two-week period at several locations within the mine. The same protocol was followed during each week, except when different diesel-powered vehicles were used. During the first week, 1990 Caterpillar 3408 C, mechanically controlled engines were used; during the second week, 1998 Caterpillar 3408 F, electronically controlled engines were used. The same low sulfur (34.2 ppm) fuel was used throughout the study.
A variety of samples were collected to determine control efficiency and to determine the changes in the biological, chemical, and physical nature of the diesel aerosol attributable to the use of low-emission engines. DPM concentrations were determined using elemental carbon (EC) and size selective (SS) sampling techniques. The EC technique also provided information on total carbon (TC) and organic carbon (OC) levels. The SS technique provided information on respirable dust (RD) and <0.8 µm particle concentrations. Several near real- time instruments were used for monitoring the diesel aerosol in the mine, i.e., portable diffusion chargers (DC) for total surface area, portable photoelectric aerosol sensors (PAS) for total surface-bound polycyclic aromatic hydrocarbons (PAH), and condensation particle counters (CPC) for particle numbers. High-volume samplers were used to obtain DPM samples for determination of the specific PAH and mutagenic activity associated with the adsorbed organics. In areas where the diesels were operating, the TC and EC were reduced by at least 60% with use of the electronically controlled diesel engines. OC levels were also reduced but to a lesser extent, consistent with the engine's technology changes affecting the EC component of the DPM. As determined from the SS samples, the reductions in DPM at the downwind location were not as great as for the TC (about 40% decreases in <0.8 µm particles and RD). As determined in this mine, the DPM levels with the modern engines (and no control devices) would not reach the target value of 0.15 mg/m3. The EC and SS sampling methods were both found to work well in an underground mine environment. All of the near real-time aerosol measurements at the downwind location (DC, PAS, and CPC) showed about 50 to 60% decrease in levels with use of the electronically controlled, low-emission engines. The magnitude of the decreases was similar to that found for EC and TC at the same locations, indicating that these parameters have close correlations. There was also no evidence of increased production of nano- (or nuclei-mode) particles with use of the low emission engines. This study also demonstrated that instruments such as the DC, PAS and CPC could be used to track diesel activity on a real time basis in underground mines.
2
The PAH and biological (mutagenic) activity levels (associated with the organics extracted from DPM collected with the high-volume samplers) also showed large decreases with use of the electronically controlled diesel engines (by up to about 90% and 65%, respectively).
Overall, use of electronically controlled, modern diesel engines with a low sulfur fuel in this underground mine resulted in large reductions in DPM and all DPM-related components. The measured potentially health related components showed similar reductions. However, the use of these engines cannot be relied upon to reduce concentrations below 0.15 mg/m3 in all circumstances.
3
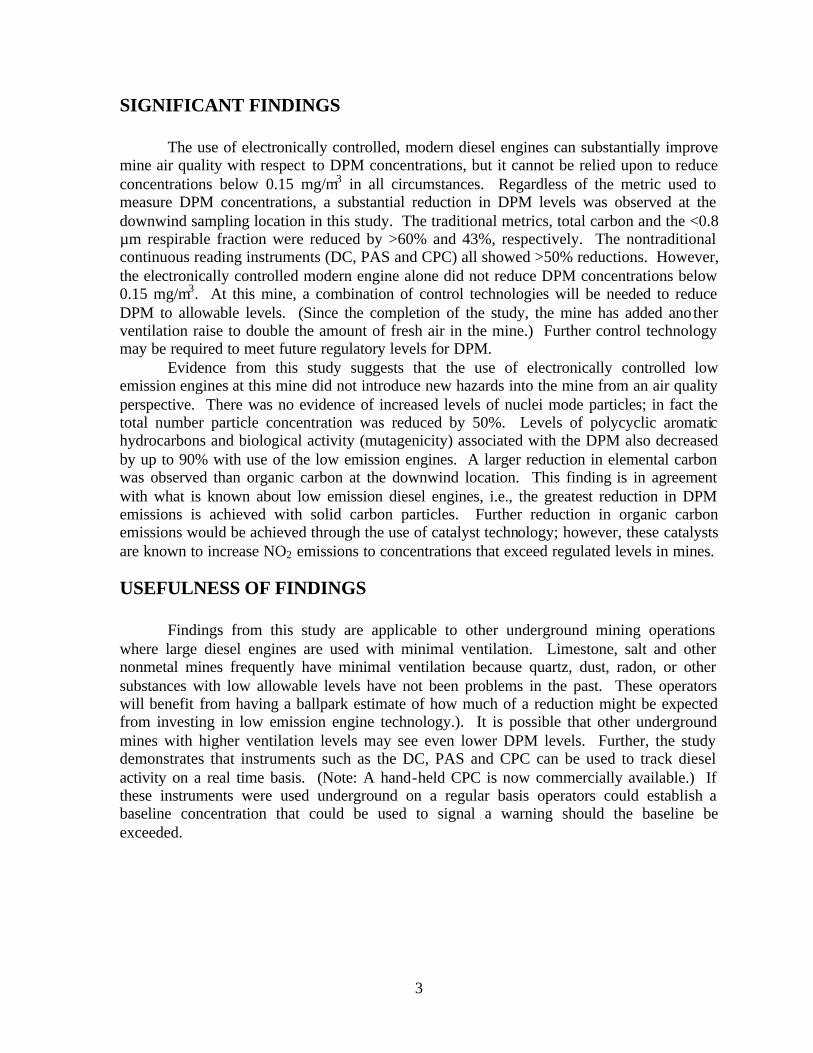
SIGNIFICANT FINDINGS The use of electronically controlled, modern diesel engines can substantially improve mine air quality with respect to DPM concentrations, but it cannot be relied upon to reduce concentrations below 0.15 mg/m3 in all circumstances. Regardless of the metric used to measure DPM concentrations, a substantial reduction in DPM levels was observed at the downwind sampling location in this study. The traditional metrics, total carbon and the <0.8 µm respirable fraction were reduced by >60% and 43%, respectively. The nontraditional continuous reading instruments (DC, PAS and CPC) all showed >50% reductions. However, the electronically controlled modern engine alone did not reduce DPM concentrations below 0.15 mg/m3. At this mine, a combination of control technologies will be needed to reduce DPM to allowable levels. (Since the completion of the study, the mine has added ano ther ventilation raise to double the amount of fresh air in the mine.) Further control technology may be required to meet future regulatory levels for DPM. Evidence from this study suggests that the use of electronically controlled low emission engines at this mine did not introduce new hazards into the mine from an air quality perspective. There was no evidence of increased levels of nuclei mode particles; in fact the total number particle concentration was reduced by 50%. Levels of polycyclic aromatic hydrocarbons and biological activity (mutagenicity) associated with the DPM also decreased by up to 90% with use of the low emission engines. A larger reduction in elemental carbon was observed than organic carbon at the downwind location. This finding is in agreement with what is known about low emission diesel engines, i.e., the greatest reduction in DPM emissions is achieved with solid carbon particles. Further reduction in organic carbon emissions would be achieved through the use of catalyst technology; however, these catalysts are known to increase NO2 emissions to concentrations that exceed regulated levels in mines. USEFULNESS OF FINDINGS Findings from this study are applicable to other underground mining operations where large diesel engines are used with minimal ventilation. Limestone, salt and other nonmetal mines frequently have minimal ventilation because quartz, dust, radon, or other substances with low allowable levels have not been problems in the past. These operators will benefit from having a ballpark estimate of how much of a reduction might be expected from investing in low emission engine technology.). It is possible that other underground mines with higher ventilation levels may see even lower DPM levels. Further, the study demonstrates that instruments such as the DC, PAS and CPC can be used to track diesel activity on a real time basis. (Note: A hand-held CPC is now commercially available.) If these instruments were used underground on a regular basis operators could establish a baseline concentration that could be used to signal a warning should the baseline be exceeded.
4
SCIENTIFIC REPORT
BACKGROUND Occupational Health Concerns And Standards
Diesel exhaust is a complex mixture of noxious gases and diesel particulate matter (DPM). DPM consists of nonvolatile, elemental carbon (EC), adsorbed or condensed hydrocarbons referred to as organic carbon (OC), sulfates, and trace quantities of metallic compounds (HEI, 1995). Total carbon (TC) is composed of EC plus OC.
Attention has focused on the potential carcinogenicity of DPM and the potential health impact on miners. In 1988, the National Institute for Occupational Safety and Health (NIOSH) recommended that whole diesel exhaust be regarded as a "potential occupational carcinogen", and stated that reductions in workplace exposure would reduce cancer risks (NIOSH, 1988). In 1989, the International Agency for Research on Cancer (IARC) declared, "diesel engine exhaust is probably carcinogenic to humans" (IARC, 1989).
There is a considerable difference in recommended or established allowable concentrations for DPM in the workplace. In 1995, the American Conference of Governmental Industrial Hygienists (ACGIH) added DPM to the Notice of Intended Changes for 1995-96 with a threshold limit value (TLVTM) recommendation of 0.15 mg/m3 (ACGIH, 1995). DPM of < 1.0 µm in size remained on the ACGIH Notice of Intended Changes in 1999 but with a reduction in the proposed TLV to 0.05 mg/m3. The Notice of Intended Changes for 2001 will further modify the DPM recommendations (ACGIH 2001). ACGIH has included diesel exhaust particulate, as EC with a time weighted average TLV of 20 µg/m3.
The U. S. Mine Safety and Health Administration (MSHA) promulgated a DPM permissible exposure limit for noncoal mines based upon TC (MSHA, 2001a,b). An interim standard of 0.4 mg/m3 TC takes effect 18 months after the publication of the final rule. Five years later the standard would be lowered to 0.16 mg/m3 of TC. Total carbon would be determined using NIOSH method 5040 (NIOSH, 1996).
DPM limits are already in place in Canada and Europe. British Columbia, New Brunswick, Quebec, and Ontario have adopted a 1.5-mg/m3 level for respirable combustible dust (RCD) (Canadian Mining Regulations, 1997-98). In Switzerland the standard is 0.2 mg/m3 of TC (SUVA, 1997). It should be noted, however, that diesel soot is listed as a carcinogen; consequently exhaust emissions must be minimized using the best available control technology. SUVA requires that certified traps be used on all construction machines used in tunneling. The Federal Republic of Germany has adopted technical exposure limits (TRK) for the general workplace, tunneling and mining. For the general workplace, the TRK is 0.1 mg/m3 EC or 0.15 mg/m3 total carbon (TC) when the sample contains >50% organic material. For mining and tunneling the TRK is 0.3 mg/m3. The standard for mining is being revised. Germany also has a similar requirement for the use of exhaust filtration devices. This is demonstrated in German law TRGS 554 (TRGS 900, 1998).
5
Physical Characteristics of Diesel Aerosol
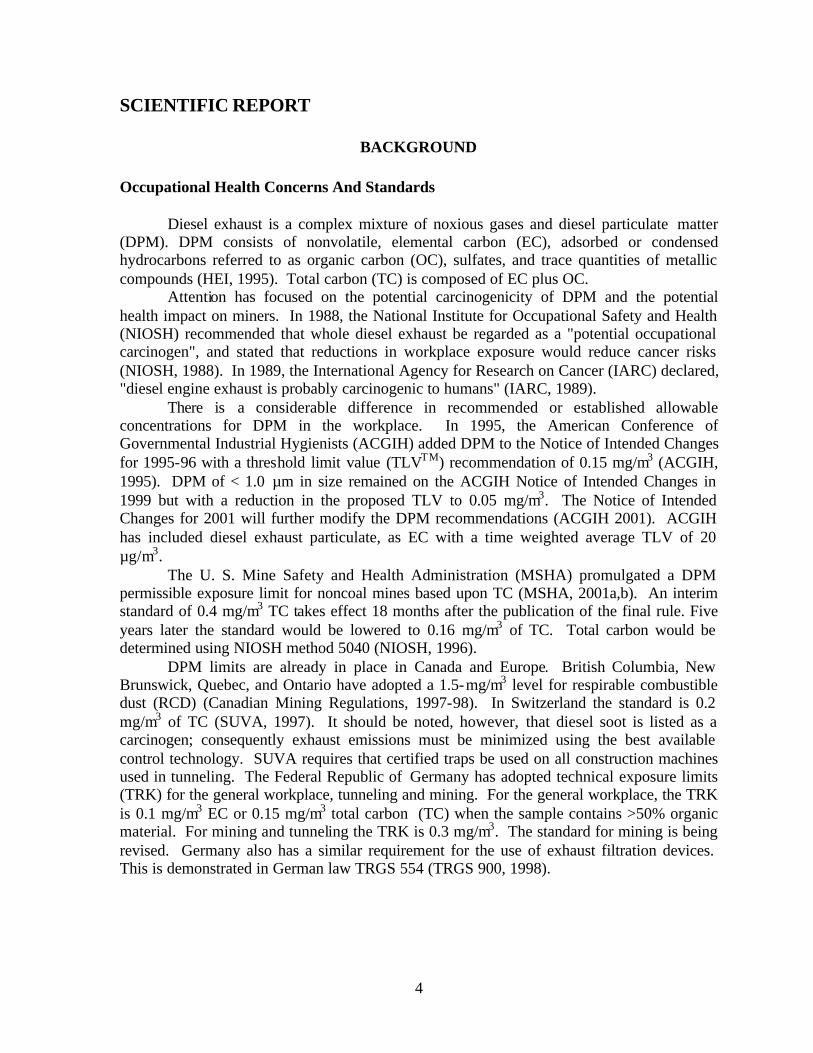
Studies have linked environmental exposure to fine particles less than 2.5 µm in size to adverse health effects, (Dockery, et al., 1993, Pope, et al., 1995, Samet, et al., 2000a,b, Oberdörster, et al., 2000 and Lippmann, et al., 2000) although no causal mechanisms have been identified. The relationship between fine particles and health is a logical link because the efficiency of particle deposition in the respiratory tract is a function of particle size. For example, McCawley et al. (2001) recently concluded that ultrafine beryllium number concentration better reflects the risk for chronic beryllium disease than does particle mass concentration. Figure 1 illustrates relationships between idealized combustion aerosol number and mass weighted size distributions (Whitby and Cantrell, 1975) and the alveolar deposition curve (Task Group on Lung Dynamics, 1966, Raabe, 1982). In this case the distribution typifies a diesel aerosol distribution. Figure 1 shows that as the aerosol decrease in size, nanoparticle deposition efficiency increases.
Figure 1. Mass and number weighted diesel aerosol size distribution and the fraction deposited in the alveolar region of the lung.
Combustion aerosol follows a lognormal, trimodal size distribution with the concentration in any size range being proportional to the area under the corresponding curve in that range. Nuclei-mode particles range in diameter from 0.005 to 0.05 µm (5-50 nm). They consist of metallic compounds, EC and semi-volatile organic and sulfur compounds that form particles during exhaust dilution and cooling. For diesel aerosol the nuclei mode typically contains 1-20% of the particle mass and more than 90% of the particle number. The accumulation mode ranges in size from roughly 0.05 to 0.5 µm (50-500 nm). Most of
0
0.02
0.04
0.06
0.08
0.1
0.12
0.14
0.16
0.18
0.2
0.001 0.010 0.100 1.000 10.000Diameter ( µµm)
Nor
mal
ized
Con
cent
ratio
n,dC
/Cto
tal/d
logD
p
0
0.1
0.2
0.3
0.4
0.5
0.6
0.7
0.8
0.9
1
Alveolar D
eposition Fraction
Mass Weighting Number Weighting Alveolar Deposition Fraction
FineParticlesDp < 2.5 µm
Ultrafine ParticlesDp < 100 nm
NanoparticlesDp < 50 nm
NucleiMode
AccumulationMode
CoarseMode
PM10Dp < 10 µm
Fractional deposition of particle with density of 1 g/cm
3
6
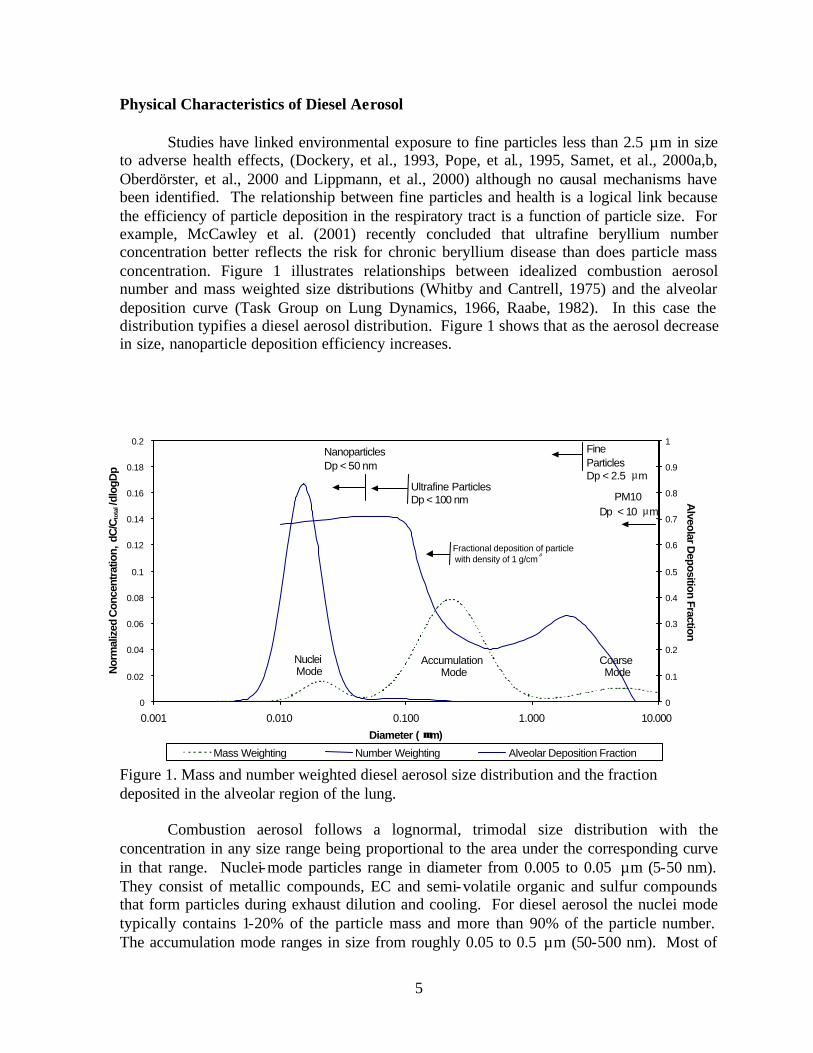
the mass, composed primarily of carbonaceous agglomerates and adsorbed materials, is found here. The coarse mode consists of particles larger than 1 µm and contains 5-20% of the mass. These relatively large particles are formed by reentrainment of particulate matter, which has been deposited on cylinder, and exhaust system surfaces. The transient nature of the coarse mode makes it difficult to sample and characterize. Also shown in Figure 1 are size range definitions for atmospheric particles: PM10 (diameter <10 µm), fine particles (diameter <2.5 µm), ultrafine particles (diameter < 0.10 µm or < 100 nm), and nanoparticles (diameter < 0.05 µm or < 50 nm) (Kittelson, 1998). Figure 2 (Whitby and Cantrell, 1975) shows the mechanisms, such as condensation and coagulation that transfer aerosol mass from one size range to another. The smallest of the three modes, 0.001 to 0.08 µm, is the Aitken nuclei range, which consists of primary aerosol from combustion sources such as diesel engines and secondary aerosol formed from coagulation of primary aerosols to form chain agglomerates. The next size range, 0.08 to 1.0 µm, is the accumulation range that contains emissions in this size range plus aerosol accumulated by mass transfer through the coagulation and condensation processes from the nuclei range. The last range, 1.0 to approximately 40 µm, is referred to as the coarse aerosol size range. Aerosols within this range generally originate from mechanical processes such as grinding, mechanical fracture and bulk material handling. There is very little exchange of mass from the nuclei and accumulation modes to the coarse particle mode under most conditions.
7
Figure 2. Idealization of an atmospheric surface area distribution showing the principle modes, sources of mass, and the processes involved in mass transfer and removal. (Source: Whitby and Cantrell, 1975) Emission Control Underground Emission controls are used to reduce miner exposure to gaseous and DPM emissions. In 1995, MSHA organized three workshops to discuss the potential health risks to miners from exposure to DPM, ways to measure and control DPM in mine environments, and regulatory or other approaches to ensure a healthful work environment. Out of these workshops came a “toolbox” approach for reducing DPM emissions underground (Watts, 1997). Many strategies are contained in the “toolbox” for reducing emissions, but four hold great promise; low-emission engines, low sulfur fuel, modern Diesel Oxidation Catalysts (DOCs), and catalyzed filtration devices. These are briefly described. Low emission engines are produced by engine manufacturers to meet stringent, on-highway EPA regulations, which have driven DPM emissions levels on the Federal Transient Cycle from 0.6 g/hp-hr in 1988 to less than 0.1 g/hp-hr in 1994 (EPA, 1997). These engines typically operate at high fuel injection pressures that provide a more efficient and complete combustion of fuel. In addition they are frequently turbocharged to optimize power,
8
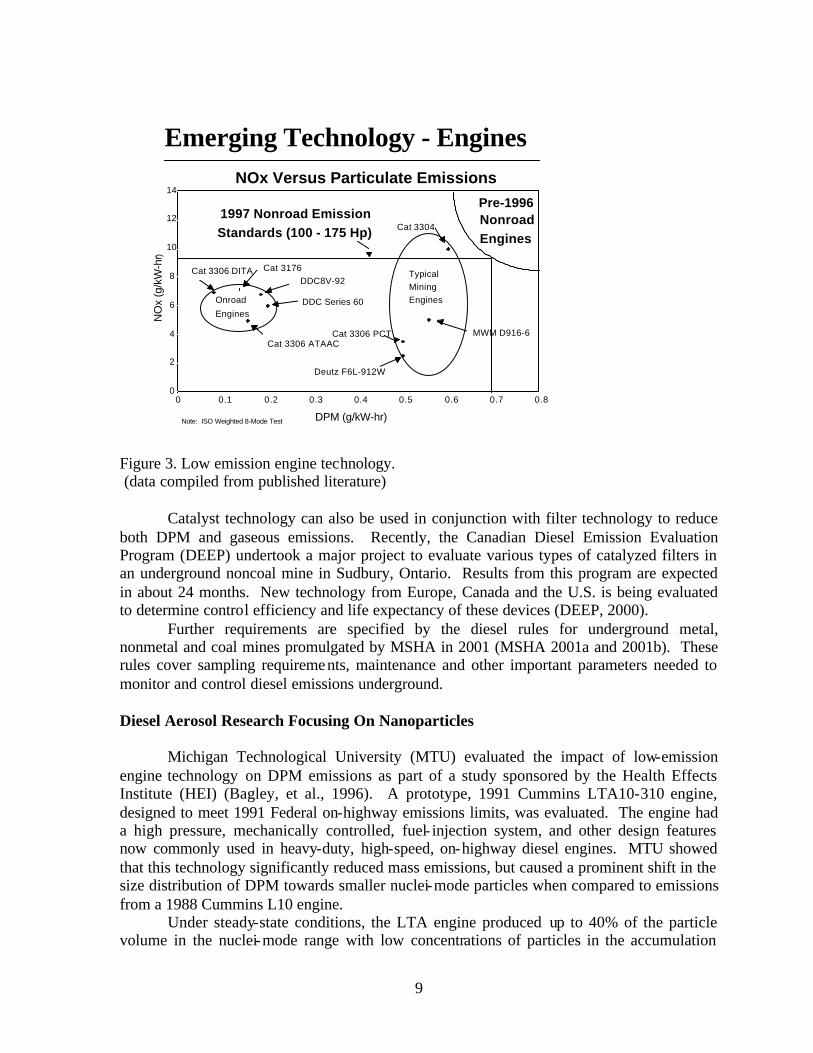
performance, and emissions. Aftercooling is used to reduce oxides of nitrogen (NOx). Electronic engine control optimizes the fuel timing and delivery rate, resulting in lower emissions. As a result of these and other improvements, on-highway heavy-duty diesel engine emissions, as measured in the laboratory, have been significantly reduced. However, emission reductions from these engines have not been quantified or characterized in an underground mine environment. In 1996, the U.S. Environmental Protection Agency (EPA) established emission regulations for almost all land-based nonroad diesels such as construction equipment (EPA, 1997). These regulations specify emission levels that nonroad engines must meet depending on the horsepower of the engine. For now, EPA is regulating only engines between 130 - 560 kW. Particulate emissions were reduced from as high as 1.0 g/hp-hr to 0.4 g/hp-hr and NOx emissions dropped to below 6.9 g/hp-hr. EPA has adopted a phase- in period for regulating other horsepower engines, including small engines that would be candidates to be used in utility mine vehicles. Engines used in underground mines are exempt from EPA regulations, but some engines used underground already meet EPA nonroad diesel requirements, as illustrated in Figure 3. However, future MSHA regulatory requirements will force mine operators to adopt new strategies to reduce DPM exposure. Data collected by MSHA (Dvorznak, 1996), UMN (Waytulonis, 1997), and the Ontario Ministry of Labor (Vergunst, 1997) show that low-emission engines are slowly gaining entrance into the underground mining market. Ontario (Vergunst, 1997) inventoried the diesel equipment used in noncoal mines and found that Detroit Diesel series 50, 60 and 6 V 92 engines account for about 17% of the heavy-duty engines. These engines are electronically controlled with direct fuel injection and are turbocharged with aftercooling. Caterpillar is also gaining market share with the 3176, 3406 and 3408 series engines that have similar features as the Detroit Diesel engines. All of these engines are in the 200 to 500 hp range and have much lower mass emissions than their predecessors. Mine operators recognize that low-emission engines are a promising strategy to reduce exposure underground. Furthermore, they can be used in conjunction with an array of aftertreatment devices and alternative fuels to reduce emissions (Waytulonis, 1992b). Use of low sulfur diesel fuel (<0.05% sulfur) reduces the sulfate fraction of DPM emissions, reduces objectionable odors associated with diesel use, and allows oxidation catalysts to perform properly (Waytulonis, 1992a). A further benefit in the use of low sulfur fuel is reduced engine wear and maintenance costs. Fuel sulfur content is a particularly important parameter when the fuel is used in low-emission diesel engines equipped with DOCs because catalysts tend to increase the production of sulfates that increase mass emissions. Low sulfur diesel fuel is available nationwide due to EPA regulations. DOCs are used to reduce the quantity of carbon monoxide and hydrocarbons in diesel exhaust, including aldehydes that can cause eye irritation. DOCs also decrease the soluble organic fraction (SOF) of DPM as well as gas phase hydrocarbons, which can reduce DPM emissions by up to 50%, and reduce associated carcinogenic compounds, such as benzo[a]pyrene, and other polycyclic aromatic hydrocarbons (PAH). However, DOCs do increase nitrogen dioxide (NO2 ) emissions. New catalyst technology and the availability of low (or ultra low) sulfur fuel make the use of DOCs on underground mine vehicles an attractive tool for reducing DPM emissions (McClure, 1992).
9
Figure 3. Low emission engine technology. (data compiled from published literature) Catalyst technology can also be used in conjunction with filter technology to reduce both DPM and gaseous emissions. Recently, the Canadian Diesel Emission Evaluation Program (DEEP) undertook a major project to evaluate various types of catalyzed filters in an underground noncoal mine in Sudbury, Ontario. Results from this program are expected in about 24 months. New technology from Europe, Canada and the U.S. is being evaluated to determine control efficiency and life expectancy of these devices (DEEP, 2000). Further requirements are specified by the diesel rules for underground metal, nonmetal and coal mines promulgated by MSHA in 2001 (MSHA 2001a and 2001b). These rules cover sampling requirements, maintenance and other important parameters needed to monitor and control diesel emissions underground. Diesel Aerosol Research Focusing On Nanoparticles Michigan Technological University (MTU) evaluated the impact of low-emission engine technology on DPM emissions as part of a study sponsored by the Health Effects Institute (HEI) (Bagley, et al., 1996). A prototype, 1991 Cummins LTA10-310 engine, designed to meet 1991 Federal on-highway emissions limits, was evaluated. The engine had a high pressure, mechanically controlled, fuel- injection system, and other design features now commonly used in heavy-duty, high-speed, on-highway diesel engines. MTU showed that this technology significantly reduced mass emissions, but caused a prominent shift in the size distribution of DPM towards smaller nuclei-mode particles when compared to emissions from a 1988 Cummins L10 engine. Under steady-state conditions, the LTA engine produced up to 40% of the particle volume in the nuclei-mode range with low concentrations of particles in the accumulation
Emerging Technology - EnginesNOx Versus Particulate Emissions
0
2
4
6
8
10
12
14
0 0.1 0.2 0.3 0.4 0.5 0.6 0.7 0.8
DPM (g/kW-hr)
NO
x (g
/kW
-hr)
MWM D916-6
Cat 3304
Cat 3306 ATAAC
Cat 3306 DITA Cat 3176 DDC8V-92
Deutz F6L-912W
Cat 3306 PCT
DDC Series 60
1997 Nonroad EmissionStandards (100 - 175 Hp)
Typical Mining Engines Onroad
Engines
Pre-1996Nonroad Engines
Note: ISO Weighted 8-Mode Test
10
mode range. Previous studies (Dolan, et al., 1980, Baumgard, et al., 1985, Abdul-Khalek, et al., 1995) reported 1-20% of the mass in this range. The major difference between the L10 and LTA engines was the fuel injection system. The LTA engine incorporated a high-pressure fuel- injection system that injected fuel at 1,520 bar compared to 1,240 bar for the L10. The MTU research results showed higher nuclei-mode particles, which were stated to be composed of solid, carbonaceous particles with adsorbed hydrocarbons. MTU and HEI considered the particle size distribution findings preliminary in nature and HEI recommended the findings be verified with representative engines from different manufacturers. More recent work at the University of Minnesota (UMN) (Abdul-Khalek, et al., 1998) suggested that it was not necessarily injection pressure itself that lead to increased emissions of nanoparticles. A Perkins T4.40, 4 cylinder direct injection, turbocharged and aftercooled diesel operated under ISO type C1 8 mode and type B Universal 11 mode cycles produced the highest injection pressure (1200 bar) in engine mode 1, yet mode 1 produced a relatively small number concentration. Furthermore, a study of the influence of injection pressure on particle mass and number emissions in the 400 to 1000 bar range showed a continuous decrease in both mass and number emissions with increasing pressure (Jing, et al., 1996). It is likely that higher nanoparticle emissions are a consequence of reducing the mass of particles in the accumulation mode compared to the mass of semi-volatile material likely to become solid or liquid by homogeneous nucleation or condensation/adsorption as the products of combustion expand and cool and then dilute and cool. The driving force for gas-to-particle conversion processes is the saturation ratio, S, which is the ratio of the partial pressure of a nucleating species to its vapor pressure. For materials like the constituents of the SOF or sulfuric acid, the maximum saturation ratio is achieved during dilution and cooling of the exhaust (Abdul-Khalek, et al., 1999) and typically occurs at dilution ratios between about 5 and 30. The relative rates of nucleation and condensation/adsorption are an extremely nonlinear function of S. Low values of S favor adsorption/condensation, and high values favor nucleation. The rate of adsorption/condensation is proportional to the surface area of particulate matter already present (Friedlander, 1977). Thus, the large mass and consequently surface area of soot agglomerates present in the exhaust of old technology engines will take up supersaturated vapors quickly and prevent S from rising high enough to produce nucleation. On the other hand, in a modern low emission engine there is little soot surface area available to adsorb or condense supersaturated vapors making nucleation more likely. This will be especially true if the solid carbon emissions have been reduced relatively more than sulfuric acid and material that makes up the SOF. The engine used at MTU emitted low concentrations of particles in the accumulation mode diameter range, where carbonaceous particle agglomerates reside, and had very high SOF ranging from 60 to 75%. These factors would favor nucleation of the SOF as nanoparticles. The high fuel injection pressure and the fuel-air mixing strategy used in their engine probably led to more effective reduction of carbonaceous particles than SOF. Thus, the high injection pressure indirectly led to an increase in number emissions. However, other engine modifications or aftertreatment devices that reduce soot emissions more effectively than SOF or sulfuric acid are also likely to increase particle number emissions. In fact, this was exactly what has been observed downstream of some trap oxidizer systems (Kruger, et al., 1997 and Mayer, et al., 1995). The same arguments just made about the role of soot agglomerates in suppressing nucleation during dilution and cooling of the exhaust also apply to nucleation of ash
11
constituents that are volatilized at combustion temperatures, except that in the case of ash constituents the nucleation takes place inside the engine during the expansion stroke immediately after combustion. The term “as” is used to describe inorganic solid materials present in exhaust particulate matter, including metal sulfates and oxides. Prior to the work at the UMN and similar work in Switzerland (Mayer, et al., 1999), there was no evidence of significant solid ash particle nucleation except when high concentrations of metals were added with fuel additives. Tests at the UMN using the Perkins engine suggest that soot emissions may have been reduced to such a low level that the agglomerates no longer provide enough surface area to relieve ash supersaturation and prevent nucleation of ash derived from lube oil. Once ash nuclei are formed they may serve as heterogeneous nucleation sites for SOF and other species during dilution and cooling of the exhaust. In fact, the particles in the high SOF nuc lei mode observed in the past may have had ash cores.
Thus, the nanoparticles observed in the diluted exhaust of low emission diesel engines may consist of solid carbon or ash particles, semi-volatile nuclei formed by homogeneous nucleation or semi-volatile nuclei with a solid core formed by heterogeneous nucleation on existing particles. It is clear that a number of factors affect the fine particle aerosol size distributions, and if not properly understood and accounted for, can create an aerosol artifact that is representative of human exposure. Representative measurements of such particles can be made only if the sampling and dilution system simulates atmospheric dilution to the extent necessary to reproduce size distributions observed under atmospheric dilution conditions. Semi-volatile nuclei are the most sensitive to sampling biases, but even with solid particles, care must be taken to avoid coagulation and wall losses. Regardless of how particles are formed, the relationships between lab and atmospheric dilution ratio, dilution rate, saturation ratio and the other processes affecting particle formation must be understood. Ping, et al. (2000), using the same type of engine used by Abdul-Khalek, et al. (1999), reported that the particle size distributions and number concentrations were significantly affected by dilution conditions.
Another problem with laboratory data is that typically the exhaust is diluted with particle free air. This precludes interaction between the exhaust and the particles in the ambient environment. This interaction is strongly influenced by particle size, which determines atmospheric residence time, rates of coagulation, and available surface area for adsorption of semi-volatile materials present in the atmosphere and surface chemical reactions. The residence time of particles in the atmosphere is particularly important because it impacts what particles are available for inhalation and deposition. The typical residence time for 10 nm particles is quite short on the order of minutes (Harrison, 1996), because these particles diffuse to and coagulate with larger accumulation mode particles. Although their individual particle identity is lost, these particles remain in the atmosphere as part of larger particles, which coincidentally have lower alveolar deposition rates. Particles in the 0.1-to 10-µm diameter range have a much longer residence time on the order of days, while larger particles are removed from the atmosphere quite quickly by gravitational settling.
SPECIFIC AIMS Low-emission diesel engines were developed by engine manufacturers to meet EPA emission standards. Although engines used in underground mines are exempt from EPA
12
regulations, data collected by the MSHA, the UMN and the Ontario Ministry of Labor show that low-emission engines are slowly gaining entrance into the underground mining market. However, the impact of use of these modern engines on the mine air quality is unknown, particularly as related to DPM. MTU has shown in the laboratory that a low-emission heavy-duty diesel engine (with or without a diesel oxidation catalyst or DOC) can significantly reduce DPM emissions, but may alter the chemical, biological, and chemical composition and produces higher levels of fine or nuclei-mode particles (<0.056 µm in diameter) than earlier model engines (Bagley et al., 1996). In general, the MTU findings favor the use of low-emission engines and emission control technology. However, the finding that nuclei-mode particles may increase in number is cause for concern because of the increased lung deposition capability of these particles. This investigation provides additional information on the impact of modern diesel engines on underground noncoal mine air quality. The overall objective of the research project was to ensure that no new health hazards were introduced into the underground mine environment by the use of this modern technology. This was accomplished by evaluating the effects low-emission diesel engines and low sulfur fuel have on DPM concentrations, physical, chemical and biological characteristics of DPM in an underground salt mine. The specific aims of this proposal were: 1) determination of the physical characteristics of DPM emitted from low-emission engines operated in an underground salt mine environment using size separation techniques, particularly focused on several subfractions of the submicrometer particles (nuclei mode or nanoparticles), 2) extraction and characterization of the soluble organic fraction (SOF) associated with various DPM samples; 3) fractionation and quantification of key SOF-associated mutagenic and carcinogenic PAH and nitro-PAH, and 4) determination of the mutagenicity of the SOF. The hypothesis to be tested was whether low-emission engines used without a DOC can reduce DPM concentrations below 0.15 mg/m3 without negatively impacting the biological, chemical or physical characteristics of the DPM (including particle size distributions). Results obtained from this investigation will allow mine operators to estimate the cost versus benefit of using low-emission engines and low sulfur fuel to reduce DPM emissions. This study was also designed to help confirm or not confirm the presence of increased nuclei-mode or nanoparticle formation in a real world setting due to use of a low emission engine. The dilution conditions used in laboratory test cells are not representative of real-world conditions and the real-world size distributions may be different from those observed in laboratories. In addition, this evaluation should demonstrate how the two most frequently used methods to assess DPM concentrations underground (elemental carbon sampling and size selective sampling) are affected by the use of low-emission engines.
13
PROCEDURES AND METHODOLOGY Host Mine
Cote Blanche Mine is an underground salt mine. Salt is mined from one of the many domal salt formations, which exist along Louisiana’s gulf coast. Salt produced by the mine is shipped by barge to distribution points along the Mississippi River system. During the time that data were collected for this study, the mine had only two access shafts, i.e., a 2.44 m (8 ft) diameter fresh air and service shaft extending to the –396.2 m (-1300 ft) mining level and a 4.27 m (14 ft) production and exhaust air shaft extending to the lowest mining level at –457.2 m (-1500 ft). A total of approximately 6229 m3/min of air (about 220,000 cfm) was pumped underground by a 500 hp fan located on surface. Later in 2000 a third shaft was developed from the surface to the –457.2 m (-1500 ft) mining level. The new shaft is a production and fresh airshaft. The other two shafts will be used for exhaust. This will allow more than twice as much fresh air to be pumped underground. The mine uses a room and pillar mining method. On the –457.2 m (-1500 ft) level, 30.5 m (100 ft) by 30.5 m (100 ft) pillars on 45.7 m (150 ft) centers are left. Rooms are developed at 7.62 m (25 ft) high and later benched to 22.9 m (75 ft). Fresh air is directed to active work areas through the use of auxiliary fans and brattice curtains. During the time of the research study, day-to-day variation in salt production varied by less than 10 %. Salt was mined five days a week, three shifts per day with limited weekend production. Aerosol Sampling Measurement of DPM Concentrations
Three methods are used in the U.S. and Canada to determine DPM concentrations in underground mines. These are the elemental carbon (EC) method, size selective (SS) method, and the respirable combustible dust (RCD) method. Only the EC and the SS methods were used in this project. Each is described below. Elemental Carbon Method: DPM is chemically complex. It is composed of soluble organic hydrocarbons, sulfate, EC and traces of other compounds. In general, EC accounts for about 50% of the mass of DPM, but this percentage varies depending upon engine duty cycle, fuel quality, aftertreatment device and other factors.
Various techniques have been used for the analysis of carbonaceous aerosol. These methods provide estimates for TC that is in general agreement. An interlaboratory comparison of methods for the analysis of carbonaceous aerosols (Countess, 1990) showed that agreement between laboratories for TC was within 20% for all samples. However, there were large interlaboratory differences in the OC to EC ratio for all samples, with the largest differences occurring in the automotive and wood smoke dominated reference samples. Unlike the case for TC, there are no reference standards for speciation of different carbon types in complex carbonaceous aerosols. Methods that speciate EC and OC are considered operational in the sense that the method itself defines the analyte (Cadle and Groblicki, 1982).
NIOSH (Birch and Cary, 1996; NIOSH, 1998) has refined the thermal-optical method that was originally adopted for atmospheric aerosols (Johnson, et al., 1981; Cadle and
14
Groblicki, 1982; Hering, et al, 1990). This technique is a sensitive measure of the EC and OC portion of DPM. It has a working range of 6 - 630 µg/m3 with a limit of detection of about 2.0 µg/m3 for a 960 L air sample collected on a 37-mm filter with a 1.5-cm2 punch from the filter. If a lower limit of detection is desired, a larger sample volume and/or a 25-mm filter may be used. If a 1920-L sample is collected on a 25-mm filter then the lower limit of detection is 0.4 µg/m3 (NIOSH, 1998).
The method also determines the presence of OC; TC is determined by summation (EC + OC). [The Federal Republic of Germany uses the coulometric method to determine EC and TC. The method is described by Dahmann, et al., (1996) and is different from NIOSH method 5040.] Since EC is a product of combustion and is composed of inert graphitic carbon, it is a specific marker of diesel exhaust aerosol in many occupational settings where other combustion aerosols are not present. However, the OC portion of the collected aerosol is subject to interferences from other organic aerosols not associated with diesel exhaust, such as drill oil mist, hydraulic fluids, coal dust, cigarette smoke and other organic material that contribute OC aerosol. This is similar to the situation observed for RCD analysis with the exception that in some cases the NIOSH method can identify the interfering compounds and a correction factor can be applied to the TC estimate to improve the accuracy of the DPM determination.
Samples for EC are collected with or without an inertial impactor preselector to remove particles > 0.8 µm that may interfere with analysis. The simplest sampling train consists of a 10 mm Dorr-Oliver cyclone followed by a 37 mm precombusted Pallflex, ultra pure quartz fiber filter mounted in a 37 mm plastic cassette. Alternatively, the Dorr-Oliver cyclone is followed by the 0.8-µm size selective impactor described above. In this situation, DPM, which is primarily smaller than 0.8 µm, passes through the central exit of the impaction surface and is collected on the Pallflex filter. This is advantageous because large mechanically generated aerosol, such as coal dust, is not collected on the Pallflex filter and cannot interfere with EC analysis. A disadvantage of the Pallflex quartz fiber filter is the tendency to adsorb organic vapor, thus increasing the mass on the filter and the amount of OC. To correct for this adsorption of OC, 10 dynamic blanks were collected during the study. Dynamic blank samples were collected in the same way as other samples except that 2 filters were used instead of 1. The top filter (Gelman Zefluor 2 µm pore size) removes the DPM and the second filter is used to correct for OC adsorption.
Size Selective Method - The SS method is based on a body of literature developed by the UMN, and the U.S. Bureau of Mines (Rubow, et al., 1990; McCartney and Cantrell, 1992 and Cantrell, et al., 1987, 1990a,b, 1993). These studies showed that submicrometer aerosols found in coal mines were primarily diesel in origin. The difference in the aerodynamic diameter particle size between combustion and mechanically generated aerosols can be used to separate diesel aerosol from noncombustion aerosols in the collecting process. Respirable aerosol sampling at 1.7 lpm has a 50% cut point at 4.0 µm and collects a fraction of particles up to 10 µm in size (ACGIH, 1984). Diesel aerosol has a mass median aerodynamic diameter of 0.2 µm, and 90% of the particles are less than 1.0 µm in size. Thus, respirable aerosol sampling collects all diesel and nondiesel aerosol particles falling in the respirable size range. The respirable and diesel fractions may be separated using inertial impaction on greased, aluminum foil substrates. Inertial impaction removes nearly all (>90%) nondiesel particles and a small percentage (<15%) of large diesel particles. The submicrometer diesel aerosol is collected on a filter downstream of the impaction substrate.

15
Gravimetric analyses determine the mass fraction in each size range. This method allows the removal of large particles that are predominately nondiesel in origin, but still allows the respirable fraction to be calculated.
The SS sampler was originally designed for use in coal mines, which use diesel haulage vehicles equipped with water scrubbers. Scrubbers effectively remove diesel aerosol larger than 0.8 µm, thus tailoring the remaining aerosol size distribution and minimizing the amount of diesel aerosol not captured on the filter (Cantrell, Olson and Lantto 1990). The SS sampling method is also used in metal and nonmetal mines where scrubbers are seldom used. In this situation, approximately 10-15% of the total diesel aerosol is not accounted for (Cantrell, et al., 1990b), because it is larger than 0.8 µm in size and is removed on the aluminum foil substrate.
The SS sampler can be used in conjunction with the EC method if a pre-combusted, glass fiber filter is used to collect the submicrometer material. This is an advantage over other aerosol measurement techniques, which either do not collect a submicrometer sample or destroy the sample during analysis.
The UMN, U.S. Bureau of Mines, MSHA, and NIOSH have designed SS diesel aerosol samplers. The sampler used in this project is a modification of the Bureau of Mines sampler originally designed by the UMN (Rubow, et al., 1990). It was redesigned to reduce manufacturing costs (McCartney and Cantrell, 1992).
The first stage of this sampler is a 10 mm Dorr-Oliver cyclone. A four-nozzle inertial impactor with a 0.8 µm cut point follows the cyclone. The impaction surface consists of a 37-mm oiled, aluminum substrate that is used to collect respirable dust larger than 0.8 µm. Air is drawn through the sampler at 1.7 l/m using a personal sampling pump. (If the flow rate changes the cutpoints for the cyclone and impactor change) DPM, which is primarily smaller than 0.8 µm is not collected on the impaction surface rather it is collected on a polyvinyl chloride filter mounted within an MSA (Mine Safety Appliance) filter cassette (or a pre-combusted glass fiber filter if the EC method is to be used). The amount of DPM is determined gravimetrically from the MSA filter. The mass of respirable dust is determined gravimetrically from the combined mass of material collected on the MSA filter and the aluminum substrate.
The collection efficiencies of the impactors used in the Bureau and UMN samplers were measured as a function of aerosol size using mono-dispersed polystyrene latex particles ranging in size from 0.56to 1.10 µm. Details of the test protocol are available elsewhere (McCartney and Cantrell, 1992). The 50-pct-collection efficiency point (E50 pct ) for the Bureau impactor was 0.79 ± 0.01 µm with a σg of 1.18 ± 0.05, indicating a sharp cut. The σg is defined as the square root of the ratio of the particle diameter corresponding to the 84.1% collection efficiency to the diameter at an efficiency of 15.9%. The University impactor had an E50 pct cut point of 0.77 ± 0.03 µm and a σg of 1.07 ± 0.04. These experimental results agree well with previous experimental findings where the University impactor had an E50 pct of 0.76 ± 0.05 µm and a σg of 1.15 ± 0.05 (Marple, et al., 1991).
Near Real-time Instruments For Monitoring Diesel Aerosol Three instruments were used during the field study to monitor aerosol concentrations in near real-time. The instruments were a portable diffusion charger, portable photoelectric aerosol sensor and condensation particle counter. The two portable instruments logged data
16
every 10 s into onboard memory that was downloaded to a computer on a daily basis. Condensation particle counter (CPC) and ambient temperature data were logged using a RustTrac data logger. Due to the high concentration of salt dust and diesel aerosol underground the sampling train included a 10 mm Dorr Oliver cyclone, a Bureau of Mines 0.8 µm impactor and a leaky filter dilutor. The flow rate through the sampling train was 2 l/min. The leaky filter gave a dilution ratio of 14:1, and is described in Appendix A. A switching valve allowed the sample air to either come through the leaky filter or to bypass the filter and come directly to the instruments. This enabled the dilution ratio to be checked periodically. A Magnehilic gauge was used to determine the pressure drop across the filter to make sure the dilution ratio remained constant. Diffusion Charger (DC) - The DC measures the total surface area of particulate matter. Positively charged ions are produced by a glow discharge forming in the neighborhood of a very thin wire. These ions attach themselves to the sampled aerosol stream with a certain probability. The charged aerosol particles are then collected on a filter. The electric current flowing from the filter to ground potential is measured and is proportional to the number of ions attached to the particles. For particles in the free molecular range, the attachment is proportional to the surface area of the particles, but is independent of the composition of the particles (Adachi et al., 1985). Hence for particles below 100 nm diameters, this instrument measures the total surface area of the particles without being dependent on the chemistry of the particles (Siegmann et al., 1999). Photoelectric Aerosol Sensor (PAS) - Photoelectric aerosol sensors (Burtscher and Siegmann 1993, Burtscher, et. al. 1993, Hart, et. al. 1993) have been used to quantify the total surface-bound PAH content associated with DPM. The PAS gives an excellent indication of black carbon because it only measures surface bound PAH. In a typical configuration for a PAS, the aerosol passes through an electrical condenser that removes any charged particles or ions. The remaining neutral particles pass through a photoemission chamber where they are irradiated with an Ultraviolet (UV) laser or flash lamp. Particles with photoelectric work functions below the photon energy of the UV source emit electrons and become positive ions (Weiss 1997). The photoemission chamber has a small electric field that precipitates out the high mobility electrons and negative ions. The positive particles are collected on a filter and the resulting current measured by an electrometer. The intensity of the particle photoemission is linearly related to the amount of particle-bound PAHs and the particle surface area (Burtscher and Siegmann 1993). The PAS instrument measures the photoemission from aerosols, which is related to particle surface and gives a surface area concentration. Results from the studies cited are all reported as photoemission intensity over time. More details on the relation of photoemission to PAH concentration, determined by chemical analysis are given elsewhere (Hart, et al., 1993). Only submicrometer particles may be irradiated and charged. Particles larger than 1 µm cannot be charged efficiently and are removed from the aerosol before it enters the photoemission chamber. Minimum detectable particle size and concentration limits for the PAS instruments have not been reported. This method does not quantify individual PAH compounds. The detection limit is about 1 ng/m3 with a time resolution of about 1 s
17
(Burtscher and Siegmann 1993). The PAS operates in near real-time, is small in size and is battery operated. It was used in conjunction with the personal EC/OC samplers. Condensation Particle Counter (CPC) - The CPC and the similar condensation nuclei counter (CNC) are used for measuring particle number concentrations. Flows are continuous and ultrafine particles are grown in size by n-butyl alcohol vapor condensation and counted by a laser based, light-scattering detector. Various modes of operation have been used and are described elsewhere (Pui and Swift, 1995).
Measuring Aerosol Mass Size Distributions Underground
The micro-orifice uniform deposit impactor (MOUDI) and a prototype nano-MOUDI
were used during the study in an attempt to determine the size distribution of the mine aerosol. The MOUDIs were provided by NIOSH and one was modified at the UMN to accommodate the nano stack. Both instruments are described below. Micro-Orifice Uniform Deposit Impactor (MOUDI) and nano-MOUDI - Marple et al. (1991) describes the MOUDI in detail. It is a multi-stage inertial impactor, operated at 30 l/min, which can separate aerosol particles by size from 0.050 µm to 18 µm. Gravimetric analyses of MOUDI-derived size distributions provide accurate estimates of DPM for particles with aerodynamic diameter sizes in the range of <0.1 to 0.8 µm, and respirable dust concentrations for sizes in the range of <0.1 to 10 µm. Previous studies (Ambs et al., 1994, Watts et al. 1995) have shown that the MOUDI is capable of providing size distributions in underground mines. A Teflon membrane filter (Daigger & Co.,Whelling, IL) was used in the final stage of the MOUDI to collect particles < 0.1 µm in size; typically about 1 mg of fine particles was collected on this filter (B. Cantrell, EPA, Personal Communication). The MOUDI substrates and filter were analyzed gravimetrically to determine the mass deposited in each size range. The size distribution was then determined by applying software developed by UMN’s Particle Technology Laboratory.
The nano-MOUDI (Marple, et al., 1994) has 13 cut-sizes ranging from 0.010 to 18 µm and is designed to obtain four cut-sizes per decade. For cut-sizes above 50 µm, micro-orifice technology alone is sufficient to obtain the selected cut-points, but for cut-sizes below 50 µm micro-orifice nozzle technology is combined with low-pressure operation. Gravimetric analysis determined the mass collected on aluminum foil substrates and a final stage filter.
The aerosol mass size distributions obtained from these instruments, however, are of questionable value. The MOUDI obtains a mass sample on multiple substrates to determine the mass size distribution. Silicon oil is used on the aluminum foil substrates to assist in the collection of particles and to prevent particle bounce. The substrates are hand cut, weighed, oiled, baked and reweighed and classified based upon the amount of oil on the substrates. They are classified into four categories: heavy, medium, light or ultra light. The type of substrate used in the MOUDI is dependent upon the amount of mass expected to be collected. For this study, substrates with a heavy layer of oil were on the top followed by mediums and lights. Ultra lights were used in the nano-MOUDI stack. If oil is lost for any reason after the substrates are weighed then the mass of material is affected and the results are compromised. During this study oil, was repeatedly lost either because the substrate touched
18
the orifice plate above it or because it migrated to the outer edge and touched the hold down ring. Oiled substrates were subjected to the high mine ambient temperature, thus making the oil less viscous then normal. In an attempt to solve these problems, many of the Teflon and rubber o-rings used in both instruments were replaced. This necessitated taking apart the orifice stages, replacing the o-rings and reassembling the stages.
Another problem that affected the instruments was clogging of the micro-orifice stages, particularly stages 10 through 13. The NIOSH MOUDI was modified before the study to allow stage 10 (0.056 µm) to be used. In past studies this stage had not been used. The research team observed that the micro-orifice stages became clogged early on in the study and repeated attempts to clean the stages in the field were unsuccessful. In particular, flow in the nano-MOUDI stack was impeded. Failure to achieve the proper flow rate adversely affects particle deposition. It is quite likely that most of the problems were a result of the high concentration of diesel and salt aerosol that caused the micro-orifice jets to clog.
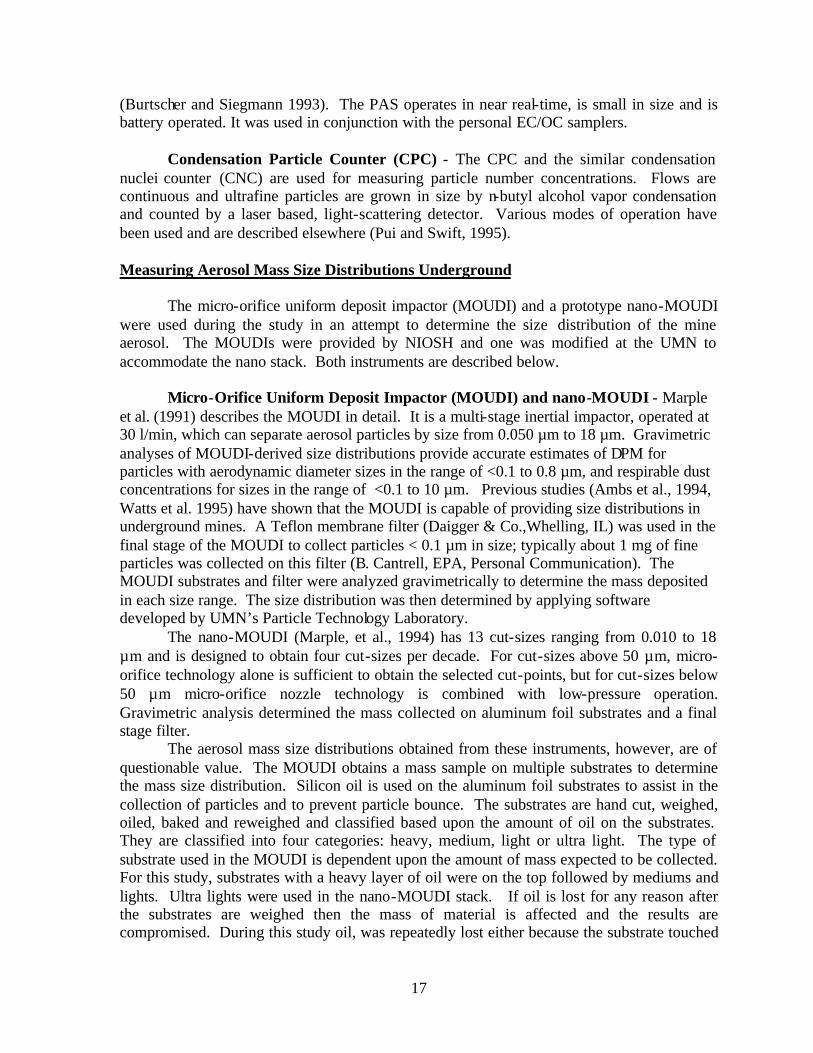
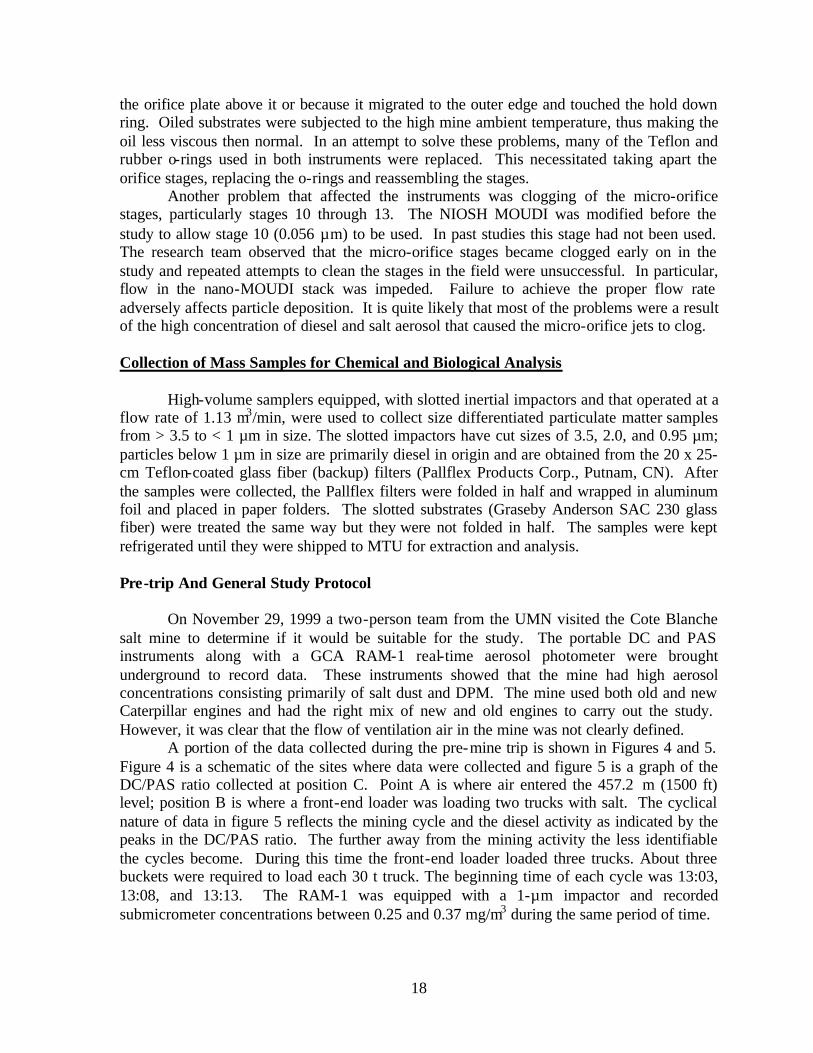
Collection of Mass Samples for Chemical and Biological Analysis High-volume samplers equipped, with slotted inertial impactors and that operated at a flow rate of 1.13 m3/min, were used to collect size differentiated particulate matter samples from > 3.5 to < 1 µm in size. The slotted impactors have cut sizes of 3.5, 2.0, and 0.95 µm; particles below 1 µm in size are primarily diesel in origin and are obtained from the 20 x 25-cm Teflon-coated glass fiber (backup) filters (Pallflex Products Corp., Putnam, CN). After the samples were collected, the Pallflex filters were folded in half and wrapped in aluminum foil and placed in paper folders. The slotted substrates (Graseby Anderson SAC 230 glass fiber) were treated the same way but they were not folded in half. The samples were kept refrigerated until they were shipped to MTU for extraction and analysis. Pre-trip And General Study Protocol On November 29, 1999 a two-person team from the UMN visited the Cote Blanche salt mine to determine if it would be suitable for the study. The portable DC and PAS instruments along with a GCA RAM-1 real-time aerosol photometer were brought underground to record data. These instruments showed that the mine had high aerosol concentrations consisting primarily of salt dust and DPM. The mine used both old and new Caterpillar engines and had the right mix of new and old engines to carry out the study. However, it was clear that the flow of ventilation air in the mine was not clearly defined. A portion of the data collected during the pre-mine trip is shown in Figures 4 and 5. Figure 4 is a schematic of the sites where data were collected and figure 5 is a graph of the DC/PAS ratio collected at position C. Point A is where air entered the 457.2 m (1500 ft) level; position B is where a front-end loader was loading two trucks with salt. The cyclical nature of data in figure 5 reflects the mining cycle and the diesel activity as indicated by the peaks in the DC/PAS ratio. The further away from the mining activity the less identifiable the cycles become. During this time the front-end loader loaded three trucks. About three buckets were required to load each 30 t truck. The beginning time of each cycle was 13:03, 13:08, and 13:13. The RAM-1 was equipped with a 1-µm impactor and recorded submicrometer concentrations between 0.25 and 0.37 mg/m3 during the same period of time.
19
Figure 4. Schematic of the sampling locations (B-D) during the pre-trip. Point A demarks the clean air intake for the 457.2 m (1500 ft) level and the arrow show the direction of the ventilation air flow.
Figure 5. Data collected at sample location C.
Caterpillar 1998, 3408 F electronically controlled engines powered the loader and trucks. The mine temperature was between 33.9 and 35oC (93 and 95oF), and the barometric pressure was 108.2 kPa (15.7 psi).
This mine was chosen for the study primarily because it had the right mix of new and old engines and because the mine management was willing to host and provide logistical
Downwind 1 crosscut - 1500 ft level
0.0
0.5
1.0
1.5
2.0
2.5
12:57:36 13:00:29 13:03:22 13:06:14 13:09:07 13:12:00 13:14:53 13:17:46 13:20:38
Time
Rat
io D
C/P
AS
Point C
20
support for the study. It was recognized from the outset that the lack of a defined ventilation pattern and the high mine temperatures were disadvantages. The lack of a defined ventilation pattern would make defining an upwind/downwind sampling scenario difficult and the high temperatures exceed the 32.2 oC (90oF) recommended operating temperature of the TSI 3020 CPC. Total diesel horsepower at the mine was about 10,000 hp.
The two-week field study was carried out from February 21 to March 3, 2000. The research team entered the mine in the morning with the day shift and set up at the two locations shown in Figure 6. The third shift prepared the mining sections by blasting the salt face. During the first week one or two 30 t haul trucks powered by 1991 or 1992 Caterpillar 3408 C engines were loaded by a Caterpillar front-end loader powered by a similar engine. Typically around 30 to 35 truckloads were required to remove the salt from the face. The number of truckloads per day was recorded to give an estimate of the amount of work done at the test location.
The research team attempted to record the amount of fuel consumed using a Floscan (Floscan Instrument Co., 3016 NE Blakeley St, Seattle, WA 98105) fuel flow meter enclosed in a suitcase and mounted on the front-end loader. Two infrared turbine sensors were mounted in the engine's fuel system: one measured fuel supply flow to the engine, and the other measured fuel return flow to the fuel tank. Signal outputs from these sensors were processed by the flow meter, and a 0-5 V output proportional to net fuel consumption was converted and recorded by the data logger into instantaneous fuel flow in gal/h. The rate of fuel flow exceeded the capacity of the meter despite assurances from the manufacturer to the contrary, thus this effort was not successful. The trucks and front-end loader were not equipped with air-conditioned cabs.
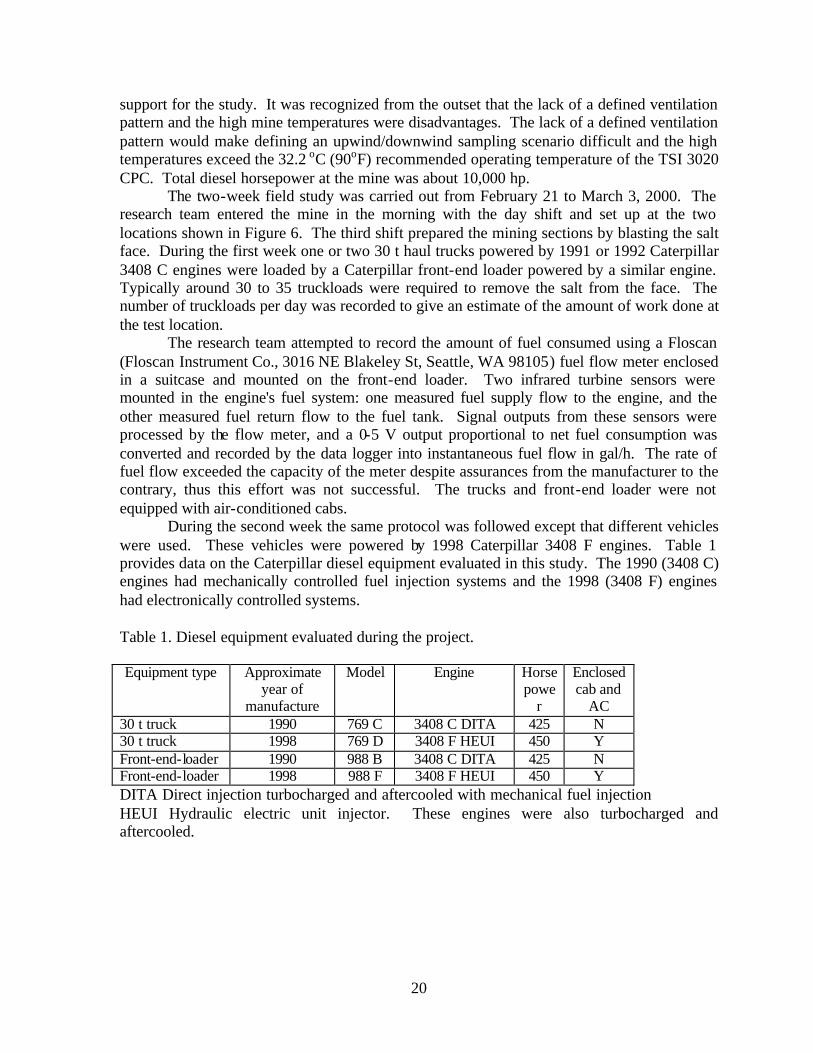
During the second week the same protocol was followed except that different vehicles were used. These vehicles were powered by 1998 Caterpillar 3408 F engines. Table 1 provides data on the Caterpillar diesel equipment evaluated in this study. The 1990 (3408 C) engines had mechanically controlled fuel injection systems and the 1998 (3408 F) engines had electronically controlled systems. Table 1. Diesel equipment evaluated during the project. Equipment type Approximate
year of manufacture
Model Engine Horsepowe
r
Enclosed cab and
AC 30 t truck 1990 769 C 3408 C DITA 425 N 30 t truck 1998 769 D 3408 F HEUI 450 Y Front-end-loader 1990 988 B 3408 C DITA 425 N Front-end-loader 1998 988 F 3408 F HEUI 450 Y DITA Direct injection turbocharged and aftercooled with mechanical fuel injection HEUI Hydraulic electric unit injector. These engines were also turbocharged and aftercooled.
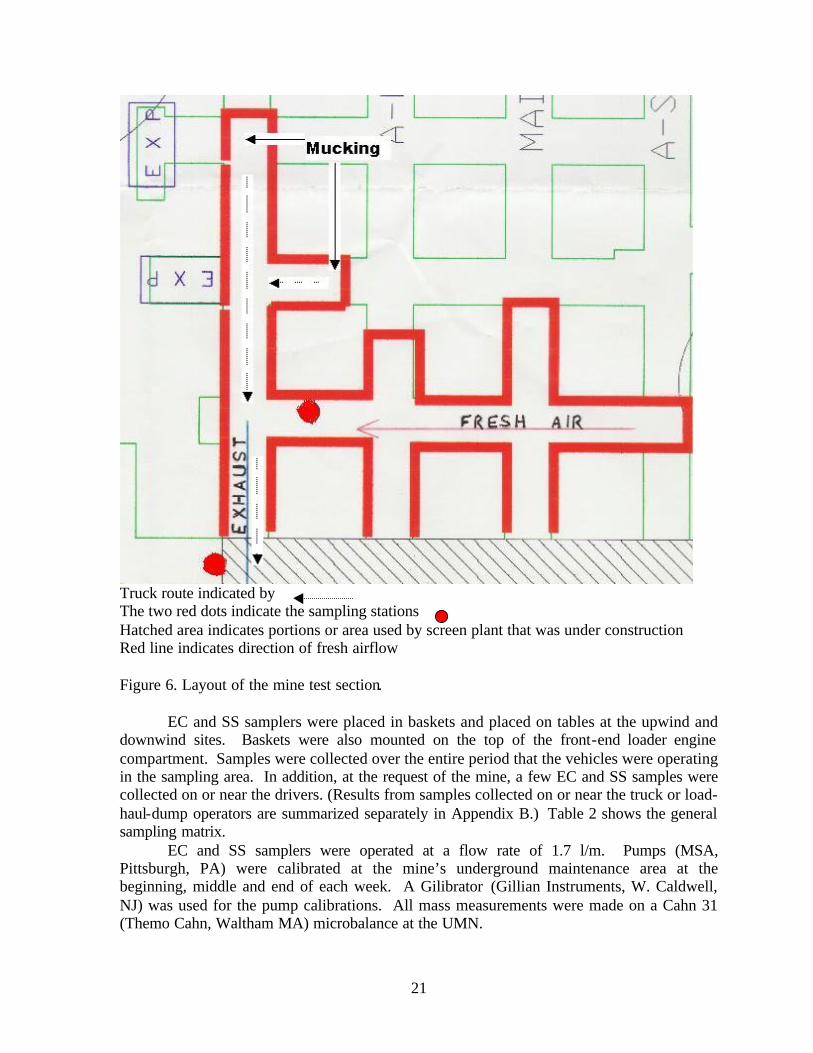
21
Truck route indicated by The two red dots indicate the sampling stations Hatched area indicates portions or area used by screen plant that was under construction Red line indicates direction of fresh airflow Figure 6. Layout of the mine test section.
EC and SS samplers were placed in baskets and placed on tables at the upwind and downwind sites. Baskets were also mounted on the top of the front-end loader engine compartment. Samples were collected over the entire period that the vehicles were operating in the sampling area. In addition, at the request of the mine, a few EC and SS samples were collected on or near the drivers. (Results from samples collected on or near the truck or load-haul-dump operators are summarized separately in Appendix B.) Table 2 shows the general sampling matrix. EC and SS samplers were operated at a flow rate of 1.7 l/m. Pumps (MSA, Pittsburgh, PA) were calibrated at the mine’s underground maintenance area at the beginning, middle and end of each week. A Gilibrator (Gillian Instruments, W. Caldwell, NJ) was used for the pump calibrations. All mass measurements were made on a Cahn 31 (Themo Cahn, Waltham MA) microbalance at the UMN.
22
Table 2. General daily sampling matrix.
Number of Approximate number of samples and location Sample type days Upwind Vehicle Downwind High-volume 10 2 NA 4 Size selective (SS) 10 3 3 3 Elemental Carbon (EC) 10 3 3 3 Nano-MOUDI and MOUDI 10 1 NA 2 NA - not applicable to this situation. Upwind Sampling Station
The upwind sampling station was located at the point where ventilation air entered the test section. The top red bullet indicates the sampling station and the red arrow in Figure 6 indicates the direction of ventilation air. This section was ventilated by air contaminated with dust and vehicle exhaust generated in other parts of the mine. In past studies the background concentration was subtracted from the concentration measured at the downwind location to determine the amount contributed by the test vehicles. However, this was not done because of the inability to consistently determine the direction of air movement, and because levels at the upwind station were sometimes higher than the downwind station. As a result the study had two fixed positions that the two haul trucks passed on their way to and from the load and dump points. A MOUDI, two high-volume samplers and two baskets of EC and SS samplers were located at the upwind position. Vehicle Sampling
EC and SS samplers located on the front-end loader were in a basket(s) that was strapped to the engine compartment near the operator’s position. At the mine’s request the original sampling plan was modified so that a few samples could be collected near or on the drivers. EC and SS samplers located in the cabs were either placed next to the driver or worn by the driver. The number of available sample cassettes and pumps limited the number of cab samples and reduced the number of samples collected on the engine compartment. The operators stopped at the beginning and end of each day in front of the downwind location to pick up and drop off the samplers. Downwind Sampling Location
The downwind area sampling station was located downwind from the test section and is denoted in Figure 6 by the red bullet and the exhaust arrow. Trucks passed by this station on their way to and from the mucking area. Ideally, this location would have been far enough downwind that only aerosol from the test section would reach the location. However, this was not possible at the mine. The sampling station was located beside the haulage route
23
where the dump trucks passed after being loaded with salt. In addition, other traffic passed this site. However, it was observed that the amount of other diesel and non-diesel traffic did not differ between week 1 and week 2.
The nano-MOUDI, two high-volume samplers, two baskets of EC and SS samplers, DC, PAS and CPC were located at the downwind sampling station. A RAM-1 photometer equipped with a 1-µm impactor was also located at this sampling location. Data from the continuous reading instruments were logged using a RustTrac data logger (Thermo Westronics, 22001 N. Park Dr. Ste 100, Kingwood, TX, 98105) and the leaky filter dilutor was used to dilute mine aerosol 14:1. Temperature at this location varied between 98 and 42.2oC (108oF), relative humidity was about 40%, and the barometric pressure was 94.5 kPa (13.7 psi). Laboratory Analyses of High-Volume Samples DPM, SOF, Sulfate, and Solids Determinations The backup filters from the high-volume samplers were handled using procedures similar to those used in previous in-mine studies (e.g., Bagley et al., 1991, 1992, Bagley and Gratz, 1998, Carlson et al., 1996, Johnson et al., 1996). The filters were equilibrated in a constant relative humidity (45 ± 2% RH) and weighed (to nearest 0.01 mg) before and after exposure. The difference in mass before and after exposure provided the mass of DPM collected on the filter. After the second mass determination, the exposed filters were stored at -18±4°C until they were extracted (separately) for 6 h with dichloromethane solvent in a Soxhlet apparatus to obtain the particle-associated SOF. The mass of SOF was determined gravimetrically on a small (100 µL) aliquot of the total extract, which was brought to dryness. All extracts were stored frozen (-18 + 4°C) until they were divided into aliquots for Ames assay and PAH quantification. After SOF extraction, the filters were extracted by sonication in distilled, deionized water to obtain the sulfate fraction. Sulfate concentrations were determined on these extracts using an ion chromatograph with a conductance detector by comparison to an aqueous standard curve consisting of solutions having known concentrations of potassium sulfate. Because the filters could not be ammoniated after sampling to stabilize the sulfates, these values were only estimates. Solids levels were estimated by subtracting the measured SOF and sulfates concentrations from the measured DPM concentration, as follows:
Solids = DPM - SOF - sulfates
Representative unexposed filters were analyzed to assess background contributions to mutagenicity and PAH/nitro-PAH composition. Compound Quantifications It was originally proposed that organic extracts obtained from the aluminum foil substrates and Teflon filters from the MOUDI and nano-MOUDI could be used for determination of PAH and nitro-PAH levels, in particular, associated with these very fine particles. Due to the problems outlined above, these studies could not be conducted. However, it was possible to assay for a much wider range of PAH and nitro-PAH (over twice
24
the originally proposed number) and to assay for a series of compounds (hopanes) that would indicate lube oil contributions to the DPM organic component.
The SOF extracts of particulate matter samples collected in the underground mine were analyzed by two separate gas chromatography/mass spectrometry (GCMS) methods. The first method was used to quantify the PAH and hopanes. The second GCMS method was used for the measurement of nitro-PAH. Both analyses were performed using a Hewlett Packard 5973 GCMS equipped with a 30-meter HP-5MS (0.25 µm film thickness, 0.25 mm diameter). The analysis of PAH and hopanes were performed using a modified version of the methods described by Schauer et al. (1999) and Sheesley et al. (2000). Accurately measured aliquots in the range of 5.0 to 6.0 ml of SOF extract were spiked with deuterated internal standards including acenaphthene-d10, chrysene-d12, dibenz[ah]anthracene-d14, and cholestane-d4 and then concentrated to 250 µl. 1.0 µl of the concentrated extract was introduced in the GCMS instrument with the injector and transfer line at 300oC and the GC oven at 65 oC. The injector and transfer line are held at constant temperature throughout the sample analysis and the column was ramped to 300oC at 10oC per minute after a 10-minute hold at 65oC. The mass spectrometer was operated in scan mode collecting electron ionization (EI) spectra covering the range of 50 to 550 mass to charge units (amu). Quantification standards were analyzed by the GCMS using the exact same GCMS method. The quantification standards contain precisely known concentrations of internal standards at nominally the same concentrations as the samples. Internally normalized response factors were generated using multi-point calibration curves that were generated before and after the entire set of samples were generated. In addition, standards were analyzed after each set of 5 samples to assure that the quantification response factors were stable throughout the analysis session.
Separate aliquots of the SOF extracts were analyzed for nitro-PAH. Aliquots in the range of 5.0 to 6.0 ml of the SOF extracts were spiked with 4-nitro-biphenyl and then concentrated to a final volume of 1.0 ml. 1.0 µl of the concentrated extract was introduced in the GC/MS instrument with the injector and transfer line at 300oC and the GC oven at 65oC. The injector and transfer line are held at constant temperature throughout the sample analysis and the column was ramped to 240oC at 30oC per minute followed by a ramp to 300 oC at 10oC per minute. After reaching the final temperature, the column was held at the final temperature for 20minutes. The mass spectrometer was operated in single ion monitoring mode collecting selected ions determined from the analysis of authentic standards. The quantification standards were prepared from the National Institute of Standards (NIST) Standard Reference Material 1587 (Nitrated Polycyclic Aromatic Hydrocarbons in Methanol) and were also spiked with the nitro-biphenyl internal standard. Internally normalized response factors were generated using multi-point calibration curves that were generated at the before and after the entire set of samples were generated. In addition, standards were analyzed after each set of 5 samples to assure that the quantification response factors were stable throughout the analysis session. Biological (Mutagenic) Activity Determinations Mutagenicity of the SOF was determined using a small dish modification of the microsuspension version (Bagley et al., 1993, 1996; Kado et al., 1986) of the Salmonella/microsome mutagenicity assay (Maron and Ames, 1983). A known mass of SOF
25
(as obtained above) was dissolved in a known volume of dimethyl sulfoxide (DMSO). These samples were stored in sealed glass or Teflon vials at -15 to -20°C prior to analysis. As in the previous NIOSH-funded study, the primary tester strain used was TA98, which detects frameshift mutagenic activity and has consistently been found to provide the highest- level response with diesel-derived organic compounds (e.g., Bagley et al.,1995 and 1996). S9 prepared from Arochlor 1254- induced male Sprague-Dawley rats was obtained from Molecular Toxicology, Inc. (Annapolis, MD) and used to determine whether indirect-acting compounds requiring metabolic activation could be detected. Tester strain TA100 (detecting both frameshift and basepair substitution mutagenic activity) was used without metabolic activation if there was sufficient sample mass still available. Other tester strains were not used due to insufficient sample mass. The modified microsuspension assay was conducted following previously published procedures (Bagley et al., 1996). The tester strains were grown in Nephelo flasks containing Oxoid broth No. 2 (Unipath Co., Ogdensburg, NY) with 25 µg/mL ampicillin at 37°C and 125 rpm for approximately 10 hours on a gyratory shaker. The cell suspension was centrifuged (10,000 x g for 10 minutes at 4°C) and concentrated 10-fold in phosphate-buffered saline (0.015 M, pH 7.4). For these assays, 100 µl of the same phosphate buffer, 5 µl of sample in dimethyl sulfoxide and 100 µl of concentrated bacteria (about 1.0 x 10¹⁰ cells/mL) were transferred to 12 x 75 mm test tubes. If S9 was used, 100 µl of a 2% mixture was added in place of the buffer. These tubes were capped and placed on a gyratory shaker in the dark at 37°C and 180 to 200 rpm for 90 minutes. Top agar (7 mL) was added to each tube and the contents mixed and poured onto the bottom agar dishes (60 x 15 mm containing 10 mL of bottom agar). All tests were conducted using duplicate dishes per dilution. Test dishes were counted after 63 hours of incubation at 37±2°C using an automatic colony counter. Controls were run on each test date for spontaneous revertant levels (in DMSO), genotypic checks, positive controls +S9, and sterility checks on assay components (Bagley et al., 1996, Maron and Ames 1983). The samples were divided into two groups, i.e., upwind or downwind. Each group was assayed on the same date to eliminate day-to-day variability in response by the tester strains. Mutagenic activity (revertants/µg) is determined from the linear portion of the dose-response curves using a least squares regression (Maron and Ames 1983). Fuel and Oil Analyses The general characteristics of the diesel fuel used in this study are presented in Table 3. This fuel met all on-highway use diesel fuel specifications and is notable for its ultra low sulfur level and its relatively low aromatic content. The same batch of fuel was used for both weeks of this study. The manufacturer's recommended lubricating oil was in the engines. Samples of the fuel and unused and used lube oil were also tested for levels of PAH and hopanes. The fuel and lube oil samples were first diluted in dichloromethane to give similar concentrations of organic mass as the SOF samples and then were analyzed using the same procedures. Detection limits for PAH and hopanes were about 0.05 µg/g and 0.5 µg/g, respectively.
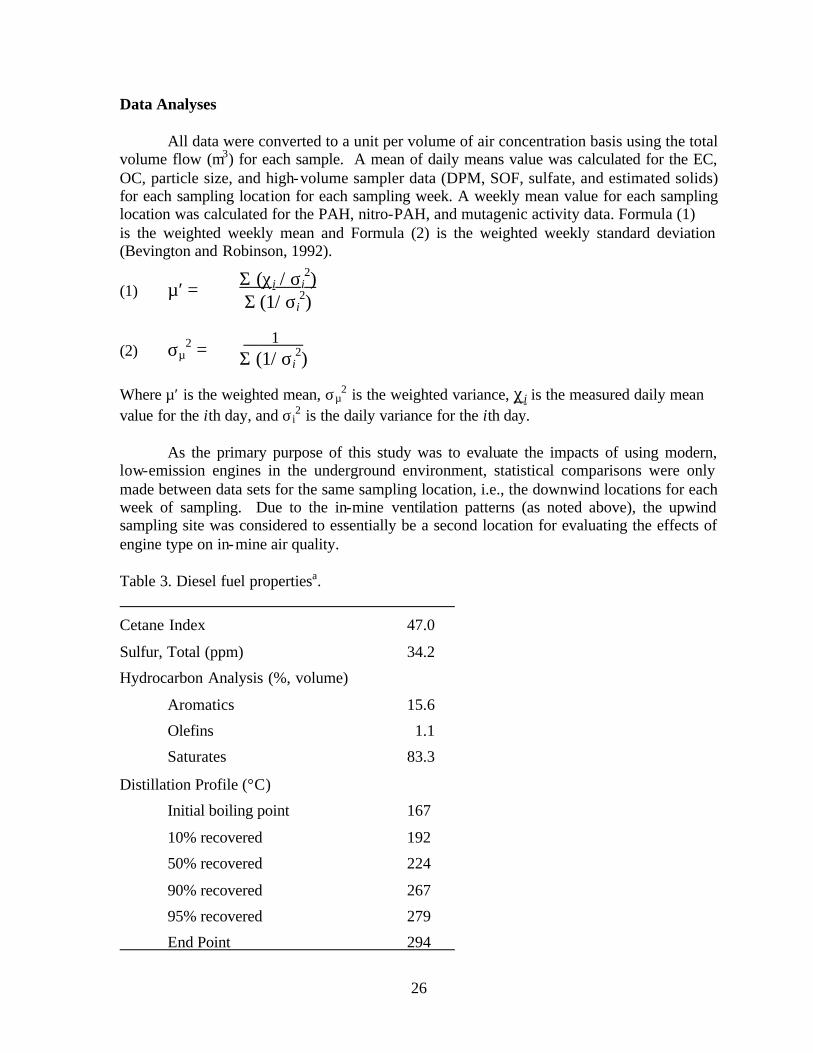
26
Data Analyses All data were converted to a unit per volume of air concentration basis using the total volume flow (m3) for each sample. A mean of daily means value was calculated for the EC, OC, particle size, and high-volume sampler data (DPM, SOF, sulfate, and estimated solids) for each sampling location for each sampling week. A weekly mean value for each sampling location was calculated for the PAH, nitro-PAH, and mutagenic activity data. Formula (1) is the weighted weekly mean and Formula (2) is the weighted weekly standard deviation (Bevington and Robinson, 1992). (1) µ′ = (2) σµ
2 = Where µ′ is the weighted mean, σµ
2 is the weighted variance, χi is the measured daily mean value for the ith day, and σi
2 is the daily variance for the ith day. As the primary purpose of this study was to evaluate the impacts of using modern, low-emission engines in the underground environment, statistical comparisons were only made between data sets for the same sampling location, i.e., the downwind locations for each week of sampling. Due to the in-mine ventilation patterns (as noted above), the upwind sampling site was considered to essentially be a second location for evaluating the effects of engine type on in-mine air quality. Table 3. Diesel fuel propertiesa.
Cetane Index 47.0
Sulfur, Total (ppm) 34.2
Hydrocarbon Analysis (%, volume)
Aromatics 15.6
Olefins 1.1
Saturates 83.3
Distillation Profile (°C)
Initial boiling point 167
10% recovered 192
50% recovered 224
90% recovered 267
95% recovered 279
End Point 294
Σ (χi / σi2)
Σ (1/ σi2)
1 Σ (1/ σi
2)
27
a As analyzed by Core Laboratories, Houston, TX
As different engines were being used between the two weeks, it was originally
intended to normalize the measured emissions concentrations with respect to the engines' respective power outputs. This required determination of each engine's fuel consumption. However, as previously mentioned, fuel consumption could not be determined due to measuring equipment malfunctions. Therefore, it was decided to normalize the data based on truck activity in the sampling areas, which would be related to the amount of salt produced.
Table 4 shows the number of trucks passing by the downwind position carrying salt for each day during the two-week study. These data are a measure of production and were used to normalize the aerosol data to account for the difference in the amount of work done each week. The average number of trucks per day for the entire period was 34. Daily average concentrations were divided by the number of trucks passing by the sampling locations that day and multiplied by 34. During the first week an average of 26.6 trucks were observed and during the second week that increased to 40.6 trucks per day. This difference is due to the greater efficiency of the new trucks that were in a better state of maintenance and were capable of greater performance. Table 4. Number of trucks loaded with salt passing by the sampling stations.
Week 1 Week 2 Date Number of trucks Date Number of trucks 2/21 24 2/28 28 2/22 24 2/29 34 2/23 25 3/1 50 2/24 37 3/2 32 2/25 23 3/3 59
Average 26.6 Average 40.6
T-tests were performed to test the null hypothesis that the weekly means were equal. A more rigorous statement of the null hypothesis follows:
Where µ1 is the population mean of one distribution and µ2 is the population mean of the other (Devore and Peck, 1993).
The t-test assumes that the population distribution of the sampling method is approximately normal, though the underlying physical distribution need not be normal. The populations characterized by µ1 and µ 2 were sampled to provide estimates of µ1 and µ 2. These estimates are the sample means, x1 and x2 respectively. Associated with these sample means are their respective sample standard deviations of the mean, s1 and s2.
Since x1 and x2 (estimates of µ1 and µ 2) have associated, non-negligible, and non-equal standard deviations, it is appropriate to use the pooled form of the t-test. The pooled t-test takes into account the unequal uncertainties both sample means when calculating t, the
0:)1( 21 =− µµoH
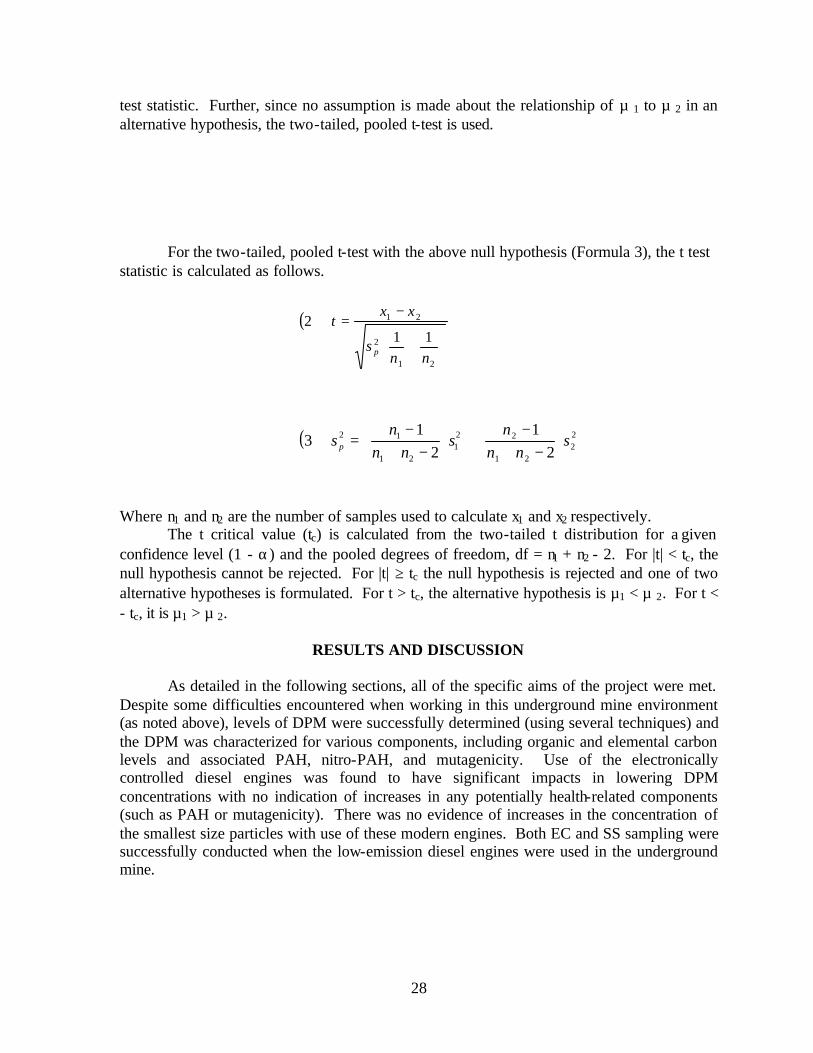
28
test statistic. Further, since no assumption is made about the relationship of µ 1 to µ 2 in an alternative hypothesis, the two-tailed, pooled t-test is used.
For the two-tailed, pooled t-test with the above null hypothesis (Formula 3), the t test
statistic is calculated as follows.
Where n1 and n2 are the number of samples used to calculate x1 and x2 respectively. The t critical value (tc) is calculated from the two-tailed t distribution for a given
confidence level (1 - α) and the pooled degrees of freedom, df = n1 + n2 - 2. For |t| < tc, the null hypothesis cannot be rejected. For |t| ≥ tc the null hypothesis is rejected and one of two alternative hypotheses is formulated. For t > tc, the alternative hypothesis is µ1 < µ 2. For t < - tc, it is µ1 > µ 2.
RESULTS AND DISCUSSION As detailed in the following sections, all of the specific aims of the project were met. Despite some difficulties encountered when working in this underground mine environment (as noted above), levels of DPM were successfully determined (using several techniques) and the DPM was characterized for various components, including organic and elemental carbon levels and associated PAH, nitro-PAH, and mutagenicity. Use of the electronically controlled diesel engines was found to have significant impacts in lowering DPM concentrations with no indication of increases in any potentially health-related components (such as PAH or mutagenicity). There was no evidence of increases in the concentration of the smallest size particles with use of these modern engines. Both EC and SS sampling were successfully conducted when the low-emission diesel engines were used in the underground mine.
( )
+
−=
21
2
21
112
nns
xxt
p
( ) 22
21
221
21
12
21
21
3 snn
ns
nnn
s p
−+
−+
−+
−=
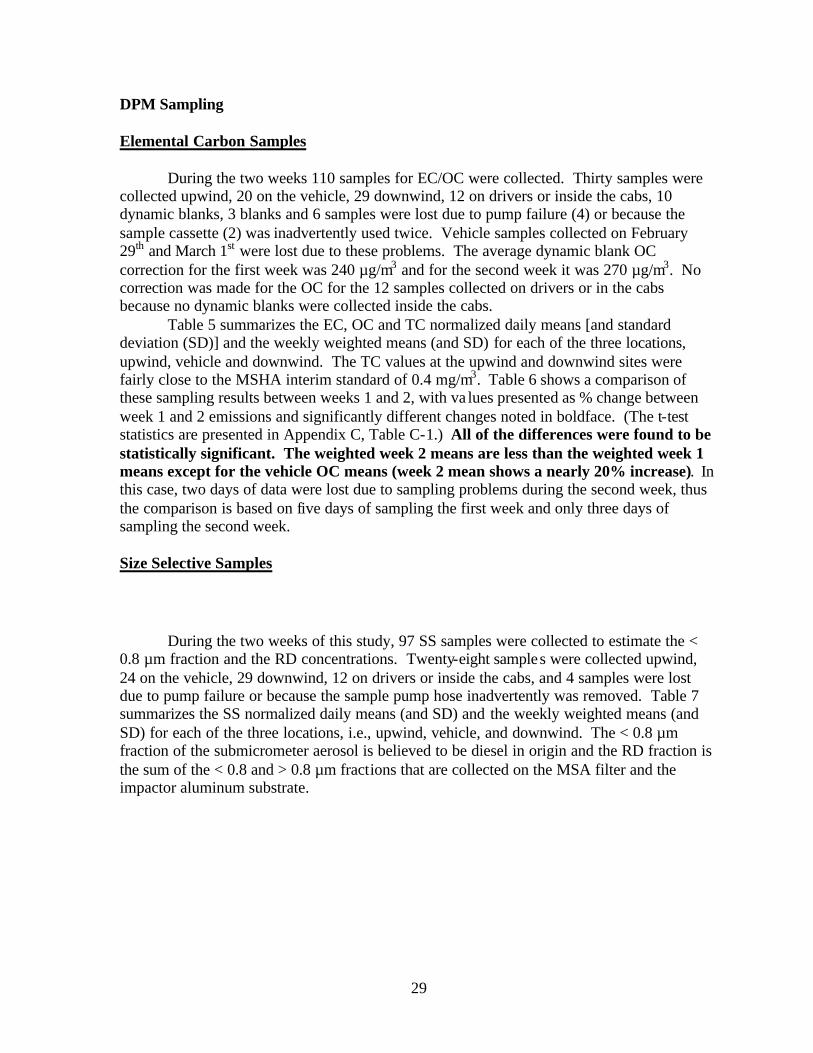
29
DPM Sampling Elemental Carbon Samples
During the two weeks 110 samples for EC/OC were collected. Thirty samples were collected upwind, 20 on the vehicle, 29 downwind, 12 on drivers or inside the cabs, 10 dynamic blanks, 3 blanks and 6 samples were lost due to pump failure (4) or because the sample cassette (2) was inadvertently used twice. Vehicle samples collected on February 29th and March 1st were lost due to these problems. The average dynamic blank OC correction for the first week was 240 µg/m3 and for the second week it was 270 µg/m3. No correction was made for the OC for the 12 samples collected on drivers or in the cabs because no dynamic blanks were collected inside the cabs.
Table 5 summarizes the EC, OC and TC normalized daily means [and standard deviation (SD)] and the weekly weighted means (and SD) for each of the three locations, upwind, vehicle and downwind. The TC values at the upwind and downwind sites were fairly close to the MSHA interim standard of 0.4 mg/m3. Table 6 shows a comparison of these sampling results between weeks 1 and 2, with va lues presented as % change between week 1 and 2 emissions and significantly different changes noted in boldface. (The t-test statistics are presented in Appendix C, Table C-1.) All of the differences were found to be statistically significant. The weighted week 2 means are less than the weighted week 1 means except for the vehicle OC means (week 2 mean shows a nearly 20% increase). In this case, two days of data were lost due to sampling problems during the second week, thus the comparison is based on five days of sampling the first week and only three days of sampling the second week.
Size Selective Samples
During the two weeks of this study, 97 SS samples were collected to estimate the <
0.8 µm fraction and the RD concentrations. Twenty-eight samples were collected upwind, 24 on the vehicle, 29 downwind, 12 on drivers or inside the cabs, and 4 samples were lost due to pump failure or because the sample pump hose inadvertently was removed. Table 7 summarizes the SS normalized daily means (and SD) and the weekly weighted means (and SD) for each of the three locations, i.e., upwind, vehicle, and downwind. The < 0.8 µm fraction of the submicrometer aerosol is believed to be diesel in origin and the RD fraction is the sum of the < 0.8 and > 0.8 µm fractions that are collected on the MSA filter and the impactor aluminum substrate.
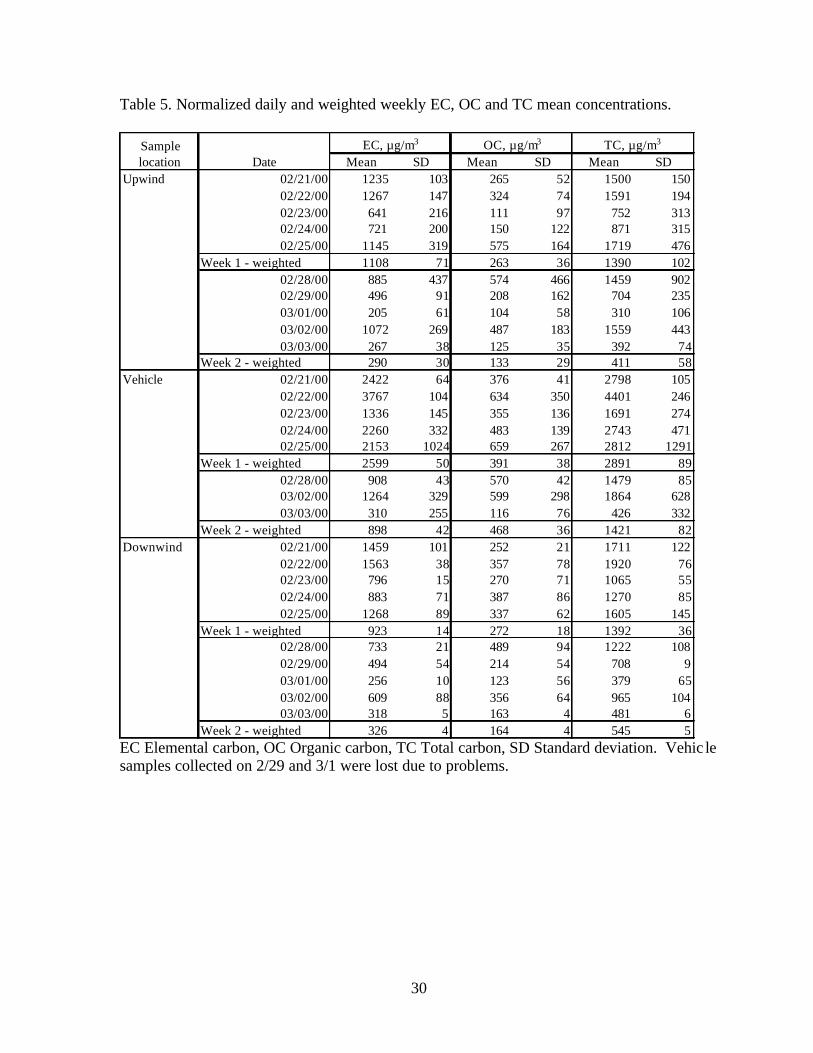
30
Table 5. Normalized daily and weighted weekly EC, OC and TC mean concentrations.
EC Elemental carbon, OC Organic carbon, TC Total carbon, SD Standard deviation. Vehic le samples collected on 2/29 and 3/1 were lost due to problems.
Sample EC, µg/m3 OC, µg/m3 TC, µg/m3
location Date Mean SD Mean SD Mean SDUpwind 02/21/00 1235 103 265 52 1500 150
02/22/00 1267 147 324 74 1591 19402/23/00 641 216 111 97 752 31302/24/00 721 200 150 122 871 31502/25/00 1145 319 575 164 1719 476
Week 1 - weighted 1108 71 263 36 1390 10202/28/00 885 437 574 466 1459 90202/29/00 496 91 208 162 704 23503/01/00 205 61 104 58 310 10603/02/00 1072 269 487 183 1559 44303/03/00 267 38 125 35 392 74
Week 2 - weighted 290 30 133 29 411 58Vehicle 02/21/00 2422 64 376 41 2798 105
02/22/00 3767 104 634 350 4401 24602/23/00 1336 145 355 136 1691 27402/24/00 2260 332 483 139 2743 47102/25/00 2153 1024 659 267 2812 1291
Week 1 - weighted 2599 50 391 38 2891 8902/28/00 908 43 570 42 1479 8503/02/00 1264 329 599 298 1864 62803/03/00 310 255 116 76 426 332
Week 2 - weighted 898 42 468 36 1421 82Downwind 02/21/00 1459 101 252 21 1711 122
02/22/00 1563 38 357 78 1920 7602/23/00 796 15 270 71 1065 5502/24/00 883 71 387 86 1270 8502/25/00 1268 89 337 62 1605 145
Week 1 - weighted 923 14 272 18 1392 3602/28/00 733 21 489 94 1222 10802/29/00 494 54 214 54 708 903/01/00 256 10 123 56 379 6503/02/00 609 88 356 64 965 10403/03/00 318 5 163 4 481 6
Week 2 - weighted 326 4 164 4 545 5
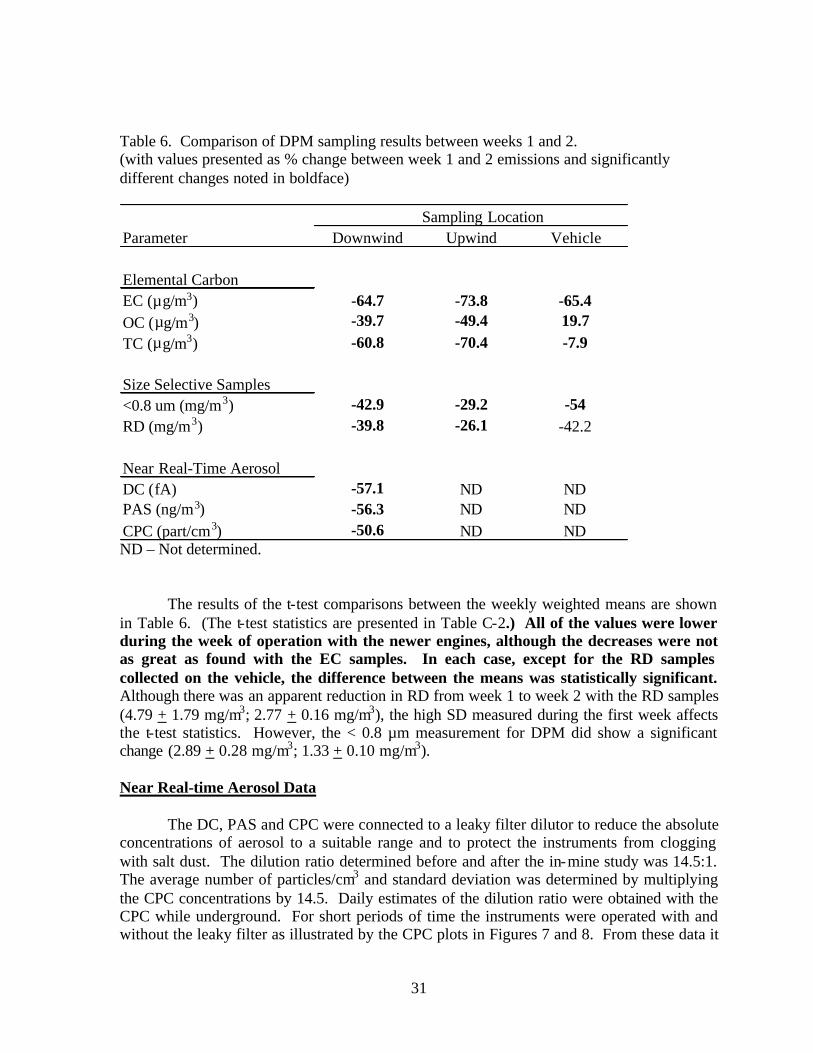
31
Table 6. Comparison of DPM sampling results between weeks 1 and 2. (with values presented as % change between week 1 and 2 emissions and significantly different changes noted in boldface)
Sampling LocationParameter Downwind Upwind Vehicle
Elemental CarbonEC (µg/m3) -64.7 -73.8 -65.4OC (µg/m3) -39.7 -49.4 19.7
TC (µg/m3) -60.8 -70.4 -7.9
Size Selective Samples<0.8 um (mg/m3) -42.9 -29.2 -54RD (mg/m3) -39.8 -26.1 -42.2
Near Real-Time AerosolDC (fA) -57.1 ND NDPAS (ng/m3) -56.3 ND NDCPC (part/cm3) -50.6 ND ND ND – Not determined.
The results of the t-test comparisons between the weekly weighted means are shown in Table 6. (The t-test statistics are presented in Table C-2.) All of the values were lower during the week of operation with the newer engines, although the decreases were not as great as found with the EC samples. In each case, except for the RD samples collected on the vehicle, the difference between the means was statistically significant. Although there was an apparent reduction in RD from week 1 to week 2 with the RD samples (4.79 + 1.79 mg/m3; 2.77 + 0.16 mg/m3), the high SD measured during the first week affects the t-test statistics. However, the < 0.8 µm measurement for DPM did show a significant change (2.89 + 0.28 mg/m3; 1.33 + 0.10 mg/m3). Near Real-time Aerosol Data The DC, PAS and CPC were connected to a leaky filter dilutor to reduce the absolute concentrations of aerosol to a suitable range and to protect the instruments from clogging with salt dust. The dilution ratio determined before and after the in-mine study was 14.5:1. The average number of particles/cm3 and standard deviation was determined by multiplying the CPC concentrations by 14.5. Daily estimates of the dilution ratio were obtained with the CPC while underground. For short periods of time the instruments were operated with and without the leaky filter as illustrated by the CPC plots in Figures 7 and 8. From these data it
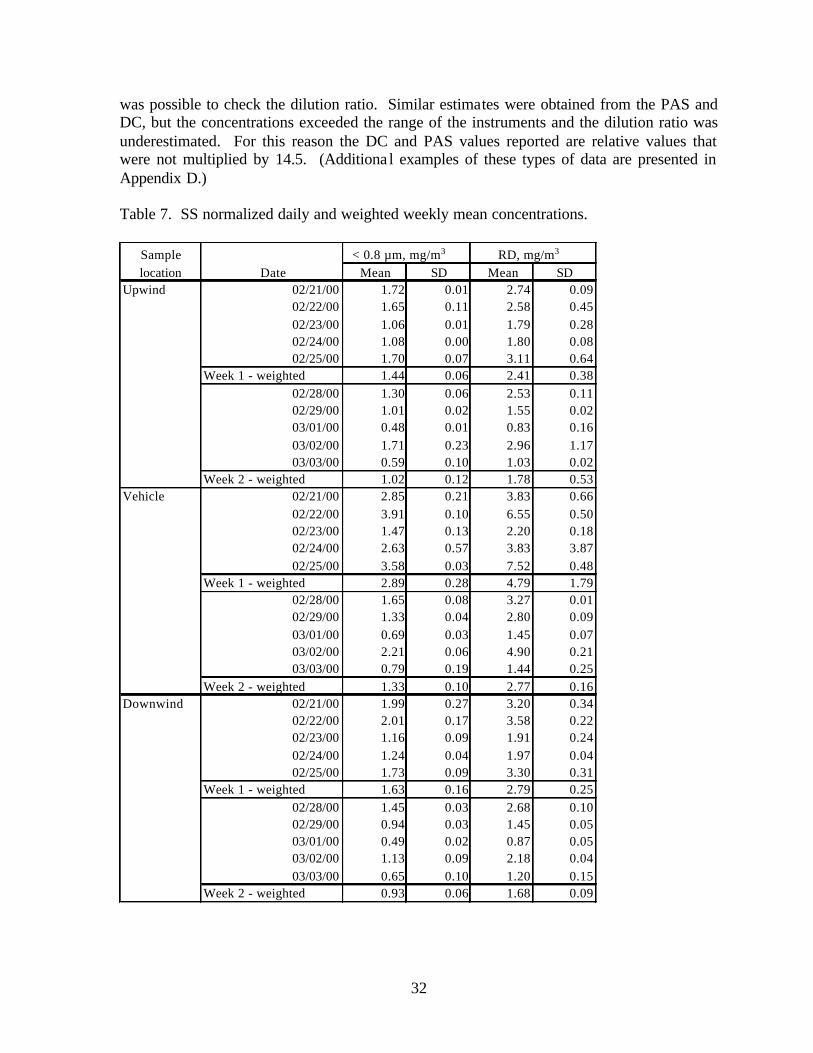
32
was possible to check the dilution ratio. Similar estimates were obtained from the PAS and DC, but the concentrations exceeded the range of the instruments and the dilution ratio was underestimated. For this reason the DC and PAS values reported are relative values that were not multiplied by 14.5. (Additiona l examples of these types of data are presented in Appendix D.) Table 7. SS normalized daily and weighted weekly mean concentrations.
Sample < 0.8 µm, mg/m3 RD, mg/m3
location Date Mean SD Mean SDUpwind 02/21/00 1.72 0.01 2.74 0.09
02/22/00 1.65 0.11 2.58 0.4502/23/00 1.06 0.01 1.79 0.2802/24/00 1.08 0.00 1.80 0.0802/25/00 1.70 0.07 3.11 0.64
Week 1 - weighted 1.44 0.06 2.41 0.3802/28/00 1.30 0.06 2.53 0.1102/29/00 1.01 0.02 1.55 0.0203/01/00 0.48 0.01 0.83 0.1603/02/00 1.71 0.23 2.96 1.1703/03/00 0.59 0.10 1.03 0.02
Week 2 - weighted 1.02 0.12 1.78 0.53Vehicle 02/21/00 2.85 0.21 3.83 0.66
02/22/00 3.91 0.10 6.55 0.5002/23/00 1.47 0.13 2.20 0.1802/24/00 2.63 0.57 3.83 3.8702/25/00 3.58 0.03 7.52 0.48
Week 1 - weighted 2.89 0.28 4.79 1.7902/28/00 1.65 0.08 3.27 0.0102/29/00 1.33 0.04 2.80 0.0903/01/00 0.69 0.03 1.45 0.0703/02/00 2.21 0.06 4.90 0.2103/03/00 0.79 0.19 1.44 0.25
Week 2 - weighted 1.33 0.10 2.77 0.16Downwind 02/21/00 1.99 0.27 3.20 0.34
02/22/00 2.01 0.17 3.58 0.2202/23/00 1.16 0.09 1.91 0.2402/24/00 1.24 0.04 1.97 0.0402/25/00 1.73 0.09 3.30 0.31
Week 1 - weighted 1.63 0.16 2.79 0.2502/28/00 1.45 0.03 2.68 0.1002/29/00 0.94 0.03 1.45 0.0503/01/00 0.49 0.02 0.87 0.0503/02/00 1.13 0.09 2.18 0.0403/03/00 0.65 0.10 1.20 0.15
Week 2 - weighted 0.93 0.06 1.68 0.09
33
Figure 7. Leaky filter dilution ratio estimate for CPC with and without dilutor on 2/28/00.
Figure 8. Leaky filter dilution ratio estimate for CPC with and without dilutor on 3/1/00.
0
50000
100000
150000
200000
250000
300000
350000
400000
12:21:36 12:24:29 12:27:22 12:30:14 12:33:07 12:36:00 12:38:53 12:41:46 12:44:38 12:47:31 12:50:24
Time
CPC,particles/cm
3
Absolute filter
No dilutor mean 304,700+ 11,116 part/cm3
Dilutor mean 22,000+ 1,273 mg/m3
Estimated DR 13.8:1
0
50000
100000
150000
200000
250000
300000
10:40:48 10:48:00 10:55:12 11:02:24 11:09:36 11:16:48 11:24:00
TIme
CPC,particles/cm
3
Absolute filter
No dilutor mean 270,700+ 9,615
Dilutor mean 17,400+ 643
Estimated DR 15.5:1
34
Table 8 summarizes the normalized daily means (and SD) and the weekly weighted means (and SD) for each of the three continuous reading instruments (DC, PAS, and CPC) at the downwind sampling location. The results of the t-test comparison between the weekly weighted means are also shown in Table 6. (The t-test statistics are presented in Table C-3.) In all cases, the mean values decreased from week 1 to week 2 and all of the differences were statistically significant. The magnitude of the decreases was similar to that found for EC and TC at the same locations. There was no evidence of increased production of nano- (or nuclei-mode) particles with use of the late model engines. Table 8. DC, PAS and CPC normalized daily and weighted weekly mean concentrations.
ND No data High-Volume Sampler Analyses DPM and DPM-Component Concentrations Although the primary intent of using the high-volume samplers was to obtain sufficient mass to conduct the PAH, nitro-PAH, and mutagenic activity analyses, some general comparisons can be made between the engines for DPM, SOF, solids, and sulfate levels. Table 9 provides a comparison of the number of samplers used, total number of filters collected, and total sampler-operating time for this study. Tables 10 and 11 summarize the normalized daily and weighted weekly means (and SD) of DPM and DPM components (SOF, sulfate, and solids) at the downwind and upwind sampling locations, respectively. Since the filters were not ammoniated to stabilize the sulfates after sampling, both the sulfate and solids levels are only estimations. However, the DPM would be expected to contain very little sulfate due to the use of such an ultra- low sulfur fuel (Table 3); as can be seen from the data in Tables 10 and 11, the detected sulfate levels would contribute little to the detected mass for these samples. Table 12 shows a comparison of DPM sampling results between weeks 1 and 2, with values presented as % change between week 1 and 2 emissions and significantly different changes noted in boldface. (The t-test statistics are presented in Table C-4.) All of the values decreased between weeks 1 and 2 and all of the changes were found to be statistically significant. As the high-volume samplers were operated only when diesel traffic occurred in the sampling areas, the reported DPM values represent potentially worst case levels in this mine. It is
Location Date DC DC, fA PAS PAS, ng/m3
CPC CPC, part/cm3
N Mean SD N Mean SD N Mean SDDownwind 02/21/00 306 553 58 323 720 92 350 297206 27552
02/22/00 859 556 122 853 765 128 697 294847 5077902/23/00 1398 83 40 1308 147 71 1784 312405 11841502/24/00 1118 239 44 942 370 59 892 248955 8956102/25/00 1136 135 42 1122 278 71 ND ND ND
Week 1 - weighted 219 22 373 34 294131 2293502/28/00 1503 222 53 1445 206 45 1246 343675 10391802/29/00 860 193 31 855 225 44 714 211722 4919203/01/00 1300 75 10 1282 122 36 1077 125651 3742803/02/00 961 206 90 980 265 165 771 213274 6174003/03/00 1482 104 20 1266 124 38 1340 109466 44929
Week 2 - weighted 94 9 163 20 145324 22488
35
noteworthy that similar reductions were found using full-shift samplers for TC (analogous to DPM) and EC (analogous to solids) at these same sites (Table 6). As with the OC (Table 6), there were not as great reductions in the SOF with use of the newer engines. Table 9. High-volume sampler parameters. Location Week Date No. of No. of Total Time Samplers Filters (hr)
Upwind 1 02/22/00 1 2 0.42 02/23/00 1 2 0.90 02/24/00 1 2 0.55 02/25/00 1 2 0.49
2 02/28/00 1 2 0.75 02/29/00 1 2 0.76 03/01/00 1 2 1.33 03/02/00 1 2 0.99 03/02/00 1 2 0.88
Downwind 1 02/21/00 1 2 0.49 02/22/00 2 5 1.18 02/23/00 1 5 0.27 02/24/00 1 3 0.72 02/25/00 1 3 1.32
2 02/28/00 1 3 1.78 02/29/00 1 2 1.30 03/01/00 2 6 3.67 03/02/00 2 4 1.92 03/02/00 2 5 2.02
Data from the one upwind sample collected on 02/21/00 were not used due to sampler problems. There was no time overlap when two samplers were used. Compound Quantifications Table 13 summarizes the weighted weekly means (and SD) for the various PAH detected at the downwind and upwind sampling locations. PAH and hopane concentrations were obtained from combined SOF extracts for each sampling date (normalized daily values presented in Appendix E, Tables E-1 and E-2). The weighted mean hopane concentrations at the downwind site are presented in Figure 9; hopane distributions were essentially the same at the upwind sampling site (data presented in Table E-2).
36
Table 10. Downwind location high-volume sampler-derived DPM and DPM-component normalized daily and weekly mean (and SD) concentrations (mg/m3).
Week Date DPM SOF Sulfates Solids 1 02/21/00 4.59 (0.49) 0.17 (0.02) 0.027 (0.004) 4.39 (0.47) 02/22/00 4.54 (0.96) 0.20 (0.05) 0.019 (0.007) 4.32 (0.93) 02/23/00 2.48 (0.90) 0.24 (0.10) 0.008 (0.005) 2.23 (0.83) 02/24/00 2.55 (0.56) 0.14 (0.56) 0.005 (0.003) 2.40 (0.57) 02/25/00 2.74 (0.41) 0.17 (0.02) 0.006 (0.001) 2.56 (0.39)
Week 1 - Weighted 3.31 (0.25) 0.15 (0.01) 0.007 (0.001) 3.13 (0.24) 2 02/28/00 2.00 (0.20) 0.36 (0.04) 0.012 (0.003) 1.63 (0.16) 02/29/00 1.37 (0.01) 0.16 (0.01) 0.008 (0.001) 1.20 (0.01) 03/01/00 1.09 (0.43) 0.07 (0.02) 0.023 (0.029) 1.01 (0.43) 03/02/00 2.07 (0.62) 0.14 (0.62) 0.028 (0.029) 1.91 (0.59) 03/03/00 1.12 (0.17) 0.10 (0.01) 0.008 (0.001) 1.01 (0.17)
Week 2 - Weighted 1.37 (0.01) 0.13 (0.01) 0.008 (0.001) 1.20 (0.01) DPM Diesel particulate matter, SOF Soluble organic fraction, SD Standard deviation. Table 11. Upwind location high-volume sampler-derived DPM and DPM-component
normalized daily and weekly mean (and SD) concentrations (mg/m3).
Week Date DPM SOF Sulfates Solids 1 02/22/00 6.48 (3.99) 0.23 (0.10) 0.036 (0.024) 6.20 (3.86) 02/23/00 3.36 (1.38) 0.16 (0.04) 0.020 (0.008) 3.19 (1.35) 02/24/00 2.242.0.05 0.14 (0.05) 0.013 (<0.001) 2.08 (0.01) 02/25/00 8.18 (7.95) 0.18 (0.02) 0.034 (0.038) 7.94 (7.89)
Week 1 - Weighted 2.24 (0.05) 0.17 (0.02) 0.013 (<0.001) 2.08 (0.01) 2 02/28/00 2.60 (0.35) 0.38 (0.04) 0.006 (0.008) 2.21 (0.31) 02/29/00 2.23 (0.28) 0.03 (<0.01) 0.013 (<0.001) 2.08 (0.28) 03/01/00 0.89 (0.08) 0.06 (<0.01) 0.004 (<0.001) 0.83 (0.18) 03/02/00 3.61 (2.19) 0.14 (0.01) 0.012 (0.012) 3.45 (2.18) 03/03/00 0.82 (0.04) 0.07 (0.01) 0.003 (<0.001) 0.75 (0.04)
Week 2 - Weighted 0.87 (0.04) 0.13 (<0.01) 0.011 (<0.001) 0.79 (0.03) DPM Diesel particulate matter, SOF Soluble organic fraction, SD Standard deviation. Data from samples collected on 02/21/00 were not used due to sampler problems.
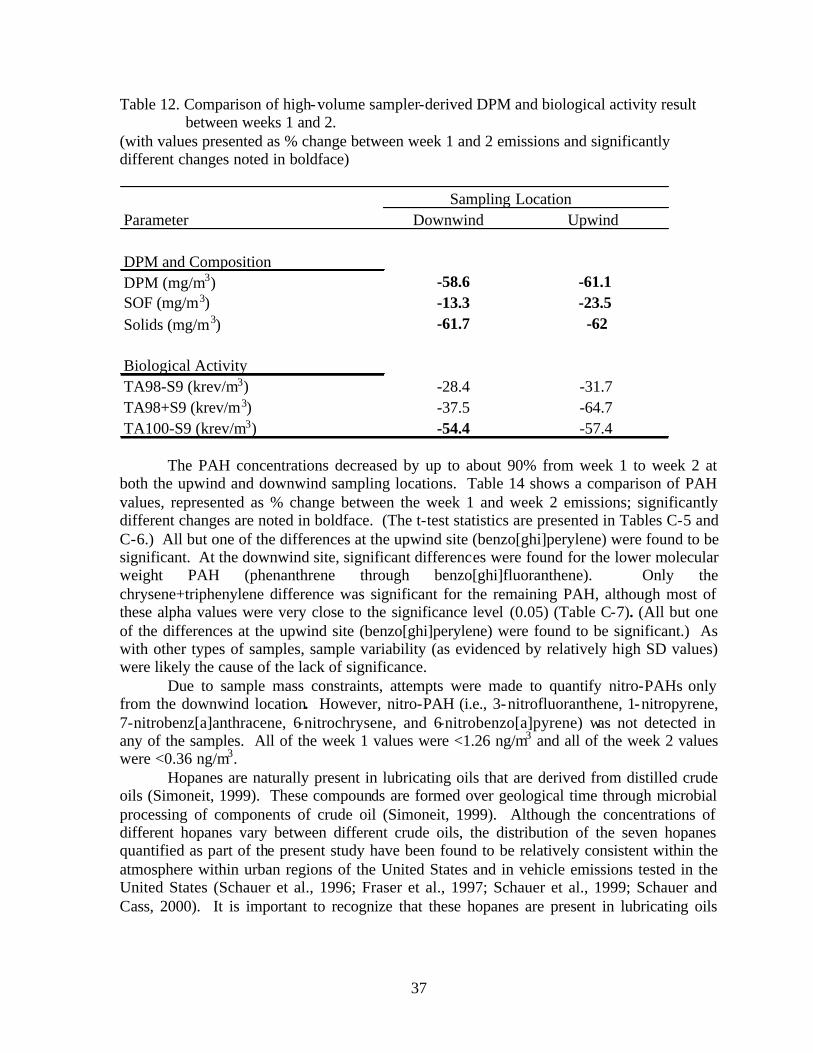
37
Table 12. Comparison of high-volume sampler-derived DPM and biological activity result between weeks 1 and 2.
(with values presented as % change between week 1 and 2 emissions and significantly different changes noted in boldface)
Parameter Downwind Upwind
DPM and CompositionDPM (mg/m3) -58.6 -61.1SOF (mg/m3) -13.3 -23.5Solids (mg/m3) -61.7 -62
Biological ActivityTA98-S9 (krev/m3) -28.4 -31.7TA98+S9 (krev/m3) -37.5 -64.7TA100-S9 (krev/m3) -54.4 -57.4
Sampling Location
The PAH concentrations decreased by up to about 90% from week 1 to week 2 at both the upwind and downwind sampling locations. Table 14 shows a comparison of PAH values, represented as % change between the week 1 and week 2 emissions; significantly different changes are noted in boldface. (The t-test statistics are presented in Tables C-5 and C-6.) All but one of the differences at the upwind site (benzo[ghi]perylene) were found to be significant. At the downwind site, significant differences were found for the lower molecular weight PAH (phenanthrene through benzo[ghi]fluoranthene). Only the chrysene+triphenylene difference was significant for the remaining PAH, although most of these alpha values were very close to the significance level (0.05) (Table C-7). (All but one of the differences at the upwind site (benzo[ghi]perylene) were found to be significant.) As with other types of samples, sample variability (as evidenced by relatively high SD values) were likely the cause of the lack of significance. Due to sample mass constraints, attempts were made to quantify nitro-PAHs only from the downwind location. However, nitro-PAH (i.e., 3-nitrofluoranthene, 1-nitropyrene, 7-nitrobenz[a]anthracene, 6-nitrochrysene, and 6-nitrobenzo[a]pyrene) was not detected in any of the samples. All of the week 1 values were <1.26 ng/m3 and all of the week 2 values were <0.36 ng/m3. Hopanes are naturally present in lubricating oils that are derived from distilled crude oils (Simoneit, 1999). These compounds are formed over geological time through microbial processing of components of crude oil (Simoneit, 1999). Although the concentrations of different hopanes vary between different crude oils, the distribution of the seven hopanes quantified as part of the present study have been found to be relatively consistent within the atmosphere within urban regions of the United States and in vehicle emissions tested in the United States (Schauer et al., 1996; Fraser et al., 1997; Schauer et al., 1999; Schauer and Cass, 2000). It is important to recognize that these hopanes are present in lubricating oils
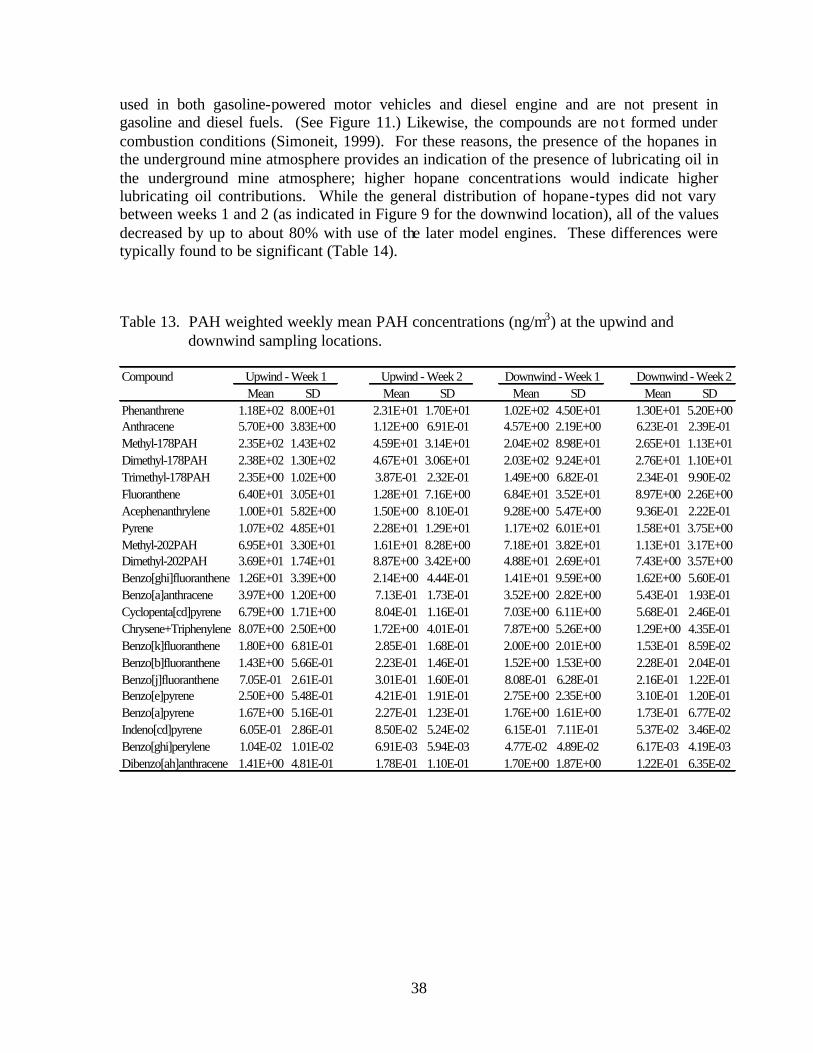
38
used in both gasoline-powered motor vehicles and diesel engine and are not present in gasoline and diesel fuels. (See Figure 11.) Likewise, the compounds are no t formed under combustion conditions (Simoneit, 1999). For these reasons, the presence of the hopanes in the underground mine atmosphere provides an indication of the presence of lubricating oil in the underground mine atmosphere; higher hopane concentrations would indicate higher lubricating oil contributions. While the general distribution of hopane-types did not vary between weeks 1 and 2 (as indicated in Figure 9 for the downwind location), all of the values decreased by up to about 80% with use of the later model engines. These differences were typically found to be significant (Table 14).
Table 13. PAH weighted weekly mean PAH concentrations (ng/m3) at the upwind and downwind sampling locations.
CompoundMean SD Mean SD Mean SD Mean SD
Phenanthrene 1.18E+02 8.00E+01 2.31E+01 1.70E+01 1.02E+02 4.50E+01 1.30E+01 5.20E+00Anthracene 5.70E+00 3.83E+00 1.12E+00 6.91E-01 4.57E+00 2.19E+00 6.23E-01 2.39E-01Methyl-178PAH 2.35E+02 1.43E+02 4.59E+01 3.14E+01 2.04E+02 8.98E+01 2.65E+01 1.13E+01Dimethyl-178PAH 2.38E+02 1.30E+02 4.67E+01 3.06E+01 2.03E+02 9.24E+01 2.76E+01 1.10E+01Trimethyl-178PAH 2.35E+00 1.02E+00 3.87E-01 2.32E-01 1.49E+00 6.82E-01 2.34E-01 9.90E-02Fluoranthene 6.40E+01 3.05E+01 1.28E+01 7.16E+00 6.84E+01 3.52E+01 8.97E+00 2.26E+00Acephenanthrylene 1.00E+01 5.82E+00 1.50E+00 8.10E-01 9.28E+00 5.47E+00 9.36E-01 2.22E-01Pyrene 1.07E+02 4.85E+01 2.28E+01 1.29E+01 1.17E+02 6.01E+01 1.58E+01 3.75E+00Methyl-202PAH 6.95E+01 3.30E+01 1.61E+01 8.28E+00 7.18E+01 3.82E+01 1.13E+01 3.17E+00Dimethyl-202PAH 3.69E+01 1.74E+01 8.87E+00 3.42E+00 4.88E+01 2.69E+01 7.43E+00 3.57E+00Benzo[ghi]fluoranthene 1.26E+01 3.39E+00 2.14E+00 4.44E-01 1.41E+01 9.59E+00 1.62E+00 5.60E-01Benzo[a]anthracene 3.97E+00 1.20E+00 7.13E-01 1.73E-01 3.52E+00 2.82E+00 5.43E-01 1.93E-01Cyclopenta[cd]pyrene 6.79E+00 1.71E+00 8.04E-01 1.16E-01 7.03E+00 6.11E+00 5.68E-01 2.46E-01Chrysene+Triphenylene 8.07E+00 2.50E+00 1.72E+00 4.01E-01 7.87E+00 5.26E+00 1.29E+00 4.35E-01Benzo[k]fluoranthene 1.80E+00 6.81E-01 2.85E-01 1.68E-01 2.00E+00 2.01E+00 1.53E-01 8.59E-02Benzo[b]fluoranthene 1.43E+00 5.66E-01 2.23E-01 1.46E-01 1.52E+00 1.53E+00 2.28E-01 2.04E-01Benzo[j]fluoranthene 7.05E-01 2.61E-01 3.01E-01 1.60E-01 8.08E-01 6.28E-01 2.16E-01 1.22E-01Benzo[e]pyrene 2.50E+00 5.48E-01 4.21E-01 1.91E-01 2.75E+00 2.35E+00 3.10E-01 1.20E-01Benzo[a]pyrene 1.67E+00 5.16E-01 2.27E-01 1.23E-01 1.76E+00 1.61E+00 1.73E-01 6.77E-02Indeno[cd]pyrene 6.05E-01 2.86E-01 8.50E-02 5.24E-02 6.15E-01 7.11E-01 5.37E-02 3.46E-02Benzo[ghi]perylene 1.04E-02 1.01E-02 6.91E-03 5.94E-03 4.77E-02 4.89E-02 6.17E-03 4.19E-03Dibenzo[ah]anthracene 1.41E+00 4.81E-01 1.78E-01 1.10E-01 1.70E+00 1.87E+00 1.22E-01 6.35E-02
Upwind - Week 1 Upwind - Week 2 Downwind - Week 1 Downwind - Week 2
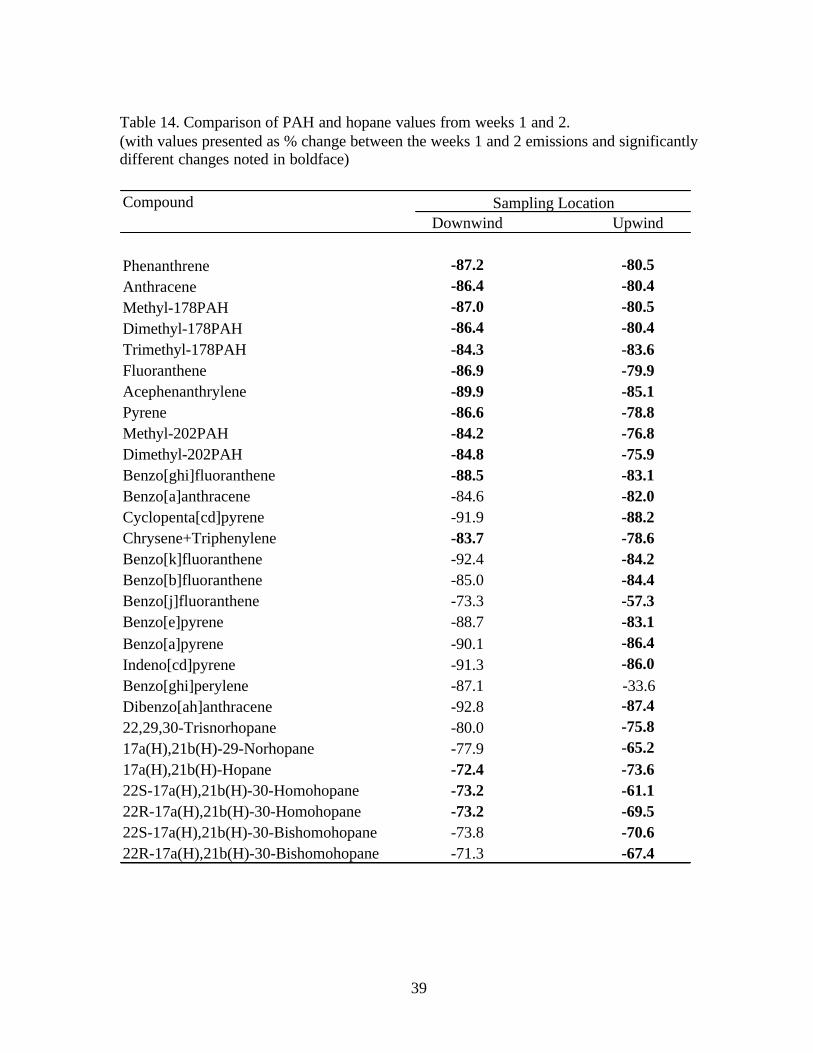
39
Table 14. Comparison of PAH and hopane values from weeks 1 and 2. (with values presented as % change between the weeks 1 and 2 emissions and significantly different changes noted in boldface)
CompoundDownwind Upwind
Phenanthrene -87.2 -80.5Anthracene -86.4 -80.4Methyl-178PAH -87.0 -80.5Dimethyl-178PAH -86.4 -80.4Trimethyl-178PAH -84.3 -83.6Fluoranthene -86.9 -79.9Acephenanthrylene -89.9 -85.1Pyrene -86.6 -78.8Methyl-202PAH -84.2 -76.8Dimethyl-202PAH -84.8 -75.9Benzo[ghi]fluoranthene -88.5 -83.1Benzo[a]anthracene -84.6 -82.0Cyclopenta[cd]pyrene -91.9 -88.2Chrysene+Triphenylene -83.7 -78.6Benzo[k]fluoranthene -92.4 -84.2Benzo[b]fluoranthene -85.0 -84.4Benzo[j]fluoranthene -73.3 -57.3Benzo[e]pyrene -88.7 -83.1Benzo[a]pyrene -90.1 -86.4Indeno[cd]pyrene -91.3 -86.0Benzo[ghi]perylene -87.1 -33.6Dibenzo[ah]anthracene -92.8 -87.422,29,30-Trisnorhopane -80.0 -75.817a(H),21b(H)-29-Norhopane -77.9 -65.217a(H),21b(H)-Hopane -72.4 -73.622S-17a(H),21b(H)-30-Homohopane -73.2 -61.122R-17a(H),21b(H)-30-Homohopane -73.2 -69.522S-17a(H),21b(H)-30-Bishomohopane -73.8 -70.622R-17a(H),21b(H)-30-Bishomohopane -71.3 -67.4
Sampling Location
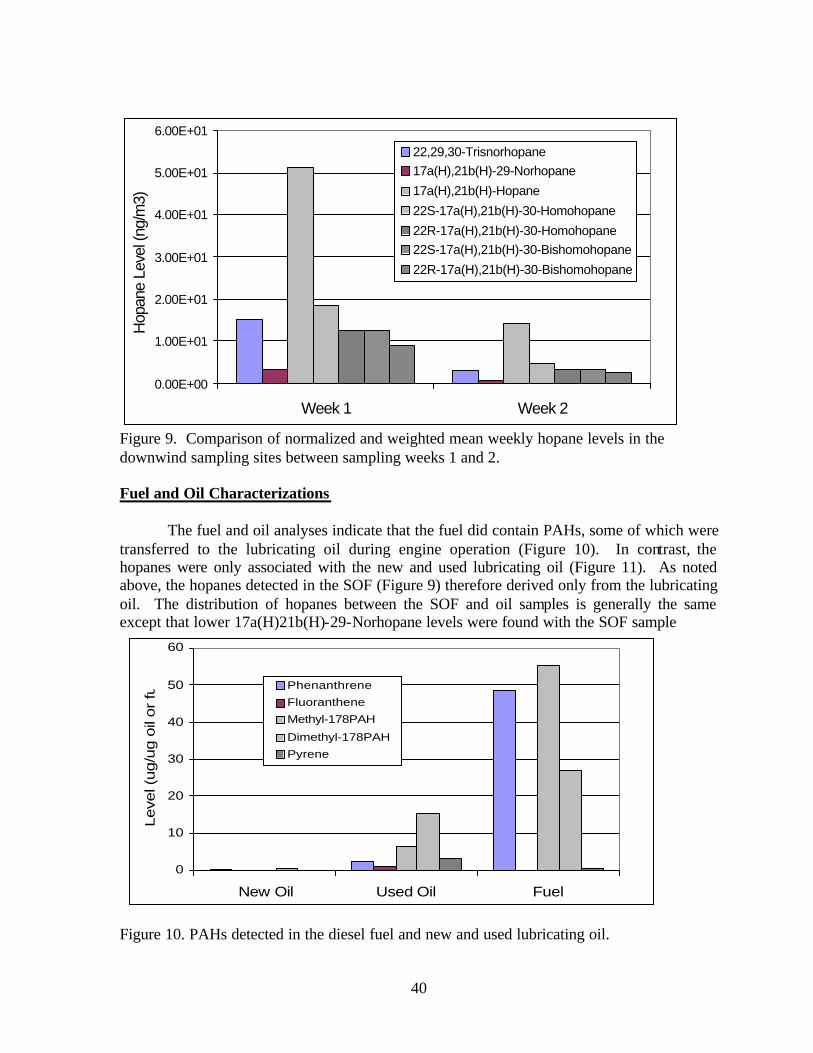
40
Figure 9. Comparison of normalized and weighted mean weekly hopane levels in the downwind sampling sites between sampling weeks 1 and 2. Fuel and Oil Characterizations The fuel and oil analyses indicate that the fuel did contain PAHs, some of which were transferred to the lubricating oil during engine operation (Figure 10). In contrast, the hopanes were only associated with the new and used lubricating oil (Figure 11). As noted above, the hopanes detected in the SOF (Figure 9) therefore derived only from the lubricating oil. The distribution of hopanes between the SOF and oil samples is generally the same except that lower 17a(H)21b(H)-29-Norhopane levels were found with the SOF sample Figure 10. PAHs detected in the diesel fuel and new and used lubricating oil.
0
10
20
30
40
50
60
New Oil Used Oil Fuel
Leve
l (ug
/ug
oil o
r fue
l)
PhenanthreneFluorantheneMethyl-178PAHDimethyl-178PAHPyrene
0.00E+00
1.00E+01
2.00E+01
3.00E+01
4.00E+01
5.00E+01
6.00E+01
Week 1 Week 2
Hop
ane
Leve
l (ng
/m3)
22,29,30-Trisnorhopane17a(H),21b(H)-29-Norhopane17a(H),21b(H)-Hopane22S-17a(H),21b(H)-30-Homohopane22R-17a(H),21b(H)-30-Homohopane22S-17a(H),21b(H)-30-Bishomohopane22R-17a(H),21b(H)-30-Bishomohopane
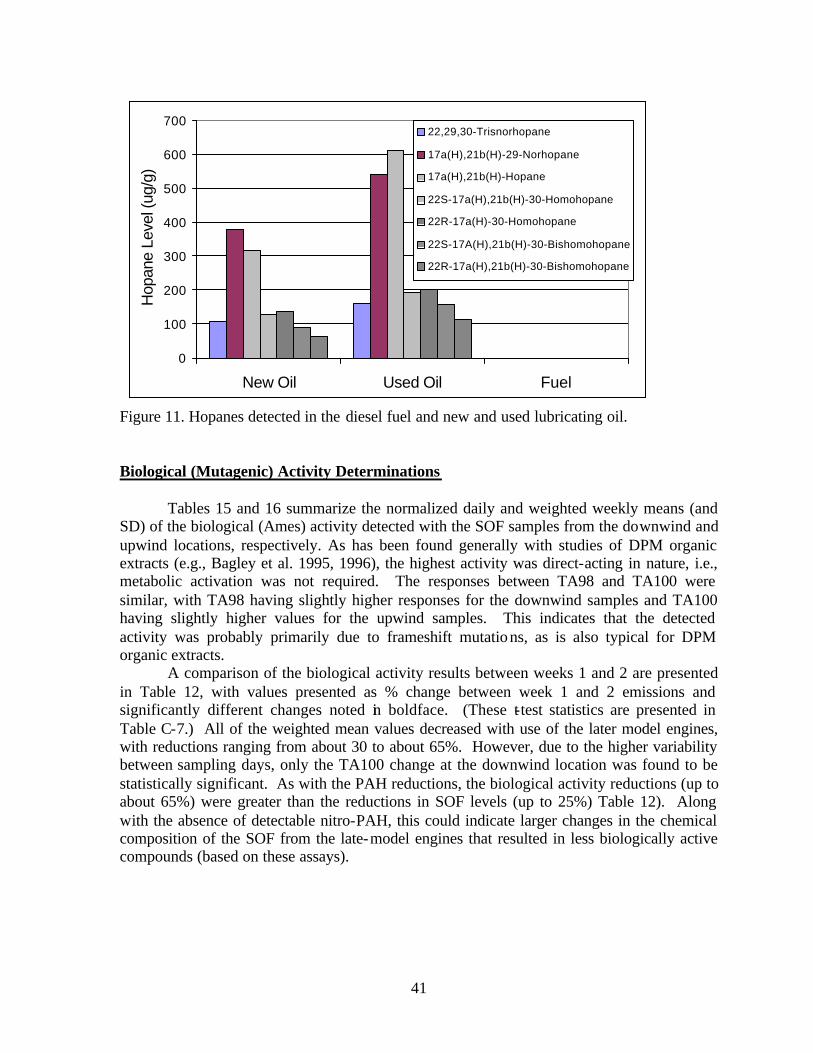
41
Figure 11. Hopanes detected in the diesel fuel and new and used lubricating oil. Biological (Mutagenic) Activity Determinations Tables 15 and 16 summarize the normalized daily and weighted weekly means (and SD) of the biological (Ames) activity detected with the SOF samples from the downwind and upwind locations, respectively. As has been found generally with studies of DPM organic extracts (e.g., Bagley et al. 1995, 1996), the highest activity was direct-acting in nature, i.e., metabolic activation was not required. The responses between TA98 and TA100 were similar, with TA98 having slightly higher responses for the downwind samples and TA100 having slightly higher values for the upwind samples. This indicates that the detected activity was probably primarily due to frameshift mutations, as is also typical for DPM organic extracts. A comparison of the biological activity results between weeks 1 and 2 are presented in Table 12, with values presented as % change between week 1 and 2 emissions and significantly different changes noted in boldface. (These t-test statistics are presented in Table C-7.) All of the weighted mean values decreased with use of the later model engines, with reductions ranging from about 30 to about 65%. However, due to the higher variability between sampling days, only the TA100 change at the downwind location was found to be statistically significant. As with the PAH reductions, the biological activity reductions (up to about 65%) were greater than the reductions in SOF levels (up to 25%) Table 12). Along with the absence of detectable nitro-PAH, this could indicate larger changes in the chemical composition of the SOF from the late-model engines that resulted in less biologically active compounds (based on these assays).
0
100
200
300
400
500
600
700
New Oil Used Oil Fuel
Hop
ane
Leve
l (ug
/g)
22,29,30-Trisnorhopane
17a(H),21b(H)-29-Norhopane
17a(H),21b(H)-Hopane
22S-17a(H),21b(H)-30-Homohopane
22R-17a(H)-30-Homohopane
22S-17A(H),21b(H)-30-Bishomohopane
22R-17a(H),21b(H)-30-Bishomohopane
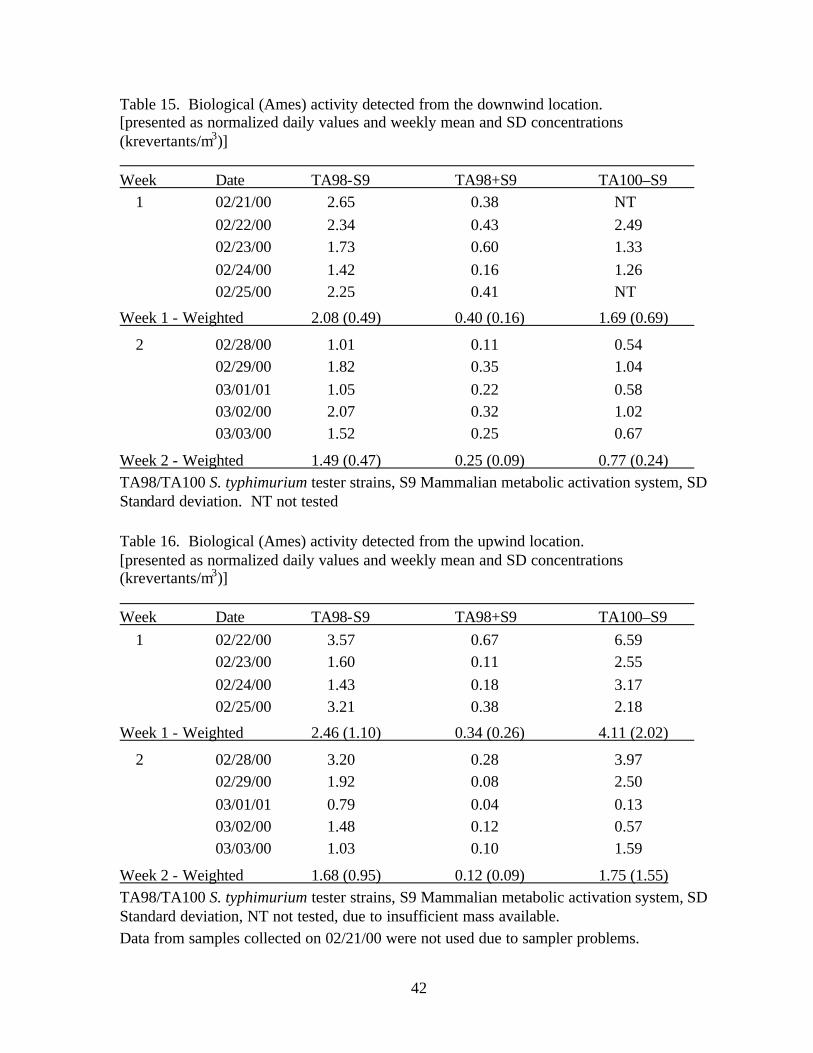
42
Table 15. Biological (Ames) activity detected from the downwind location. [presented as normalized daily values and weekly mean and SD concentrations (krevertants/m3)]
Week Date TA98-S9 TA98+S9 TA100–S9 1 02/21/00 2.65 0.38 NT 02/22/00 2.34 0.43 2.49 02/23/00 1.73 0.60 1.33 02/24/00 1.42 0.16 1.26 02/25/00 2.25 0.41 NT
Week 1 - Weighted 2.08 (0.49) 0.40 (0.16) 1.69 (0.69)
2 02/28/00 1.01 0.11 0.54 02/29/00 1.82 0.35 1.04 03/01/01 1.05 0.22 0.58 03/02/00 2.07 0.32 1.02 03/03/00 1.52 0.25 0.67
Week 2 - Weighted 1.49 (0.47) 0.25 (0.09) 0.77 (0.24) TA98/TA100 S. typhimurium tester strains, S9 Mammalian metabolic activation system, SD Standard deviation. NT not tested Table 16. Biological (Ames) activity detected from the upwind location. [presented as normalized daily values and weekly mean and SD concentrations (krevertants/m3)] Week Date TA98-S9 TA98+S9 TA100–S9 1 02/22/00 3.57 0.67 6.59 02/23/00 1.60 0.11 2.55 02/24/00 1.43 0.18 3.17 02/25/00 3.21 0.38 2.18
Week 1 - Weighted 2.46 (1.10) 0.34 (0.26) 4.11 (2.02)
2 02/28/00 3.20 0.28 3.97 02/29/00 1.92 0.08 2.50 03/01/01 0.79 0.04 0.13 03/02/00 1.48 0.12 0.57 03/03/00 1.03 0.10 1.59
Week 2 - Weighted 1.68 (0.95) 0.12 (0.09) 1.75 (1.55) TA98/TA100 S. typhimurium tester strains, S9 Mammalian metabolic activation system, SD Standard deviation, NT not tested, due to insufficient mass available. Data from samples collected on 02/21/00 were not used due to sampler problems.
43
CONCLUSIONS
The overall conclusion from this study is that use of electronically controlled, modern
diesel engines with a low sulfur fuel in this underground mine resulted in large reductions in DPM and all DPM-related components. The measured potentially health related components showed similar reductions. However, the use of these engines cannot be relied upon to reduce concentrations below 0.15 mg/m3 in all circumstances. Specific conclusions related to specific measured parameters are as follows. 1 The EC and SS sampling methods were both found to work well in an underground mine environment. This study also demonstrated that instruments such as the DC, PAS and CPC could be used to track diesel activity on a real time basis in underground mines. However, problems were encountered when using the nano-MOUDI that rendered it essentially inoperable in this type of a mine. 2. The TC and EC levels at the downwind location were reduced by at least 60% with use of the electronically controlled diesel engines; the resulting TC level was fairly close to the MSHA interim standard of 0.4 mg/m3. OC levels were also reduced but to a lesser extent, consistent with the engine's technology changes affecting the EC component of the DPM. 3. As determined from the SS samples, the reductions in DPM at the downwind location were not as great as for the TC (about 40% decreases in <0.8 µm particles and RD). As determined in this mine, the DPM levels with the late model engines (and no control devices) would not reach the target value of 0.15 mg/m3. 4. All of the near real-time aerosol measurements at the downwind location (DC, PAS, and CPC) showed about 50 to 60% decreases in levels with use of the late model engines. The magnitude of the decreases was similar to that found for EC and TC at the same locations, indicating that these parameters have close correlations. There was also no evidence of increased production of nano- (or nuclei-mode) particles with use of the late model engines. 5. The DPM values obtained from the high-volume samplers represent potentially worst case levels in this mine. These reductions with the late model engines do correlate with results obtained from full-shift samplers, in particular the TC (analogous to DPM) and EC (analogous to solids). 6. The PAH and biological (mutagenic) activity levels (associated with the organics extracted from DPM collected with the high-volume samplers) also showed large decreases with use of the electronically controlled diesel engines (by up to about 90% and 65%, respectively).
44
ACKNOWLEDGEMENTS The authors gratefully acknowledge the support of the Cote Blanche Mine, particularly Mr. John Fallis, Mine-Manager - Vice President, of Mining and Mr. Gord Bull, Mining Superintendent. At MTU, several individuals helped with the analysis and interpretation of the data. Barb Heard, Department of Mechanical Engineering and Engineering Mechanics, carried out portions of the chemical analysis laboratory work. Graduate students Srisuda Dhamwichukorn and Ajay Sundaram and undergraduate students Adam Campbell and Acharya Chaitanya, Department of Biological Sciences, assisted in conducting mutagenicity and statistical analyses for the project.
45
REFERENCES Abdul-Khalek IS, Kittelson DB: Real Time Measurement of Volatile and Solid Exhaust Particles Using a Catalytic Stripper. SAE Technical Paper Series No. 950236, 1995. Abdul-Khalek I, Kittelson DB, Brear F: The Influence of Dilution Conditions on Diesel Exhaust Particle Size Distribution Measurements. SAE Technical Paper Series No. 1999-01-1142, 1999. Abdul-Khalek IS, Kittelson DB, Graskow BR, Wei Q: Diesel Exhaust Particle Size: Measurement Issues and Trends. SAE Technical Paper Series No. 980525, 1998. ACGIH. 1984. Particle Size-Selective Sampling in the Workplace. In Annals of the ACGIH, Vol 11, pp. 23-100. Cincinnati, OH: American Conference of Industrial Hygienists. ACGIH: 1995-1996 Threshold Limit Values for Chemical Substances and Physical Agents and Biological Exposure Indices. Am. Conf. Gov. Ind. Hyg., Cincinnati, OH, pp. 1-138, 1995. ACGIH: TLVs and BEIs Threshold Limit Values fo r Chemical Substances and Physical Agents & Biological Exposure Indices. AM. Conf. Gov. Ind. Hyg., Cincinnati, OH, p. 62, 2001. Adachi, M., Kousaka, Y and Okuyama K: Unipolar and Bipolar Diffusion Charging of Ultrafine Aerosol Particles. J. Aerosol Sci. v. 16, pp 109-123, 1985. Ambs JL, Cantrell BK, Watts WF, Olson KS: Evaluation of Disposable Diesel Exhaust Filters for Use on Permissible Equipment. Bureau of Mines RI 9508, 8 pp, 1994. Bagley ST, Baumgard KJ, Gratz LD, Bickel KL, Watts WF: Effects of a Catalyzed Diesel Particle Filter on the Chemical and Biological Character of Emissions from a Diesel Engine Used in Underground Mines. SAE Technical Paper Series No. 911840, 1991. Bagley ST, Baumgard KJ, Gratz LD: Polynuclear Aromatic Hydrocarbons and Biological Activity Associated with Diesel Particulate Matter Collected in Underground Coal Mines. In: Bureau of Mines IC 9324, pp. 40-48, 1992. Bagley ST, Baumgard KJ, Gratz LD, Johnson JH, Leddy DG: Characterization of Fuel and Aftertreatment Device Effects on Diesel Emissions. HEI Research Report Number 76., Cambridge, MA, 1996. Bagley ST, Gratz LD: Evaluation of Biodiesel Fuel and a Diesel Oxidation Catalyst in an Underground Metal Mine: Part 3 - Biological and Chemical Characterization. Final Project Report, Diesel Emission Evaluation Program, Toronto, Canada, July 24, 1998. (Available on-line at: http://www.deep.org/research.html)
46
Bagley ST, Gratz LD, Johnson JH: Relative Health Risks of Diesel Emission Control Systems. Final Project Report, Grant No. R01 OH02611. National Institute for Occupational Safety and Health, Cincinnati, OH, 1995. Bagley ST, Gratz LD, Leddy DG, Johnson JH: Characterization of particle and vapor phase organic fraction emissions from a heavy-duty diesel engine equipped with a particle trap having regeneration controls. HEI Research Report No 56., Cambridge, MA, 1993. Baumgard KJ, Kittelson DB: The Influence of a Ceramic Particle Trap on the Size Distribution of Diesel Particles. SAE Technical Paper Series No. 850009, 1985. Baz-Dresch JL, Bickel KL, Watts WF: Evaluation of Catalyzed Diesel Particulate Filters Used in an Underground Metal Mine. Bureau of Mines RI 9478, 13 pp., 1993. Bevington P, Robinson D: Data Reduction and Error Analysis for the Physical Sciences. WCB McGraw Hill, 2nd edition, pp 739-744, 1992. Birch M., Carey RA: Elemental Carbon-based Method for Occupational Monitoring of Particulate Diesel Exhaust: Methodology and Exposure Issues. Analyst 121:1183-1190, 1996. Burtscher H and Siegmann HC: Photoemission for In Situ Analysis of Particulate Combustion Emissions. Water, Air, and Soil Pol. Vol. 68: 125-136, 1993. Burtscher HD, Matter U and Steiner D: Characterization of Soot Particles by In-Situ Measurement with Different Aerosol Analysis Tools. J. of Aerosol Sci. Vol. 23, pp. 65-67, 1993. Canadian Mining Regulations, 1997-1998: Health, Safety and Reclamation Code for Mines in British Columbia, 1997, section 6.22.2(3); Regulation respecting occupational health and safety in mines, 1998, section 102.(1)(a) and 102.(1.1); Schedule VI Sampling and Analysis Protocol for Respirable Combustible Dust (RCD). Regulations for Mines and Mining Plants, Ontario Regulation 854/90, 1997, section 183.1(5). Cadle SH, Groblicki PJ: An Evaluation of Methods for Determination of Organic and Elemental Carbon in Particulate Samples. In: Particulate Carbon: Atmospheric Life. Eds. GT Wolff, RL Klimisch), Plenum Press, pp 89-109, 1982. Cantrell BK, Zeller HW, Williams KL, Cocalis J: Monitoring and Measurement of In-Mine Aerosol: Diesel Emissions. Bureau of Mines IC 9141, pp 41-51, 1987. Cantrell BK, Rubow KL: Mineral Dust and Diesel Aerosol Measurements in Underground Metal and Nonmetal Mines. In: Proceedings of the 7th International Conference on the Pneumoconiosis, Pittsburgh, PA, August 23-26, 1988. NIOSH Publication No. 90-108, pp. 651-655. U.S. Department of Health and Human Services, Atlanta, GA., 1990a.
47
Cantrell BK and Rubow KL: Development of a Personal Diesel Aerosol Sampler Design and Performance Criteria. Presented at 1990 Society of Mining Engineers Annual Meeting, Feb. 26-Mar 2, 1990, Salt Lake City, UT, Preprint No. 90-74, 1990b. (Also published in Mining Engineering, Feb., 1991) Cantrell, B. K., K. S. Olson, and O. L. Lantto. Effect of Waterbath Exhaust Conditioners on Diesel Exhaust Aerosol Emissions. In Proceedings of the Third Symposium on Respirable Dust in the Mineral Industries, October 17-19, 1990, pp. 99-104. Cantrell BK, Williams KL, Watts WF, Jankowski RA: Mine Aerosol Measurement. In: Aerosol Measurement: Principles, Techniques, and Applications (eds K Willeke, PA Baron), Van Nostrand, pp 591-611, 1993. Carlson DH, Johnson JH, Bagley ST, Gratz LD: Underground Coal Mine Air Quality in Mines Using Disposable Diesel Exhaust Filter Control Devices. Applied Occupational and Environmental Hygiene 11: 703-716, 1996. Dahmann, D., et al: Diesel Engine Emissions in Work Place Atmospheres in Germany. Occ. Hyg., 3(4): 255-262, 1996. Devore J, Peck R: Statistics, The Exploration and Analysis of Data. 2nd edition. Wadsworth Publishing Company, pp 505-507, 1993. Diesel Emission Evaluation Program, 2000 http://www.deep.org/research.html Dockery DW, Pope CA III, Xu X, Spengler JD, Ware JH, Fay ME, Ferris BG, Speizer FE: An Association Between Air Pollution and Mortality in Six U.S. Cities. New England Journal of Medicine 329: 1753-1759, 1993. Dolan DF, Kittelson DB, H. Pui DY: Diesel Exhaust Particle Size Distribution Measurement Techniques. SAE Technical Paper Series No. 800187, 1980. Dvorznak G: Personnel Communication to W Watts, 1996. EPA. Emission Standards Reference Guide for Heavy-Duty and Nonroad Engines. EPA420-F-97-014, September, 1997. Fraser MP, Cass GR, Simoneit BRT, Rasmussen RA: Air Quality Model Evaluation Data for Organics .4. C-2-C-36 Non-aromatic Hydrocarbons Env. Sci. & Tech. 31: 2356-2367, 1997 Friedlander SK: Smoke, Dust and Haze: Fundamentals of Aerosol Behavior, John Wiley and Sons, 1977. Harrison RM: Airborne Particulate Matter in the United Kingdom. Third Report of the Quality of Urban Air Review Group, R.M. Harrison, chair, The University of Birmingham, Edgbaston, England, 1996.
48
Hart KM, McDow StR, Giger W, Steiner D and Burtscher H: The Correlation Between In-Situ, Real-Time Aerosol Photoemission Intensity and Particulate Polycyclic Aromatic Hydrocarbon Concentration in Combustion Aerosols. Water, Air, and Soil Pol., Vol. 68, pp. 75-90, 1993. HEI: A Critical Analysis of Emissions, Exposure, and Health Effects. A Special Report of the Institute’s Diesel Working Group. Health Effects Institute, Cambridge, MA 294 p, April, 1995. Hering SV, Appel BR, Cheng W, Salaymeh F, Cadle SH, Mulawa PA, Cahill TA, Eldred RA, Surovik M, Fitz D, Howes JE, Knapp KT, Stockburger L, Turpin BJ, Huntzicker JJ, Zhang, X-Q, McMurry PH: Comparison of Sampling Methods for Carbonaceous Aerosols in Ambient Air. Aerosol Sci. and Tech. 12:200-213, 1990. IARC: Diesel and Gasoline Engine Exhausts and Some Nitroarenes. IARC Monographs on the Evaluation of Carcinogenic Risks to Humans, Vol 46, Lyon, France, 1989. Johnson JH, Carlson DH, Bagley ST, Gratz LD: Underground Metal Mine Air Quality Measurements to Determine the Control Efficiencies of Combined Catalyzed Diesel Particulate Filter and Oxidation Catalytic Converter Systems. Applied Occupational and Environmental Hygiene 11: 728-741, 1996. Johnson RL, Shaw JJ, Carey RA, Huntzicker JJ: An Automated Thermal-Optical Method for the Analysis of Carbonaceous Aerosols, Atmospheric Aerosol: Source/Air Quality Relationships. Proc of 1981 American. Chemical Society Symposium Series No 167, Washington, DC, pp. 223-233, 1981. Kado NY, Guirguis GN, Flessel CP, Chan RC, Chang K-I, Wesolowski JJ: Mutagenicity of Fine (<2.5 µm) Airborne Particles: Diurnal Variation in Community Air Determined by a Salmonella Micro Preincubation (Microsuspension) Procedure. Environmental Mutagenesis 8: 53-66, 1986. Jing L, Bach C, Forss A: Einfluss des Einspritzdruckes auf die Partikelemission des DI-Dieselfahrzeuges. Zeitschrift fur das Messwesen 3: 7-10, 1996.
Kittelson DB: Engines and Nanoparticles: A Review. J. Aerosol Science 29:575-588, 1998. Kruger M, et al: Influence of Exhaust Gas Aftertreatment on Particulate Characteristics of Vehicle Diesel Engines, Motortechnische Zeitschrift, Vol. 58, 1997. Lippmann M, Ito K, Nádas A, Burnett R: Association of Particulate Matter Components with Daily Mortality and Morbidity in Urban Populations. HEI Report # 95, 2000. Maron DN, Ames BN. Revised methods for the Salmonella mutagenicity test. Mutation Research 113:173-215, 1983.
49
Marple VA, Rubow KL, Behm SM: A Micro-Orifice Uniform Deposit Impactor (MOUDI): Description, Calibration, and Use. Aerosol Sci. and Tech. 14:434, 1991. Marple VA, Rubow KL, Olson BA: Low Pressure Stages for the Microorifice Uniform Deposit Impactor (MOUDI). Fourth International Aerosol Conference Abstracts, ed. R. C. Flagan, Vol. 2, 6 pp, 1994. Mayer A, et al: Particle Size Distribution Downstream Traps of Different Design, SAE Technical Paper Series No. 950373, 1995. Mayer A, et al. Particulate Traps for Retro-fitting Construction Site Engines VERT: Final Measurements and Implementation. SAE 1999-01-0116, 1999. McCartney TC, Cantrell B K: A Cost-effective Personal Diesel Exhaust Aerosol Sampler. In Bureau of Mines IC 9324, pp 24-30, 1992. McCawley MA, Kent MS, Berakis MT: Ultrafine Beryllium Number Concentration as a Possible metric for Chronic Beryllium Disease Risk. Applied Occupational and Environmental Hygiene 16:631-638, 2001. McClure BT: Laboratory Evaluation of the Effectiveness of Oxidation Catalytic Converters. In BuMines IC 9324, pp 60-66, 1992. MSHA, Department of Labor: 30 CFR Part 72, Diesel Particulate Exposure of Underground Coal Miners; Final Rule. Fed. Reg. January 19, pages 5526-5706, 2001a. MSHA, Department of Labor: 30 CFR Part 57, Diesel Particulate Exposure of Underground Metal and Nonmetal Miners; Final Rule. Fed. Reg. January 19, pages 5706 – 5910, 2001b NIOSH: Elemental Carbon (Diesel Exhaust) 5040. NIOSH Manual of Analytical Methods (NMAM), Fourth Edition, March 15, 1996. NIOSH: Carcinogenic Effects of the Exposure to Diesel Exhaust. Current Intelligence Bulletin 50. Department of Human Health and Services. NIOSH Publication NO 88-116, 1988. Oberdörster G, Finkelstein J, Johnston C, Gelein R, Cox C, Baggs R: Acute Pulmonary Effects of Ultrafine Particles in Rats and Mice. HEI Final Report # 96, 2000. Ping JI, Mark D, Harrison RM: Characterization of Particles from a Current Technology Heavy-Duty Engine. Env. Sci. and Tech. 34:748-755, 2000. Pope CA III, Thun MH Namboodiri MM, Dockery DW, Evans JS, Speizer FE, Heath CW: Particulate Air Pollution as a Predictor of Mortality in a Prospective Study of U. S. Adults. American J. Respir. Crit. Care Med. 151:669-674, 1995.
50
Pui, DYH. and Swift DL: Direct-Reading Instruments for Airborne Particles. Air Sampling Instruments for Evaluation of Atmospheric Contaminants (Chapter 16), Am. Conf. Gov. Ind. Hyg., Cincinnati, OH, 337 - 368 pp, 1995. Raabe OG: Deposition and Clearance of Inhaled Aerosols. In: Mechanisms in Respiratory Toxicology, [Witschi H, Nettesheim P, eds], Vol 1, pp 27-76, CRC Press, Boca Raton, FL, 1982. Rubow KL, Marple VA, Tao Y, Liu D: Design and Evaluation of a Personal Diesel Aerosol Sampler for Underground Coal Mines. SME Preprint No. 90-132, 5 pp, 1990. Samet J, Dominici F, Zeger S, Schwartz J, Dockery D: The National Morbidity, Mortality, :and Air Pollution Study Part I: Methods and Methodologic Issues HEI Report No 94, Part I, 2000. Samet J, Zeger S, Dominici F, Curriero F, Coursac I, Dockery D, Schwartz J, Zanobetti A: The National Morbidity, Mortality, and Air Pollution Study Part II: Morbidity, Mortality, and Air Pollution in the United States. HEI Report No 94, Part II, 2000. Schauer JJ, Rogge WF, Hildemann LM, Mazurek MA, Cass GR: Source Apportionment of Airborne Particulate Matter Using Organic Compounds as Tracers. Atmospheric Environment 30: 3837-3855, 1996. Schauer JJ, Cass GR: Source Apportionment of Wintertime Gas-phase and Particle-phase Air Pollutants Using Organic Compounds as Tracers. Env. Sci. & Tech. 34: 1821-1832, 2000. Schauer JJ, Kleeman MJ, Cass GR, Simoneit BRT: Measurement Of Emissions From Air Pollution Sources. 2. C-1 Through C-30 Organic Compounds From Medium Duty Diesel Trucks. Environmental Science & Technology 33: 1578-1587, 1999. Sheesley RJ, Schauer JJ, Smith ND, Hays MD: Development of a Standardized Method for the Analysis of Organic Compounds Present In: PM2.5, in Proceedings of the AWMA Annual Meeting 2000, Salt Lake City, Utah, 2000. Siegmann K, Scherrer L and Siegmann, HC: Physical and Chemical Properties of Airborne Nanoscale Particles and how to Measure the Impact on Human Health. J. Molecular Structure, 458 (1-2 Special Issue SI):191-201, 1999. Simoneit BRT: A Review of Biomarker Compounds as Source Indicators and Tracers for Air Pollution. Environmental Science and Pollution Research 6: 159-169, 1999. SUVA: Grenzwerte am Arbeitsplatz, 1997. Task Group on Lung Dynamics [D. V. Ba tes, B. R. Fish, T. F. Hatch, T. T. Mercer, P. E. Morrow (chairman): Deposition and Retention Models for Internal Dosimetry of the Human
51
Respiratory Tract. Report for the International Commission on Radiological Protection [ICRP]: Health Physics 12:173-207, 1996. TRGS 900, “Grenzwerte in der Luft am Arbetsplatz “Luftgrenzwerte””; TRGS 901, “Begruendungen und Erlaeuterungen zu Grenzwerten in der Luft am Arbeitsplatz”, Bundesarbeitsblatt May, 1998. Vergunst J: Personnel Communication to W Watts, 1997 Watts WF, Cantrell BK, Bickel KL, Olson KS, Rubow KL, Baz-Dresch JJ, Carlson DH: In-Mine Evaluation of Catalyzed Diesel Particulate Filters at Two Underground Metal Mines. U.S. Bureau of Mines Report of Investigations, No. 9571, 14 pp, 1995. Watts WF: Practical Ways To Control Diesel Emissions In Mining - A Toolbox. Prepared for the U. S. Mine Safety and Health Administration, 47 pp., March, 1997. Waytulonis RW: Personnel Communication to W Watts, 1997. Waytulonis RW: Diesel Exhaust Control, Chapter 11.5. In: SME Mining Engineering Handbook, 2nd Ed. v. 1. (ed HL Hartman), pp 1040-1051, 1992a. Waytulonis RW: Modern Diesel Emission Control. In Bureau of Mines IC 9324, pp 49-59, 1992b. Weiss, M: An On-Line Mass Spectrometer for Aerosols: Development, Characterization and Applications. Ph. D. Dissertation, Delft University of Technology, Netherlands, 1997. Whitby KT and Cantrell BK: Atmospheric Aerosols: Characteristics and Measurement. In: International Conference on Environmental Sensing and Assessment (ICESA), Institute of Electrical and Electronic Engineers (IEEE), IEEE 75-CH 1004-1, paper 29-1, September 14-19, 1975, ICESA, Las Vegas, NV, 1976.

52
LIST OF POSSIBLE PUBLICATIONS Bagley ST, Watts WF, Johnson JP, Schauer JJ, Kittelson DP, Johnson JH: Impact of Low-Emission Diesel Engines on Underground Mine Air Quality. Env. Sci. & Tech. (In preparation).