impact of modular organization on dynamical richness in cortical … · ca indicator, cal-520...
TRANSCRIPT

SC I ENCE ADVANCES | R E S EARCH ART I C L E
NEUROSC I ENCE
1WPI–Advanced Institute forMaterials Research (WPI-AIMR), TohokuUniversity, Sendai980-8577, Japan. 2Research Institute for Electrical Communication, Tohoku University,Sendai 980-8577, Japan. 3Graduate School of Science and Engineering, Yamagata Uni-versity, Yamagata 992-8510, Japan. 4Faculty of Science and Engineering, Waseda Uni-versity, Tokyo 169-8555, Japan. 5Departament de Física de la Matèria Condensada,Universitat de Barcelona, Barcelona 08028, Catalonia, Spain. 6Universitat de BarcelonaInstitute of Complex Systems (UBICS), Barcelona 08028, Catalonia, Spain.*Corresponding author. Email: [email protected] (H.Y.); [email protected] (J.S.)†Present address: Kansei Fukushi Research Institute, Tohoku Fukushi University, Sendai989-3201, Japan.
Yamamoto et al., Sci. Adv. 2018;4 : eaau4914 14 November 2018
Copyright © 2018
The Authors, some
rights reserved;
exclusive licensee
American Association
for the Advancement
of Science. No claim to
originalU.S. Government
Works. Distributed
under a Creative
Commons Attribution
NonCommercial
License 4.0 (CC BY-NC).
Dow
nload
Impact of modular organization on dynamical richnessin cortical networksHideaki Yamamoto1*, Satoshi Moriya2, Katsuya Ide2, Takeshi Hayakawa2, Hisanao Akima2,Shigeo Sato2, Shigeru Kubota3, Takashi Tanii4, Michio Niwano2†, Sara Teller5,6,Jordi Soriano5,6*, Ayumi Hirano-Iwata1,2
As in many naturally formed networks, the brain exhibits an inherent modular architecture that is the basis of its richoperability, robustness, and integration-segregation capacity. However, the mechanisms that allow spatiallysegregated neuronal assemblies to swiftly change from localized to global activity remain unclear. Here, we integratemicrofabrication technologywith in vitro cortical networks to investigate thedynamical repertoire and functional traitsof four interconnected neuronal modules. We show that the coupling among modules is central. The highest dynam-ical richness of the network emerges at a critical connectivity at the verge of physical disconnection. Stronger couplingleads to a persistently coherent activity among the modules, while weaker coupling precipitates the activity to belocalized solely within the modules. An in silico modeling of the experiments reveals that the advent of coherenceis mediated by a trade-off between connectivity and subquorum firing, a mechanism flexible enough to allow forthe coexistenceof both segregated and integrated activities. Our results unveil a new functional advantage ofmodularorganization in complex networks of nonlinear units.
ed
on March 2, 2020http://advances.sciencem
ag.org/ from
INTRODUCTIONModular organization is ubiquitous in many real-world systems, in-cluding biological networks such as the brain (1–3). Recent connectomeanalyses have revealed that such an organizational principle is con-served evolutionarily in animal brains, across multiple species (3, 4)and spatial resolutions (3, 5, 6). Modular organization is consideredto be advantageous, since it is naturally small world, which facilitatesrobustness, adaptiveness, and resilience to damage (3, 7, 8). Computa-tional studies have pinpointed that modularity underlies the emergenceof complex spatiotemporal dynamics that are essential for cortical pro-cessing (2, 9) as well as rapid switching between locally segregated pro-cessing and globally integrated information flow with minimumwiringcosts (3, 10). Integration is associated with the capacity of a neuronalnetwork to operate as a whole and efficiently exchange information,while segregation refers to the capacity to distribute information ontolocalized communities that perform specialized tasks.
The inherent impossibility to architect different wiring schemesin natural neuronal tissues, however, has hindered the investigationof the causal relationships betweenmodular organization and functionaltraits and called for the design of well-controlled experiments. Recently,microfabrication has emerged as a novel technology to engineer thegrowth of cellular systems (11), including neurons derived from themammalian brain (12–17). Such a technology has paved the way towardthe construction of in vitro modular networks to investigate the relation-ship betweenmodular architecture and function (15–17),making it possibleto directly address the question of how multicellular activity is synchro-nized among modules to realize integration-segregation balance (10, 18).
Here, we used this bottom-up approach to construct modular cor-tical networks in vitro and studied their functional significance. Weshow that dynamically rich spontaneous activity, inwhich both segregatedand integrated dynamics coexist, emerges only when the intermodularcoupling is at the verge of disconnection. Through computationalmodeling, we show that the latter is achieved via an excitatory feedbackloop that amplifies inputs to amodule, thus effectively reducing the thresh-old for neuronal inputs, or quorum (19, 20).
RESULTSModularity and dynamical richnessWe considered a simple modular design consisting of four spatiallysegregated areas, which are represented as 200 mm by 200 mm squaresand are connected either by zero, one, or three lines (Fig. 1A). We referto these configurations as the no-bond, single-bond, and triple-bondpatterns, respectively. The width of the line was designed to be 5 mm,on which multiple neurites can grow in either direction. The structureswere fabricated as micropatterns of cell-adhesive proteins, which werestamped on a glass coverslip by microcontact printing (Fig. 1A). Themicropatterns support the growth of primary cortical neurons withina predefined area (Fig. 1B). Immunostaining for axonal and somatoden-dritic markers confirmed the random growth of axonal and dendriticprocesses within the square unit with an occasional outgrowth to theinterconnecting lines (fig. S1A). As a control structure, we fabricateda pattern in which the four areas were merged into a 400 mm by 400 mmsquare (merged; Fig. 1, A and B). A graph theoretical analysis of thepatterns showed that their modularity, i.e., the tendency to exhibit dis-tinct communities ormodules (1, 21), increased as connections betweenthe four areas were reduced (fig. S2), and this occurred in the order ofmerged, triple-bond, single-bond, and no-bond patterns.
We investigated the effect of spatialmodularity onnetwork dynamicsusing fluorescence calcium imaging (Fig. 1C). In all patterns, the neuronsformed a sufficient number of synapses by 10 days in vitro (DIV) tospontaneously generate coherent activity in the form of network bursts(Fig. 1D and fig. S1B) (14, 19) [merged, 77% of recorded cultures (n =22); triple bond, 90% (n = 21); single bond, 84% (n = 23)]. In no-bond
1 of 11

SC I ENCE ADVANCES | R E S EARCH ART I C L E
on March 2, 2020
http://advances.sciencemag.org/
Dow
nloaded from
networks, we observed bursts in 50% (n = 20) of the cultures, with nocorrelation among modules. Since the number of neurons in a networkaffects its dynamics (14), we maintained the neuronal population con-stant at approximately 100 cells per culture (fig. S3).
Although all of the patterns supported network bursts, their temporalstructure varied. As shown in Fig. 1E, the number of network burstsgradually decreased with increasing modularity, and a comparison ofthe distribution of interburst intervals (IBIs)—a signature of the temporalstructure of the events—revealed that the IBI distribution of the single-bond networks, IBIsingle, deviated from that of themerged (IBImerged)and triple-bond (IBItriple) networks (Fig. 1F). We quantified thesedifferences using the Jensen-Shannon divergence, DJS, and obtainedDJS(IBIsingle||IBImerged) = 0.032, DJS(IBIsingle||IBItriple) = 0.036, and
Yamamoto et al., Sci. Adv. 2018;4 : eaau4914 14 November 2018
DJS(IBImerged||IBItriple) = 0.017. The differences among the three dis-tributions were statistically significant, with P < 0.001 for IBIsingleagainst both IBImerged and IBItriple and P < 0.01 for IBImerged againstIBItriple (two-sample Kolmogorov-Smirnov test). The broader distribu-tion of IBIs in the single-bond network indicates a higher aperiodicityand temporal complexity of the events. The duration of individualbursts in each neuron, in contrast, was affected only weakly (fig. S4A).
Increased variability in the number of participating neurons inbursting events was another aspect that marked the dynamics of thesingle-bond pattern. This behavior is illustrated in Fig. 1D, in whichthe coherent activity switched between two and fourmodules. To quan-tify this phenomenon, we evaluated the correlation coefficient (CC; seeMaterials and Methods) averaged over neuronal pairs affiliated to
Fig. 1. Engineering the modularity of living cortical networks. (A) Confocal imaging of the polydimethylsiloxane (PDMS) stamps used for microcontact printing ofthe proteins. From left to right: merged, triple-bond, single-bond, and no-bond patterns. (B) Phase-contrast micrographs of cortical networks at 10 DIV. Modularityincreases in the order of merged, triple-bond, single-bond, and no-bond networks. (C) A cortical network on the single-bond micropattern loaded with the fluorescenceCa indicator, Cal-520 acetoxymethyl ester (AM). Scale bar, 200 mm. (D) Fluorescence signals from a 20-min recording of the spontaneous activity of a single-bondnetwork. Traces of eight neurons are shown, and the colors distinguish the affiliated modules. Black dots mark detected spikes. In this recording, network bursts wereobserved twice, in addition to 10 bursts that involved only two modules. In the third, fifth, and seventh traces (from the top), small random events were also observed,which, most probably, are sporadic action potentials. (E) The average number of network bursts per 20-min session. Note that for the no-bond network, the activity ofindividual modules was isolated (see fig. S4B), and an event refers to synchronized firing within each 200 mm by 200 mm island. n = 22 (merged), 21 (triple bond), 23(single bond), and 20 (no bond). Error bars represent the SEM. (F) Distributions and cumulative distributions (inset) of IBI in the merged, triple-bond, and single-bondnetworks. Cum. prob., cumulative probability.
2 of 11
SC I ENCE ADVANCES | R E S EARCH ART I C L E
on March 2, 2020
http://advances.sciencemag.org/
Dow
nloaded from
different modules, i.e., intermodular correlations (fig. S4B). A com-parison showed that the mean intermodular CC was more broadlydistributed for the single-bond pattern than for the merged or triple-bond patterns, whose CCs were largely clustered at ~1.
We introduce dynamical richnessQ to provide a direct measure forthis spatiotemporal variability. This quantity, as well as similar onestermed “complexity” in the literature (22, 23), reflects the ability of aneuronal network to exhibit a broad range of dynamical states. Intui-tively, this richness characterizes a state in which neurons coactivate ingroups of varying size and temporal occurrence and with Q = 0 cor-responding to a scenario of random activity or persistent whole-network synchronization. We defineQ as a combination of two assays,namely, the variability among the activity patterns of firing neurons andthe variability among the size of global network activations (GNAs; seeMaterials and Methods). For the first assay, we analyzed the pairwiseCCs, rij, to obtain the distribution p(rij). A distribution clustered atrij = 1 indicates fully correlated neuronal activity, and that clusteredat rij = 0 indicates uncorrelated neuronal dynamics. Similarly, for thesecond assay, we analyzed the time series of GNA occurrences, Gt, toobtain the distribution p(Gt) of coherent network activations, with adistribution clustered at Gt = 1 indicating persistent coherent activa-tions and that clustered at Gt = 0 indicating the absence of any coac-tivation. The difference between the measured distributions and theseextreme cases reflects the rich dynamics in the network. FollowingZamora-López et al. (24), Q is computed as
Q ¼ QCCQGNA ¼
1� m2ðm� 1Þ ∑
m
m¼1
����pmðrijÞ � 1m
����!
1� m2ðm� 1Þ ∑
m
m¼1
����pmðGtÞ � 1m
���� !
ð1Þ
where |·| denotes the absolute value andm = 20 is the number of binsused for estimating the distributions. QCC and QGNA indicate therichness associated with each assay. Our measureQ is robust to errorsin the inference of neuronal spike trains and to the presence of randomneuronal activations.
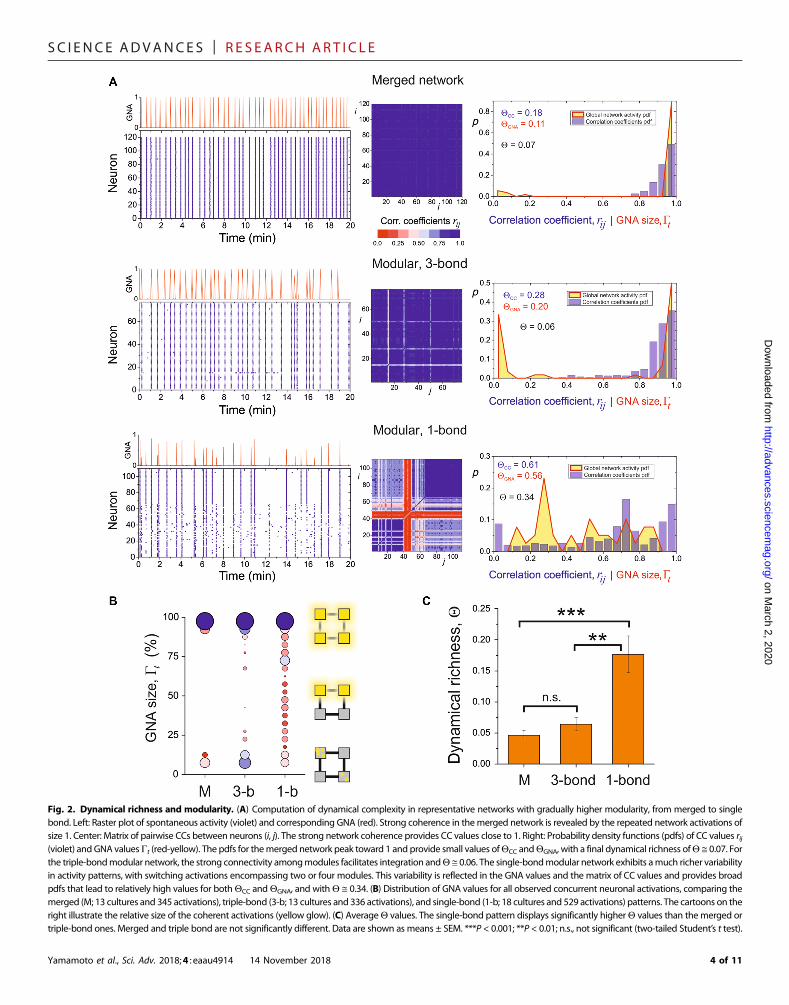
Figure 2A shows the results of this analysis. The merged and triple-bond configurations exhibit highly periodic coherent activations andnearly identical activity patterns. The associated distributions yieldQCC ≅ 0.2 to 0.3 andQGNA ≅ 0.1 to 0.2, and a final dynamical richnessQ ≅ 0.06. The single-bond pattern, however, exhibits variable activa-tions that range from a few neurons in a spatial module to the entirenetwork. CC and GNA are more broadly distributed, with QCC ≅0.61 and QGNA ≅ 0.56, and a final Q ≅ 0.34.
The high dynamical richness of the single-bond pattern was awidespread feature, as shown in Fig. 2B, where the GNA sizes for allof the observed activity episodes are compared among patterns. Whilethe merged and triple-bond patterns essentially display full networkactivations or random events, the single-bond one practically coversthe entire range of coactivation sizes. On average, the single-bonddynamical richness was significantly higher than the merged or thetriple-bond ones, as shown in Fig. 2C. As a final remark, we note thatthe results shown here are robust with respect to other definitions ofcomplexity, such as the ones described in Marshall et al. (23) orZamora-López et al. (24), as shown in fig. S5. Thus, independentlyof the definition of complexity used, the single-bond configuration is
Yamamoto et al., Sci. Adv. 2018;4 : eaau4914 14 November 2018
able to exhibit unique dynamical traits as compared to the otherpatterns.
Effective connectivity and integration-segregation balanceThe analysis of network activity using CC and Q provided an insightinto the behavior of the networks as a whole, without providinginformation on the communication among neurons or the functionalinterplay between spatial modules. To render a complete picture, weinvestigated the functional organization of the networks to expose theflow of neuronal activity, identify neurons that have a central role, andquantify the integration-segregation capacity of the patterned cultures.
By functional organization, we refer to a set of graph-derived net-work features that include effective connectivity, functional commu-nities, hubs, and the normalized global efficiency G*EFF (see Materialsand Methods) (25–28). The latter captures the capacity of the networkto efficiently exchange information among all neurons and thereforeprovides a direct measure of its degree of integration. Figure 3A showsrepresentative effective connectivity maps of the studied patterns. Thenodes and connections are color coded according to their strength andweight, respectively. For the merged and triple-bond patterns, neuronsform a highly integrated graph that shapes a unique functional com-munity with G*EFF ≅ 1. Modules in the triple-bond pattern are sostrongly bound that they operate as a single functional community.Some neurons play an important role in this cohesiveness in that theyexhibit high centrality characteristics (see Materials and Methods) andare ascribed as provincial hubs (2, 25). By contrast, the single-bondpattern exhibits a more heterogeneous effective connectivity, with thespatial modules being connected to one another with fewer links.Two main functional communities are observed in the illustrative ex-ample shown in Fig. 3A. These communities are also composed of neu-rons from different modules, but their internal connectivity is verydifferent, with the community highlighted in yellow exhibiting an abun-dance of provincial hubs. The two communities are linked togetherthrough a kinless node (see Materials and Methods) and weak links,shaping a system that, as a whole, exhibits a very low global efficiencyof G*EFF ≅ 0.2, much smaller than the previous cases and that portraysits segregated behavior.
Figure 3B reveals the concert between dynamical richness andshifting functional organization by depicting the temporal evolutionof G*EFF for the same single-bond pattern. The effective networks con-tinuously change in structure and number of communities and switchfrom strong functional segregationwithG*EFF≅ 0.2 to strong functionalintegration with G*EFF ≅ 0.6. Although coherent episodes are frequent,the operability of the single-bond pattern is markedly richer than themerged and triple-bond patterns, which reside in a permanentintegrated state.
The lowerG*EFF of the single-bond pattern was consistent over real-izations. As shown in Fig. 3C, the average G*EFF value for the single-bond cultures was significantly smaller than the merged or triple-bondpatterns. The fact that the values for the latter do not reach 1 indicatesthat, on average, the integration capacity of the studied networks issmaller than that in their equivalent random graphs. This is possiblydue to the inherent spatial embedding of the cultures, which promoteslocal connectivity (20) and thus an overall weaker integration.
To gain a deeper insight into the impact of intermodular con-nectivity on functional organization, we also targeted the strengthof excitatory connectivity in the single-bond pattern by applicationof the AMPA–glutamate receptor antagonist CNQX (6-cyano-7-nitroquinoxaline-2,3-dione). As shown in fig. S6, a network that was
3 of 11
SC I ENCE ADVANCES | R E S EARCH ART I C L E
on March 2, 2020
http://advances.sciencemag.org/
Dow
nloaded from
Fig. 2. Dynamical richness and modularity. (A) Computation of dynamical complexity in representative networks with gradually higher modularity, from merged to singlebond. Left: Raster plot of spontaneous activity (violet) and corresponding GNA (red). Strong coherence in themerged network is revealed by the repeated network activations ofsize 1. Center: Matrix of pairwise CCs between neurons (i, j). The strong network coherence provides CC values close to 1. Right: Probability density functions (pdfs) of CC values rij(violet) and GNA valuesGt (red-yellow). The pdfs for themerged network peak toward 1 and provide small values ofQCC andQGNA, with a final dynamical richness ofQ ≅ 0.07. Forthe triple-bondmodular network, the strong connectivity amongmodules facilitates integration andQ ≅ 0.06. The single-bondmodular network exhibits amuch richer variabilityin activity patterns, with switching activations encompassing two or four modules. This variability is reflected in the GNA values and the matrix of CC values and provides broadpdfs that lead to relatively high values for bothQCC andQGNA, and withQ ≅ 0.34. (B) Distribution of GNA values for all observed concurrent neuronal activations, comparing themerged (M; 13 cultures and 345 activations), triple-bond (3-b; 13 cultures and 336 activations), and single-bond (1-b; 18 cultures and 529 activations) patterns. The cartoons on theright illustrate the relative size of the coherent activations (yellow glow). (C) AverageQ values. The single-bond pattern displays significantly higherQ values than themerged ortriple-bond ones. Merged and triple bond are not significantly different. Data are shown as means ± SEM. ***P < 0.001; **P < 0.01; n.s., not significant (two-tailed Student’s t test).
Yamamoto et al., Sci. Adv. 2018;4 : eaau4914 14 November 2018 4 of 11

SC I ENCE ADVANCES | R E S EARCH ART I C L E
on March 2, 2020
http://advances.sciencemag.org/
Dow
nloaded from
regularly firing in a synchronous manner was driven into a moresegregated state by application of [CNQX] = 500 mM. The reductionof excitation enhanced the dynamical richness of the system and shapeddistinct functional communities. We therefore hypothesize that smallvariations of the excitatory connectivity among modules are sufficient tocontrol the degree of integration or segregation in the neuronal network.
Physical connectivity among modulesThe above results highlight the pivotal role of intermodular coupling innetwork functionality. Strong coupling results in persistent integrationwith systematically coherent dynamics, while coupling just at the edgeof intermodular disconnection leads to dynamics that are spatially andtemporally more complex.
To shed light on the role of intermodular connectivity in facilitatingcoherent dynamics in the weakly coupled, single-bond networks, weanalyzed the relationship between the thickness of the neurite bundleand the CC of the modules coupled by it (Fig. 4A). An unsupervised
Yamamoto et al., Sci. Adv. 2018;4 : eaau4914 14 November 2018
classification analysis based on the k-means algorithm revealed that,as a general trend, CC between two modules was higher when thebundle was thicker (group 1, blue) and that a population existed inwhich the correlation was low (approximately zero) independent ofbundle thickness (group 2, gray). The plots classified as group 2 derivedfrom samples in which either one module or both modules were notactive during the 20-min recording. However, in another population,the modules coupled with a thin bundle fired coherently (group 3,red). Coherence in sparsely coupled modules was also apparent at thelevel of three- and four-module interactions (Fig. 4, B and C). Theexistence of such a thin-but-strong coupling is most likely the reasonfor the occurrence of integrated—yet not fully persistent—activity in thesingle-bond networks.
Network mechanism of subquorum integrationTo clarify the mechanisms that support functional integrability withinspatially segregated modules, we constructed an in silico model for the
Fig. 3. Effective connectivity and global efficiency. (A) Representative effective connectivity maps for patterns with gradually higher spatial modularity. The squared contourswith a dotted outline indicate the location of the spatial modules. The merged and triple-bond patterns provide highly connected, highly integrated effective networks,withG*EFF≅1 andonly one functional community. Provincial hubs in the triple-bondpattern facilitate the permanent functional cohesion amongmodules. The single-bondnetworkexhibits a much weaker connectivity and a much lower integration capacity, with G*EFF ≅ 0.18. Its effective network is characterized by two main communities (orange and yellowareas) that extend across differentmodules. Provincial hubsmaintain cohesion within communities, which are, in turn, linked through a kinless node. (B) Raster plot of spontaneousactivity and temporal evolution ofG*EFF for the same single-bond network. The graphs below show illustrative effective networks at different stages of the recording to highlight therich functionality of the system, which switches from high integration (stages 1 and 4) to high segregation (stages 2 and 3). The values below each network indicate the number ofmain communities. (C) AverageG*EFF values for all studied networks (merged, 13 cultures; triple bond, 13; single bond, 18). Themerged and triple-bond patterns exhibitG*EFF valuessignificantly higher than thoseof the single-bondpatterns. Themerged cultures are always integrated, the triple-bondones aremostly integratedwith rare or sporadic segregation,and the single-bond ones switch between the two scenarios. Data are shown as means ± SEM. ***P < 0.001, **P < 0.01 (two-tailed Student’s t test).
5 of 11

SC I ENCE ADVANCES | R E S EARCH ART I C L E
on March 2, 2020
http://advances.sciencemag.org/
Dow
nloaded from
modular neuronal network. In the model, the number of inputs re-quired to excite a neuron, or quorum (19, 20), was approximately 10(see Materials and Methods). Network models were generated byforming a designatednumber of interconnections between four randomnetworks, each containing 25 nodes (Fig. 5A).
As a general trend, integrability increased with the number ofintermodular connections. The probability of observing more thanone network burst was >97% when the number of intermodular con-nections was >76, i.e., about 20 connections per module pair (Fig. 5B).However, network bursts were also observed in more segregated net-works. For example, 25% of the networks generated such activity evenwhen the number of intermodular connections was 40, i.e., 10 connec-tions per module pair (Fig. 5B). As the connections were directed, onlyfive connections were added from onemodule to another, which is 50%of that expected from the quorum of individual neurons. In Fig. 5C, theresults are reorganized to illustrate the dependence of intermodular cor-relation on the number of intermodular connections. Although the CCwas positively correlated with the number of intermodular connections,highly correlated modules were occasionally observed with less than10 connections.
We first hypothesized that this subquorum synchronization, i.e.,synchronization between neurons that are coupled with fewer numberof connections than the quorum,was caused by the dense local couplingwithin modules, which would increase the resting membrane potential
Yamamoto et al., Sci. Adv. 2018;4 : eaau4914 14 November 2018
of the neurons. However, the membrane potential distribution for themodular networks was similar to those of random networks with iden-tical numbers of nodes and connections (fig. S7A). This points to theimportance of the temporal structure, underpinned by network con-nectivity, in regulating correlated activity. As illustrated in Fig. 5E, whena module receives several coherent inputs from another module, theneurons that directly receive the input (“input layer” nodes) activateother neurons within the module (“hidden layer” nodes). A fractionof the hidden layer nodes then provides a recurrent feedback to theinput layer. The dense intramodular connectivity in amodular networkenriches these recurrent connections.
To analyze the role of these recurrent connections in subquorumintegration, we sampled in the model a network containing 26 inter-modular connections (6.5 connections per module pair) that generatednetwork bursts. We observed that all network bursts were initiated inmodule 3, which then propagated to modules 2 and 4 and lastly tomodule 1 (Fig. 5D). Assuming this directionality, we identified all therecurrent connections from the hidden layer to the input layer in mod-ules 1, 2, and 4 and randomly rewired them to noninput layer nodeswithin each module. The effect of this rewiring on the occurrence ofnetwork bursts is summarized in Fig. 5F. The integrability of thenetwork decreases as the recurrent connections are rewired, and theirtotal elimination resulted in a ~95% suppression of the network bursts.Increasing the synaptic strengths decreased the number of intermodular
Fig. 4. Subquorum coherence in micropatterned cortical networks. (A) Relationship between the mean CC between two neighboring modules and the width of the inter-connecting neurite bundle in the single-bond patterns. Each dot represents a module pair and is colored according to the result of the k-means algorithm. (B) Three-bodyinteraction of neuronal modules. The mean CC between neurons in modules a and g, �rag , is plotted against the bundle thickness of modules a-b and b-g. The value of �rag isindicated in color, and the size of the dots is changed in proportion to the value to aid visualization. (C) Average intermodular correlation [ð�rab þ �rag þ �rad þ �rbg þ �rbd þ �rgdÞ=6]plotted against average bundle thickness [�d ¼ ðdab þ dbg þ dgd þ ddaÞ=4]. Each dot represents an individual network and is colored according to the result of the k-meansalgorithm. The dashed line represents a linear fit against the blue plots.
6 of 11

SC I ENCE ADVANCES | R E S EARCH ART I C L E
http://advances.sciencemag.o
Dow
nloaded from
connections required for generating network bursts, but subquorumcharacteristics caused by the intramodular feedback excitation re-mained apparent (fig. S7B).
on March 2, 2020
rg/
DISCUSSIONMicropatterned cultures provide a simple yet elegant platform toinvestigate the dynamic capacity of modular neuronal networks. Ourdesign is based on spatially segregated units coupled to one another, astructure that approaches in vitro the organization of the mammalianbrain (29). The uniqueness of our approach is its potential for sys-tematically exploring the functional impact of intermodular connectivity.Our system is scalable, andwe can therefore gobeyondour current designand investigate more complex structures such as modular networks withweighted couplings (fig. S8A), directed connectivity (fig. S8B), or hierar-chical organization (3, 24, 30, 31).
In our experiments, abundant connections across the spatial mod-ules in the triple-bond configuration render a dynamically stable yetexcessively rigid system in which the different modules fire in a co-herent manner. The excess of connections drives the system to op-erate as a unique entity, i.e., making the spatial embedding of neuronsinto modules irrelevant. This observation may have strong implica-tions in naturally formed modular networks such as the brain, since anexcess of connectivity among brain areas may severely disrupt its in-herent integration-segregation capacity and functional operation.
The reduction of intermodular connectivity in the single-bond con-figuration shapes a flexible and dynamically rich system, where fullysynchronized regimes coexist with fractional ones with variations inparticipating neurons. We note that a rich distribution of coordinated
Yamamoto et al., Sci. Adv. 2018;4 : eaau4914 14 November 2018
activity sizes reveals the existence of neuronal interactions across broadspatiotemporal scales. Thus, the single-bond patterns may operate neara critical point, a state that optimizes information flow, maximizescommunication, and facilitates swift response to perturbations (9, 23).Analogous to the brain, the flexibility of the single-bond pattern capa-citates the system to plunge into more segregated or more integratedcomputations depending on the states of the neurons and connections.This flexibility may be a signature for the ability of the network to sus-tain damage. Teller et al. (27) observed that dynamically rich, self-organized modular networks formed by a few dozens of modules aremuch more resilient to the failure of connections as compared tohomogeneous, nonmodular networks. The high dimensionality of thedynamics is also relevant from the viewpoint of cortical informationprocessing.
Our observations are consistent with those of previous theoreticalinvestigations (22, 32) and other experimental designs (15, 16, 27, 33).These studies, however, did not examine the network mechanisms be-hind such a flexibility and dynamical richness. The central finding ofour study is that the rich dynamics and flexibility of the single-bondpatterns are mediated by a relatively few connections among modules.This connectivity trait facilitates the emergence of functional com-munities of varying sizes and structures. These dynamically rich episodesare combined with regimes of full coherence that are rooted on sub-quorum firing promoted by connectivity-induced amplification. Weconjecture that short-term plasticity and fluctuations are the channelsfor a flexible dynamical switching that renders the dynamical richness ofthe single-bond patterns. Furthermore, we hypothesize that coherencewithin such a system could be locally and transiently controlled throughstimulation, as occurs in the brain upon sensory input.
Fig. 5. Subquorumsynchronization in in silicomodel networks. (A) Schematic representation of amodular networkmodel. Yellow circles indicate neurons, gray lines denotethe connections, and arrows indicate the direction of the connection. (B) Occurrence of network bursts (events) is shown as the average number per 20 min. A total of300 networks were sampled per condition. The probability of a network exhibiting more than one event is shown on the counter axis. Results obtained over a wider range areshown in the inset. The dotted line indicates data obtained from networks with completely randomized connectivity with identical average node degrees. (C) Mean CC betweentwo modules versus the number of connections between the modules (solid line). Individual data are plotted in violet. To ease visualization, we randomly displace the plotshorizontally by ±0.5. (D) Raster plots of two network bursts that occurred in the same network with 26 intermodular connections. The red bar indicates the timing of an actionpotential. The activity is initiated inmodule 3 (neurons 51 to 75) andpropagates tomodules 2 (neurons 26 to 50) and 4 (neurons 76 to 100) and lastly tomodule 1 (neurons 1 to 25).(E) The mechanism of subquorum synchronization. The feedback excitation from the hidden layer nodes (orange) to the input layer nodes (blue) enhances the sparse input toeachmodule. (F) Random rewiring of the feedback (FB) excitation to noninput layer nodes diminishes the occurrence of network bursts. A rewiring ratio of 1 corresponds to a caseinwhich no feedback exists from thehidden layer to the input layer. The original network (rewiring ratio, 0) is a networkwith 26 intermodular connections, whose activity is shownin (D). Error bars represent 95% confidence intervals.
7 of 11

SC I ENCE ADVANCES | R E S EARCH ART I C L E
The observation that weakly connected spatial modules can reachfull coherence through subquorum amplification may have impor-tant implications in other fields such as social sciences and epidemics(1, 34, 35), where geographical segregation is often a natural property.In epidemics, for instance, weak intermodular connectivity could beascribed to air transport routes, while subquorum amplificationcould be related to the increased probability for passengers to becomeinfected in densely occupied planes. Thus, despite the low impor-tance of interregional airplane mobility as compared to intraregionaltransportation, a coherent, interregional disease outbreak could occurwhen recurrent amplification is brought into play.
on March 2, 2020
http://advances.sciencemag.org/
Dow
nloaded from
MATERIALS AND METHODSFabrication of patterned substratesMicrocontact printing was used to pattern a mixture of poly-D-lysineand extracellular matrix (ECM) gel on an agarose-coated coverslip.PDMS stamps were fabricated according to the protocol described pre-viously (13). The ratio of prepolymer and curing agent of PDMS(SYLGARD 184, Dow Corning) was optimized for each micropatterndesign, which was 10:1 for the no-bond and single-bond patterns and7.5:1 for the triple-bond and merged patterns. The three-dimensionaltopography of the stamp surfaces was analyzed using confocalmicros-copy (VK-X260, KEYENCE).
To print proteins, a glass coverslip (12-545-84, Thermo FisherScientific) was first cleaned by sonication in 100% ethanol and sub-sequent treatment in air plasma for 60 s (PM-100, Yamato). Fourdots of paraffin wax (P3558, Sigma-Aldrich) were then placed at theperiphery of the coverslip (approximately 0.5 mm in height), and thesurface was then coated with 0.2% agarose (A9918, Sigma-Aldrich).After drying the agarose overnight, the coverslips were sterilized byultraviolet irradiation for 30 min, and protein ink [ECM gel (E1270,Sigma-Aldrich; 1:100 dilution) + poly-D-lysine (50 mg ml−1; P0899,Sigma-Aldrich)] was stamped using a single-axis micromanipulator.The coverslip was dried overnight in a fume hood andwas subsequentlyimmersed in the neuronal plating medium [minimum essential me-dium (MEM; 11095-080, Gibco) + 5% fetal bovine serum + 0.6%D-glucose] a day before cell plating.
Cell cultureAnimal experiments were approved specifically for this study by theCenter for Laboratory Animal Research, Tohoku University (approvalnumber: 2014BeA-005-1). Timed-pregnant Sprague-Dawley rats wereobtained fromCharles River Laboratories, Japan, and were used imme-diately after receipt. Primary neuronswere obtained from the cortices ofembryonic day 18 pups, plated on the microfabricated coverslip, andcocultured with astrocyte feeder cells in N2 medium [MEM + N2 sup-plement + ovalbumin (0.5 mgml−1) + 10 mMHepes] (13, 14). Half themedium was changed at 4 and 8 DIV with Neurobasal medium [Neu-robasal (21103-049, Gibco) + 2%B-27 supplement (17504-044, Gibco) +1% GlutaMAX-I (35050-061, Gibco)].
Calcium imagingAt 10DIV, networks bearing 70 to 130 neurons (20 to 30 neurons) wererandomly selected from each coverslip for the single-bond, triple-bond,and merged (no-bond) patterns. Cultured neurons were loaded with afluorescence calcium indicator Cal-520 AM (AAT Bioquest) by firstrinsing the cells in Hepes-buffered saline (HBS) containing 128 mMNaCl, 4 mM KCl, 1 mM CaCl2, 1 mM MgCl2, 10 mM D-glucose,
Yamamoto et al., Sci. Adv. 2018;4 : eaau4914 14 November 2018
10 mM Hepes, and 45 mM sucrose and subsequently incubating inHBS containing 2 mM Cal-520 AM and 0.01% Pluronic F-127 for30 min at 37°C. The cells were then rinsed in fresh HBS and incubatedfor an additional 10 min to complete the deesterification of the loadedAM dyes. The samples were imaged on an inverted microscope (IX83,Olympus) equipped with a 20× objective lens (numerical aperture,0.75), a light-emitting diode light source (Lambda HPX, Sutter In-strument), a scientific complementary metal-oxide semiconductorcamera (Zyla 4.2, Andor), and an incubation chamber (Tokai Hit).All recordings were performed at 37°C. Three networks were selectedfrom a coverslip, and for each network, fluorescence imaging was per-formed for 20 min at 10 frames/s on the Solis software (Andor). Thethickness of the neurite bundle that interconnects the modules was es-timated from phase-contrast micrographs based on the brightnessprofile.
Neuronal activity analysisThe recordings were analyzed offline using either ImageJ (NationalInstitutes of Health) or NETCAL (36). For analyses on ImageJ, 60 neu-rons (15 per module) were randomly selected, and their somas weremanually defined as regions of interest (ROIs). Relative fluorescence in-tensity of cell i, (Fi(t) − F0)/F0 = fi(t), with Fi and F0 being the fluores-cence intensity and the background fluorescence, respectively, was thenanalyzed as described previously (14). Alternatively, the recordingswereanalyzed using theNETCAL software. For thismethod, the image of theaverage fluorescence of the recordingwas first created and the background(areas with no change in fluorescence) was removed. Neuronal somaswere next automatically detected and ascribed as ROIs. An average ofabout 90 neurons was identified per network, which were uniformly dis-tributed across modules. The average fluorescence in each ROI along therecording was then extracted, and fi(t) was finally obtained as describedabove.
Spike event detection and network burstsThe time series of fi(t) were analyzed with NETCAL (36) to infer thetiming of neuronal activations using the Schmitt trigger method. Thismethod scans the fluorescence traces for events that first pass a highthreshold and then remain elevated above a second lower thresholdfor at least a certain minimum duration. Shorter events are discarded.In our analysis, we used +3 SDs of the mean of the baseline noise as thehigh threshold, +1.5 SD as the low threshold, and 200 ms as theminimum event length. Schmitt spike inference was contrasted withthe time-derivative thresholding method (14). The overall results wereconsistent across methodologies.
Network bursts provided a quick insight into the collective dynamicsin cultures and were defined as those activity episodes in which morethan 75% of the neurons fired simultaneously for more than 500 ms.Experiments with less than 10 network bursts were discarded in theanalysis of dynamical richness and effective connectivity.
Correlation coefficientsThe functional correlation between neurons i and j was quantifiedusing the Pearson CC, rij
rij ¼∑t ½xiðtÞ � �xi�½xjðtÞ � �xj�ffiffiffiffiffiffiffiffiffiffiffiffiffiffiffiffiffiffiffiffiffiffiffiffiffiffiffiffiffi
∑t ½xiðtÞ � �xi�2q ffiffiffiffiffiffiffiffiffiffiffiffiffiffiffiffiffiffiffiffiffiffiffiffiffiffiffiffiffi
∑t ½xjðtÞ � �xj�2q ð2Þ
8 of 11

SC I ENCE ADVANCES | R E S EARCH ART I C L E
on March 2, 2020
http://advances.sciencemag.org/
Dow
nloaded from
where xi(t) is either fi or the inferred spike trains Si, and �xi is thecorresponding time-averaged values. Si(t) are binary signals, representing1 for the presence of a spike at time t and 0 otherwise. For each network,the mean correlation was evaluated as �r ¼ ∑i≠jrij=NðN � 1Þ, whereN is the number of neurons, and was used as an index of the degree ofglobal correlation. Mean neural correlation within a single module andbetween two separated modules was evaluated as the intramodular andintermodular correlations, respectively, by selecting correspond-ing i-j pairs.
Jensen-Shannon divergenceThis was used to compute the similarity between the distributions ofIBIs. For two distributions P and Q, the Jensen-Shannon divergenceDJS is given by
DJSðPjjQÞ ¼ 12DKLðPjjMÞ þ 1
2DKLðQjjMÞ ð3Þ
whereDKL is theKullback-Leibler divergenceDKLðPjjQÞ ¼ ∑iPðiÞlog2 PðiÞQðiÞ
andM = (P + Q)/2.
Global network activationRaster plots of neuronal activity were scanned using a Dt = 1 swindow to detect episodes of network coherent firing. The fractionof active neurons in each episode provided the global network ac-tivity at a given time of the recording, Gt. Coherent episodes com-prising less than 3% of the networkwere discarded to filter out sporadic,random activity. In addition, the details of the onset times for eachparticipating neuron within the episode were termed “sequence” andwere later used to compute the effective connectivity.
Effective connectivityDirected and weighted graphs were constructed from the inferred neu-ronal spike trains. Following Teller et al. (27, 28), we used a formalismgrounded on time delays to determine the strength of functional cou-plings among neurons. For each detected sequence of coherent activity,the weight of the functional links among all pairs of firing neurons wasestablished as a decaying function of their time delay in activation. Theanalysis was then extended to all observed sequences, and the final valueof the functional connectionwij betweenneurons (i, j)was established asthe sum of all computed weights. The significance of functional linkswas assessed through a random model wS
ij in which the number offirings per neuron was preserved, and a z score was introduced in theform of
Wij ¼wij � ⟨wS⟩ij
sSijð4Þ
where ⟨wS⟩ij is themean weight for 500 surrogates of the randommodelandsSij is the corresponding SD. Values withWij < 0 correspond to linksthat are less connected than those in the surrogates and were set to 0.The final matrix W = {Wij} (weighed and directed) provided the nor-malized weights between all the functionally connected neurons.
We verified (fig. S9) that the effective connectivity matrices derivedusing time delays were similar to those obtained with other approachessuch as transfer entropy (6, 37). Both approaches shared 80% of thestrongest links, procured identical communities, and exhibited verysimilar measures. In addition, we also verified that important network
Yamamoto et al., Sci. Adv. 2018;4 : eaau4914 14 November 2018
measures such as the global efficiency were robust to more restrictivethresholds in the z score (fig. S10).
Community detectionWe first performed hierarchical clustering analysis using the Jaccardmetrics as the distance (28) to obtain the pairwise similarity matrix,which was then normalized using a z score with respect to a null modelthat consisted of a set of 500 surrogates. The average linkage criterionwas applied in the final matrix to establish the arrangement of thegrouping of neurons shaped as a hierarchical tree (Statistics and Ma-chine Learning Toolbox, MATLAB). To mathematically identify thecommunities, a threshold had to be established in the hierarchical tree(28). This threshold was set by taking advantage of the variation ofinformation measure (38) to provide the final set of participating neu-rons in each community.
Centrality measures and hubsWe used a combination of centrality measures to identify hubs in thenetworks. Following Karrer et al. (38), we ascribed as hubs those nodesthat excel (above population average) in at least two of the followingcategories: nodal strength, nodal betweenness, and local efficiency.Hubs are crucial for functional integration and facilitate the flow ofinformation in a network. For networks that present more than onecommunity, hubs were further classified to pinpoint their role in inte-grating the communities. Classification was established through theparticipation coefficient (39, 40), a measure that evaluates the distribu-tion of the functional links of a node across all communities in anetwork. Hubs that present, above average, a high participation co-efficient are referred to as connector hubs and promote communicationamong communities. On the contrary, hubs that show a low participa-tion coefficient are referred to as provincial hubs. Their role is to fa-cilitate communication within a community. Last, those nodes thatpresent a high participation coefficient but were not initially classified ashubs are referred to as kinless nodes. These nodes typically do not belongto a particular community but facilitate intercommunity integration.
Normalized global efficiencyThis provides a measure for the integration capacity of a network.It is computed by first evaluating the matrix of connection lengths,L = {Lij}, which are inversely related to the link weights, Wij. Thehigher the weight in the connection among two neurons, the shorteris their connection length. Thismatrix was then analyzed to computethe shortest path length dij between neurons i and j and, lastly, theglobal efficiency, GEFF, as the average inverse of the shortest pathlength (25, 26)
dij ¼ ∑Luv∈gi→j
Luv ð5Þ
GEFF ¼ 1NðN � 1Þ∑j≠id
�1ij ð6Þ
where Luv is the length between nodes u and v, gi → j is the shortestgeodesic path between nodes i and j calculated using the Dijkstraalgorithm, and N is the total number of neurons. We note thatdij = ∞ for disconnected pairs (i, j). To compare the global efficiencyamong different experiments, we considered its normalized formG*EFF = GEFF/G
RGEFF, where G
RGEFF is the global efficiency for the
9 of 11

SC I ENCE ADVANCES | R E S EARCH ART I C L E
on March 2, 2020
http://advances.sciencemag.org/
Dow
nloaded from
random graph equivalent (nullmodel) of the studiednetwork, computedfromwS = {⟨wS⟩ij}, as introduced before. We verified that the differencesin global efficiency among the three configurations (merged, singlebond, and triple bond) were robust to thresholds in the significance levelof the procured effective networks (fig. S10).
Temporal evolution of normalized global efficiencyThe 20-min recordings were divided into 10 sections of 2 min durationeach. The network activity within each section was then analyzed as anindependent dataset, and the effective networkW and normalized globalefficiency G*EFF were computed accordingly. One must observe thatG*EFF analyzed along the different sections may take values higher thanthe corresponding value for the full 20-min recording. This is caused bythe large statistics of firing events in the full recording, which filters outweak connections or coactivations that occur rarely.
ImmunostainingCortical neurons were fixed with a 4% paraformaldehyde (Sigma-Aldrich)/4% sucrose (Wako) solution, permeabilized with 0.25%Triton X-100 (Nacalai), and blocked in a 0.5% solution of fish skingelatin (Sigma-Aldrich). Axons, somatodendritic regions, and pre-synaptic sites were stained with SMI-312 [837904, BioLegend; mouseimmunoglobulin G1(IgG1)/IgM], MAP2 (ab5392, Abcam; chickenIgG), and Syn1 (106 001, Synaptic Systems; mouse IgG1) antibodies,respectively. The secondary antibodies were Alexa Fluor 488–labeledgoat anti-mouse IgG1 (A21121, Molecular Probes) and Alexa Fluor568–labeled goat anti-chicken IgG (A11041, Molecular Probes). Fluo-rescence images were obtained using either an epifluorescence micro-scope (IX83, Olympus) or a confocal microscope (SP8, Leica).
In silico modelingThemodel network consisted of fourmodules each containing 25 leakyintegrate-and-fire neurons, which are described in (14). Within eachmodule, the neurons were randomly interconnected with directed con-nections at an average degree of 8, and the network modularity wastuned by adding interconnections between the four modules. To bestmodel the experiments, intermodular connections were only added toneighboringmodules, and connections between diagonalmodules wereforbidden.
Each simulation was run for 1200 s with a time step of 0.1 ms. Onlyexcitatory synapses (synaptic conductance, 5 nS) were considered, andeach contributed to a synaptic potential of approximately 2 mV. Theresting and threshold potentials were set at −74 and −54 mV, respec-tively. Spontaneous activity was triggered by delivering Poisson input toeach neuron at 0.5 Hz. The simulated activity of neurons was binned at10 ms, and a network burst was detected when more than 80% of theneurons were continuously activated for more than 100 ms.
SUPPLEMENTARY MATERIALSSupplementary material for this article is available at http://advances.sciencemag.org/cgi/content/full/4/11/eaau4914/DC1Fig. S1. Axon outgrowth and synapse formation of micropatterned cortical neurons.Fig. S2. Effect of intermodular connections on the network structure.Fig. S3. Average number of cells in the networks.Fig. S4. Analysis of network bursts.Fig. S5. Other complexity measures.Fig. S6. Role of excitatory connectivity on dynamical richness and functional organization.Fig. S7. Membrane potentials and synaptic conductance in model networks.Fig. S8. Impact of nonuniform intermodular connectivity in simulations.Fig. S9. Robustness of effective connectivity inference.
Yamamoto et al., Sci. Adv. 2018;4 : eaau4914 14 November 2018
Fig. S10. Dependence of global efficiency GEFF on the amount of the retained significant links.Movie S1. Spontaneous activity recording of a merged network.Movie S2. Spontaneous activity recording of a triple-bond network.Movie S3. Spontaneous activity recording of a single-bond network.Reference (41)
REFERENCES AND NOTES1. S. Fortunato, Community detection in graphs. Phys. Rep. 486, 75–174 (2010).2. O. Sporns, R. F. Betzel, Modular brain networks. Annu. Rev. Psychol. 67, 613–640
(2016).3. D. Meunier, R. Lambiotte, E. T. Bullmore, Modular and hierarchically modular organization
of brain networks. Front. Neurosci. 4, 200 (2010).4. M. P. van den Heuvel, E. T. Bullmore, O. Sporns, Comparative connectomics. Trends Cogn. Sci.
20, 345–361 (2016).5. R. Perin, T. K. Berger, H. Markram, A synaptic organizing principle for cortical neuronal
groups. Proc. Natl. Acad. Sci. U.S.A. 108, 5419–5424 (2011).6. M. Shimono, J. M. Beggs, Functional clusters, hubs, and communities in the cortical
microconnectome, Cereb. Cortex 25, 3743–3757 (2015).7. E. A. Variano, J. H. McCoy, H. Lipson, Networks, dynamics, and modularity. Phys. Rev. Lett.
92, 188701 (2004).8. P. A. Robinson, J. A. Henderson, E. Matar, P. Riley, R. T. Gray, Dynamical reconnection
and stability constraints on cortical network architecture. Phys. Rev. Lett. 103, 108104(2009).
9. M. Rubinov, O. Sporns, J.-P. Thivierge, M. Breakspear, Neurobiologically realisticdeterminants of self-organized criticality in networks of spiking neurons. PLOS Comput. Biol.7, e1002038 (2011).
10. G. Deco, G. Tononi, M. Boly, M. L. Kringelbach, Rethinking segregation and integration:Contributions of whole-brain modelling. Nat. Rev. Neurosci. 16, 430–439 (2015).
11. D. Huh, B. D. Matthews, A. Mammoto, M. Montoya-Zavala, H. Y. Hsin, D. E. Ingber,Reconstituting organ-level lung functions on a chip. Science 328, 1662–1668 (2010).
12. J. Albers, A. Offenhäusser, Signal propagation between neuronal populations controlledby micropatterning. Front. Bioeng. Biotechnol. 4, 46 (2016).
13. H. Yamamoto, R. Matsumura, H. Takaoki, S. Katsurabayashi, A. Hirano-Iwata, M. Niwano,Unidirectional signal propagation in primary neurons micropatterned at a single-cellresolution. Appl. Phys. Lett. 109, 043703 (2016).
14. H. Yamamoto, S. Kubota, Y. Chida, M. Morita, S. Moriya, H. Akima, S. Sato, A. Hirano-Iwata,T. Tanii, M. Niwano, Size-dependent regulation of synchronized activity in living neuronalnetworks. Phys. Rev. E 94, 012407 (2016).
15. L. Pan, S. Alagapan, E. Franca, S. S. Leondopulos, T. B. DeMarse, G. J. Brewer, B. C. Wheeler,An in vitro method to manipulate the direction and functional strength between neuralpopulations. Front. Neural Circuits 9, 1–14 (2015).
16. M. Bisio, A. Bosca, V. Pasquale, L. Berdondini, M. Chiappalone, Emergence of burstingactivity in connected neuronal sub-populations. PLOS ONE 9, e107400 (2014).
17. M. Shein-Idelson, E. Ben-Jacob, Y. Hanein, Engineered neuronal circuits: A new platformfor studying the role of modular topology. Front. Neuroeng. 4, 10 (2011).
18. H.-J. Park, K. Friston, Structural and functional brain networks: From connections tocognition. Science 342, 1238411 (2013).
19. J. G. Orlandi, J. Soriano, E. Alvarez-Lacalle, S. Teller, J. Casademunt, Noise focusing and theemergence of coherent activity in neuronal cultures. Nat. Phys. 9, 582–590 (2013).
20. L. Hernández-Navarro, J. G. Orlandi, B. Cerruti, E. Vives, J. Soriano, Dominance of metriccorrelations in two-dimensional neuronal cultures described through a random field Isingmodel. Phys. Rev. Lett. 118, 208101 (2017).
21. E. A. Leicht, M. E. J. Newman, Community structure in directed networks. Phys. Rev. Lett.100,118703 (2008).
22. M. Zhao, C. Zhou, Y. Chen, B. Hu, B.-H. Wang, Complexity versus modularity andheterogeneity in oscillatory networks: Combining segregation and integration in neuralsystems. Phys. Rev. E 82, 046225 (2010).
23. N. Marshall, N. M. Timme, N. Bennett, M. Ripp, E. Lautzenhiser, J. M. Beggs, Analysis ofpower laws, shape collapses, and neural complexity: New techniques and MATLABsupport via the NCC Toolbox. Front. Physiol. 7, 250 (2016).
24. G. Zamora-López, Y. Chen, G. Deco, M. L. Kringelbach, C. Zhou, Functional complexityemerging from anatomical constraints in the brain: The significance of networkmodularity and rich-clubs. Sci. Rep. 6, 38424 (2016).
25. M. Rubinov, O. Sporns, Complex network measures of brain connectivity: Uses andinterpretations. Neuroimage 52, 1059–1069 (2010).
26. V. Latora, M. Marchiori, Efficient behavior of small-world networks. Phys. Rev. Lett. 87,198701 (2001).
27. S. Teller, C. Granell, M. De Domenico, J. Soriano, S. Gómez, A. Arenas, Emergence ofassortative mixing between clusters of cultured neurons. PLoS Comput. Biol. 10, e1003796(2014).
10 of 11

SC I ENCE ADVANCES | R E S EARCH ART I C L E
http://D
ownloaded from
28. S. Teller, I. B. Tahirbegi, M. Mir, J. Samitier, J. Soriano, Magnetite-amyloid-b deterioratesactivity and functional organization in an in vitro model for Alzheimer’s disease. Sci. Rep.5, 17261 (2015).
29. M. A. Bertolero, B. T. T. Yeo, M. D’Esposito, The modular and integrative functionalarchitecture of the human brain. Proc. Natl. Acad. Sci. U.S.A. 112, 6798–6807 (2015).
30. M. Müller-Linow, C. C. Hilgetag, M.-T. Hütt, Organization of excitable dynamics inhierarchical biological networks. PLOS Comput. Biol. 4, e1000190 (2008).
31. R. F. Betzel, D. S. Bassett, Multi-scale brain networks. Neuroimage 160 73–83 (2017).
32. A. Litwin-Kumar, B. Doiron, Slow dynamics and high variability in balanced corticalnetworks with clustered connections. Nat. Neurosci. 15, 1498–1505 (2012).
33. S. Okujeni, S. Kandler, U. Egert, Mesoscale architecture shapes initiation and richness ofspontaneous network activity. J. Neurosci. 37, 3972–3987 (2017).
34. P. J. Mucha, T. Richardson, K. Macon, M. A. Porter, J.-P. Onnela, Community structurein time-dependent, multiscale, and multiplex networks. Science 328, 876–878 (2010).
35. J. Gómez-Gardeñes, D. Soriano-Paños, A. Arenas, Critical regimes driven by recurrentmobility patterns of reaction–diffusion process in networks. Nat. Phys. 14, 391–395(2018).
36. J. G. Orlandi, S. Fernández-García, A. Comella-Bolla, M. Masana, G. García-Díaz Barriga,M. Yaghoubi, A. Kipp, J. M. Canals, M. A. Colicos, J. Davidsen, J. Alberch, J. Soriano,NETCAL: An interactive platform for large-scale, network and population dynamicsanalysis of calcium imaging recordings, Zenodo (2017); https://doi.org/10.5281/zenodo.1119025.
37. O. Stetter, D. Battaglia, J. Soriano, T. Geisel, Model-free reconstruction of excitatoryneuronal connectivity from calcium imaging signals. PLOS Comput. Biol. 8, e1002653(2012).
38. B. Karrer, E. Levina, M. E. J. Newman, Robustness of community structure in networks.Phys. Rev. E 77, 046119 (2008).
39. R. Guimerà, L. A. Nunes Amaral, Functional cartography of complex metabolic networks.Nature 433, 895–900 (2005).
40. L.-D. Lord, A. B. Stevner, G. Deco, M. L. Kringelbach, Understanding principles ofintegration and segregation using whole-brain computational connectomics:
Yamamoto et al., Sci. Adv. 2018;4 : eaau4914 14 November 2018
Implications for neuropsychiatric disorders. Philos. Trans. A. Math. Phys. Eng. Sci. 375,20160283 (2017).
41. K. Morrison, A. Degeratu, V. Itskov, C. Curto, Diversity of emergent dynamics incompetitive threshold-linear networks: A preliminary report. arXiv:1605.04463 [q-bio.NC](14 May 2016).
Acknowledgments: We thank S. Kono, K. Ishihara, S. Fujimori, and R. Matsumura for technicalassistance. Funding: This study was supported by the Cooperative Research Project Programof the Research Institute of Electrical Communication at Tohoku University, JSPS KAKENHI(nos. 15K17449, 26390035, and 18H03325), and the JST CREST Program (JPMJCR14F3). J.S. andS.T. acknowledge financial support from the Spanish Ministerio de Economia y Competitividadthrough project no. FIS2016-78507-C2-2-P and from the Generalitat de Catalunya through grant no.2014-SGR-878. This research is part of MESO-BRAIN. The MESO-BRAIN Project has receivedfunding from the European Union’s Horizon 2020 Research and Innovation Programme under grantagreement no. 713140. Author contributions: H.Y. and J.S. conceived and designed the projectwith inputs from S.S., S.K., T.T., M.N., and A.H.-I. H.Y., K.I., and T.H. performed the experiments.S.M., H.A., and S.K. coded and performed the simulations. H.Y., S.M., K.I., and S.T. analyzed the results.H.Y. and J.S. wrote the manuscript. All authors reviewed and edited the manuscript. Competinginterests: The authors declare that they have no competing interests. Data and materialsavailability: All data needed to evaluate the conclusions in the paper are present in the paperand/or the Supplementary Materials. Additional data related to this paper may be requestedfrom the authors.
Submitted 21 June 2018Accepted 16 October 2018Published 14 November 201810.1126/sciadv.aau4914
Citation: H. Yamamoto, S. Moriya, K. Ide, T. Hayakawa, H. Akima, S. Sato, S. Kubota, T. Tanii,M. Niwano, S. Teller, J. Soriano, A. Hirano-Iwata, Impact of modular organization on dynamicalrichness in cortical networks. Sci. Adv. 4, eaau4914 (2018).
adv
11 of 11
on March 2, 2020
ances.sciencemag.org/

Impact of modular organization on dynamical richness in cortical networks
Tanii, Michio Niwano, Sara Teller, Jordi Soriano and Ayumi Hirano-IwataHideaki Yamamoto, Satoshi Moriya, Katsuya Ide, Takeshi Hayakawa, Hisanao Akima, Shigeo Sato, Shigeru Kubota, Takashi
DOI: 10.1126/sciadv.aau4914 (11), eaau4914.4Sci Adv
ARTICLE TOOLS http://advances.sciencemag.org/content/4/11/eaau4914
MATERIALSSUPPLEMENTARY http://advances.sciencemag.org/content/suppl/2018/11/09/4.11.eaau4914.DC1
REFERENCES
http://advances.sciencemag.org/content/4/11/eaau4914#BIBLThis article cites 39 articles, 5 of which you can access for free
PERMISSIONS http://www.sciencemag.org/help/reprints-and-permissions
Terms of ServiceUse of this article is subject to the
is a registered trademark of AAAS.Science AdvancesYork Avenue NW, Washington, DC 20005. The title (ISSN 2375-2548) is published by the American Association for the Advancement of Science, 1200 NewScience Advances
License 4.0 (CC BY-NC).Science. No claim to original U.S. Government Works. Distributed under a Creative Commons Attribution NonCommercial Copyright © 2018 The Authors, some rights reserved; exclusive licensee American Association for the Advancement of
on March 2, 2020
http://advances.sciencemag.org/
Dow
nloaded from