impact of moisture on long term performance of insulating products based on stone wool
TRANSCRIPT
Impact of moisture on long term performance of insulating products
based on stone wool
Tomáš Vrána
Licentiate Thesis
Stockholm
September 2007
KTH – The Royal Institute of Technology School of Architecture and the Built Environment
Div. Of Building Technology
Impact of moisture on long term performance of insulating products based on stone wool Tomáš Vrána © Tomas Vrana, 2007 Cover: Aurore Schmitt ISRN-KTH-BYT/R-07/200-SE ISSN 1651-5536 ISBN 91-7178-637-1 KTH – The Royal Institute of Technology School of Architecture and the built Environment Div. of Building Technology Brinellvägen 34, SE-100 44 Stockholm
“All you have to decide is what to do with the time that is given to you” Tolkien John Ronald Reuel (1892-1973)
“One that would have the fruit must climb the tree” Fuller Thomas (1608-1661)


Preface This licentiate thesis is the result of the author’s research during the past three years at the Department of Physics at the Czech Technical University in Prague, Czech Republic and at the Division of Building Technology at the Royal Institute of technology in Stockholm, Sweden. After finishing my undergraduate studies in Prague I got an opportunity to continue as a doctoral student and participate in a research taking aim at flat-roof constructions using stone-wool insulant, which were damaged by extremely high level of inbuilt moisture. To spend some time abroad is an educational duty at CTU in Prague. Through the professor Gudni Jóhannesson I got a chance to continue with my studies and research in Stockholm. The first paper describes a real case from practice, where flat roofs of an administrative building in Prague were exposed to rain precipitation, snow and other climate effects for several months in winter 2002/2003 without having completed a layer of water membrane on the top. The second project was elaborated for Strängbetong. A point of this paper is to estimate a time period, in which wet spots around windows and inbuilt moisture in the facade will dry up. The third paper is a first step in the research project intent on finding damages of mineral insulation based on stone wool caused by frosting condensate and inbuilt moisture in time. It aims at designing a testing set-up, that provides a very well contolled moisture load, to detect real material properties, which might be slightly distinct from tabulated values. The fourth paper reports on a laboratory experiment of frost formation and moisture condensation in stone-wool insulants with varying density. An understanding about appearance of frost formation is good for knowledge of processes when high thicknesses of thermal insulation are used in cold climates and moisture might become trapped in the building envelope. I am indebted to Docent Folke Björk and Professor Gudni Jóhannesson at the Royal Institute of Technology in Stockholm for their fruitful discussions and inspiring comments. They helped me to bring my research project into life.
i

Finally, I would like to thank to my girlfriend, my family and my friends, who always supported me in my studies abroad and were ready to help anytime I needed.
Stockholm, September 2007 Tomáš Vrána
ii
Abstract Demands for energy have been increasing in the whole world. According to higher consumption, the price of energy rises yearly too. This evokes usage of insulating products in a wider range. By adding insulation, we lower the amount of energy needed to heat our homes, resulting in fewer associated greenhouse gas emissions and a lower monthly heating bill. Savings depend on insulation thicknesses and on conditions, in which the insulant is kept. Mineral insulation based on stone wool is also a member of building insulants that defends buildings and constructions against temperature changes of the ambient. However, even when we use modern technologies and building techniques to reduce high energy losses, we can never provide unimpeachable protection of stone wool from damage. During a construction process on a building site or at fast climate changes, it often happens that stone wool is exposed to rain precipitaions or other climate effets. This brings water to the insulating structure. Besides the loss of insulating qualities, the stone wool is left permanently wet. Even the fibres of stone wool are inorganic, they still can be attacked by degradation processes due to organic agents fixing fibres together. Analysis of damaged flat-roof constructions using stone wool and verification of material properties is a starting point of this licentiate thesis. The attached paper section can be divided into two parts: In-situ practice that notes troubles with insulating materials based on stone wool with inbuilt moisture on a building site Laboratory measurement that observe material properties of stone wool under varying conditions Keywords Mineral insulation, Stone wool, Material properties, Moisture transport, Heat transport, Test equipment, Moisture properties, Frost formation
iii
List of Papers This Licentiate thesis is based on the following research and conference papers: I. Vrána T., 2005. Impact of moisture on long term performance of
insulating products. Proceedings of the Nordic Symposium on Building Physics, Reykjavik, Vol. 1, pp.71-77
II. Vrána T., Jóhannesson G., 2006. Examination of wall
constructions - Inbuilt moisture in wall constructions of a newly built apartment house. Internal report.
III. Vrána T., Björk F., 2007. A laboratory equipment for the study of
moisture processes in thermal insulation materials when placed in a temperature field. Submitted to Construction and building materials Journal.
IV. Vrána T., Björk F., 2007. Frost formation and condensation in
stone-wool insulants. Submitted to Construction and building materials Journal.
iv

Table of Contents Preface ........................................................................................... i
Abstract ....................................................................................... iii
Keywords ..................................................................................... iii
List of Papers................................................................................iv
Table of Contents..........................................................................v
Nomenclature............................................................................. vii
1. Introduction ...............................................................................1 1.1. Background............................................................................................. 1 1.2. Aim and Limitations.............................................................................. 2 1.3. Outline of the Thesis............................................................................. 3
2. Need For Insulation ..................................................................4 2.1. Insulation Standards and Energetic Perspectives in Europe........... 4 2.2. Types of Thermal Insulations .............................................................. 7
3. Mineral Wool .............................................................................8 3.1. Manufacturing Process.......................................................................... 8 3.2. Physical Properties of Mineral Wool ................................................12
4. Application of Mineral Wool in Practice................................. 16 4.1. General Characteristics of Used Stone-Wool Specimens ..............18
5. Moisture................................................................................... 19 5.1. Moisture Transport in Porous Material ............................................20
6. Methodology of Research........................................................22 6.1. In-situ Measurement Campaign.........................................................22 6.1.1. Case Study No.1........................................................................22 6.1.2. Case Study No.2........................................................................27 6.2. Laboratory Measurement....................................................................32 6.2.1. Designing the Test Set-Up ......................................................32 6.2.2. Measurement above 0°C - Processing...................................36 6.2.3. Measurement below 0°C - Processing...................................41
v
7. Results of the Test Set-Up and Discussion.............................43
7.1. Measurement above 0°C.....................................................................43 7.2. Measurement below 0°C.....................................................................45 7.3. Discussion.............................................................................................55
8. Conclusions and Future Research ..........................................57
8.1. Concluding Remarks ...........................................................................57 8.2. Future Research ...................................................................................58
9. References ...............................................................................59
10. Bibliography...........................................................................60
vi
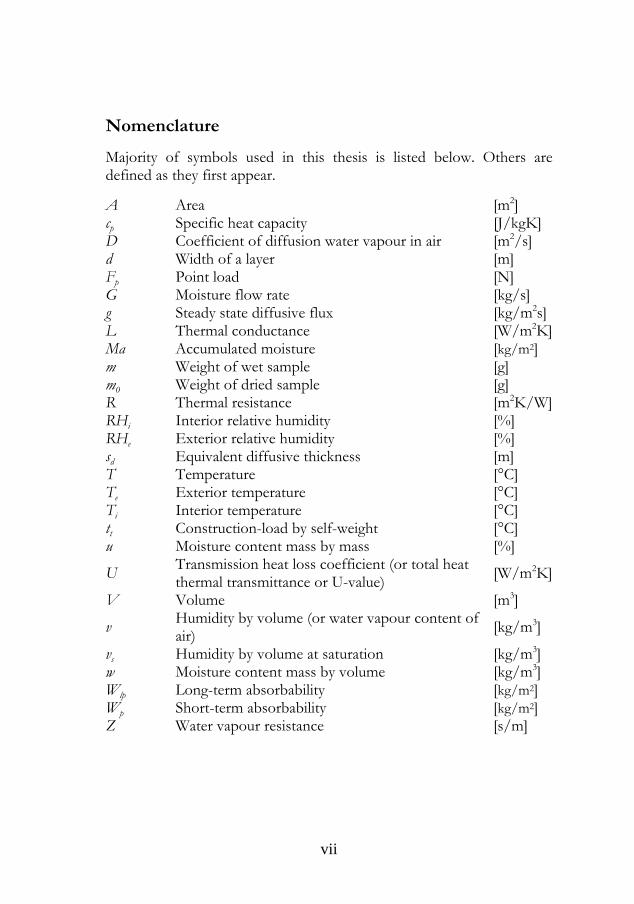
Nomenclature
Majority of symbols used in this thesis is listed below. Others are defined as they first appear. A Area [m2] cp Specific heat capacity [J/kgK] D Coefficient of diffusion water vapour in air [m2/s] d Width of a layer [m] Fp Point load [N] G Moisture flow rate [kg/s] g Steady state diffusive flux [kg/m2s] L Thermal conductance [W/m2K] Ma Accumulated moisture [kg/m2] m Weight of wet sample [g] m0 Weight of dried sample [g] R Thermal resistance [m2K/W] RHi Interior relative humidity [%] RHe Exterior relative humidity [%] sd Equivalent diffusive thickness [m] T Temperature [°C] Te Exterior temperature [°C] Ti Interior temperature [°C] tt Construction-load by self-weight [°C] u Moisture content mass by mass [%]
U Transmission heat loss coefficient (or total heat thermal transmittance or U-value) [W/m2K]
V Volume [m3]
v Humidity by volume (or water vapour content of air) [kg/m3]
vs Humidity by volume at saturation [kg/m3] w Moisture content mass by volume [kg/m3] Wlp Long-term absorbability [kg/m2] Wp Short-term absorbability [kg/m2] Z Water vapour resistance [s/m]
vii
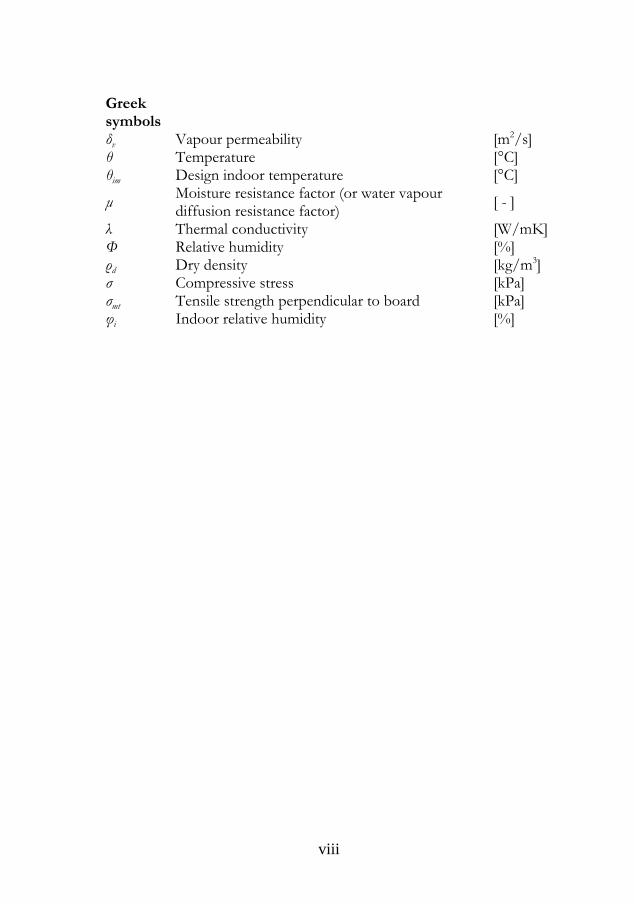
Greek symbols δv Vapour permeability [m2/s] θ Temperature [°C] θim Design indoor temperature [°C]
μ Moisture resistance factor (or water vapour diffusion resistance factor) [ - ]
λ Thermal conductivity [W/mK] Φ Relative humidity [%] ρd Dry density [kg/m3] σ Compressive stress [kPa] σmt Tensile strength perpendicular to board [kPa] φi Indoor relative humidity [%]
viii
1. Introduction
1.1. Background
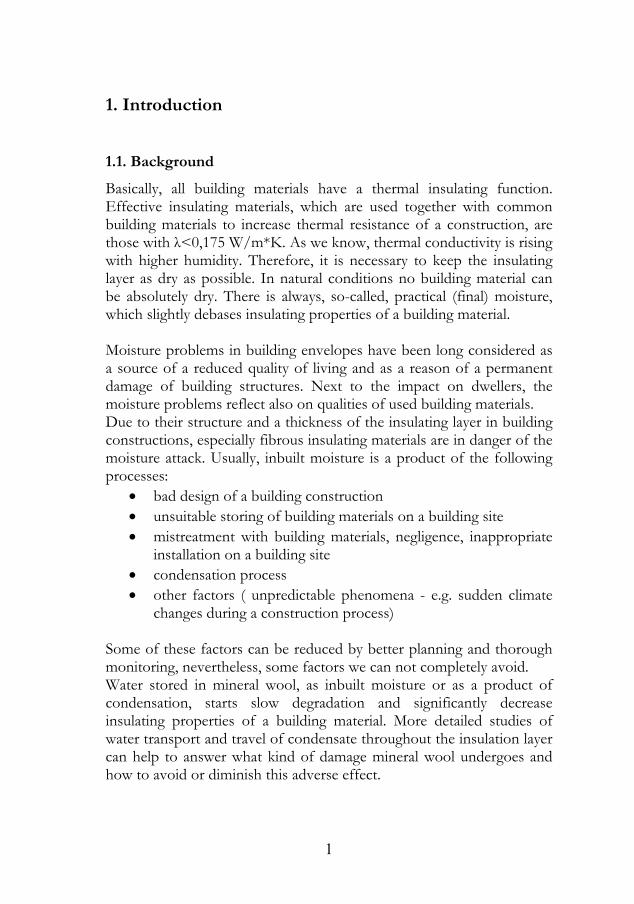
Basically, all building materials have a thermal insulating function. Effective insulating materials, which are used together with common building materials to increase thermal resistance of a construction, are those with λ<0,175 W/m*K. As we know, thermal conductivity is rising with higher humidity. Therefore, it is necessary to keep the insulating layer as dry as possible. In natural conditions no building material can be absolutely dry. There is always, so-called, practical (final) moisture, which slightly debases insulating properties of a building material. Moisture problems in building envelopes have been long considered as a source of a reduced quality of living and as a reason of a permanent damage of building structures. Next to the impact on dwellers, the moisture problems reflect also on qualities of used building materials. Due to their structure and a thickness of the insulating layer in building constructions, especially fibrous insulating materials are in danger of the moisture attack. Usually, inbuilt moisture is a product of the following processes:
• bad design of a building construction • unsuitable storing of building materials on a building site • mistreatment with building materials, negligence, inappropriate
installation on a building site • condensation process • other factors ( unpredictable phenomena - e.g. sudden climate
changes during a construction process) Some of these factors can be reduced by better planning and thorough monitoring, nevertheless, some factors we can not completely avoid. Water stored in mineral wool, as inbuilt moisture or as a product of condensation, starts slow degradation and significantly decrease insulating properties of a building material. More detailed studies of water transport and travel of condensate throughout the insulation layer can help to answer what kind of damage mineral wool undergoes and how to avoid or diminish this adverse effect.
1

Studies of moisture transport and absorbent properties of mineral-wool insulants are not as frequent as scientific papers concerning thermal properties. Available data are restricted to basic properties of an insulating material that can be found in catalogue lists of producers. They usually inform about resistance factor μ, which is very similar for all mineral-wool products. However, to acquire more information is not easy and this field looks unexplored. Observing real cases of inbuilt moisture in mineral wool on building sites seemed to be a good starting place for planning and aiming the scope of this thesis. The presented work was concentrated on analyzing practical problems of using mineral wool, and consequently, on finding and designing a suitable laboratory set-up, put it into use to gather experimental data and then analyze this data, attempting to settle the unclarities, as it is described above.
1.2. Aim and Limitations
The primary aim of this study was to describe case studies and indicate problems with inbuilt moisture that was stored in stone wool during its installation on a building site. The secondary aim was to analyze material properties of chosen stone-wool specimens loaded by moisture flux and frost formation in varying outdoor conditions using a laboratory set-up. This experimental set-up was designed with reference to moisture transport properties of thermal insulation materials exposed to both a temperature gradient and transport of moisture. Knowledge of real material properties is desired for further studies of freezing condensate and its trace throughout a stone-wool insulant. Material specimens analyzed in this thesis are fibrous insulants based on stone-wool structure with different densities and specific sphere of use. This choice was primarily based on a varying content of binding agents that are prone to moisture attack and also for widespread of a material on the European (or world) market. The introduced materials are used especially for flat-roof constructions, pitched roofs and walls. All these constructions are at high risk of condensation, if not designed and treated properly. All the experiments in the laboratory were performed under similar climatic conditions; the same indoor temperature and moisture gradient were applied, outdoor temperature was varying for given tests.
2
1.3. Outline of the Thesis
This licentiate thesis consists of a resumptive text and four appended papers. The summarizing text divides into three main parts. The first part contains a brief introduction (chapter 1) and a general overview of insulating standards in EU, description of stone wool and relationship between stone wool and moisture transport in porous materials (chapters 2, 3, 4 and 5). The following part (chapters 6, 7) describes problem cases of stone wool from practice and then designing a specific laboratory set-up for testing material properties of stone-wool specimens under defined outdoor and indoor conditions. Chapter 8 concludes the studies and proposes future research.
3

2. Need For Insulation
Almost all energy, that mankind need for desirable living comfort, comes from coal-, lignite coke-, gas- and furnace oil combustion. However, consumption of fossil fuel is associated with extensive air pollution, which is endangering human health and, in some regions, destroying the green life at all. Trying to find a way from this vicious circle simultaneously results in rising prices of fuels and energetic industry as a whole. Of course, there is a possibility how to save a part of the spent energy, as well as, prevent our nature from exhaust emission and, last but not least, to save our health and finances. One of the most effective economy measures is an improved thermal-technical characteristic of building constructions. Energy delivered for heating runs out to the surrounding environment with a lower air temperature and must be continually supplied. This heat leakage can be effectively slowed down by additional thermal insulation of all building envelopes. In this way, we can markedly decrease our heat consumption and costs. Computer calculations can clearly show how much we save with each added centimeter of the insulating layer.
(Source: Rockwool CZ a.s.)
2.1. Insulation Standards and Energetic Perspectives in Europe
Claims on thermal-technical properties of building constructions vary all over Europe. It is caused by different climate conditions of particular regions and required heating period in winter time, which is characterized by number of heating days per year. Countries in Southern Europe, as well as, Western Europe have seaside weather, while the rest of Europe has continental climate with higher fluctuation of temperatures. The following pictures show differences in applied
4
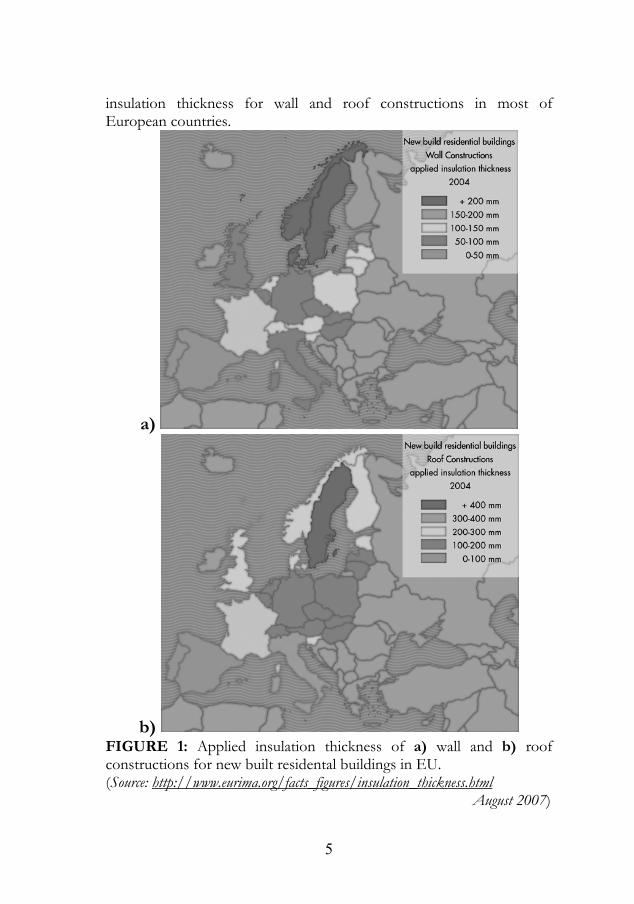
insulation thickness for wall and roof constructions in most of European countries.
a)
b) FIGURE 1: Applied insulation thickness of a) wall and b) roof constructions for new built residental buildings in EU. (Source: http://www.eurima.org/facts_figures/insulation_thickness.html August 2007)
5

a)
b)
FIGURE 2: New built residental buildings a) wall and b) roof constructions applied thermal resistance in insulation 2004. (Source: http://www.eurima.org/facts_figures/insulation_thickness.html August 2007)
6

2.2. Types of Thermal Insulations
There are different criteria how to sort thermal insulations [1]:
a) type of the ground substance - inorganic, - organic,
b) structure - fibrous, - porous (foam), - granulated,
c) binder content - containing binder, - binder-free,
d) shape of product - loose (back fill, wool) - flat (board, mat, felt) e) reaction to fire (Euroclass) - non-combustible (class A1) - limited combustibility (class A2, B) - combustible (class C, D, E, F) According to nature of the material thermal-insulating products can be divided to [2]: a) light silicate substances – light aggregate, light concrete, b) foam inorganic substances – foam glass, c) foam organic substances – foam plastics, d) fibrous substances – glass wool and mineral (stone) wool e) organic substances – cork, timber wool, paper.
Every single type of the listed thermal insulations has its advantages and disadvantages – e.g. insulating qualities, durability, material and dimensional stability, resistance to fire, impact on the environment and human health. Choice of the right insulating material should always take into account sort of the building construction and conditions in which it will serve. Due to its wide-spread and complex features, our research is focused just on mineral wool manufactured out of molten rocks. The following chapter throws light upon closer description and definition of manufacturing process and material properties of stone-wool insulants.
7

3. Mineral Wool
In the building industry we use the term ‘mineral wool’ for inorganic fibres produced especially for thermal insulating purpose and keeping a stable temperature and acoustic properties of building constructions during the year. It is made from molten glass, stone or slag that is spun into a fiber-like structure. We recognize two basic types of fibrous mineral insulation, which are widely used in building sector [3]:
Stone wool is made from volcanic rock, typically basalt or
dolomite; the remaining proportion is recycled material in the form of briquettes.
Glass wool is made from sand or recycled glass, limestone and soda ash; the same ingredients as for familiar glass objects such as window panes or glass bottles. In addition, glass fiber has boron added to improve its moisture tolerance. To facilitate the understanding of mineral insulation based on stone wool, a brief introduction to manufacturing process and description of basic physical properties is enclosed. Further information can be attained from several sources, among them Eurima (European Insulation Manufacturers Association) or domestic producers. 3.1. Manufacturing process
“Mineral wool insulation prevents heat loss through roofs, walls, floors, pipes and boilers, reduces noise pollution and protects homes and industrial facilities from the risk of fire.” [3] Mineral wool is utilized to:
• Save energy • Be environmental friendly • Absorb sound energy and eliminate noise • Contribute to fire insulation • Keep dimensional stability in time • Be permeable for water vapour
8

While this licentiate thesis is focused just on mineral wool based on stone wool, a closer description of manufacturing glass wool is not included. First production of stone wool is dated to the beginning of 20th century [3]. It is a highly sophisticated process inspired by nature. Some volcanos eruct lava of a special constitution and viscosity, so wind can scatter cooling magma to thin fibres and so a natural insulant can be created. This process has been known for instance already to American Indians, but its massive use was spread later. Thanks to modern technique and technologies this procedure was upgraded. The most typical molten rock is basalt or dolomite. The remaining component is represented by recycled material in the form of briquettes (see FIGURE 3.). Slag wool is made from blast furnace slag (waste).
FIGURE 3: Samples of source stones for production of stone wool: Dolomite, Basalt and Briquette. The manufacturing process can be divided into eight main stages, which can slightly differ in details for different producers of stone wool [3].
9
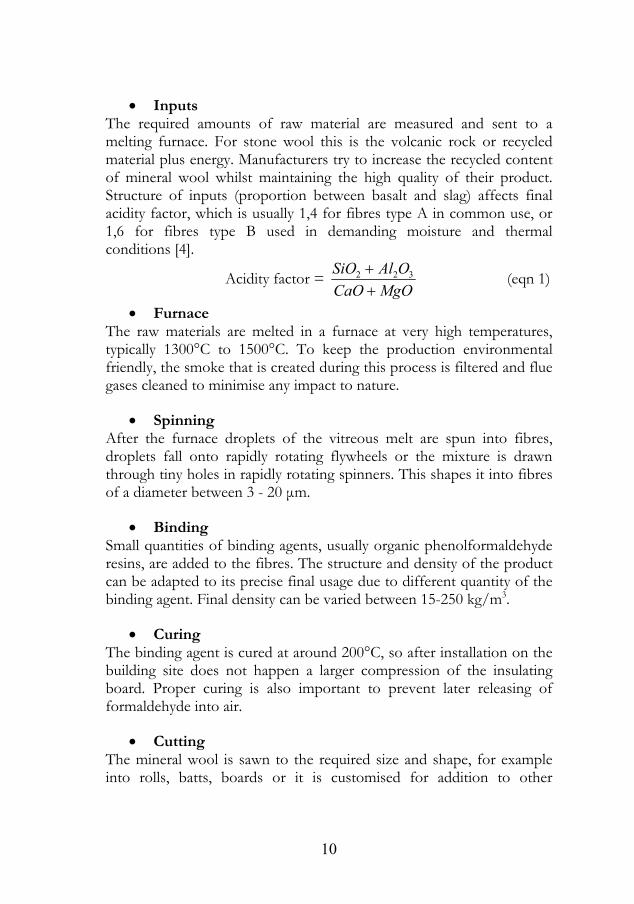
• Inputs The required amounts of raw material are measured and sent to a melting furnace. For stone wool this is the volcanic rock or recycled material plus energy. Manufacturers try to increase the recycled content of mineral wool whilst maintaining the high quality of their product. Structure of inputs (proportion between basalt and slag) affects final acidity factor, which is usually 1,4 for fibres type A in common use, or 1,6 for fibres type B used in demanding moisture and thermal conditions [4].
Acidity factor = MgOCaO
OAlSiO++ 322 (eqn 1)
• Furnace The raw materials are melted in a furnace at very high temperatures, typically 1300°C to 1500°C. To keep the production environmental friendly, the smoke that is created during this process is filtered and flue gases cleaned to minimise any impact to nature.
• Spinning After the furnace droplets of the vitreous melt are spun into fibres, droplets fall onto rapidly rotating flywheels or the mixture is drawn through tiny holes in rapidly rotating spinners. This shapes it into fibres of a diameter between 3 - 20 μm.
• Binding Small quantities of binding agents, usually organic phenolformaldehyde resins, are added to the fibres. The structure and density of the product can be adapted to its precise final usage due to different quantity of the binding agent. Final density can be varied between 15-250 kg/m3.
• Curing The binding agent is cured at around 200°C, so after installation on the building site does not happen a larger compression of the insulating board. Proper curing is also important to prevent later releasing of formaldehyde into air.
• Cutting The mineral wool is sawn to the required size and shape, for example into rolls, batts, boards or it is customised for addition to other
10

products. Off-cuts and other mineral wool scraps are recycled back into the production process.
• Packaging Due to its impressive elasticity, mineral wool with lower content of the binder (lower density) can be compressed to reduce its volume during packaging, making it cheaper and easier to transport and handle.
• Gases and waste Waste such as off-cuts are recycled into the production process reducing inputs and energy requirements and make the production even more effective. Gases from the production processes are cleaned in filters and after-burners to minimise impact on the environment.
FIGURE 4: A production process of stone-wool insulant. (Source: http://www.eurima.org/mineral_wool/production_process.html August 2007)
11
3.2. Physical Properties of Mineral Wool
Mineral wool combines several interesting attributes in one material. They derive from the structure and wooly consistency. The European Standard EN 13162 specifies the requirements for factory made mineral wool products with or without facings, which are used for the thermal insulation of buildings. The products are manufactured in the form of rolls, batts boards and slabs [1].
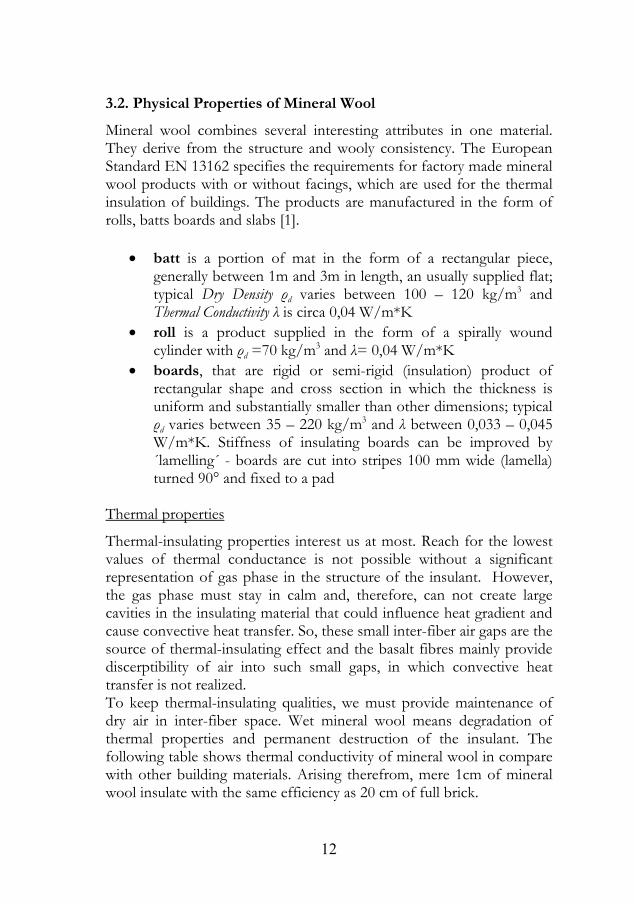
• batt is a portion of mat in the form of a rectangular piece, generally between 1m and 3m in length, an usually supplied flat; typical Dry Density ρd varies between 100 – 120 kg/m3 and Thermal Conductivity λ is circa 0,04 W/m*K
• roll is a product supplied in the form of a spirally wound cylinder with ρd =70 kg/m3 and λ= 0,04 W/m*K
• boards, that are rigid or semi-rigid (insulation) product of rectangular shape and cross section in which the thickness is uniform and substantially smaller than other dimensions; typical ρd varies between 35 – 220 kg/m3 and λ between 0,033 – 0,045 W/m*K. Stiffness of insulating boards can be improved by ´lamelling´ - boards are cut into stripes 100 mm wide (lamella) turned 90° and fixed to a pad
Thermal properties
Thermal-insulating properties interest us at most. Reach for the lowest values of thermal conductance is not possible without a significant representation of gas phase in the structure of the insulant. However, the gas phase must stay in calm and, therefore, can not create large cavities in the insulating material that could influence heat gradient and cause convective heat transfer. So, these small inter-fiber air gaps are the source of thermal-insulating effect and the basalt fibres mainly provide discerptibility of air into such small gaps, in which convective heat transfer is not realized. To keep thermal-insulating qualities, we must provide maintenance of dry air in inter-fiber space. Wet mineral wool means degradation of thermal properties and permanent destruction of the insulant. The following table shows thermal conductivity of mineral wool in compare with other building materials. Arising therefrom, mere 1cm of mineral wool insulate with the same efficiency as 20 cm of full brick.
12

Comparison of thermal conductivities of selected building materials
λ [W/mK] Material thicknesses with same thermal resistances R as 1cm of mineral wool
Reinforced concrete 1,4 35 cm
Full brick 0,8 20 cm
Air brick 0,35 8,75 cm
Wood 0,15 3,75 cm
Mineral wool 0,04 1 cm TABLE 1: Thermal conductivities of selected dry building materials and necessary material thicknesses to reach same thermal resistances R [5]. Acoustic properties
Mineral wool absorbs sound energy and reduces noise pollution. Special acoustic measurements specify best acoustic properties for mineral wool with density between 50-70 kg/m3.
Water vapour permeability
Mineral wool assures high permeability for water vapour due to high quantity of air gaps in the material. It is expressed by Moisture Resistance Factor μ (also known as Water Vapour Diffusion Resistance Factor). This value, together with material thickness, determines Equivalent Diffusive Thickness sd – resistance of a material against diffusion of water vapour as against diffusion through a layer of dry air 1m thick.
sd = μ*d [m] (eqn 2)
Material (100 mm) μ [-] sd [m]
Mineral wool 1-3 0,1-0,3
Masonry from full bricks 8,5-9 0,85-0,9
Polystyrene 40-100 4-10
Polyurethane 180-200 18-20 TABLE 2: Comparison of sd for selected building materials [5].
13
Hydrophobic properties
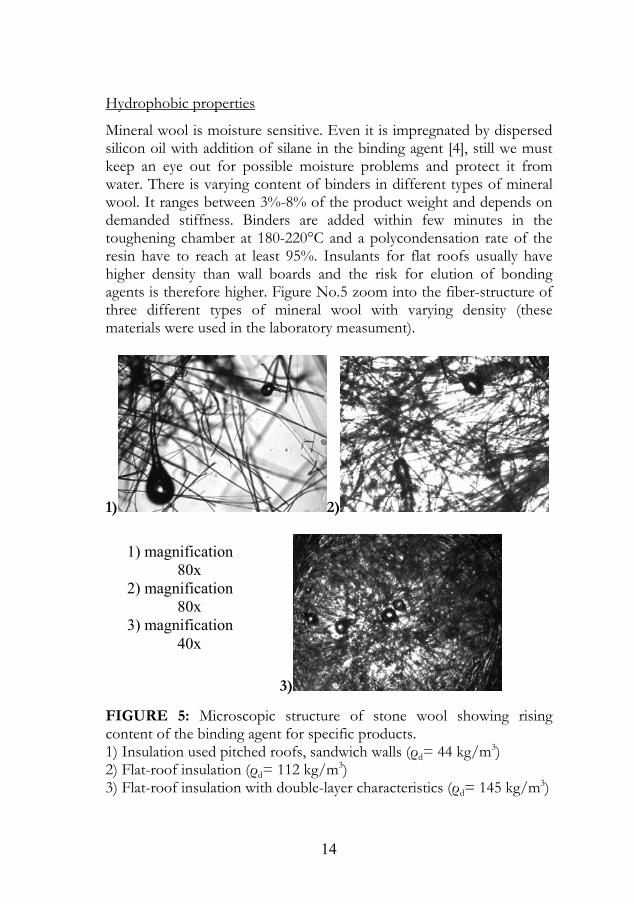
Mineral wool is moisture sensitive. Even it is impregnated by dispersed silicon oil with addition of silane in the binding agent [4], still we must keep an eye out for possible moisture problems and protect it from water. There is varying content of binders in different types of mineral wool. It ranges between 3%-8% of the product weight and depends on demanded stiffness. Binders are added within few minutes in the toughening chamber at 180-220°C and a polycondensation rate of the resin have to reach at least 95%. Insulants for flat roofs usually have higher density than wall boards and the risk for elution of bonding agents is therefore higher. Figure No.5 zoom into the fiber-structure of three different types of mineral wool with varying density (these materials were used in the laboratory measument).
1) 2)
3)
1) magnification 80x
2) magnification 80x
3) magnification 40x
FIGURE 5: Microscopic structure of stone wool showing rising content of the binding agent for specific products. 1) Insulation used pitched roofs, sandwich walls (ρd= 44 kg/m3) 2) Flat-roof insulation (ρd= 112 kg/m3) 3) Flat-roof insulation with double-layer characteristics (ρd= 145 kg/m3)
14
Fire protection
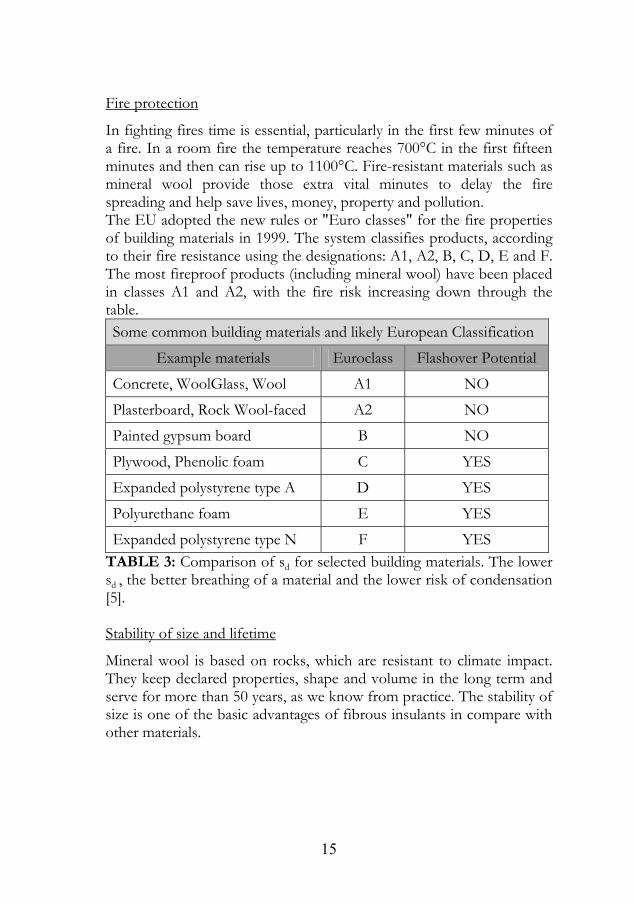
In fighting fires time is essential, particularly in the first few minutes of a fire. In a room fire the temperature reaches 700°C in the first fifteen minutes and then can rise up to 1100°C. Fire-resistant materials such as mineral wool provide those extra vital minutes to delay the fire spreading and help save lives, money, property and pollution. The EU adopted the new rules or "Euro classes" for the fire properties of building materials in 1999. The system classifies products, according to their fire resistance using the designations: A1, A2, B, C, D, E and F. The most fireproof products (including mineral wool) have been placed in classes A1 and A2, with the fire risk increasing down through the table. Some common building materials and likely European Classification
Example materials Euroclass Flashover Potential
Concrete, WoolGlass, Wool A1 NO
Plasterboard, Rock Wool-faced A2 NO
Painted gypsum board B NO
Plywood, Phenolic foam C YES
Expanded polystyrene type A D YES
Polyurethane foam E YES
Expanded polystyrene type N F YES TABLE 3: Comparison of sd for selected building materials. The lower sd , the better breathing of a material and the lower risk of condensation [5]. Stability of size and lifetime
Mineral wool is based on rocks, which are resistant to climate impact. They keep declared properties, shape and volume in the long term and serve for more than 50 years, as we know from practice. The stability of size is one of the basic advantages of fibrous insulants in compare with other materials.
15

Thanks to listed number of impressive material properties, mineral wool is used in a wide range of applications. All we always have to keep in mind is to protect it from moisture. 4. Application of Mineral Wool in Practice
Insulation wools have been widely used for more than 60 years, in thermal and acoustic insulation and fire protection. Their most important applications are as insulation for buildings and industrial constructions.
Applications for buildings [3]:
• loft insulation and pitched-roof constructions
• ventilated and contact facades
• wall constructions
• inner wall insulation
• flat roof insulation
• the insulation of heating systems
• hot and cold water services
Industrial applications include:
• large diameter pipe insulation
• insulation of tanks and vessels
• insulation for boilers and turbines
16

FIGURE 6: Sudden climate changes can cause unexpected troubles on the building site. Pictures show finishing of a flat roof in Russia. Falling snow will stay as inbuilt moisture in mineral wool and start its degradation in time. (Source: M. Matějček and his personal archive, November 2006)
17

4.1. General Characteristics of Used Stone-Wool Specimens
Material specimens analyzed in this work are fibrous insulants based on stone-wool. The material specimens are commercial products taken from the portfolio of a major producer of thermal insulation materials. Materials with different densities and specific sphere of use were chosen. Specimens were cut to blocks with following dimensions - 300mm (length) x 300mm (width) x 100mm (thickness). Samples were dried and weighed prior to measurements and their dry densities ρd were calculated.
FIGURE 7: Cross section of a stone-wool roof board with integrated double-layer characteristics [5].
The heaviest material sample – SPECIMEN A is primarily used for flat-roof constructions. It is a stiff heavy board of stone wool with integrated double-layer characteristics, which is bonded by organic resin and fully hydrofobised throughout its capacity. The upper highly stiff layer is up to 20 mm thick and provides sturdiness against mechanical stress; ρd = 145 kg/m3 (material with the highest content of binders used in the measurement).
The second fibrous material – SPECIMEN B is a rigid stone-wool
board, fully hydrofobised, especially used for flat roofs; ρd = 112 kg/m3.
The lightest insulant in the laboratory measurement – SPECIMEN C is a semisoft batt, fully hydrofobised, used for insulating pitched roofs, ventilated facades and sandwich walls; ρd = 44 kg/m3 (material with the lowest content of binders used in the measurement). Detailed description of our in-situ measurement, as well as, designing the laboratory test set-up can be found in subsequent chapters.
18

Basic technical parameters of used material samples are summarized in the Table No.4 below.
Specimen Declared thermal conductivity λD [Wm-1K-1]
Moisture resistance
factor μ [-]
Dry density ρd [kgm-3]
A 0,040 2,95 145 B 0,039 2,15 112 C 0,035 3,55 44
TABLE 4: Basic technical parameters of the used material specimens based on stone-wool structure. 5. Moisture
Water can exist in three stages: solid (ice), liquid (water) and gas (vapour). In the environmental conditions that building constructions are of service, all these three stages of moisture can occur. All these three stages can be dangerous for building materials, if building techniques are not adhered thoroughly and water has chance to enter into building constructions [6]. Moisture in buildings has its origin in the following sources:
• Indoor and outdoor humidity • Precipitation • Ground dampness • Construction damp • Water leakage
Indoor humidity is generated by everyday activities like cooking, bathing, washing and drying clothes, as well as, breathing [6]. Precipitation is represented by rain-, snow- and hail showers. They differ. In combination with wind, rain showers can get horizontal direction and hit vertical surface. We know it as driven rain. Water can also be found in the ground in both vapour and liquid phase.
19

Construction damp often depends on storing conditions and actual weather situation on a building site. Water leakages can come from different sources and result in severe moisture problems; they are dealt with in later chapters. 5.1. Moisture Transport in Porous Material [6]
Moisture transport in porous materials can be realized by:
• Diffusion • Capillary suction • Combined diffusion and capillary suction
Our test set-up calculates with diffusion transport in the sample of stone wool. Diffusion
Figure 8. shows a layer of a porous material (e.g. stone wool). The width of the material is d (m). The humidity by volume v is kept at v1 at one side of the layer and at v2 on the other side. The steady-state diffusive flux g becomes:
FIGURE 8: Diffusion of water vapour flux through a porous material.
d
vvg v21* −
= δ [kg/(m2s)] (eqn 3)
Here δv is the vapour permeability of the material.
Diffusive flux multiplied by area creates moisture flow rate G:
G = A*g [kg/s] (eqn 4) The rate of diffusion can be compared with the one obtained in stagnant air. Introducing the ratio between D and δv gives:
20

v
Dδ
μ = [-] (eqn 5)
Empirically, D varies with temperature as [7]:
D=(22,2+0,14*θ)*10-6 [m2/s] (eqn 6)
Here θ is a temperature in degrees centigrade.
Vapour resistance, Z, is declared for faced or non-homogenous products [1]. For the water vapour resistance of a layer we have:
v
dZδ
= [s/m] (eqn 7)
Moisture in air Air consists of many gases, each contributing with its partial pressure to the total air pressure. For water vapour we denote the partial pressure by pv (Pa).The General Gas Law gives the relation between the vapour content and the partial pressure:
pv=461,4*(T+273,15)*v [Pa] (eqn 8)
Here, the temperature, T, is given in degrees Celsius. The water content of air, or the humidity by volume, is denoted by v. Due to liquid-gas equlibrium for water, there is a maximum possible water vapour content in the air. It will be denoted by vs. This humidity by volume at saturation is a function of temperature [6]:
)15,273(*4,461
)100
(*
+
+=
T
Tbav
n
s [kg/m3] (eqn 9)
0 ≤ T ≤ 30 a = 288,68 Pa b = 1,098 n = 8,02 -20 ≤ T ≤ 0 a = 4,689 Pa b = 1,486 n = 12,3
A relative humidity Φ is defined as:
Φ sv
v= [-] or [%] (eqn 10)
21

6. Methodology of Research
There will be moisture in building constructions from time to time, although we try to avoid it. What kind of damage will occur and what is a time scale for critical expansion of damages? This is the starting point of our research – to make data available and to find the right way of solving problems with in-built moisture in the most economical way. 6.1. In-situ Measurement Campaign
Practically all defects of roof or wall constructions can occur as a result of one dominant reason or concurrence of several factors. Determination of the primary cause is often very difficult. Typical water in-leak into a roof construction is a damage of the roofing membrane and its untightness in joints and details. Wall constructions offen struggle with thermal bridges. From the view of building physics, defects have their origin in the period of design or pursuance of a construction. In the lifetime of a building structure, these defects stem from dramatic outdoor climate changes or inner conditions. The following case studies demonstrate how one reconstructed and one newly built construction were at risk from moisture attack. 6.1.1. Case Study No.1 Administrative building of Česká Pojišťovna Co., Prague, Czech Republic
Flat roofs of a reconstructed administrative building in Prague
were exposed to rain precipitation, snow and other climate effects for several months from November 2002 to April 2003 without having completed a layer of water proofing membrane on the top due to a delay in the building process. During that winter, the top layer on the exterior side was 5 cm thick cement screed. The complete (planned) roof structure is described in Figure 9. The membrane Sarnafil S 327-15 and the underlining textile Arabeva were still not installed. This meant that the roof had no water protection. Water passed through the layer of cement screed and fall concrete and was stored in the layer of mineral wool. Additional passage of water was stopped by the vapour barrier. The aim of this case study was to investigate water content in the roof construction and to calculate a time period needed to let the roof construction dry up, as well as, to propose possible renovation processes.
22
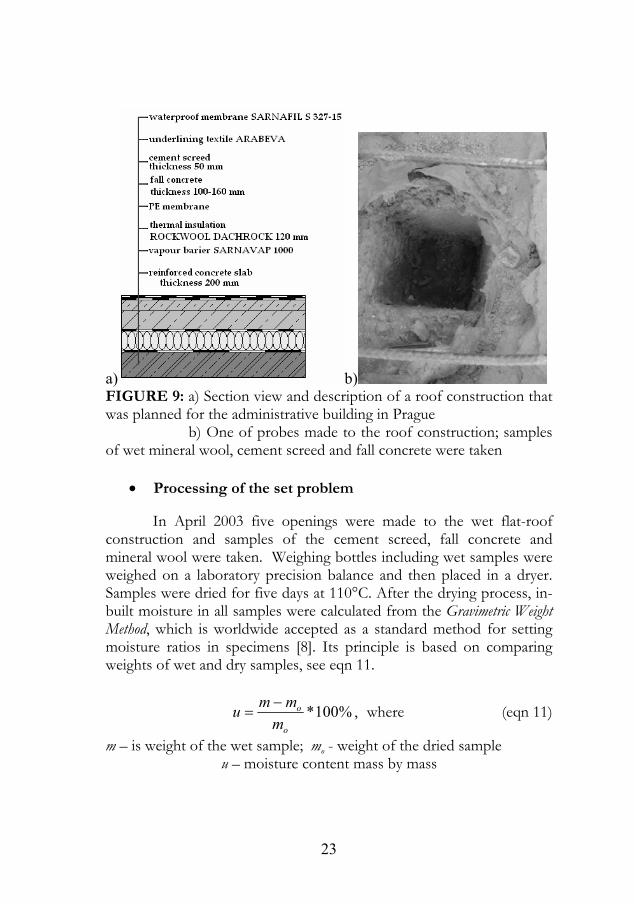
a) b) FIGURE 9: a) Section view and description of a roof construction that was planned for the administrative building in Prague
b) One of probes made to the roof construction; samples of wet mineral wool, cement screed and fall concrete were taken
• Processing of the set problem
In April 2003 five openings were made to the wet flat-roof construction and samples of the cement screed, fall concrete and mineral wool were taken. Weighing bottles including wet samples were weighed on a laboratory precision balance and then placed in a dryer. Samples were dried for five days at 110°C. After the drying process, in-built moisture in all samples were calculated from the Gravimetric Weight Method, which is worldwide accepted as a standard method for setting moisture ratios in specimens [8]. Its principle is based on comparing weights of wet and dry samples, see eqn 11.
%100*o
o
mmmu −
= , where (eqn 11)
m – is weight of the wet sample; mo - weight of the dried sample u – moisture content mass by mass
23

Thermal insulation u = 38,11 % Fall concrete + cement screed u = 5,16 %
TABLE 5: Measured moisture content mass by mass “u” in the material sample with the highest content of inbuilt moisture.
The numbers of the mass moisture ratio are extremely high, especially, in the layer of the mineral wool. The requirement in the Czech Technical Standards says that the level of built-in moisture ought to be u ≤ 8%; u coefficients were recalculated (concerning thickness of the relevant material layer) to dampness of the material in kg/m2 and then used as a data input in a thermal-technical calculation. The Computing software used for calculation of condensation was Teplo 2004. It was developed by Dr. Ing. Zbyněk Svoboda at the Faculty of Civil Engineering of the Czech Technical University in Prague. This program calculates U values and balances of condensed and evaporated water in multi-layer building constructions in time. The calculation is based on the Czech localization of the EU standards EN ISO 13788, EN ISO 6946. Software is applicable for wall-, roof- constructions and cellars. The software also allows setting up redistribution of inbuilt moisture in a construction. Contractors decided to finish planned roof construction without solving the problem of inbuilt moisture. The layers of cement screed and fall concrete were dried a bit by the spring sun, but the layer of mineral wool was soaked in water and there were visible drops of water on the vapour membrane below mineral wool. Completing water membrane on the top closes the roof structure and rapidly slows down the drying process. The computer simulation follows contractors´ decision and calculates with the finished roof construction. Accumulated moisture was implemented in the calculation and its redistribution was set in the input data. Particular results of the simulation can be seen in Figure No.10 below. The computer calculation confirmed that this solution means slowed drying process and permanent presence of moisture in the roof construction during its lifetime - accumulated moisture stays in the construction for more than 100 years. Unfortunatelly, contractors did not change their decision. Beside the loss of thermal-technical properties, investors never get the roof construction they payed. On the
24
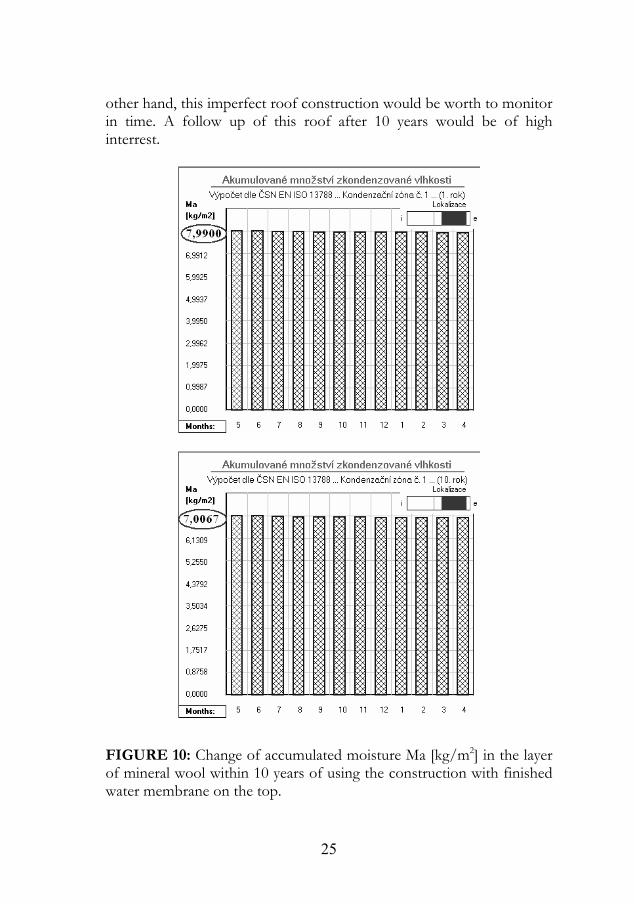
other hand, this imperfect roof construction would be worth to monitor in time. A follow up of this roof after 10 years would be of high interrest.
FIGURE 10: Change of accumulated moisture Ma [kg/m2] in the layer of mineral wool within 10 years of using the construction with finished water membrane on the top.
25

The drying process of accumulated moisture within 100 years
0
2
4
6
8
10
12
0 10 20 30 40 50 60 70 75 80 90 100
Years
Acc
umul
ated
moi
stur
eM
a[kg
/m2]
Fall concrete Mineral wool Cement screed
FIGURE 11: Simulation of the drying process in time in the layers of mineral wool, cement screed and fall concrete. From measurements and calculations can be deduced these conclusions: A possible solution to save the roof can be removal of the cement screed and the fall concrete and in desiccation of mineral wool in order to reuse it in the future. This solution needs good natural drying conditions and a temporary roof protection against rain precipitation. Another solution could be to blow a stream of hot air into unfinished wet roof construction to dry up accumulated moisture from the affected layers. This would mean making several openings to the roof structure and measure moisture content in outlet air. To respect contractors´ decision about finishing the layer water membrane, additional erection of an extract system would be necessary. Taking into account the amount of accumulated moisture, the extract system would have to consist of many ventilating chimneys, which would mean high costs and complicated building details. Finishing the roof construction and leaving the problem with inbuilt moisture unsolved means risk for future damage and costs of the discussed flat roof. Mineral wool is left permanent wet. That opens question what happens with implemented organic binders and material qualities of mineral wool as a whole.
26

6.1.2. Case Study No.2 Apartment house BRF MAJGLÄNTAN, Solna, Sweden The envelope of a new apartment house in Solna was finished in the middle of September 2005. The building was heated by 20°C from the second half of October 2005. In the following period two wet places appeared inside on window lintels. Both these wet places were situated in the northern facade of the building and were visible just inside. Joints around window at one wet place were not finished yet. The second wet place was covered from outside by an advertising poster. A point of this review was to estimate a time period, in which these wet spots dry up and will not cause any additional inconvenience. Walls are constructed from prefabricated sandwich elements. They consist of two reinforced-concrete panels (thicknesses 150mm and 75mm) and a board of mineral wool (thickness 150mm) between them. Density of reinforced concrete used for the calculation equals to 2300 Kg/m3 and thermal conductivity equals to 1,43 W/m*K. Density of mineral wool panel Roxull Hardock is 65 Kg/m3 and thermal conductivity equals to 0,035 W/m*K.
FIGURE 12: A wall sandwich element compact of concrete and mineral wool panel. (Source: Strängbetong)
27
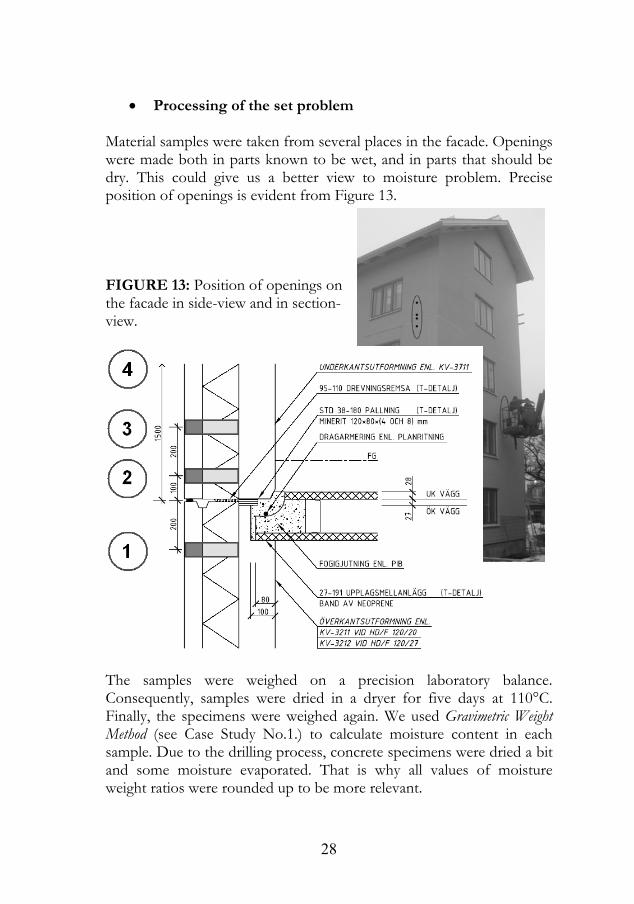
• Processing of the set problem Material samples were taken from several places in the facade. Openings were made both in parts known to be wet, and in parts that should be dry. This could give us a better view to moisture problem. Precise position of openings is evident from Figure 13.
FIGURE 13: Position of openings on the facade in side-view and in section- view.
The samples were weighed on a precision laboratory balance. Consequently, samples were dried in a dryer for five days at 110°C. Finally, the specimens were weighed again. We used Gravimetric Weight Method (see Case Study No.1.) to calculate moisture content in each sample. Due to the drilling process, concrete specimens were dried a bit and some moisture evaporated. That is why all values of moisture weight ratios were rounded up to be more relevant.
28
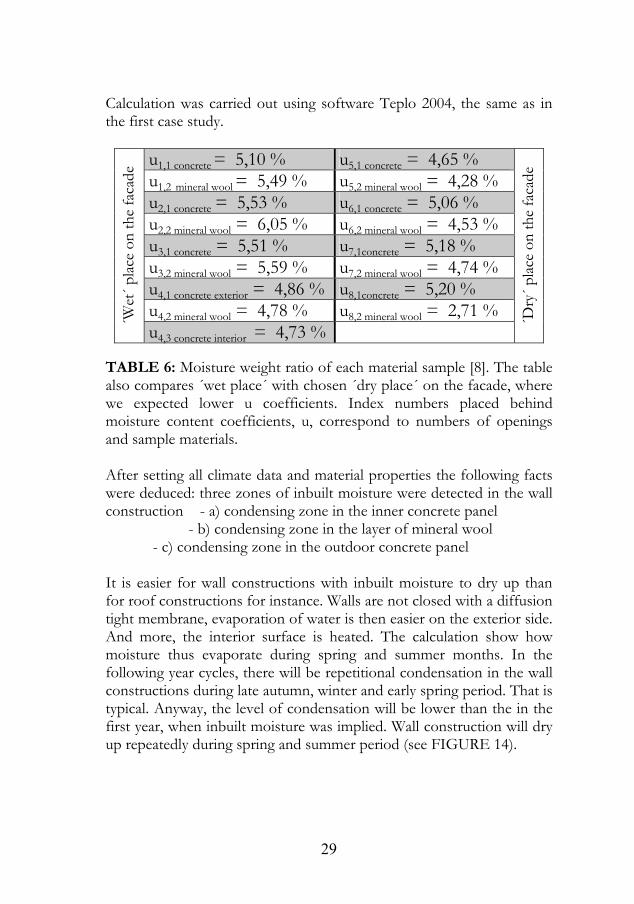
Calculation was carried out using software Teplo 2004, the same as in the first case study.
u1,1 concrete = 5,10 % u5,1 concrete = 4,65 % u1,2 mineral wool = 5,49 % u5,2 mineral wool = 4,28 % u2,1 concrete = 5,53 % u6,1 concrete = 5,06 % u2,2 mineral wool = 6,05 % u6,2 mineral wool = 4,53 % u3,1 concrete = 5,51 % u7,1concrete = 5,18 % u3,2 mineral wool = 5,59 % u7,2 mineral wool = 4,74 % u4,1 concrete exterior = 4,86 % u8,1concrete = 5,20 % u4,2 mineral wool = 4,78 % u8,2 mineral wool = 2,71 % ´W
et´ p
lace
on th
e fa
cade
u4,3 concrete interior = 4,73 %
´Dry
´ plac
e on
the
faca
de
TABLE 6: Moisture weight ratio of each material sample [8]. The table also compares ´wet place´ with chosen ´dry place´ on the facade, where we expected lower u coefficients. Index numbers placed behind moisture content coefficients, u, correspond to numbers of openings and sample materials. After setting all climate data and material properties the following facts were deduced: three zones of inbuilt moisture were detected in the wall construction - a) condensing zone in the inner concrete panel
- b) condensing zone in the layer of mineral wool - c) condensing zone in the outdoor concrete panel It is easier for wall constructions with inbuilt moisture to dry up than for roof constructions for instance. Walls are not closed with a diffusion tight membrane, evaporation of water is then easier on the exterior side. And more, the interior surface is heated. The calculation show how moisture thus evaporate during spring and summer months. In the following year cycles, there will be repetitional condensation in the wall constructions during late autumn, winter and early spring period. That is typical. Anyway, the level of condensation will be lower than the in the first year, when inbuilt moisture was implied. Wall construction will dry up repeatedly during spring and summer period (see FIGURE 14).
29

A)
B) FIGURE 14: A) Accumulated amount of condensed moisture (up) and B) actual rate of condensation and evaporation of water vapour in the condensing zone month by month in the second year cycle.
30

To sum up the most important facts about this report:
As the results of the simulator calculation show, the wall construction with inbuilt moisture should dry up in the following year cycle. There was not found an extreme amount of inbuilt moisture in the specimens, which were taken from the openings made on the ´wet´ place on the facade. Their moisture weight ratios are comparable with those, taken from the ´dry´ place on the facade. Wettest samples in the applied openings were found in the opening situated 100 mm above the horizontal joint between facade sandwich panels. It seems there are some local problems with moisture on the facade and not a general one. This could be caused by several reasons. For instance - joints between sandwich panels were not closed properly. Also joints around some windows were not finished at the time of taking specimens on the building site; they were unprotected for days. This also allowed driven rain to get deeper to the wall construction. Another reason for the higher level of inbuilt moisture in some sandwich panels could be their inadequate storing. And more, even though the building was heated from October, condensation could occur.
31
6.2. Laboratory Measurement
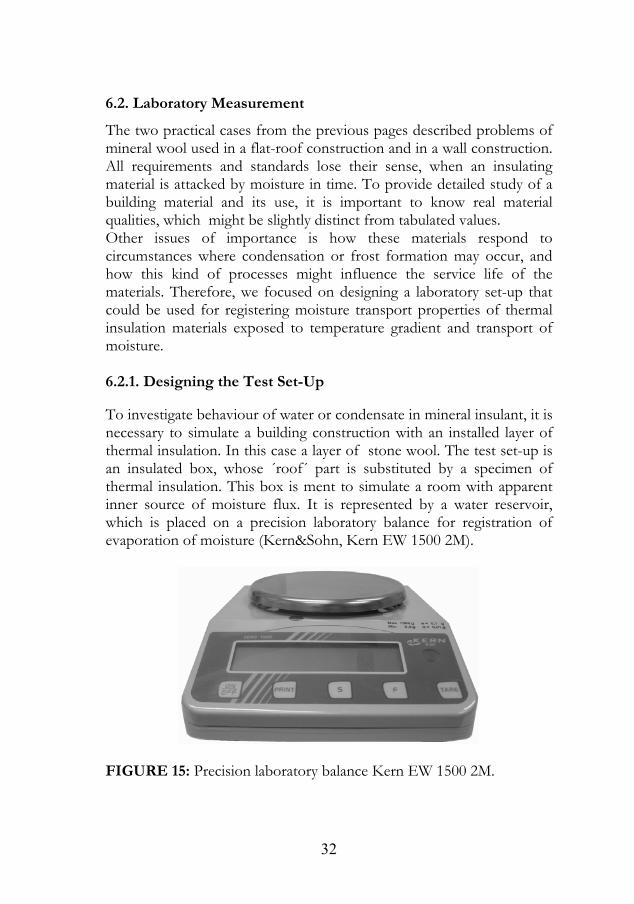
The two practical cases from the previous pages described problems of mineral wool used in a flat-roof construction and in a wall construction. All requirements and standards lose their sense, when an insulating material is attacked by moisture in time. To provide detailed study of a building material and its use, it is important to know real material qualities, which might be slightly distinct from tabulated values. Other issues of importance is how these materials respond to circumstances where condensation or frost formation may occur, and how this kind of processes might influence the service life of the materials. Therefore, we focused on designing a laboratory set-up that could be used for registering moisture transport properties of thermal insulation materials exposed to temperature gradient and transport of moisture. 6.2.1. Designing the Test Set-Up To investigate behaviour of water or condensate in mineral insulant, it is necessary to simulate a building construction with an installed layer of thermal insulation. In this case a layer of stone wool. The test set-up is an insulated box, whose ´roof´ part is substituted by a specimen of thermal insulation. This box is ment to simulate a room with apparent inner source of moisture flux. It is represented by a water reservoir, which is placed on a precision laboratory balance for registration of evaporation of moisture (Kern&Sohn, Kern EW 1500 2M).
FIGURE 15: Precision laboratory balance Kern EW 1500 2M.
32

FIGURE 17: Wettex – a piece of non-woven material based on cellulose with high water retention and water sorption.
FIGURE 16: Graphic model of the testing box placed in the climate chamber with constant conditions RHe [%], Te[°C]. Temperature in the testing box is 20°C and relative humidity is varying due the water reservoir in the testing box. 1. material sample (Rockwool Dachrock Max d= 100 mm), 2. XPS insulation of the box-walls with thickness of 40 mm, 3. aluminium-foil coating, 4. plastic wall of the box, 5. light bulp providing heating of the box, 6. cover of the light bulp to avoid radiation effect on the material sample, 7. ventilation fan providing circulation of air in the testing box, 8. calibrated humidity sensor, 9. temperature sensor, 10. Wettex textile installed to bring water closer to the material sample, 11. water reservoir with circa 400 ml of water, 12. precision laboratory balance registering evaporation of water from the tank, 13. precision laboratory balance registering a change of weight of the entire system
33

For some of the tests a dry sponge cloth (Freudenberg household products) was used. It is a piece of non-woven material based on cellulose with high water retention and water sorption (FIGURE 17). It provided faster transport of moisture to the air in the box. The box is injection moulded of polyethylene, 500 mm high and 300x300 mm in cross section and originaly intended for household applications. Inner volume of the testing box was about 30 litres. The walls were insulated with blocks of extruded polysterene (XPS), 40 mm thick, and wrapped by an aluminium foil to prevent weight increase because of moisture in the ambient. The box is heated by a light bulb (100W), which heating power is regulated with an adjustable transformer. Temperature is measured with ´thermistors´ and the level of moisture is measured by the use of a RH-sensor (Mitec HMP50U-1).
FIGURE 18: Humidity sensor Mitec HMP50U-1, which was settled in the testing set-up, as well as, in the climate chamber. Data from the sensors were collected in time together with outdoor and indoor temperature by datalogger Mitec AT40 (to the right). An axial flow fan (of the size used in a PC) is installed in the box to make air circulating inside the box. Cables to the sensors in the box passes through a hole that is scaled by a rubber plug. The entire box is placed on a precision balance (Kern&Sohn, model Kern EW 6000-1M) in order to record mass changes of the entire system.
34

FIGURE 19: Pictures of the real testing set-up showing inner accessories (upper picture) and surface aluminium coating to protect the testing box from air humidity of the ambient .
35
6.2.2. Measurement above 0°C - Processing
The box was placed in a climate chamber with regulated temperature and relative humidity. A series of tests were done with temperatures in the climate chamber set to +20°C, +15°C, +10°C and +5°C (see FIGURE 20a-b). A dehumidifier kept relative humidity of the chamber around 40%. These conditions were chosen to establish a moisture flow through the sample. Before using the box with a material sample, it was necessary to do a capacity measurement of the testing box to know the time period needed to reach a steady state under specified outdoor and indoor conditions. For this test, the box was covered tightly by a damp-proof membrane at the level of 30 l of the box volume, to prevent any moisture leakage. The water reservoir in the box contained 400 ml of water. In this capacity test the time was measured to reach a steady state of 100% RH at 20°C in the box, which (according to equation 9) means a vapour concentration of 17,3 g/m3 [9]. The test set-up was designed for quadratic material specimens with dimensions 300 x 300 mm and 100 mm thick. A stiff heavy board of stone wool with integrated double-layer characteristics fully hydrofobised throughout its capacity was used for the measurement above 0°C. For more detailed description of the tested specimen (SPECIMEN A) see chapter 4.1. Materials were always dried and weighed prior to testing. Then they were left in the climate chamber for 24 hours to accomodate to specified climate conditions in the climate chamber. Then they were weighed for the second time and wrapped by a non-absorbent tape and a third weighing followed. To avoid any moisture leakage around the material sample the joint between the testing box and the block of stone wool was sealed with non-absorbent flexible elastomeric tube (Armacell LLC, AP Armaflex) and silicon bonding agent. Each measurement in the set outdoor conditions (and unchanging indoor temperature in the testing box) lasted for 5 days. Balances registrated the actual weight every second minute, the same with humidity and temperature sensors installed in the testing box and in the climate chamber. Right after ending the appropriate measurement, the ´deinstalled´ material sample was weighed for the fourth time to measure possible inbuilt moisture. The following figures desribe courses of relative humidities and temperatures during the measurement wih Te above 0°C.
36

FIGURE 20a: Temperature and relative humidity inside the box (T1, RH1) and in the climate chamber (T2,RH2). Detailed courses of temperatures and relative humidities for specified setup conditions:
I. Te ≈ 20°C, RHe ≈ 40%, Ti ≈ 20°C; in this measurement the water reservoir in the testing was equipped with two pieces of wettex textile to bring water closer to the material sample and to provide as high maximum relative humidity as possible. This solution will be also used in the future research.
II. Te ≈ 15°C, RHe ≈ 40%, Ti ≈ 20°C; the wettex textile was not used
37

FIGURE 20b: Temperature and relative humidity inside the box (T1, RH1) and in the climate chamber (T2,RH2). Detailed courses of temperatures and relative humidities for specified setup conditions: III. Te ≈ 10°C, RHe ≈ 40%, Ti ≈ 20°C; the wettex textile was not
used IV. Te ≈ 05°C, RHe ≈ 40%, Ti ≈ 20°C; the wettex textile was not
used
38

Evaporation of water from the interior water reservoir was almost constant with time for all measeruments. This can be seen in the diagrams in FIGURE 21 a – d where data from the outer balance (which records the change of weight of the entire system) are presented. In these diagrams the data are shown together with a best fit straight line) The values during the time needed to reach steady state are excluded from the diagrams.
FIGURE 21a: Graphs showing the straightline downtrend of weight of the entire system registered by the balance under the testing box within the time interval of 100 hours.
I. Te ≈ 20°C, RHe ≈ 40%, Ti ≈ 20°C The collected data were analysed and charted into figures. Moisture flow rate G (kg/s) was calculated from a weight change of the entire system and divided by a chosen time period (100 hours). From this data the diffusive flux g (kg/m2s) and moisture resistance factor μ (-) can be calculated. In the end, the theoretical calculation and results based on the laboratory measurement were compared and interpreted.
39
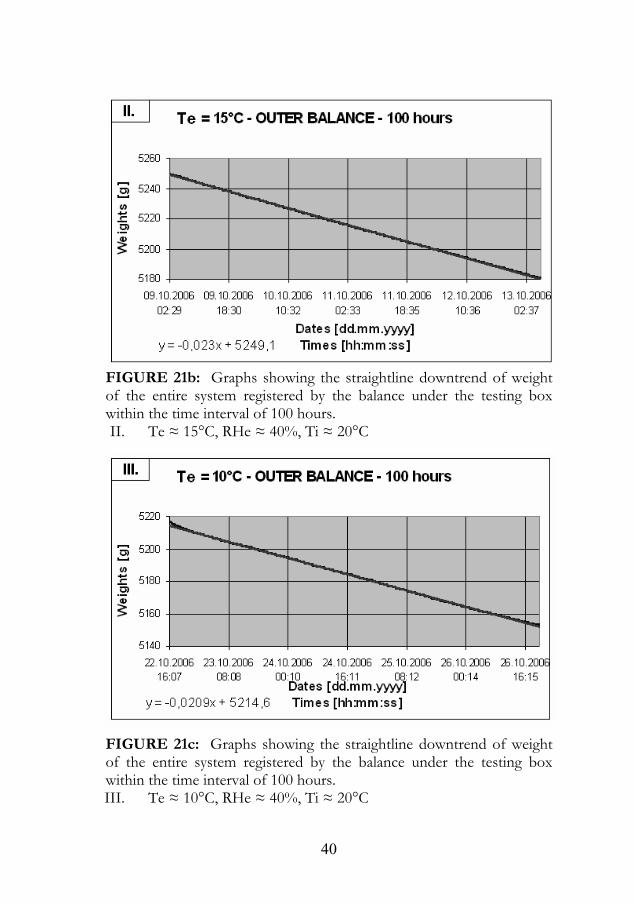
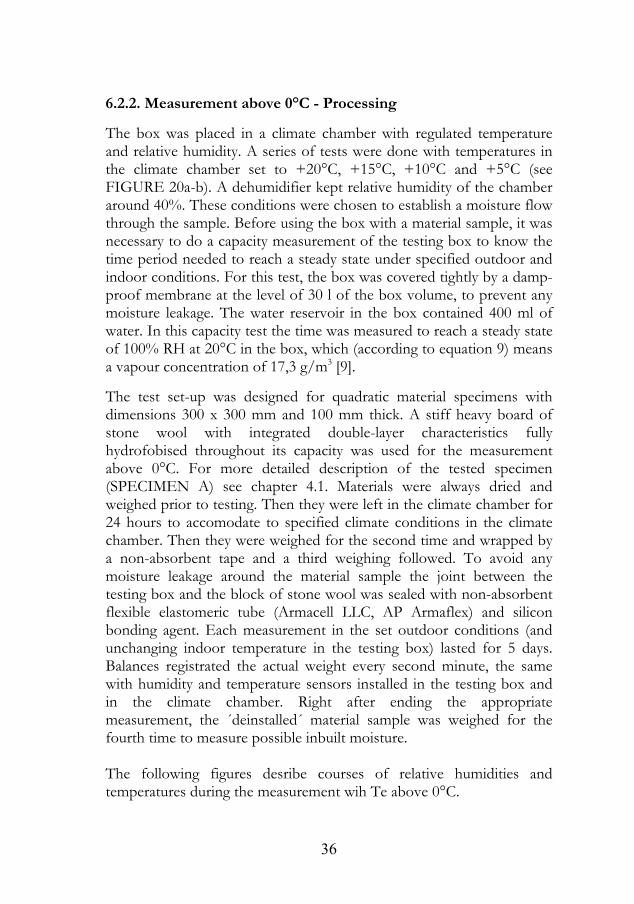
FIGURE 21b: Graphs showing the straightline downtrend of weight of the entire system registered by the balance under the testing box within the time interval of 100 hours. II. Te ≈ 15°C, RHe ≈ 40%, Ti ≈ 20°C
FIGURE 21c: Graphs showing the straightline downtrend of weight of the entire system registered by the balance under the testing box within the time interval of 100 hours. III. Te ≈ 10°C, RHe ≈ 40%, Ti ≈ 20°C
40

FIGURE 21d: Graphs showing the straightline downtrend of weight of the entire system registered by the balance under the testing box within the time interval of 100 hours. IV. Te ≈ 05°C, RHe ≈ 40%, Ti ≈ 20°C
6.2.3. Measurement below 0°C - Processing
The testing mechanism is the same as for the measurement above 0°C. In this case the entire testing set-up (see chapter 6.2.1) was placed in the climate chamber with regulated temperature Te = -20°C. Conditions of the climate chamber were recorded by a couple of temperature and humidity sensors. Thanks to two pieces of Wettex (see FIGURE 17) the inner volume of the box (30 litres) became saturated by water flux within few minutes. After reaching the saturated state, relative humidity in the box (RHi) remained stable. Again, the testing cycle lasted for 100 hours.
Conditions remained unchanging during the measurements and were disturbed just by short freezing intervals of the climate chamber, providing demanded thermal conditions (Te). Prior to testing, the specimens were weighed and mounted with three compound sensors Mitec HMP50U-2 registering temperature and relative humidity at once. These sensors were installed into the material specimens at the top, in
41
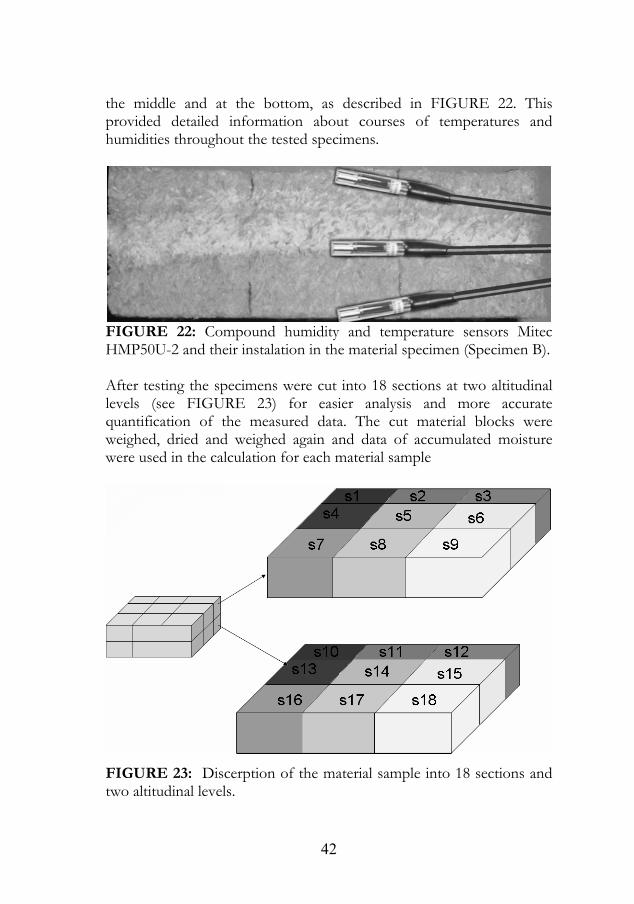
the middle and at the bottom, as described in FIGURE 22. This provided detailed information about courses of temperatures and humidities throughout the tested specimens.
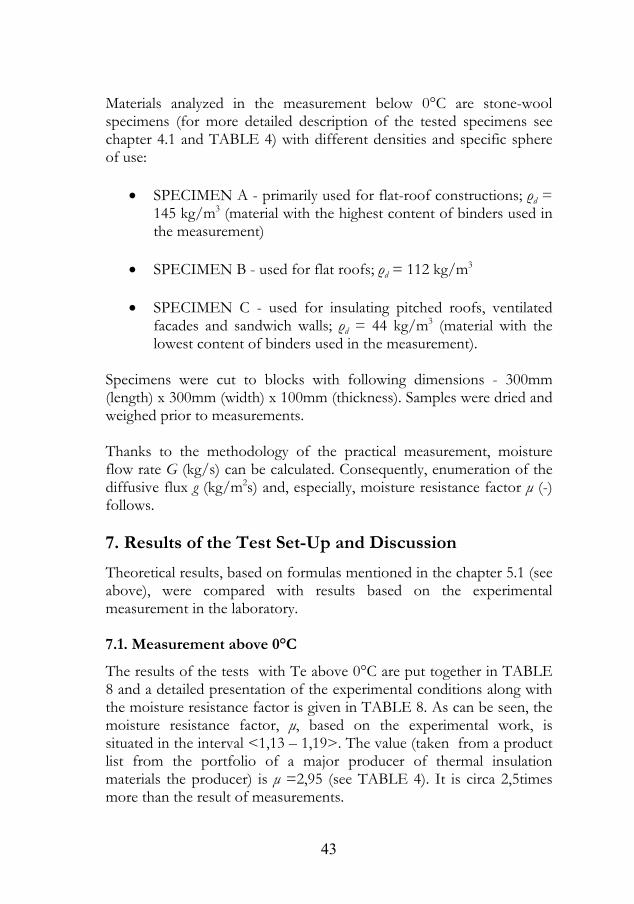
FIGURE 22: Compound humidity and temperature sensors Mitec HMP50U-2 and their instalation in the material specimen (Specimen B). After testing the specimens were cut into 18 sections at two altitudinal levels (see FIGURE 23) for easier analysis and more accurate quantification of the measured data. The cut material blocks were weighed, dried and weighed again and data of accumulated moisture were used in the calculation for each material sample
FIGURE 23: Discerption of the material sample into 18 sections and two altitudinal levels.
42
Materials analyzed in the measurement below 0°C are stone-wool specimens (for more detailed description of the tested specimens see chapter 4.1 and TABLE 4) with different densities and specific sphere of use:
• SPECIMEN A - primarily used for flat-roof constructions; ρd = 145 kg/m3 (material with the highest content of binders used in the measurement)
• SPECIMEN B - used for flat roofs; ρd = 112 kg/m3
• SPECIMEN C - used for insulating pitched roofs, ventilated
facades and sandwich walls; ρd = 44 kg/m3 (material with the lowest content of binders used in the measurement).
Specimens were cut to blocks with following dimensions - 300mm (length) x 300mm (width) x 100mm (thickness). Samples were dried and weighed prior to measurements. Thanks to the methodology of the practical measurement, moisture flow rate G (kg/s) can be calculated. Consequently, enumeration of the diffusive flux g (kg/m2s) and, especially, moisture resistance factor μ (-) follows. 7. Results of the Test Set-Up and Discussion
Theoretical results, based on formulas mentioned in the chapter 5.1 (see above), were compared with results based on the experimental measurement in the laboratory. 7.1. Measurement above 0°C
The results of the tests with Te above 0°C are put together in TABLE 8 and a detailed presentation of the experimental conditions along with the moisture resistance factor is given in TABLE 8. As can be seen, the moisture resistance factor, μ, based on the experimental work, is situated in the interval <1,13 – 1,19>. The value (taken from a product list from the portfolio of a major producer of thermal insulation materials the producer) is μ =2,95 (see TABLE 4). It is circa 2,5times more than the result of measurements.
43

G [kg/s] *10-7
g [kg/m2s]
*10-6
Te
[°C]
vs (Te)
[kg/m3] *10-2
ve
[kg/m3]*10-3
vi
[kg/m3]*10-2
δv [m2/s]
*10-5
Z [s/m]*103
μ [-]
1,74 1,94 20,02 1,73 7,34 1,61 2,22 4,51 1,13
1,93 2,14 15,11 1,29 4,91 1,41 2,34 4,28 1,14
1,76 1,95 9,76 9,26 3,56 1,34 1,99 5,02 1,18
1,62 1,80 5,74 7,14 2,86 1,18 2,01 4,96 1,14
TABLE 7: Table of the calculated magnitudes based on the experimental measurement for varying character of the ambient and for stagnant indoor temperature.
Time period
Exterior conditions
Change of weight of the entire system
[g]
Interior conditions
μ [-]
Te= 20,02°C a 6630,2 Ti= 20,91 °C Φe=42,42 % b 6567,5 Φi = 92,88 %100 h ∆ = a-b 62,7
1,13
Te= 15,11°C a 5249,9 Ti= 20,60 °C Φe=38,03 % b 5180,6 Φi = 81,23 %100 h ∆ = a-b 69,3
1,14
Te= 9,756°C a 5212,6 Ti= 20,51 °C Φe=38,41 % b 5149,3 Φi = 77,23 %100 h ∆ = a-b 63,3
1,18
Te= 5,736°C a 5277,4 Ti= 20,31 °C Φe=40,05 % b 5219 Φi = 68,23 %100 h ∆ = a-b 58,4
1,14
TABLE 8: Table of conditions (exterior and interior) for the experimental measurement together with a change of weight of the entire system within a time period of 100 hours. Numeration of μ is also attached.
44

7.2. Measurement below 0°C
The amount of moisture evaporated from the inner vessel in the box was measured with the inner balance. The weight change of the entire system, which means the moisture transport through the material specimens, was measured with the outer balance. These values for the test period (100 hours) are given in TABLE 9 below. In this table also the amount of frost and condensate in the samples after tests are given and the amount of condensate inside the box, both registered as weight increase. The rest of the evaporated moisture was trapped in the sealed padding around the box. This is also given in TABLE 9, although it was not possible to weigh this moisture because of difficulties in handling the samples.
Spec
imen
Evaporated from inner
vessel [g]
Weight change for
entire system
[g]
Condensate in the box
[g]
Frost and condensate
in the sample
[g]
Moisture trapped in
sealed padding around the box
[g] A 166 28 30 86 22 B 164 35 23 72 34 C 166 30 35 55 46
TABLE 9: Moisture balance in the testing set-up after the test
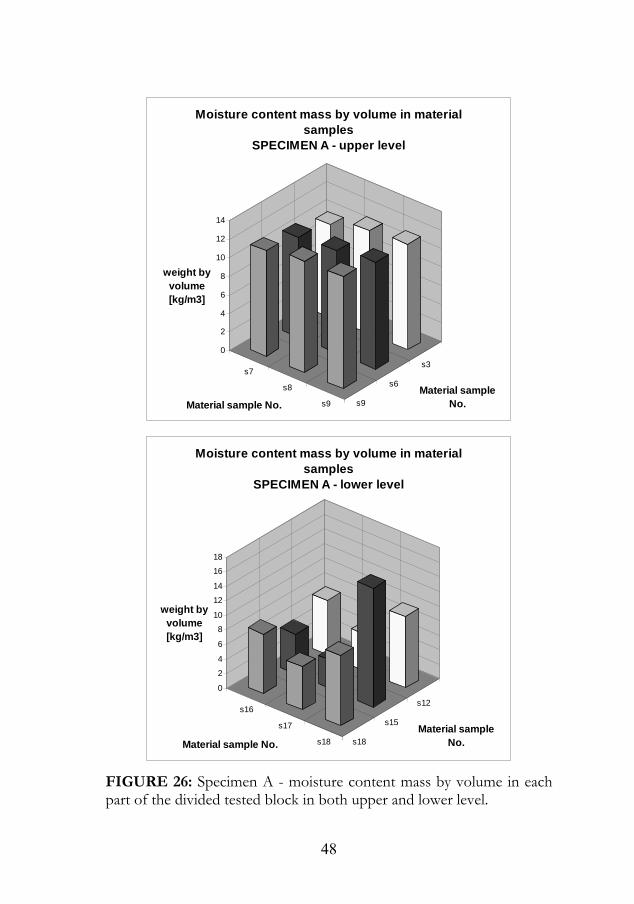
Data about moisture content in each piece of the divided specimen (see FIGURE 23) together with information about inbuilt moisture was used for calculation of moisture content mass by mass (u[%]), as well as, moisture content mass by volume (w[kg/m3]) [10]. Formation of frost for the appropriate material specimen can be seen on photographs. Results are charted into graphs showing 3D comparison of moisture content (given both as “mass-% and as volume-kg/m3) in sections of the divided material.
• SPECIMEN A
The water in the upper part of the specimen A was in form of frost which accumulates with time. The frost is quite equally spread over the depth of the material. The frost is stationary and will not move until it is melted or evaporated. Growth of frost formation in the specimen A can
45
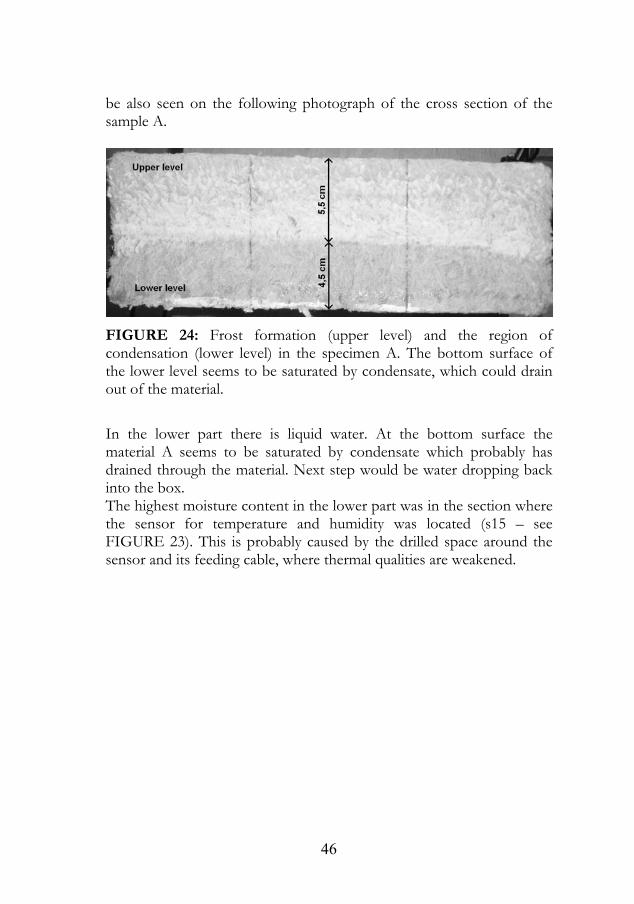
be also seen on the following photograph of the cross section of the sample A.
FIGURE 24: Frost formation (upper level) and the region of condensation (lower level) in the specimen A. The bottom surface of the lower level seems to be saturated by condensate, which could drain out of the material.
In the lower part there is liquid water. At the bottom surface the material A seems to be saturated by condensate which probably has drained through the material. Next step would be water dropping back into the box. The highest moisture content in the lower part was in the section where the sensor for temperature and humidity was located (s15 – see FIGURE 23). This is probably caused by the drilled space around the sensor and its feeding cable, where thermal qualities are weakened.
46

s7
s8
s9 s9
s6
s30
1
2
3
4
5
6
7
8
9
% by weight
Material sample No.Material sample
No.
Moisture content mass by mass in material samples
SPECIMEN A - upper level
s16
s17
s18 s18
s15
s12
0
2
4
6
8
10
12
% by weight
Material sample No.Material sample
No.
Moisture content mass by mass in material samples
SPECIMEN A - lower level
FIGURE 25: Specimen A - moisture content mass by mass in each part of the divided tested block in both upper and lower level.
47
s7
s8
s9 s9
s6
s3
0
2
4
6
8
10
12
14
weight by volume [kg/m3]
Material sample No.Material sample
No.
Moisture content mass by volume in material samples
SPECIMEN A - upper level
s16
s17
s18 s18
s15
s12
0
2
4
6
8
10
12
14
16
18
weight by volume [kg/m3]
Material sample No.Material sample
No.
Moisture content mass by volume in material samples
SPECIMEN A - lower level
FIGURE 26: Specimen A - moisture content mass by volume in each part of the divided tested block in both upper and lower level.
48

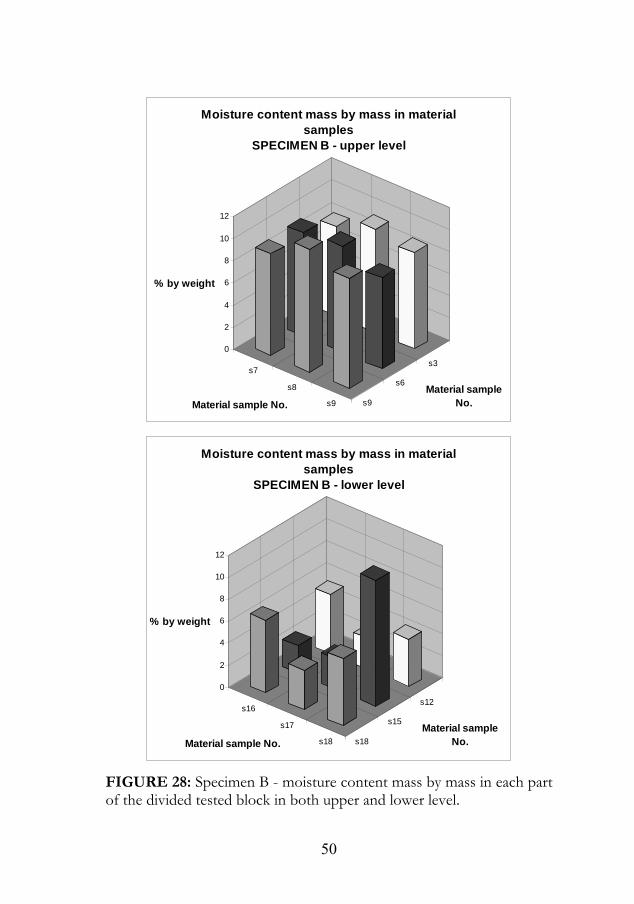
• SPECIMEN B
The same data are given for material B in figures 27, 28 and 29. The amount of frost is somewhat lower than for material A. The lower part of the sample did not seem saturated by condensate to the same extent as material A. Also here the highest moisture content was in the part with the sensor (s15 – see FIGURE 23).
FIGURE 27: Frost formation (upper level) and the region of condensation (lower level) in the specimen B. The bottom surface of the lower level does not seem saturated by condensate as much as for the specimen A.
49
s7
s8
s9 s9
s6
s3
0
2
4
6
8
10
12
% by weight
Material sample No.Material sample
No.
Moisture content mass by mass in material samples
SPECIMEN B - upper level
s16
s17
s18 s18
s15
s12
0
2
4
6
8
10
12
% by weight
Material sample No.Material sample
No.
Moisture content mass by mass in material samples
SPECIMEN B - lower level
FIGURE 28: Specimen B - moisture content mass by mass in each part of the divided tested block in both upper and lower level.
50

s7
s8
s9 s9
s6
s3
0
2
4
6
8
10
12
14
weight by volume [kg/m3]
Material sample No.Material sample
No.
Moisture content mass by volume in material samples
SPECIMEN B - upper level
s16
s17
s18 s18
s15
s12
0
2
4
6
8
10
12
14
weight by volume [kg/m3]
Material sample No.Material sample
No.
Moisture content mass by volume in material samples
SPECIMEN B - lower level
FIGURE 29: Specimen B - moisture content mass by volume in each part of the divided tested block in both upper and lower level.
51

• SPECIMEN C Data for material C are given in figures 30, 31 and 32. There is frost formation in the specimen C, although it may seem not as clearly visible as in material samples A and B. Also in this case moisture uptake was high in the opening for the moisture and temperature sensor.
FIGURE 30: Frost formation (upper level) and the region of condensation (lower level) in the specimen C. The frost formation is not as visible as in the previous insulants with higher densities, anyway, it occurs.
52

s7
s8
s9 s9
s6
s3
0
5
10
15
20
25
30
35
40
45
% by weight
Material sample No.Material sample No.
Moisture content mass by mass in material samples
SPECIMEN C - upper level
s16
s17
s18 s18
s15
s12
0
5
10
15
20
25
30
35
% by weight
Material sample No.Material sample
No.
Moisture content mass by mass in material samples
SPECIMEN C - lower level
FIGURE 31: Specimen C - moisture content mass by mass in each part of the divided tested block in both upper and lower level.
53

s7
s8
s9 s9
s6
s302468
101214161820
weight by volume [kg/m3]
Material sample No.Material sample No.
Moisture content mass by volume in material samples
SPECIMEN C - upper level
s16
s17
s18 s18
s15
s12
0
2
4
6
8
10
12
14
weight by volume [kg/m3]
Material sample No.Material sample No.
Moisture content mass by volume in material samples
SPECIMEN C - lower level
FIGURE 32: Specimen C - moisture content mass by volume in each part of the divided tested block in both upper and lower level.
54

In TABLE 10 below, data are processed for calculation of moisture resistance factor according to equation 5 (see chapter 5.1). Any distinctive increase in resistance factor with frost formation was not noted as the rate of moisture transport through the specimens was quite the same during the testing period.
Te
[°C] Rhe
[-] Ti
[°C] Rhi
[-] ve
[kg/m3] Specimen
A -20 0,63 20 0,72 0,000558
Specimen B -20 0,66 20 0,72 0,000585
Specimen C -20 0,63 20 0,72 0,000558
vi
[kg/m3]G
[kg/s] g
[kg/m2s]δv
[m2/s]μ
[-] Specimen
A 0,012446 7,78E -08
8,64E -07
7,27E -06 2,67
Specimen B 0,012446 9,72E
-08 1,08E
-06 9,11E
-06 2,13
Specimen C 0,012446 8,33E
-08 9,26E
-07 7,79E
-06 2,49
TABLE 10: Experimentally measured moisture resistance factor μ of stone-wool specimens with varying density for outdoor temperature Te=-20°C and the time interval 100 hours.
7.3. Discussion
The aim of this laboratory research was to describe the design and use of a laboratory set-up that provides a very well controlled moisture load to detect material properties of thermal insulation materials. The designed testing set-up carried out its competence for the measurement, which was done and which will follow. The measured values of moisture resistance factor for laboratory tests above 0°C (Te) for SPECIMEN A were about μ=1,2. This matches with the values given in the standard EN 12524, where the tabulated
55

value of moisture resistance factor equals to 1 for mineral wool with density between 10-200 kg/m3 [11]. The value declared by manufacturer is μ = 2,95[-]; we are not able to explain the discrepancy between these results, because we don´t know about how the producer´s data are measured. For the laboratory tests below 0°C (Te), frost formation in samples of stone wool open to air was noted in cases when the temperature field over the specimens was between + 20 and – 20ºC and the air on the warm side was saturated with moisture. In the part of the specimen facing the warm humid air condense formation occurred. The studied specimens had varying densities (SPECIMEN A - ρd=145kg/m3, SPECIMEN B - ρd=112kg/m3, SPECIMEN C - ρd=44kg/m3). Samples with higher densities (A, B) were visibly divided into one zone of frost formation and another zone of condensation in the cut. Also in the lightest sample (C) frost formation and condensation occurred but no sharp borderline was observed. The border between frozen part and condensate is close to where temperature in the stone-wool specimen passes 0°C according to the simulation. Moisture content mass by mass has an upward trend with decreasing density of the material sample. Also moisture content mass by volume points out that storage of water is highest in the tested material with the lowest density. In the part where condensation occurred the material had moisture content considerably higher than what could be anticipated from data such as moisture isotherms (see FIGURE 33).
FIGURE 33: Sorption curves for mineral wool and stone wool with density 42 kg/m3 [12].
56

Measured moisture resistance factors μ for the measurement below 0°C are 2 times or 2,5 times higher than the tabulated value [11], which is μ=1 for mineral wool with density between 10-200 kg/m3. Consequently, EN 13162 says:” In the absence of measurements, the moisture resistance factor, μ, of mineral wool products, either unfaced or faced with a fabric with an open structure, may be assumed to be equal to 1.“ [1] Why the moisture resistance factor was that high under these circumstances is not clear and might need a further study. 8. Conclusions and Future Research
8.1. Concluding remarks First of all, studies of moisture transport and absorbent properties of mineral-wool insulants are not so frequent as studies concerning thermal properties. Insulants based on stone wool are widely used within the building sector. They are popular for unique range of properties combining high thermal resistance with long-term stability. Nevertheless, stone-wool insulants are often at risk from moisture and condensation due to unpredictable changes on a building site or due to other factors. Everytime we use fibrous insulation, we should keep in mind that precise proofing from water leakage can have major credit on lifetime of this kind of insulating products. Therefore, we must pay attention to detailed planning, proper installation and correct usage. The experimental part of our project brought us valuable experience. Observing situation and problems in real cases helped us to formulate the essentials and requirements for designing a suitable laboratory set-up with controlled moisture load to measure basic moisture properties of chosen stone-wool specimens. Periodic controlling and monitoring the climate conditions, as well as, weights was important to obtain reliable data for the following calculations. Finally, stone wool is just a building material, meaning that this material does not always behave as we assume, but that is typical for laboratory work and all researchers have to struggle with.
57
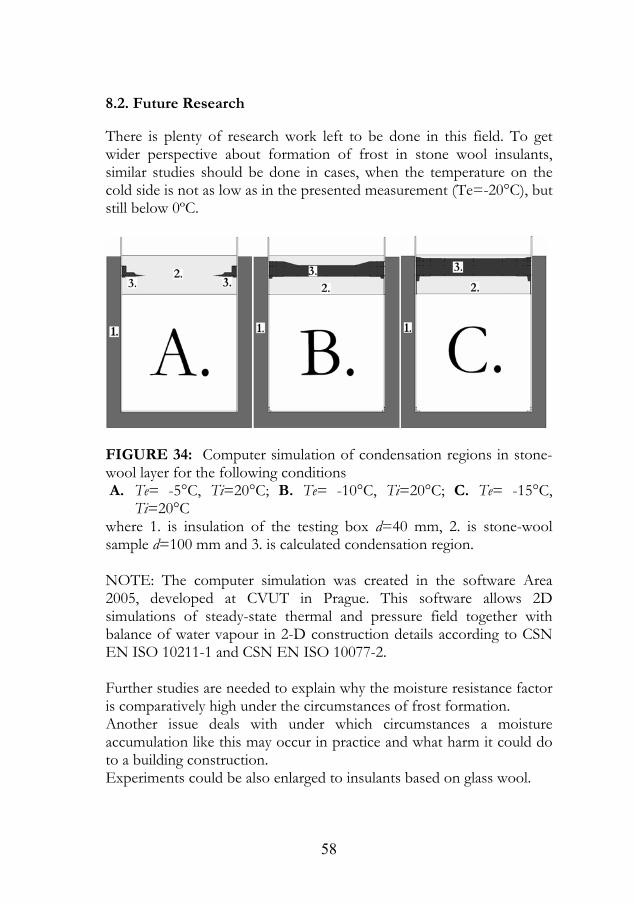
8.2. Future Research There is plenty of research work left to be done in this field. To get wider perspective about formation of frost in stone wool insulants, similar studies should be done in cases, when the temperature on the cold side is not as low as in the presented measurement (Te=-20°C), but still below 0ºC.
FIGURE 34: Computer simulation of condensation regions in stone-wool layer for the following conditions A. Te= -5°C, Ti=20°C; B. Te= -10°C, Ti=20°C; C. Te= -15°C,
Ti=20°C where 1. is insulation of the testing box d=40 mm, 2. is stone-wool sample d=100 mm and 3. is calculated condensation region. NOTE: The computer simulation was created in the software Area 2005, developed at CVUT in Prague. This software allows 2D simulations of steady-state thermal and pressure field together with balance of water vapour in 2-D construction details according to CSN EN ISO 10211-1 and CSN EN ISO 10077-2. Further studies are needed to explain why the moisture resistance factor is comparatively high under the circumstances of frost formation. Another issue deals with under which circumstances a moisture accumulation like this may occur in practice and what harm it could do to a building construction. Experiments could be also enlarged to insulants based on glass wool.
58

9. References
[1] EN 13162 (2001), Thermal insulation products for buildings – Factory made mineral wool (MW) products – Specification. Brussels: European Committee for Standardization, pp 8-23 [2] Svoboda L., Tobolka Z. (1996), Stavební izolace 1,2 – Materiály. Praha: Vydavatelství ČVUT, pp 45-47 [3] Eurima - European Insulation Manufacturers Association, http://www.eurima.org/mineral_wool/composition.html (August 2007) [4] Svoboda L. (2004), Stavební hmoty. Bratislava: Jaga, pp 125-128 [5] Rockwool a.s., Czech Republic http://www.rockwool.cz (August 2007) [6] Hagentoft, C.E. (2001), Introduction to Building Physics. Lund: Studentlitteratur, pp 87-149 [7] Jóhannesson, G. (2004), Lectures on Building Physics. Stockholm, pp 117-147 [8] Semerák, P., Michalko, O. (2001), Přehled metod měření vlhkosti stavebních materiálů. Praha: Česká stavební společnost, pp. 293-296 [9] Padfield T.,(1999) The role of absorbent building materials in moderating changes of relative humidity. DTU Lyngby, pp 18-87 [10] ISO/FDIS 9346 (2007), Hygrothermal performance of buildings and building materials – Physical quantities for mass tranfer - Vocabulary. ISO Geneva pp 1-10 [11] EN 12524 (2000), Building materials and products – Hygrothermal properties – Tabulated design values. Brussels: European Committee for Standardization, pp 1-9 [12] Nevander L.E., Elmarsson B. (1994), Fukt handbok-praktik och teori. AB Svensk Byggtjänst och föfattarna, pp 481
59

10. Bibliography
ČSN 73 0540-1 (2004), Thermal Protection of Buildings – Part 1: Terminology. Prague: Český normalizační institut ČSN EN ISO 13788 (2001), Hygrothermal performance of building components and building elements - Internal surface temperature to avoid critical surface humidity and interstitial condensation - Calculation methods. Prague: Český normalizační institut Eurima - European Insulation Manufacturers Association, http://www.eurima.org/mineral_wool/composition.html (August 2007) EN 12524 (2000), Building materials and products – Hygrothermal properties – Tabulated design values. Brussels: European Committee for Standardization EN 13162 (2001), Thermal insulation products for buildings – Factory made mineral wool (MW) products – Specification. Brussels: European Committee for Standardization Hagentoft, C. E. (2001), Introduction to Building Physics. Lund: Studentlitteratur ISO/FDIS 9346 (2007), Hygrothermal performance of buildings and building materials – Physical quantities for mass tranfer - Vocabulary. ISO Geneva Jintu Fan, Xinghuo Wen (2002), Modeling heat and moisture transfer through fibrous insulation with phase change and mobile condensates. International Journal of Heat and Mass Transfer 45, pp 4045-4055 Jintu Fan, Xiaoyin Cheng, Xinhuo Wen, Weiwei Sun (2004), An improved model of heat and moisture transfer with phase change and mobile condensates in fibrous insulation and comparison with experimental results. International Journal of Heat and Mass Transfer 47, pp 2343-2352 Jiřičková M., Černý R. (2006), Effect of hydrophilic admixtures on moisture and heat transport and storage parameters of mineral wool. Construction and Building Materials 20 (2006), pp 425–434
60

Jóhannesson, G. (2004), Lectures on Building Physics. Stockholm Kulhánek F., Tywoniak J. (1999), Stavební fyzika 20 – Stavební tepelná technika – Pomůcka pro cvičení. Praha: Vydavatelství ČVUT Michálek P., Jiřičková M., Pavlík Z., Černý R. (2006), Hydrophilic mineral wool materials: The eeffect of fiber orientation. Proceedings of 3rd International Building Physics Conference, Montreal, pp. 91-95 Mjörnell K. (2005), A method for moisture management in the building process. Reykjavik: Proceedings of the 7th Symposium on building physics in the Nordic countries, Volume 2, pp 741-748 Nevader L. E., Elmarsson B. (1994), Fukt handbok –Praktik och teori. AB Svensk Byggtjänst och föfattarna Noreng K. et al. (2005), Moisture in compact roofs – Results of two-stage field survey. Reykjavik: Proceedings of the 7th Symposium on building physics in the Nordic countries, Volume 2, pp 695-702 Padfield T. (1999), The role of absorbent building materials in moderating changes of relative humidity. Lyngby Peuhkuri R. (2003), Moisture dynamics in building envelopes. Lyngby Peuhkuri R. et al. (2005), Response of insulation materials on non-isothermal moisture transport – final results. Reykjavik: Proceedings of the 7th Symposium on building physics in the Nordic countries, Volume 2, pp 1080-1087 Rasmussen T. V. (2005), Moisture conditions for organic and mineral-based insulation products used in exterior walls and attics in traditional Danish dwellings. Reykjavik: Proceedings of the 7th Symposium on building physics in the Nordic countries, Volume 1, pp 132-140 Rockwool a.s., Czech Republic http://www.rockwool.cz (August 2007)
61

Sandberg P.I. (1971), Simultaneous water vapour diffusion and air flow through a porous material. Lund: Byggnadsteknik LTH Svoboda L., Tobolka Z. (1996), Stavební izolace 1,2 – Materiály. Praha: Vydavatelství ČVUT Svoboda L. (2004), Stavební hmoty. Bratislava: Jaga Vrána T. (2005), Impact of moisture on long term performance of insulating products. Proceedings of the Nordic Symposium on Building Physics, Reykjavik, Vol. 1, pp.71-77 Vrána T., Björk F. (2007), A laboratory equipment for the study of moisture processes in thermal insulation materials when placed in a temperature field. Submitted to E-Journal Construction and building materials Vrána T., Björk F., 2007. Frost formation and condensation in stone-wool insulants. Submitted to E-Journal Construction and building materials Vrána T., Björk F. (2007), A laboratory equipment for the study of moisture processes in thermal insulation materials when placed in a temperature field. Submitted to E-Journal Construction and building materials Vrána T., Jóhannesson G. (2006), Examination of wall constructions - Inbuilt moisture in wall constructions of a newly built apartment house. Wihlborg C. (2005), Why do moisture problems occur in the building sector – an interview study. Reykjavik: Proceedings of the 7th Symposium on building physics in the Nordic countries, Volume 1, pp 1187-1194 Xiaoyin Cheng, Jintu Fan (2004), Simulation of heat and moisture transfer with phase change and mobile condensates in fibrous insulation. International Journal of Thermal Sciences 43, pp 665-676
62