impact of pak-china free trade agreement (fta) on trade
TRANSCRIPT

Electronic Research Journal of Social Sciences and Humanities Vol 1: Issue IV
www.eresearchjournal.com Oct - Dec 2019
1
Impact of Pak-China Free Trade Agreement (FTA) on Trade and Industry of Pakistan
by
Rafia Khan1
Student of MBA Finance, Greenwich University Karachi, Pakistan
Email: [email protected]
Abdul Samad Shaikh
Lecturer, Benazir School of Business, Benazir Bhutto Shaheed University Lyari, (BBSUL)
Karachi, Pakistan
Email: [email protected]
Haris Masood
Lecturer, Benazir School of Business, Benazir Bhutto Shaheed University Lyari, (BBSUL)
Karachi, Pakistan
Email: [email protected]
Abstract
The study evaluates the impact of Pakistan & China FTA (Free Trade Agreement)
on Exports and Trade Flows Growth of Pakistan. This report is analytical in nature
based on archival data retrieved from Thompson Reuters, online sources of
Ministry of Commerce, Ministry of Textile and ITC (International Trade Center).
The Econometric Modeling is performed based on Time Series and Panel Data of
Exports of last 15 years from July 2003-June 2017 to evaluate the impact of exports
at industry level basis. The report also explicates the impact of exports on growth
of trade flows of Pakistan, as researchers have evaluated the impact of the bilateral
agreement between Pakistan and China. The researchers focus on Readymade
Garments. Pak-China FTA’s first phase included Trade in Goods and Investments,
while negotiations regarding Trade in Services took place in 2007, to expand the
coverage of the agreement. The Data is analyzed though the E-Views. Moreover,
Correlation and Multiple Linear Regression Model have been used together with
Co-integration test to evaluate the long-term relationship between exports and trade
flows of Pakistan. The report also links the strategy of exports with the Textiles
Policy of 2014-19 and Revealed Comparative Advantage (RCA) has also been
analyzed for the purpose of identifying potential exports. The report explicates at
the end certain policy implications based on analysis of Pak China FTA and overall
impact of exports on trade flows of Pakistan.
1 Corresponding author

Electronic Research Journal of Social Sciences and Humanities Vol 1: Issue IV
www.eresearchjournal.com Oct - Dec 2019
2
Keywords: Free Trade Agreement, Bilateral trade, Trade flows, Economic Modeling, Revealed
Comparative Advantage.
Introduction:
Research Background:
International trade is an elementary ingredient of the total exploitation attempt and
nationwide development of a nation. This is, actually, a vital instrument for industrialization at the
same time as entrée to foreign exchange is crucial for persistent economic progress. International
trade relations amongst countries are becoming gradually more essential in a hastily changing in
the international market, foreign associations and comprehensive concerns among economies have
developed into supplementary noticeable surrounded by the international system.
All the way through human history, people have traded goods in order to fulfill their needs
and wants. Either people specialize in the production of the goods that satisfy their wants or trade
them from others. Similarly, countries that do not specialize in certain goods but want them for
consumption purposes need to import them from countries that have a production advantage at it.
Alternatively, they export products at which they have a competitive advantage in producing and
are demanded by other countries. The reward from trade might be different for each country based
on several factors like economic, regional, strategic state of affairs, national welfare and politics.
Often when multilateral liberalization seems unachievable, countries often sign mutual free trade
agreement. Free trade often adds to national welfare (Krugman & Obstfeld, 2009).
.China and Pakistan are members of the World Trade Organization (WTO) and according
to Article XXIV of General Agreement on Tariffs and Trade (GATT), the members of WTO are
permitted to enter into regional as well as bilateral agreements. China’s exports to Pakistan are
huge in volume whereas the product mix of Pakistan’s exports is very limited; supported by the
fact that only 70% of its exports consist of cotton yarn (Shabir and Kazmi, 2007).
Therefore, Pakistan and China entered into a Free Trade Agreement (FTA) which was
concluded in 2006 and came into effect in July 2007. The objectives of the FTA signed between
Pakistan and China are:
1. Strengthen the mutual friendship between the parties.
2. Promote diversification and expansion of trade between the parties
3. Abolish barriers of trade and ease the cross-border movement of goods between the
parties.
4. Give fair state of competition for trade between the parties
5. Set up a structure for potential bilateral economic co-operation to develop and
augment the advantages of agreement.
The first step to strengthen trade and economic relations was the signing of Early harvest
program (EHP) that was signed on the 5th of April 2005 and came into operations from 1st January
2006. According to the Government of Pakistan, Ministry of Commerce, EHP was basically a mini
fast track leading up to the signing of Pak-China FTA in the following year which was regarded
to be a win-win strategy for both the parties. Products with major commercial interests gained
superior market access from both the countries. Within the next two years, under EHP program
duty free access to a considerable number of products was provided. Nevertheless, many products
were approved to be exportable from either side at Margin of Preference, in relation to MFN duty
Electronic Research Journal of Social Sciences and Humanities Vol 1: Issue IV
www.eresearchjournal.com Oct - Dec 2019
3
rate. Hence this allowed Pakistan and China to take advantage of reduced duty rates as compared
to the exports of the similar products from other countries.
Pak-China FTA’s first phase included Trade in Goods and Investments, while negotiations
regarding Trade in Services took place in 2007, to expand the coverage of the mutual agreement.
EHP was merged into the bilateral agreement (FTA) signed between Pakistan and China and in
the overall package Pakistan got market access on the products at zero duty namely, cotton fabrics,
industrial alcohol, marble and other tiles, bed-linen and other home textiles etc.
Pak-China FTA was divided into two phases. Phase 1 requires the removal and/or
decreasing the tariff rates in some categories listed below. Whereas, in phase 2 of the agreement
Pakistan and China will try to abolish tariffs of no less than 90% of products together in terms of
tariff lines and volume of trade in a ‘reasonable’ time period.
The overall package of Pakistan and China included the provision of market access at zero
duty to Pakistan in products like cotton fabrics, bed-linen, leather articles, sports goods, mangoes,
other fruits and vegetables etc. China also reduced its tariffs by 50% on products like frozen
orange juices, rubber and plastic products, fish, dairy sector, woven garments, knitwear etc. on the
other hand, Pakistan gave market access to China mainly on products like fruits and vegetables,
raw materials for several industries like engineering sector etc. (MoC, 2018).
Research Problem:
Pakistan is a developing economy with a trade deficit, but it has great export potential in
many areas. Most important export earnings are earned by Pakistan from the export of Textile and
Clothing products to several countries. Textile and clothing products, ranging from HS50-63 have
great export market in not only China but all around the globe. Pak-China FTA has already ended
its first phase and negotiations over the second phase started in 2015. Much research has already
been done in the first stage of Pak-China FTA but new data needs to be analyzed in order to
renegotiate on FTA’s second phase. Hence, this research paper aims to study the textile and
clothing sector’s contribution towards the GDP of Pakistan, and how can this sector achieve the
maximum benefits of the FTA signed between the two countries. This study considers time series
relationship of exports based on Pakistan & China FTA impacting on Economic growth of
Pakistan.
Research Objectives:
This study aims to analyses the impact of Pak-China FTA on the export pattern of Pakistan
with China, by first identifying the major exports that it makes to its partner. This research takes
into account the data and figures available for 2003 till 2017. The objectives of this research
include:
1. To identify the impact of exports of Pakistan to China on the growth of Trade Flows
of Pakistan.
2. To identify the impact of exports of Textile Sector of Pakistan, on the growth of
Trade Flows of Pakistan, due to Pak-China FTA.
3. To identify the impact of exports of Ready-made garments on the economic growth
of Pakistan, due to Pak-China FTA.

Electronic Research Journal of Social Sciences and Humanities Vol 1: Issue IV
www.eresearchjournal.com Oct - Dec 2019
4
Research Questions:
This research paper aims to answer the following questions
1) What is the impact of exports of Pakistan to China on the growth of Trade Flows
of Pakistan?
2) What is the impact of exports of Textile Sector of Pakistan, on the growth of Trade
Flows of Pakistan, due to Pak-China FTA?
3) What is the impact of exports of Ready-made garments on economic growth of
Pakistan, due to Pak-China FTA?
Justification of Study:
In order to answer the above research questions this research will conduct quantitative
analysis of data available from 2003 till 2017. The results of the study are based upon facts and
figures. This research paper will examine the impact of Pak-China FTA on the export potential of
Pakistan, analyzing and identifying which product contributes the most to the export to China in
order to benefit the local producers by identifying export trends. Nevertheless, this research will
also compare the tariffs imposed, particularly in context with exports.
Scope of Study:
Pak-China FTA is one of the most important agreements signed between the two countries
followed by China Pakistan Economic Corridor (CPEC), giving both the countries a chance to
engage in bilateral trade flows and taking maximum advantage of trade. This research is important
in the sense that it not only contributes to the literature, but instead it will assist the policy makers
of Pakistan in the development of suitable trade policy, focusing on the sectors that have great
export potential to China. Nonetheless, it will also be useful for the local producers in identifying
the opportunities and export trends, having a trickledown effect on the exports of Pakistan and
hence, contributing positively to the GDP of Pakistan.
Limitations of research:
This research is based upon the analysis of the annual data of 15 years i.e. 2003-2017. It
also studies only the export potential of Pakistan to China and does not focus on the import trends
between both the countries. Moreover, the scope of study includes only the Textile and Clothing
sector of Pakistan (HS50-63) out of all other several tariff lines.
Literature Review:
The preferential trade agreements are proliferating around the world. By 2007, 26 such
agreements have been signed only among the Asian countries in the five years and almost 40 were
under negotiations by then (Tumbarello, 2007). Pakistan China Free Trade Agreement was also
concluded in 2006 and came into effect in July 2007.
Pakistan and China are two very important strategic partners and share an all-weather
friendship. They have stood by each other sides through the thick and thin and China has also
helped Pakistan in many of its economic woes. China Pakistan Economic Corridor under the
flagship project of One Belt One Road (OBOR) Initiative is ready to provide the countries with
mutual benefit in terms of economics, social and cultural exchange and geo-political advantage. It

Electronic Research Journal of Social Sciences and Humanities Vol 1: Issue IV
www.eresearchjournal.com Oct - Dec 2019
5
would not be wrong to say the Pak-China FTA that was signed in 2007 was the first step towards
CPEC. However, the signing of Early Harvest Program on the 5th of April 2005, as stated by some
officials of the Ministry of Commerce, played a role of a mini fast track ultimately leading to the
signing of CPFTA. Hence this allowed Pakistan and China to take advantage of reduced duty rates
as compared to the exports of the similar products from other countries.
Free trade agreements basically encourage countries to engage in free trade. Usually, when
a free trade agreement is signed between countries, the tariff rates on the product list gets zero.
This means that products that come under the free trade agreement do not acquire its importer to
pay any border tax. However, unfortunately this is not the case with the free trade agreement signed
between Pakistan and China. Many of the textiles tariff lines that are included in the agreement
have a border tax to be paid. Hence, the meaning of signing such an agreement has not been fully
accomplished.
Critically looking at the trade flows between China and Pakistan, it could be safely
concluded that as compared to Pakistan, China has gained much from the signing of the agreement.
Concessions were given on 35% of tariff lines under the first phase of FTA. This resulted in huge
entry of the Chinese products into the Pakistani market, hence making the local industry weaker
and putting before it much more competition than before (Tribune, 2018). Nevertheless, under the
second phase of the Free Trade Agreement, China is asking Pakistan concession further on a
number of products, which Pakistan is not yet ready for.
The trade volume between China and Pakistan was $4 billion in 2007, the year in which
FTA was signed. This spiked to $15.6 billion in 2016-17. In 2017, however, Pakistan’s exports to
China were mere $1.5 billion but the imported summed up to $14 billion- statistics presented by
the Chinese. The main reason behind accelerated imports and cheaper exports is that Pakistan
imports expensive capital goods and raw material whereas the exports are heavily dependent on
low value-added goods, hence only adding to the trade deficit of Pakistan (Tribune, 2018).
Before-After investigation shows that the trade patterns between both the countries have
been enhanced in a general manner however, the trade shortfall of Pakistan has furthermore
augmented; the Revealed Comparative Advantage (RCA) and SWOT (Strengths, Weaknesses,
Opportunities And Threats) analysis shows that there is a disparity in goods traded between the
two countries in world markets and bilaterally apart from the top ranked products (Irshad, Hoa and
Arshad, 2017).
Another study conducted to estimate Pakistan’s bilateral trade potential with the
neighboring country, used the gravity model of trade and analyzed panel data from 1992-2015.
The study reached a conclusion that the Pakistan’s industry and its exporters must take on new and
improved methods to improve and boost the exports made to China so that a rational equality can
be reached in mutual relations in terms of trade (Irshad, Hoa and Arshad, 2018).
The first phase of China Pakistan Free trade Agreement has ended a while ago. Both the
countries are now negotiating for the signing of the second phase of the FTA, but due to a number
of challenges this has been postponing.
Economies of Pakistan and China:
Pakistan and China are two important strategic partners and have strong trade allies. The
economy of each partner is highlighted below.

Electronic Research Journal of Social Sciences and Humanities Vol 1: Issue IV
www.eresearchjournal.com Oct - Dec 2019
6
Economy of Pakistan at a Glance:
Pakistan is a South Asian country, sharing its borders with India, China, Iran and
Afghanistan. Even though Pakistan is a developing economy but it has much potential of becoming
one of the largest economies because of its strategic geographical location on the globe. Pakistan
has a trade deficit because of its expensive imports. However, it relies on very low value-added
products. Pakistan’s receives its largest export earnings from the textile sector. According to
International Trade center, Pakistan’s imports by 2012 contributed 19.7% to the total GDP of the
country, while exports contributed only 11%. This ratio was decreased by 2016, reaching to 17.8%
of imports contribution to GDP, while 7.7% of exports contribution. The share of China in
Pakistan’s exports is 7.75% (ITC, 2016).
In 2016-17, the GDP growth rate reached to 5.28%, being highest in the last 10 years.
However, overall trade patterns did not portray a positive image of the Pakistan with imports
standing at $43.9 billion and exports at $22.1 billion by 2015, causing a trade deficit of $21 billion.
The Exports of Pakistan to China after the signing of Pakistan China Free Trade Agreement
increased to US$ 1906.3 million in 2016 from US$575.93 million in 2006. However, Pakistan has
a share of only 0.19% in China’s overall imports and 0.89% share in China’s exports. The trade
imbalance between two trading partners is US$15562.3 million and not in Pakistan’s favor.
Economy of China at a Glance:
China is an East Asian country that has been recording consistent trade surpluses.
Considered as one of the largest world economies, China stands among the largest exporters and
importers of the world. Growth in exports has contributed significantly to the economic growth of
the country. China’s major exports include labor-intensive and electromechanical products that
include textiles, footwear, clothing, plastic products, toys, furniture and bags. On the other hand,
major imports include Mineral fuels, oil, Electronic equipment, Machinery, ore, copper, iron,
aluminum and soybeans. Major export partners of China are the United States, the European
Union, member countries of the Association of Southeast Asian Nations (ASEAN) Japan and the
Republic of Korea, while important import partners include EU, ASEAN, Japan, South Korea,
Taiwan, Australia, South Africa and Brazil. According to the International Trade center and World
Map Statistics, 20% of imports contributed to the GDP of the country while 24.5% of exports
contributed to it by 2012. By 2016, 15.1% of imports contributed to the GDP while 19.6% of
exports contributed to it. The difference and the disparity that exists between the sizes, of the
Pakistan’s and China’s economy can lead to creation of trade patterns that might affect Pakistan’s
economy either positively or negatively (Reema, 2007).
Pakistan’s major exports to China (HS-6):
Cotton, textile and Rice are the major exports of Pakistan to China. Total exports of
Pakistan to China have significantly increased from 2007 to 2016, ranging from $506 million to
$1,906 million by 2016.
According to International Trade center statistics, cotton contributes 61% to the exports of
Pakistan to China. Rice 14%, ores, slag and ash 5%, fish and other aquatic invertebrates 3% while
other categories contribute 17% to the exports of Pakistan made to China. Cotton and Rice,
contributes to 75% of exports to China. A major breakthrough was achieved by Pakistan, when in
2012, high domestic demand and lower fuel Prices, moved China to import more rice from

Electronic Research Journal of Social Sciences and Humanities Vol 1: Issue IV
www.eresearchjournal.com Oct - Dec 2019
7
Pakistan. Hence, this resultantly caused a shift of export of rice from 1.3% in the year 2011 to
24.4% the following year (SBP, 2017). However, some important considerations to be noted are
that the annual growth in the value of exports of Pakistan to China has declined by 12%, between
2012 and 2016 (ITC, 2016).
Figure 1: Statistical Data of Exports to China
2The trade volume between the two countries due to the agreement was $13 billion in 2013
and reached to $20 billion in 2015 as a result of 51 agreements and Memorandums of
Understanding (MoU) signed between the countries for cooperation in different fields. As a result,
the imports of Pakistan from China have significantly increased.
Pakistan’s major imports from China:
Nevertheless, China is also one of the main importers of Pakistan. According to the data of
World Integrated Trade Solutions, a World Bank Group, China contributes 29% of Pakistan’s
2 Source: Irshad, Hoa and Arshad (2017) Pak-China FTA

Electronic Research Journal of Social Sciences and Humanities Vol 1: Issue IV
www.eresearchjournal.com Oct - Dec 2019
8
imports from the world making it the top import partners. The second top exporter to Pakistan is
UAE (13.2%), followed by Indonesia, United States and Japan.
The major imports of Pakistan from China are high-tech machinery, iron, electrical
equipment, man-made filaments, nuclear reactors etc. After Pak-China FTA came into effect in
2007, a significant rise was seen in the import level data of HS-2, which shows that CPFTA has
facilitated imports. This can be supported by the fact that the import of Electrical equipment from
China increased by 68% out of all the imports of this product from the rest of world (SBP, 2017).
Trade Penetration:
The following figure shows the share of China in Pakistani imports as well as the share of
Pakistan is Chinese Imports. The diagram illustrates that the share of China in Pakistani imports
is significantly higher and gradually increased after the signing of Pakistan China Free Trade
Agreement in 2006. However the share of Pakistan is Chinese Imports hovers around only 1%-2%
unfortunately (Ministry of Textile Industry, 2018)
Figure 2: Trade Penetration3
3 Source: RDA Cell, Ministry of Textile Industry (2018)

Electronic Research Journal of Social Sciences and Humanities Vol 1: Issue IV
www.eresearchjournal.com Oct - Dec 2019
9
Pakistan’s exports to China are mainly concentrated of goods and that too low value-added
goods. A study conducted by Irshad, Muhammad Saqib & Xin, Qi, 2015 used the revealed
Comparative advantage method and Trade Intensity method and came to a conclusion that the
viability of the agreement will depend upon the non-goods components such as for example,
services, teamwork in research and development and investments. Also, after signing the Pakistan
China Free Trade Agreement in 2006, the production of local industry that has low competitive
advantage has been affected badly (SBP, 2017).
Some features of Pakistan's Textile Sector:
The textiles sector stands among the most significant sector of Pakistan’s economy. It’s
market share in the global economy contributes 31% however, the apparels sector contributes only
1% to the global economy (Jawwad and Memon, 2002). According to the Ministry of Textile the

Electronic Research Journal of Social Sciences and Humanities Vol 1: Issue IV
www.eresearchjournal.com Oct - Dec 2019
10
sector contributes 57% to the exports of Pakistan. This sector is heavily dependent upon the
spinning activity. Cotton yarn (HS520512) is one of the main exports of Pakistan. According to
International Trade center statistics, the average share of textile sector in Pakistan’s exports was
36.5% from 2012-2016. This was followed by clothing sector which contributed 20.4% to
Pakistan’s exports. Cotton yarn and Men/Boys ensembles of cotton not knitted were some of the
sectors leading exporting products.
According to a study done by Afia Malik (1996), there are some important structural
weaknesses in our textile industry. Even though Pakistan is blessed with natural raw material
specially cotton it lacks proper structure and management of resources. The better-quality cotton
that is produced is exported rather than being used in the production of high value-added products
such as ready-mage garments. One of the basic reasons behind the unfavorable trade balance of
Pakistan with China is the export of low value-added goods.
Importance of developing the Ready-made Garments sector for the economy of Pakistan:
Textile Industry is one of the industries that require low fixed costs to set up. In the case of
Pakistan, that also enjoys the benefit of low labor cost, development of textile sector is not only
vital but relatively easier as well. We have examples available from around the globe of countries
that have developed their textile sector and subsequently its economy as well. Such countries
include China, Sri Lanka, Bangladesh and nonetheless Turkey as well. According to a trade
statistic, the world-wide exports of ready-made garments were valued to be around US$412 billion.
The World Trade Organization (WTO) introduced a trade agreement in 2005 that
removed/reduced import duties from textile and clothing leaving imports and exports less
discriminating. Hence, as a result of this, countries like China, Bangladesh and India benefited
largely and emerged as international leaders of this industry. Lower labor costs together with
Preferential Trade Agreements (PTAs) provided an advantage to developing countries.
Bangladesh and Sri Lanka hugely benefited from FTAs and PTAs from western countries (TDAP,
2016).
Looking at the example of Bangladesh that has beautifully emerged as the global leaders
of the textile industry around the globe, Pakistan has an example to study. It captured a major
chunk from the industry of readymade garments, becoming the second largest producer of textile
garments. 18% of GDP and 85% of the exports of the country come from the textile garments
(TDAP, 2016).
Similarly, Pakistan needs to develop its textile industry by taking advantage of FTAs that
it has signed specifically with China as it is one of its main strategic and economic partners.
Shifting from the production and exports of low value-added goods to high value goods, structural
changes and proper investment in the labor force are some of the essentials for the development of
textile and garment sector of Pakistan.
Tariff concessions grants from China:
According to Ministry of Textile Industry, China agreed to reduce/eliminate tariffs on
6,418 8-digit tariff lines, giving market access to Pakistan on products like industrial alcohol, home
textiles, bed linen, and sports goods, fruits, vegetables steel, iron and engineering products. Out of
the tariff lines granted, 35% came under zero-rated category (from 5 years since the FTA comes
into effect in 2007); products covered under this category were cotton fabrics, medical appliances,

Electronic Research Journal of Social Sciences and Humanities Vol 1: Issue IV
www.eresearchjournal.com Oct - Dec 2019
11
leather articles etc. On the other hand, 15% of products received no grant that include cotton, paper,
fish, textile products etc.
Tariff concession grants by Pakistan:
The grants in tariff lines provided by Pakistan to its most important trade and strategic
partner include reduction or elimination of tariff rates on 5,686 8-digit tariff lines. Electronic
appliances, machinery and several categories of raw materials essential to the industrial sector of
Pakistan were granted zero tariff rates. But many products such as woven fabrics, paper, synthetic
fibers, paper board and footwear received no concession (SBP, 2017).
Textile and Clothing Tariff Lines:
Table 1: Pakistan’s commitment (HS Chap 50-63)4
Bindings
Number of
Textiles Tariff
Lines
Percentage
of Tariff
Lines
Percentage in
Pakistani
Total Textile
Imports by
volume 2006-
07
Percentage
of Chinese
Textile
Exports to
Pakistan
volume
2006-07
Category I Elimination in 3 years 3 0.33% 0.79% 1.22%
Category II 0-5% in 5 years 130 14.12% 56.08% 12.29%
Category III 50% reduction in 5 years 24 2.61% 0.22% 0.21%
Category IV 20% reduction in 5 years 596 64.71% 18.21% 34.8%
Category V No concession 166 18.02% 24.54% 51.49%
Category VI Exclusion 0 0.00% 0.00% 0.00%
Not Specified 2 0.22% 0.15% 0.06%
Total 921
4 Source: Ministry of Textile Industry

Electronic Research Journal of Social Sciences and Humanities Vol 1: Issue IV
www.eresearchjournal.com Oct - Dec 2019
12
Textile and Clothing of Pakistan comes under the HS codes from Chapter 50-63. Pakistan
has classified this into 921 8-digit HS tariff lines. On the other hand, China has classified it into
1,106 8-digit HS Tariff Lines.
Following tables provide an overview and summary of the bindings and commitments
made for tariff concessions on textile and Clothing Tariff Lines (HS Chap 50-63).
Table 2: China’s commitment (HS Chap 50-63)5
China’s
Textile
Tariff
Lines
Correspondi
ng Pakistani
HS Tariff
Lines
Percentage of
Tariff Lines
Percentage in
Pakistan’s
Total exports
by Volume
2006-07
Percentage in
Pakistan’s
exports to
China by
Volume
2006-07
Category I Elimination in 3
years 541 451 49% 50.2% 14.08%
Category II 0-5% in 5 years 202 155 16.8% 13.39% 83.39%
Category III 50% reduction in
5 years 227 172 18.7% 17.9% 0.13%
Category IV 20% reduction in
5 years 88 81 8.8% 6.71% 0.21%
Category V No concession 48 62 6.7% 11.80% 2.18%
Total 1106 921
Under category IV, 64% of tariff lines were provided by Pakistan even though the share in
imports in 2006-07 for this tariff line was only 18%, as compared to category II under which only
14.12% of tariff lines were agreed even though the import share was much higher (56.08%) in
total imports of textile in year 2006-07.
On the other hand, China offered concessions on 1106 tariff lines, or 921 tariff lines, when
translated into 8-digit HS product line defined by Pakistan. Under China’s commitment with
Pakistan, around 50% of tariff lines are placed under category I.
Tariff Concessions on Cotton and Ready-made Garments:
The Government of Pakistan has divided the trade of textile and Clothing into 13 diverse
groups. These groups include raw cotton; cotton carded combed, cotton yarn, cotton cloth, carpets,
other yarns, knitwear, ready-made garments, bed ware, towels, tents/canvas, synthetic textile, other
made-ups and other textile materials.
As per Pakistan, according to the research and development cell of Ministry of Textile
Industry, it has reduced 20% or less tariff on three main groups namely cotton yarn, cotton, and
other textile materials. In contrast, China has granted 20% or less reduction in Ready garments and
5 Source: Ministry of Textile Industry

Electronic Research Journal of Social Sciences and Humanities Vol 1: Issue IV
www.eresearchjournal.com Oct - Dec 2019
13
knitwear while 100% cuts on cotton cloth as well as bed wear, providing Pakistan a major
milestone to increase its exports in textile and clothing arena.
Revealed Comparative Advantage:
The Revealed Comparative Advantage is an economic concept that aims to calculate and
assess a country’s relative advantage, or at times disadvantage in a certain category of products,
which is commonly explained by the trade flows of that country. The general concept of RCA says
that a comparative advantage in a product is revealed if RCA>1. However, if RCA is lesser than
unity then a country does not have revealed comparative advantage in that product or in simple
words, has comparative disadvantage at producing that product.
A study conducted by Irshad, Hoa and Arshad , 2017 aimed to analyze that the exports of
Pakistan on sector level basis through Revealed Comparative Advantage in the market worldwide.
The data ranging from the years 2003-2015 was used and Harmonized System (HS) 1988/92
produced by the World Customs Organization (WCO) were studied. It was observed that the
exports of Pakistan were concentrated on a limited range and type of products and no enthusiastic
attempts were made to diversify the export base made to the world. Moreover, Pakistan has also
not been a major trading player in the international arena. But it has a status of being a major
exporter of few items link textile and clothing sector, hides and skins sector and Vegetables.
The Revealed Comparative Advantage figures for the years 2012-16 of Pakistan’s sectors
with China are illustrated and analyzed below. They have been extracted from online sources of
World Integrated Trade Solutions (WITS), and hence should be considered reliable, transparent
and reliable for the purpose of analysis.
Table 3: Comparative Advantage of Pakistan's sectors with China6
Product Group 2012 2013 2014 2015 2016
Textiles and Clothing 29.71 33.74 35.22 33.23 32.83
Hides and Skins 7.88 8.28 9.36 7.1 8.32
Intermediate goods 4.05 4.3 3.88 3.24 2.98
Vegetable 3.02 2.1 2.31 2.32 3.97
Food Products 1.88 2.08 3.57 4.5 1.55
Animal 1.71 1.13 1.71 1.8 2.05
Metals 1.09 1.06 1.1 1.22 1.18
Minerals 0.92 1.01 1.03 1.05 1.18
Consumer goods 0.89 0.68 0.85 0.91 1.56
Raw materials 0.48 0.5 0.54 0.57 0.59
Plastic or Rubber 0.23 0.28 0.29 0.23 0.24
Footwear 0.05 0.1 0.1 0.04 0.02
Chemicals 0.04 0.01 0.01 0.01 0.01
Normally, the nation which imports and reduces barriers on imports, it is likely that the
home country’s exports improve with its import partner (Irshad, Xin, Hao, & Arshad, 2017).
Therefore, by looking at this phenomenon, if China lowers import barriers on Pakistan’s exports,
6 Source: World Integrated Trade Solution (WITS)

Electronic Research Journal of Social Sciences and Humanities Vol 1: Issue IV
www.eresearchjournal.com Oct - Dec 2019
14
then Exports of Pakistan to China are likely to increase. The table above shows different sectors
of Pakistan with their respective RCA of five years i.e. 2012-16. Products with RCA>1 are likely
to have more impact of tariff reductions on exports than vice-versa. In its second term of
negotiations with China, Pakistan should consider the fact that China removes tariffs from products
that Pakistan has a higher RCA. For example, Pakistan’s exports of intermediate goods to China
are although high, but the Revealed Comparative Advantage in this sector is relatively lower as
compared to that in Textiles and Clothing.
Pak-China FTA and the Textile Policy 2014-19:
The second Textiles Policy (2014-19) developed by the ministry of Textiles Policy made
efforts to address issues that exist on sectoral basis including cotton, man-made fibers, knitting,
spinning, weaving, garments and made-ups. The policy aimed at promoting fibers apart from
cotton that include acrylic, nylon, viscose, Polyester, silk and wool as the reduction of tariffs and
promotion of industry in these products will lead to product sophistication and innovation and also
towards more value addition in the exported garments.
The textiles policy admits that poor management practices, lack of use of Information
Technology and poor inventory control systems have contributed to low per capita productivity.
One of the goals of the policy was to double the exports of textile sector from $13 billion per
annum to $26 billion per annum in next five years. However, opposite happened and the overall
exports to the world decreased to $12.5 billion by 2016. Similarly, the exports made to China fell
from $1.5 billion to $1 billion.
According to the textiles policy 2014-19, globally, the demand for man-made fibers is
increasing and that for cotton is decreasing. The ratio of cotton to fiber has reversed from 60-40 to
40-60 in the last decade. Three decades back, the ratio for cotton to fiber was 80-20. This drastic
change in the consumer preference has left Pakistan in a critical scenario because the increase in
the production of man-made fiber and related products is very low. Pakistan should aim to
concentrate on such high-value added fibers apart from cotton particularly MMF (Man-made
Fibers) to enhance its product mix.
Table 4: Literature Framework (1996 – 2018)
Title of study and
Context
Author Year/country Findings
Demand For Textile And
Clothing Exports Of
Pakistan
Afia Malik 1996/Pakistan Pakistan’s share of textile in world trade is
marginal
Adding Value: Building
Value-Addition Alliances,
Backward Linkages In The
Textile And Clothing
Sector of Pakistan
Wajid
Jawwad and
Aziz
Memon
2002/Pakistan The textiles sector stands among the most
significant sector of Pakistan’s economy. It’s
market share in the global economy contributes
31% however, the apparels sector contributes only
1% to the global economy.
Are Regional Trade
Agreements in Asia
Stumbling or Building
Blocks? Some
Implications for the
Mekong Countries
Patrizia
Tumbarello
2006/ (IMF—
Asia and
Pacific
Department)
Regional integration should be complemented by
multilateral and unilateral liberalization in order to
avoid in the future welfare-reducing trade
diversion

Electronic Research Journal of Social Sciences and Humanities Vol 1: Issue IV
www.eresearchjournal.com Oct - Dec 2019
15
Economic Impacts of the
recently signed Pakistan-
China Free Trade
Agreement
Samina
Shabir and
Reema
Kazmi
2007/Pakistan FTA offers a huge potential for Pakistan’s
economy, yet the country needs to make its exports
with China more diversified.
Pakistan-China Free Trade
Agreement (PCFTA)
Treaty Model: Capability,
Prospects and Disputes
Irshad,
Muhammad
Saqib &
Xin, Qi
2015/Pakistan The viability of the agreement will depend upon
the non-goods components such as for example,
services, teamwork in research and development
and investments.
Sectorial Competitiveness
and Value Chain Analysis-
Ready Made Garments
Ministry of
Commerce,
Government
of Pakistan
2016/Pakistan Countries like China, Bangladesh and India
benefited largely from FTAs and emerged as
international leaders of this industry. For Pakistan
to achieve the same, highest value addition is
required.
Determinants of Exports
Competitiveness: An
Empirical Analysis
through Revealed
Comparative Advantage of
External Sector of Pakistan
Irshad,
Muhammad
Saqib &
Xin, Qi
2017/Pakistan Highest level of value addition is required to
Dynamics of Pakistan's
Trade Balance with
China. SBP Staff Notes
Junaid
Kamal and
Manzoor
Hussain
Malik
2017/Pakistan Production of local industry that has low
competitive advantage has been affected badly.
An Empirical Analysis of
Pakistan's Bilateral Trade
and Trade Potential with
China: A Gravity Model
Approach
Irshad,
Muhammad
Saqib &
Xin, Qi
2018/Pakistan Pakistan’s industry and its exporters must take on
new and improved methods to improve and boost
the exports made to China so that a rational
equality can be reached in mutual relations in
terms of trade.
Research Methodology:
The research methodology refers to the selection of methods used in the study together
with explaining the researchers’ stance and creating linkages with the field of study. This research
is conducted in epistemological context to understand the impact of PAK-CHINA FTA on the
economic growth of Pakistan by specifically looking at the contribution made by the textile sector
towards the GDP of the country. This research is quantitative in nature and is based upon archival
data. The analysis on the data collected is done through E-Views, Unit Root and ADF Test,
together with Regression and Panel Co-integration to examine the long-term relationship of
Variables.
Demographic Distribution of Sample:
The research is carried out in the domain of finance and stands upon Archival data. The
data is collected of the overall exports of Pakistan to China, the exports of the textile sector and
the exports of ready-made garments and selected macroeconomic and financial variables specially
the trade flows of Pakistan with China. Monthly and time series data of last 15 years has been
selected.

Electronic Research Journal of Social Sciences and Humanities Vol 1: Issue IV
www.eresearchjournal.com Oct - Dec 2019
16
Geographic Distribution of Sample:
The research is based on Pakistan and time series data analysis of Pakistan’s exports and
financial variables to evaluate the impact of CPFTA on the trade flows growth.
Research Design:
Research design gives an in-depth understanding about how the research will take place. It
explains the research strategy and methods that will be used to conduct this research. Research
philosophy, paradigm, research approach, its types, strategies, methods to be used and data
collection sources are specified in the following headings.
Research Philosophy and Paradigm:
This research is executed in epistemological context as it covers the area of management
sciences. According to (Saunder, 2009) Epistemology context reflects upon the formation and
development of knowledge. Therefore, this research paper focuses on studying the Dependent and
independent Variables through Post Positivism approach.
Research Approach:
According to Bryman and Bell, 2011, any research could either be inductive or deductive.
This research paper has used deductive approach as it aims to express the relationship between
variables based upon theory. Pak-China FTA has affected different economic variables and
multiple industries. It has also affected the GDP and Economic Growth of Pakistan. Hence, under
the deductive approach the impact of Independent Variables from textile industry is studied on the
economic growth of Pakistan.
Research Type:
This research is based upon the use of quantitative research methods. Analysis is done
statistically, and results are numerically calculated. Hence, this research is empirical in nature.
Research Strategy:
Out of descriptive, explanatory and exploratory research strategies available to conduct
researches, this research paper is explanatory in nature. Due to the study of causal linkages, and
because it aims to study the cause-effect relationship between the variables, hence, this research
strategy can be concluded as explanatory.
Research Method:
This research is based upon the collection and analysis of secondary data that is collected
from renowned and authentic sources, mainly Thompson Reuters and International Trade Center
(ITC). Data is statistically tested in order to understand the empirical effect of selected independent
variables on dependent variables. Therefore, this research is based upon quantitative research
technique. Moreover, it’s a cross-sectional study as the results are collected at one point in time.

Electronic Research Journal of Social Sciences and Humanities Vol 1: Issue IV
www.eresearchjournal.com Oct - Dec 2019
17
Data Collection Methods and Sources:
This study examines the data of 15 years, ranging from 2003-2017. The dependent variable
is the GDP of Pakistan and the economic growth rate. The series of data for analysis has been
gathered from the online sources of International Trade Center (ITC), and Thompson Reuters.
Data and Sources:
The Core variable is considered as Exports of Pakistan and particularly the exports of
Textile industry and in Textile industry the exports of Ready-Made Garments at Industry Level
basis are selected. The Data is collected from Thomson Reuters, ITC and Textile Industry of
Pakistan. The data of last 15 years is collected as the series of Pakistan and China FTA considering
the 4 bilateral agreements from 2007 to 20017.
The researchers selected few constructs as independent variable, based on knowledge and
data, as Overall exports of Pakistan, Exports of Ready-Made Garments at Industry Level basis and
overall Trade flows of textile sector of Pakistan are independent variables and Growth in Exports
of Pakistan is the dependent variable.
Conceptual Framework:
Model-1
Model-2
Hypothesis Development:
Exports of Pakistan to
China
2003-2017
Growth rates of Pakistan
(Trade Flows)
Exports of Pakistan to
China
Textile Sector (Industry
Level) Growth rates of Pakistan
(Trade Flows)
Exports of Pakistan to
China
Ready Made Garments
(Industry Level)

Electronic Research Journal of Social Sciences and Humanities Vol 1: Issue IV
www.eresearchjournal.com Oct - Dec 2019
18
H1: Pak-China Free Trade Agreement has a positive impact on overall trade flows in
Pakistan.
H2: Pak-China Free Trade Agreement has a positive impact on the trade flows of textile
sector at sector-level basis in Pakistan.
H3: Pak-China Free Trade Agreement has a positive impact on the exports of Ready-made
garments at sector-level basis in Pakistan
Econometric Model and Tools used for Data Analysis:
Exports and the data of all independent variables was obtained to measure the effect of
variables. The Analysis was then done through multiple linear regression model and afterwards
correlation between the trade flows and exports was analyzed. Normality or stationary check of
data ADF (augmented dicky fuller) test was used to see the association and impact of variables
studied the regression and co-integration approaches applied and assess the short-term
relationship.
The collected data was analyzed and processed through E-views Software and a range of
tests were carried out to compute the connection and impact of dependent and independent
variables.
SPSS (23.0) and E-views (9.5) software was used to process the data and calculate the
results.
Table 5: Statistical Tests used for Data Analysis
The Unit root test was applied to check and assess if the data is normal and descriptive
analysis was applied to check the behavioral trends of different indicators. The Correlation
Analysis helped in evaluating the relationship of a variety of factors with trade flows growth rates
and two model regression and co-integration was used to examine the effect and long-term
association for predicting the impact on the trade flows growth.
Empirical Analysis:

Electronic Research Journal of Social Sciences and Humanities Vol 1: Issue IV
www.eresearchjournal.com Oct - Dec 2019
19
Test of Stationary of Data:
The Data for this research paper is obtained from Thompson Reuters and online sources of
ITC (International Trade Center). It is established that the data is stationary because it is made sure
that the data accomplishes the essential characteristics for stationary data. Unit root Test is
conducted by running ADF (Augmented Dickey Fuller) at Level. As the report analyses time series
data from year 2003-2017 hence it is necessary to ensure the data is stationary. In case if the data
is not stationary, the data analysis becomes incorrect. As the impact of Independent Variables on
the Dependent Variable is being analyzed and the regression analysis is to be done on non-
stationary data results unfortunately get incorrect and misleading. Therefore, stationarity of data
has been made necessary and when conducting Unit Root Test, Null Hypothesis is adopted and
hence, no unit root is present in the data that is analyzed.
Ho: Series does not have Unit root
H1: Series has unit root.
Table 6: Unit root test ADF
Variable AT LEVEL
Critical value
of t at 5%
Decision of
Null
Hypothesis
At 1st Difference (I)
Decision of
Hypothesis
EX -1.62 -2.88 Rejected -2.89 Accepted
EXTI -2.79 -2.88 Rejected -2.97 Accepted
EXRM -1.63 -2.88 Rejected -3.94 Accepted
TFG -1.49 -2.88 Rejected -4.12 Accepted
The table shows the results of ADF (Augmented Dickey Fuller) test. The test is performed
to evaluate the stationarity in the data. The data must be normally distributed to run the model.
The Unit root test is conducted at 95% confidence level and the value must be greater than ±2.88.
The first run of the model at level shows the value of Exports to China is -1.62 and hence contains
Unit Root. At First Difference, the value obtained is -2.89 (greater than 2.88) and for this reason
contains no Unit Root.
The second value is the export of textile sector to China giving the value of -2.79 at Level
and contains Unit Root. The test performed at 1st Difference gives the value -2.97 (greater than
±2.88) and hence signals the elimination of Unit Root. The value of exports of ready-made
garments is -1.6 with unit root and -3.94 with 1st Difference, contains no Unit Root. The value of
growth in Trade Flows is -1.49 at Level and at 1st Difference the value is -4.12 (no Unit Root).
As the Unit Root from all the variables is removed, hence the data is safe for running analysis in
further steps.

Electronic Research Journal of Social Sciences and Humanities Vol 1: Issue IV
www.eresearchjournal.com Oct - Dec 2019
20
Descriptive Statistics
Table 7: Descriptive Analysis
ITC_EXP ITC_EXRM ITC_EXTI ITC_TFG
Mean 1305773. 404416.0 906490.5 3.703128
Median 1435943. 381441.0 934646.1 1.708502
Maximum 2652223. 814451.0 1986242. 21.75362
Minimum 259637.0 93101.00 174531.0 -14.09000
Std. Dev. 826146.3 265041.7 593536.9 11.10153
Skewness 0.265228 0.313722 0.478041 0.024069
Kurtosis 1.776509 1.665052 2.022164 1.920524
Jarque-Bera 1.111445 1.359857 1.168909 0.729741
Probability 0.573658 0.506653 0.557410 0.694287
Sum 19586593 6066240. 13597358 55.54693
Sum Sq. Dev. 9.56E+12 9.83E+11 4.93E+12 1725.416
Observations 15 15 15 15
The descriptive analysis table shows the descriptive statistics of the data and illustrates the
maximum, minimum and mean values present in the data that is analyzed. The mean of overall
exports to China is 1305773 US Thousand Dollars, while the minimum value is 259637 US
Thousand Dollars and the highest/maximum value stand at 2652223 US Thousand Dollars. On the
other hand, the mean values of exports of ready-made garments, exports to China of the Textile
Industry as a whole, and the percentage growth increase are 40,4416 US Thousand Dollars,
906490.5 US Thousand Dollars and 3.7% respectively. The figures of Standard Deviation suggest
that there is high volatility in the data available for scrutiny. This is because of the several different
movements present in the trade flows between Pakistan and China, involving a number of plunges
and upward trends.
Behavioral Trend of Variables:
Figure 3: Exports of Pakistan to China (US$)

Electronic Research Journal of Social Sciences and Humanities Vol 1: Issue IV
www.eresearchjournal.com Oct - Dec 2019
21
The graph shows the trend of exports of Pakistan to China from years 2003 to 2007. The
exports have been gradually increasing from 2003 till 2012 after which for almost two years (2012-
2014) they became constant (or minutely changed), followed by a substantial decrease in exports
after 2014 till 2017. According to Trade Development Authority of Pakistan there was a 15.05%
decrease in the value of exports of Pakistan to China in the in FY2013-14 only. The decrease in
the value of exports is contributed by several factors mainly Pakistan’s small export basket, low
value-added goods, economic slowdown and such related factors.
Figure 4: Textile Exports of Pakistan to China (US$)
As can be seen in the graph, the textile exports of Pakistan to China progressively grew
from the years 2003 till 2014 followed by a sharp decline since then, till 2017. A major reason
behind this could be China’s inclination towards importing high-tech products lather than low
value added or low-tech products such as textiles. Nevertheless, China has other important and
low-cost importing partners such as Bangladesh, giving China maximum price cuts.
Figure 5: Textile Exports Ready-made Garments of Pakistan to China (US$)
Similarly, the exports of Ready-Made garments have followed the same trend; gradually
increasing till US$800,000 until 2014 and then decreasing significantly. Apart from economic
Electronic Research Journal of Social Sciences and Humanities Vol 1: Issue IV
www.eresearchjournal.com Oct - Dec 2019
22
factors, exports with the most important strategic partner have also been affected by social factors
such as changes in consumer preferences and trends. Man-made fiber products are now being
actively demanded by the buyers while on the other hand; Pakistan’s exports of Textile products
are dominated by cotton only.
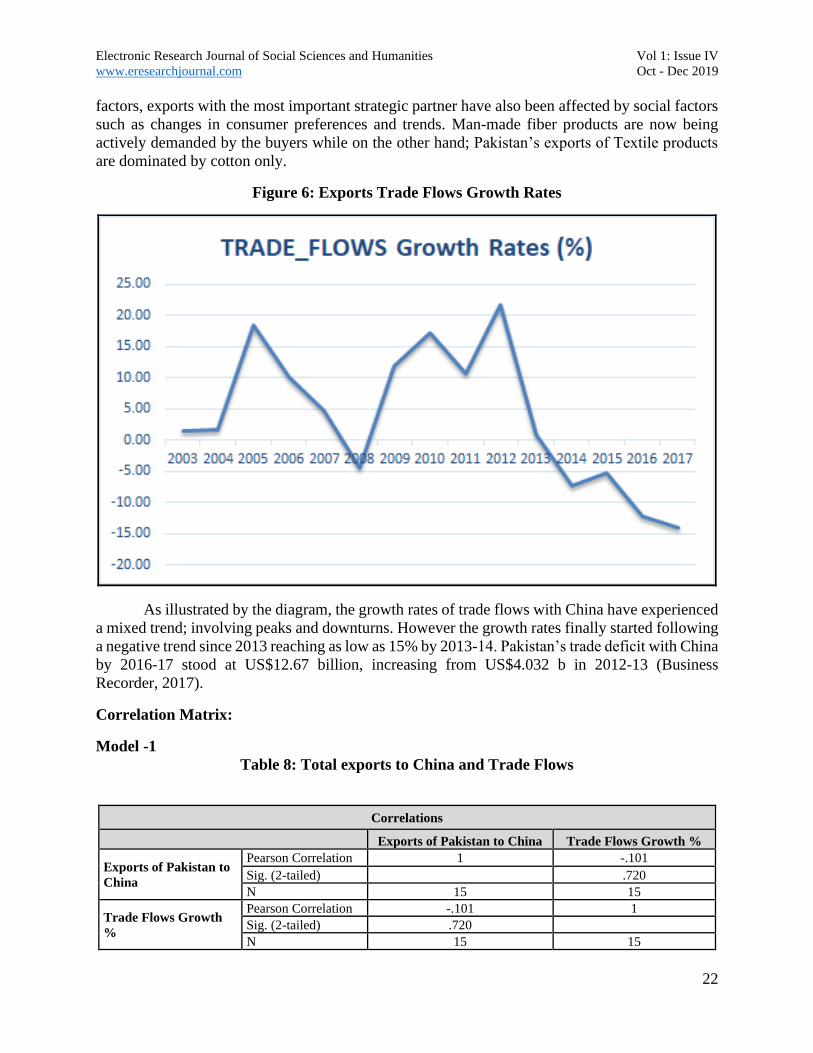
Figure 6: Exports Trade Flows Growth Rates
As illustrated by the diagram, the growth rates of trade flows with China have experienced
a mixed trend; involving peaks and downturns. However the growth rates finally started following
a negative trend since 2013 reaching as low as 15% by 2013-14. Pakistan’s trade deficit with China
by 2016-17 stood at US$12.67 billion, increasing from US$4.032 b in 2012-13 (Business
Recorder, 2017).
Correlation Matrix:
Model -1
Table 8: Total exports to China and Trade Flows
Correlations
Exports of Pakistan to China Trade Flows Growth %
Exports of Pakistan to
China
Pearson Correlation 1 -.101
Sig. (2-tailed) .720
N 15 15
Trade Flows Growth
%
Pearson Correlation -.101 1
Sig. (2-tailed) .720
N 15 15
Electronic Research Journal of Social Sciences and Humanities Vol 1: Issue IV
www.eresearchjournal.com Oct - Dec 2019
23
The Correlation Table for Model 1 shows the relationship between Dependent and
Independent Variables-the dependent variable being the growth in Trade Flows of Pakistan due to
Pak-China FTA, and the independent variable being the overall exports of Pakistan to China, The
researchers evaluate the relationship of variables based on probability values greater than 0.05.
The sig-value of Pakistan’s exports to China is 0.72 which is greater than 0.05 and is considered
to be insignificant. The variable is insignificant and there is no relationship to express the value of
Dependent Variable.
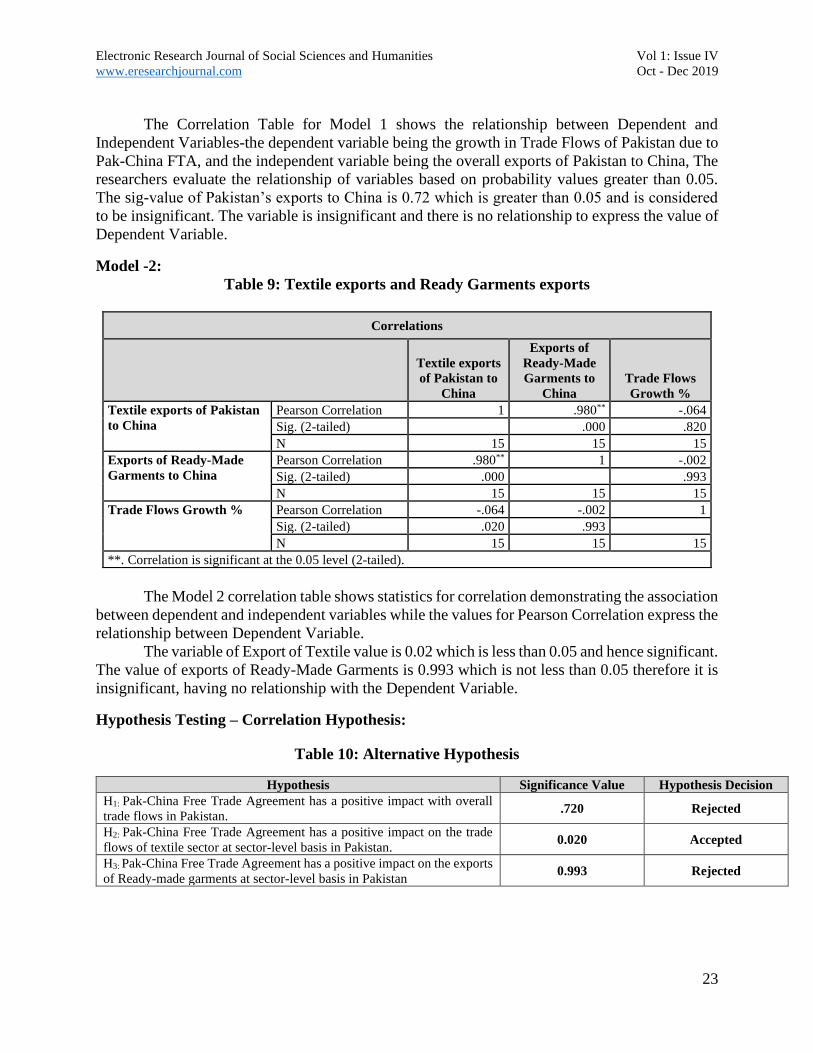
Model -2:
Table 9: Textile exports and Ready Garments exports
Correlations
Textile exports
of Pakistan to
China
Exports of
Ready-Made
Garments to
China
Trade Flows
Growth %
Textile exports of Pakistan
to China
Pearson Correlation 1 .980** -.064
Sig. (2-tailed) .000 .820
N 15 15 15
Exports of Ready-Made
Garments to China
Pearson Correlation .980** 1 -.002
Sig. (2-tailed) .000 .993
N 15 15 15
Trade Flows Growth % Pearson Correlation -.064 -.002 1
Sig. (2-tailed) .020 .993
N 15 15 15
**. Correlation is significant at the 0.05 level (2-tailed).
The Model 2 correlation table shows statistics for correlation demonstrating the association
between dependent and independent variables while the values for Pearson Correlation express the
relationship between Dependent Variable.
The variable of Export of Textile value is 0.02 which is less than 0.05 and hence significant.
The value of exports of Ready-Made Garments is 0.993 which is not less than 0.05 therefore it is
insignificant, having no relationship with the Dependent Variable.
Hypothesis Testing – Correlation Hypothesis:
Table 10: Alternative Hypothesis
Hypothesis Significance Value Hypothesis Decision
H1: Pak-China Free Trade Agreement has a positive impact with overall
trade flows in Pakistan. .720 Rejected
H2: Pak-China Free Trade Agreement has a positive impact on the trade
flows of textile sector at sector-level basis in Pakistan. 0.020 Accepted
H3: Pak-China Free Trade Agreement has a positive impact on the exports
of Ready-made garments at sector-level basis in Pakistan 0.993 Rejected

Electronic Research Journal of Social Sciences and Humanities Vol 1: Issue IV
www.eresearchjournal.com Oct - Dec 2019
24
H1: There is no significant relationship between the growths in overall trade flows of
Pakistan based on Pak-China Free Trade Agreement; hypothesis rejected at significance level
0.720 with 95% confidence interval.
H2: There is a significant relationship between the exports of Textile Sector to China and
the growth in trade flows of Pakistan; hypothesis has been accepted at significance level 0.020
with 95% confidence interval.
H3: There is no significant relationship between the exports of Ready-Made Garments to
China and the growth in trade flows of Pakistan; hypothesis has been rejected at significance level
0.993 with 95% confidence interval.
Regression Analysis:
Table 11: Regression Analysis
Variable Co-efficient (B) t-statistics Probability
C 6.34 1.12 0.28
EX 3.94 -1.11 0.29
EXTI 6.28 2.11 0.029
EXRM 5.15 0.50 0.62
The table above shows the results of regression output, the values of B-Coefficients, t-
statistics and probability values. The Beta Coefficient explains the magnitude or explanatory
powers of each Independent Variable and t-statistics show the values of acceptance and rejection
of output. The t-value must be greater than ±1.96 at 95% confidence interval.
The first variable of Exports Beta coefficient is 3.84 shows that the 3.94% change brings
1% change in Dependent variable. The value of t is -1.11 which is less than ±1.96 and shows its
insignificance explaining that exports cannot predict the growth rate. Moreover, as the probability
value is 0.29, and not less than 0.05.
For the other variable of Exports of Textile Industry the t-statistics is 2.11 (greater than
±1.96), is significant and change in the exports of Textile Sector affects the overall trade flows of
Pakistan. The third variable t value is 0.05, illustrating insignificance and no impact of trade flows.
Table 12: Model Summery
Statistics Values
R Square 0.50
Adjusted R2 0.48
Hanan Quien criterion 21.4
F-Statistics 0.93
Probability of F-Statistics 0.045
Model summary of regression analysis illustrates the value of R2 which explains the
predictability of model and how the model can evaluate the relationship and impact among
dependent and independent Variables.
The Value of 0.5 shows 50% predictability band in selected two variable exports of Textiles
and Ready-made Garments. On the other hand, the F-Statistics show the model significance. The
value is 0.93 and P-Value is less than 0.05 hence, the model is significant.

Electronic Research Journal of Social Sciences and Humanities Vol 1: Issue IV
www.eresearchjournal.com Oct - Dec 2019
25
Hypothesis Testing (Regression) Impact Hypothesis:
Table 13: Alternative Hypothesis
H1: There is no significant relationship between the growths in overall trade flows and
based on Pak-China Free Trade Agreement; hypothesis is rejected at t -1.11 and P 0.29.
H2: There is a significant relationship between the growths in overall trade flows based on
the exports of Textile sector under Pak-China Free Trade Agreement; hypothesis accepted at t 2.11
and P 0.29.
H3: There is no significant relationship between the growth in overall trade flows based on
Ready-made Garments under Pak-China Free Trade Agreement; hypothesis rejected at t 0.5 and P
0.62.
Co-integration Analysis:
Table 14: Co-integration test
Unrestricted Co-integration Rank Test (Trace)
Hypothesized Trace 0.05
No. of CE(s) Eigenvalue Statistic Critical Value Prob.**
None * 0.879425 56.15767 47.85613 0.0069
At most 1 0.799869 28.65642 29.79707 0.0672
At most 2 0.427237 7.742270 15.49471 0.4934
At most 3 0.037552 0.497582 3.841466 0.4806
Trace test indicates 1 co-integrating eqn(s) at the 0.05 level
* denotes rejection of the hypothesis at the 0.05 level
**MacKinnon-Haug-Michelis (1999) p-values
Hypothesis t statistics Significance
Value
Hypothesis
Decision
H1: Pak-China Free Trade Agreement has a positive impact with
overall trade flows in Pakistan. -1.11 0.29 Rejected
H2: Pak-China Free Trade Agreement has a positive impact on the
trade flows of textile sector at sector-level basis in Pakistan. 2.11 0.029 Accepted
H3: Pak-China Free Trade Agreement has a positive impact on the
exports of Ready-made garments at sector-level basis in Pakistan 0.50 0.62 Rejected

Electronic Research Journal of Social Sciences and Humanities Vol 1: Issue IV
www.eresearchjournal.com Oct - Dec 2019
26
Co-integration analyses the long-term relationship of Independent and Dependent
Variables. The table explains the relationship at various other levels of integration from Level to
1st Difference and then 2nd Difference. When analyzing the results of Co-integration table, the
values of Trace Statistics must be greater than Critical Value for the acceptance of hypothesis. As
can be seen in the table above, the value of Trace Statistics shows no long-term co-integration
between the selected Independent and Dependent Variables at various levels of integration as the
values of Trace Statistics are lesser than the Critical values for each variable and therefore, these
variables are unable to predict the changes in rates of trade based upon imports and exports of
textiles.
Policy Recommendations:
Figure 7: Bilateral Trade between Pakistan and China in 2017
The diagram above shows the trend of the annual percentage growth of exports in value
from 2013-2017 and the share of each product type in Pakistan’s exports along with the tariffs
faced by Pakistan. As can be seen, the annual growth in the exports of cotton (HS-52) has remained
negative. Important point to consider here is that cotton is one of the main exports made to China.
Cotton along with cotton producers put in 60% in the total exports during the year 2016-17. All
the products’ share in the exports of Pakistan is very low. However the export of HS 61, 62, 56,
54 and 58 have shown a positive trend.
-60
-40
-20
0
20
40
60
80
Co
tto
n
Oth
er m
ade-
up
tex
tile
art
icle
s;se
ts; w
orn
clo
thin
g an
d w
orn
…
Art
icle
s o
f ap
par
el a
nd
clo
thin
gac
cess
ori
es,
kn
itte
d o
r…
Art
icle
s o
f ap
par
el a
nd
clo
thin
gac
cess
ori
es,
no
t kn
itte
d o
r…
Wad
din
g, f
elt
and
no
nw
ove
ns;
spe
cial
yar
ns;
tw
ine,
co
rdag
e,…
Man
-mad
e st
aple
fib
res
Man
-mad
e fi
lam
en
ts; s
trip
an
dth
e lik
e o
f m
an-m
ade
text
ile…
Car
pe
ts a
nd
oth
er t
ext
ile f
loo
rco
veri
ngs
Kn
itte
d o
r cr
och
ete
d f
abri
cs
Wo
ol,
fin
e o
r co
arse
an
imal
hai
r; h
ors
eh
air
yarn
an
d…
Spe
cial
wo
ven
fab
rics
; tu
fte
dte
xtile
fab
rics
; lac
e; t
apes
trie
s;…
Imp
regn
ated
, co
ated
, co
vere
do
r la
min
ate
d t
ext
ile f
abri
cs;…
Silk
Oth
er v
eget
able
tex
tile
fib
res;
pap
er y
arn
an
d w
ove
n f
abri
cs…
'52 '63 '61 '62 56 '55 '54 '57 '60 '51 58 '59 '50 '53
Annual growth in value between 2013-2017, %, p.a.
Share in Pakistan's exports, %
Equivalent ad valorem tariff faced by Pakistan

Electronic Research Journal of Social Sciences and Humanities Vol 1: Issue IV
www.eresearchjournal.com Oct - Dec 2019
27
It is important for Pakistan to realize its potentials in exports in order to renegotiate the
CPFTA with the Chinese Government. Pakistan has potential to increase its exports of articles of
apparel knitted/crotched and not knitted or crotched, but there are some limitations to it. Products
from HS 61 and HS 62, contributed 31% and 23% to the exports but face ad Vole rum Tariff of 7
and 9 respectively that makes the products of Pakistan uncompetitive in terms of prices. HS-54
Man-made filaments; strip and the like of man-made textile materials, have contributed 73% to the
total exports but are low value-added products having low value in the international market.
However, as per the findings of this report, Pakistan must focus on developing its textile
sector so that it can add positively to the growth of trade flows. Changes in tastes and preferences
have been experienced all around the globe. Hence, consumers are more interested in products
made of man-made fiber but the exports of Pakistan are based upon cotton alone.
Therefore, Pakistan needs to renegotiate in the second phase of CPFTA, that China must
offer the matching concessions that it gives to its ASAEN member states. This would help Pakistan
in gaining value for its exports by availing the price cuts. Secondly, Pakistan itself needs to
establish its export base. The country’s exports heavily rely on a handful of products relating to
few categories specially cotton, rice, leather and such other goods.
Figure 8: 52051200 Single Cotton Yarn
The diagram above shows the trend of one of the major exports of Pakistan to China,
Product Code, 52051200 Single Cotton yarn. The value has increased since 2007 up until 2013
and then significantly decreased after 2013.
Similarly the exports of Pakistan to the rest of the world have also decreased since 2013
due to the fall in overall production of cotton yarn in the country. The impulsiveness in the supply
0
200000
400000
600000
800000
1000000
1200000
1400000
1600000
Val
ue
in 2
00
7V
alu
e in
20
08
Val
ue
in 2
00
9V
alu
e in
20
10
Val
ue
in 2
01
1V
alu
e in
20
12
Val
ue
in 2
01
3V
alu
e in
20
14
Val
ue
in 2
01
5V
alu
e in
20
16
Val
ue
in 2
00
7V
alu
e in
20
08
Val
ue
in 2
00
9V
alu
e in
20
10
Val
ue
in 2
01
1V
alu
e in
20
12
Val
ue
in 2
01
3V
alu
e in
20
14
Val
ue
in 2
01
5V
alu
e in
20
16
Pakistan's exports to China Pakistan's exports to world
'52051200 Single cotton yarn, of uncombed fibres, containing >= 85% cotton by weight and with a linear ...
'52051200 Single cotton yarn, ofuncombed fibres, containing >=85% cotton by weight and witha linear ...

Electronic Research Journal of Social Sciences and Humanities Vol 1: Issue IV
www.eresearchjournal.com Oct - Dec 2019
28
of cotton yarn from Pakistan has been crammed by India and Vietnam resulting in the decline in
imports from Pakistan that China makes.
Figure 9: HS-62 Articles of apparel and Clothing Accessories not knitted/crotched
The diagram shows details of the top three textile exporting categories to China. Products
relating to the HS code 6203 experienced high annual growth in value (23%) between 2013-17.
However, these top three categories have been imposed high equivalent ad valorem tariffs by
China making Pakistan’s exports less competitive in terms of prices. Products with product code
6201, 6204 and 6203 face 9, 11 and 8 equivalent ad valorem tariffs respectively.
Annual growth invalue between
2013-2017, %, p.a.
Share in Pakistan'sexports, %
Equivalent advalorem tariff faced
by Pakistan
'6210 Garments made up of feltor nonwovens, whether or not
impregnated, coated, covered orlaminated; ...
5 9
'6204 Women's or girls' suits,ensembles, jackets, blazers,
dresses, skirts, divided skirts,trousers, ...
-10 1 11
'6203 Men's or boys' suits,ensembles, jackets, blazers,
trousers, bib and brace overalls,breeches ...
45 1 8
-20
-10
0
10
20
30
40
50
Product: 62 Articles of apparel and clothing accessories, not knitted or crocheted

Electronic Research Journal of Social Sciences and Humanities Vol 1: Issue IV
www.eresearchjournal.com Oct - Dec 2019
29
Figure 10: HS-61 Articles of apparel and clothing accessories, knitted/crotched
The table and the graphs show that the annual growth in value between 2013-2017 for
article of apparel and clothing accessories knitted or crotched (HS-61) have remained significantly
high which is good for the overall trade flows for Pakistan. However, the tariffs faced are equally
high resulting in the loss of export competitiveness and lower exports bills.
The Emerging Area of Technical Textiles:
According to the Textiles Policy 2014-19, the area of technical textiles is the new emerging
market and a potential waiting to be tapped upon. Technical textiles include textiles related to
fields such as geo-tech, sport-tech and medi-tech. Pakistan’s exports for Special garments for
professional, sporting or other purposes, n.e.s., knitted or crocheted HS-6114 grew by 56% from
2013-17 but faced enormous equivalent ad valorem tariff of 14. Pakistan needs to negotiate with
China to reduce or eliminate the tariff on this product line in order to achieve the export potential
in this yet untapped area.
6103 '6109 '6110 '6115 '6104 '6105 '6116 '6106 '6112 '6102 '6114
Annual growth in value between2013-2017, %, p.a.
43 96 27 41 23 -10 37 36 33 56
Share in Pakistan's exports, % 1 1 1 1 2 0 0 0 1 2 0
Equivalent ad valorem tariff facedby Pakistan
9 9 0 9 8 13 12 8 9 12 14
-20
0
20
40
60
80
100
120
Product: 61 Articles of apparel and clothing accessories, knitted or crocheted

Electronic Research Journal of Social Sciences and Humanities Vol 1: Issue IV
www.eresearchjournal.com Oct - Dec 2019
30
China’s Trade with Pakistan and ASEAN Countries:
China has signed multiple Free Trade Agreements with many other countries specially
ASEAN nations. The tariff cuts that China offers to ASEAN members are way more than those
given to Pakistan. Hence, as a result a major chunk of Pakistan’s previous markets have now been
captured by the ASEAN nations. For example, under FTA 3.5% duty is charged by China from
Pakistan on the import of cotton yarn. However, India is also charged the same even when there is
no preferential treaty between India and China (Ali, 2018).
Summary of Findings:
This research examines the trade flows of Pakistan with its most important Strategic partner
China, after they both signed a bilateral Free Trade Agreement in 2006 which came into effect in
2007. Pakistan has close and strong allies with China not only strategically but economically and
financially as well. China being the 2nd largest economy and with a population of 1.3 billion is the
global exporting and manufacturing giant. Growth in exports has played a vital role in developing
China and transforming it into a gigantic economy.
Pakistan’s present trade imbalance with China stand at $12 billion dollars and it is likely
to increase even further because of the heavy amount of machinery that is being imported by
Pakistan for the China-Pakistan Economic Corridor (CPEC). Pakistan’s main exports to china are
low-value added goods and are concentrated on few products and categories. According to
Ministry of Commerce, the exports made to China are subjugated to primary goods as well as
intermediate goods rather than finished and high value-added goods. 74% of food items and 40%
products from the textile group constitute of primary commodities that are exported to China.
The main aim of this report is to analyze the impact that CPFTA had on the industry of
Pakistan, particularly the Textile sector and Ready-Made Garments. The researchers developed
two models for econometric analysis. The first model intends to analyze the impact of Exports to
China on the growth in trade flows of Pakistan. The second model proposes to assess the impact
of the exports of Textile Sector as well as the exports of Ready-Made Garments to China on the
growth in trade flows of Pakistan. The tests used in order to test the hypothesis were Unit Root
ADF Test, to test the stationarity of data, Correlation Analysis, Pearson Correlation, Multi-Linear
Regression Model, and Co-Integration Test. The study finds that the exports of Pakistan to China,
do not have a significant impact on the growth in trade flows of Pakistan. However, the exports of
Textile Sector have a significant impact on the trade flows while the exports of Ready-made
Garments do not have much to contribute to the trade flows of Pakistan, hence remains an
insignificant variable.
The findings of the report can be justified by a number of statistics. First, China’s share in
Pakistan’s exports is 7%, however the annual growth in the value of exports from 2013-2017
remained -14%. There was a decrease of 18% recorded in the export of cotton (HS-52) only.
However, articles of apparels, knitted/crotched as well as not knitted or crotched contributes only
1% to Pakistan’s exports to China. The contribution of Readymade garments in the exports is also
very low.

Electronic Research Journal of Social Sciences and Humanities Vol 1: Issue IV
www.eresearchjournal.com Oct - Dec 2019
31
Research Implications:
The China Pakistan Free Trade Agreement was signed for the purpose of gaining maximum
advantage from free trade but the results have not been fruitful. This research will help the policy
makers, exports, importers, manufacturers, the business community specially The Federation of
Pakistan Chamber of Commerce and Industry, the need and requirements of new and innovative
production methods. Albeit, Pakistan is blessed with numerous resources, but according to the
findings of this report export competitiveness can only be achieved once value added objective is
achieved. The second phase of CPFTA is yet to be signed. Before signing that the Government of
Pakistan must look into the prospective sectors identified in this report and work on them.
Recommendations:
Development of Textile sector cannot be achieved without eliminating the power outages.
The main reason behind not achieving the full potential of the textile sector is the power crises.
Moreover, poor infrastructure, lack of vocational training, obsolete technology and stagnation of
major economies since last few years especially China and EU have adversely affected the output
of and demand for Pakistan’s products.
In order to make the second phase of negotiation between Pak-China FTA successful and
end it in the favor of Pakistan, it is important to recognize that Pakistan has high rates of tariffs
being charged by its most important strategic and export partner China. Pakistan should negotiate
that China charges the same tariff rates that it does from its ASEAN, Association of South-East
Asian Nations, especially from Pakistan’s top competitors India, Bangladesh and Vietnam in order
to protect the Margin of Preference.
However, in order to reduce the trade deficit with China Pakistan should not only look at
the reduction of Tariff rates as the ultimate solution. Pakistan itself should recognize and establish
potentials by improving and working on multiple factors such as providing power supply to the
textile sector, product innovation, higher value-added goods, training and development of the work
force, proper infrastructure, taking care of consumer preferences, working on marketing channels
and also taking care of the costs of transportation.
References
Ali, F. (2018). Not a Fair Deal. Business Recorder. Retrieved from
https://fp.brecorder.com/2018/02/20180210342629/
Annual Report (2015), Pakistan and China FTA, Ministry of Textile Industry, Government of
Pakistan
Bryman, A., & Bell, E., (2011). Business research methods. Oxford: Oxford University Press.
Deardorff, A. V. (1998). Determinants of bilateral trade: does gravity work in a neoclassical world?
The Regionalization of the World Economy, 7–32. Retrieved from
http://www.nber.org/books/fran98-1.

Electronic Research Journal of Social Sciences and Humanities Vol 1: Issue IV
www.eresearchjournal.com Oct - Dec 2019
32
Ekanayake, E. M., Mukherjee, A., & Veeramacheneni, B. (2010). Trade blocks and the gravity
model: a study of economic integration among Asian developing countries. Journal of
Economic Integration, 25(4), 627-643. view at Google scholar / view at publisher
F. Z. (2018, January 25). PBC expects $3.3 b rise in Pakistan's exports to China. The Express
Tribune. Retrieved June 14, 2018, from http://tribune.com.pk/story/1617165/2-pbc-
expects-3-3b-rise-pakistans-exports-china/
International Journal of Asian Social Science ISSN(e): 2224-4441/ISSN(p): 2226-5139 URL:
www.aessweb.com International Journal of Asian Social Science, 2017, 7(1): 45-53 46.
International Trade Center (ITC) online sources, http://www.intracen.org
Irshad, Muhammad Saqib & Xin, Qi. (2015). Pakistan-China Free Trade Agreement (PCFTA)
Treaty Model: Capability, Prospects and Disputes. Academic Research International. 6.
53-60. 10.2139/ssrn.2690798. Retrieved January 4, 2019, from
https://www.researchgate.net/publication/288838919_PakistanChina_Free_Trade_Agree
ment_PCFTA_Treaty_Model_Capability_Prospects_and_Disputes
Irshad, Muhammad Saqib & Xin, Qi. (2017). Determinants of Exports Competitiveness: An
Empirical Analysis through Revealed Comparative Advantage of External Sector of
Pakistan. Asian Economic and Financial Review. 6. 623-633.
10.18488/journal.aefr.2017.76.623.633.
Irshad, Muhammad Saqib & Xin, Qi. (2018). An Empirical Analysis of Pakistan's Bilateral Trade
and Trade Potential with China: A Gravity Model Approach. 6. 1-18.
10.1080/23322039.2018.1504409.
Irshada, M. S., Xinb, Q., Shahriarc, S., & Alia, F. (2018). Asian Journal of Empirical
Research. Asian Journal of Empirical Research, 8(4), 124-139.
J. K., & Malik, M. H. (2017). Dynamics of Pakistan's Trade Balance with China. SBP Staff Notes.
Retrieved:http://www.sbp.org.pk/publications/staff-notes/Pak-China-trade-balance.pdf
Khan, M. Z. (2017, October 3). A Multitude of Reasons for the Fall in Exports. DAWN. Retrieved
June 14, 2018, from http:/www.dawn.com/news/1361399
Krugman, P.R. and M. Obstfeld, 2009. International economics theory and policy. (D.Clinton, Ed).
8th Edn., Boston: Pearson International Edition.
Linder, S. B. (1961). An essay on trade and transformation. New York: John Wiley and Son. view
at Google scholar / view at publisher
Malik, A. (2010). Demand for textile and clothing exports of Pakistan. Working Papers &
Research Reports, RR-No.
Ministry of Commerce. (n.d.). doi:file:///C:/Users/Personal/Downloads/Pak-
China_FTA_Agreement.pdf
Electronic Research Journal of Social Sciences and Humanities Vol 1: Issue IV
www.eresearchjournal.com Oct - Dec 2019
33
Ministry of Textile Industry, Research Development Advisory Cell (2007). Pakistan-china free
trade agreement analytical report on textiles and clothing. Retrieved from
:https://www.rdacell.com/Documents/Pakistan-ChinaFree.pdf
Ministry Of Textile Industry. (2015). Textiles Policy 2014-19 (pp. 2-22). The Government of
Pakistan
Mustafa, A., & Qayyum, A. (2017). Impact of Technical Barriers to Trade on Trade between China
and Pakistan. Pakistan Development Review, 56(4), 235-251.
S. R. (2018, April 6). Pakistan delays FTA-II signing with China at eleventh hour. The Express
Tribune. Retrieved January 4, 2019, from https://tribune.com.pk/story/1678534/2-
pakistan-delays-fta-ii-signing-china-eleventh-hour/
S., & N. B. (2017, September 21). Trade Deficit with China widens to US$12 b. Business
Recorder. Retrieved June 14, 2018, from
https://fp.brecorder.com/2017/09/20170921219893/
Shabir, S. and R. Kazmi, 2007. Economic effects of the recently signed Pak-China free trade
agreement. Lahore Journal of Economics, 12(Special Edition): 174- 202
Suanders, M., Thornhill, A. and Lewis, P. (2009) Research methods for business students, New
Jersey: Pearson
Trade Development Authority of Pakistan. (2016). Ready Made Garments Sectoral
Competitiveness and Value Chain Analysis. Retrieved June 11, 2018, from
http://trtapakistan.org/wp-content/uploads/2016/05/readymade-garments.pdf
Tumbarello, P. (2006, June). Are Regional Trade Agreements in Asia Stumbling or Building
Blocks? Some Implications for the Mekong Countries. In seminar on Accelerating
Development in the Mekong Region—the Role of Economic Integration, Siem Reap,
Cambodia, June (pp. 26-27). Retrieved January 4, 2019, from
https://scholar.googleusercontent.com/scholar?q=cache:YI3SprxQ9NoJ:scholar.google.c
om/ pakistan-China Free trade agreements&hl=en&as_sdt=0,5.
W. J., & A. M. (2002). Managing Competitive Advantage: The Values of National Strategy,
Adding Value: Building Value-Addition Alliances, Backward Linkages In The Textile
And Clothing Sector of Pakistan. Executive Forum on National Export Strategies.
Retrieved January 4, 2019, from
http://www.intracen.org/uploadedFiles/intracen.org/Content/Exporters/Sectoral_Informat
ion/Manufactured_Goods/Textiles/Backward Linkages in the Textile and Clothing Sector
of Pakistan.pdf