impact of prescription drug costs on health insurance premiums · 12/31/2018 · cic §...
TRANSCRIPT

Impact of Prescription Drug Costs on Health Insurance Premiums
Report for Calendar Year 2017 Experience
Pursuant to California Insurance Code § 10123.205(b)
California Department of Insurance
December 31, 2018

2
Table of Contents
I – Executive Summary II – Overview of the Filings III – Summary of the Filings IV – Glossary

3
I – Executive Summary This report summarizes the California Department of Insurance (CDI) findings regarding prescription drug costs for commercial health insurance policies for the 2017 calendar year, based on data provided to the department pursuant to California Insurance Code (CIC) § 10123.205(a).1 This report demonstrates the overall impact of drug costs on health insurance premiums pursuant to CIC § 10123.205(b).2 Definitions: Definitions and sources of the terms used can be found in the glossary, but the following terms are used frequently throughout the report.
Total Annual Spending: Total payments made under the policy to health care providers on behalf of covered members, including payments made by issuers and member cost sharing = Allowed Dollar Amount. Also referred to as Annual Plan Spending. In this report, the terms “Prescription Drug Spending” and “Medical Claim Spending” are used to describe these components of Total Annual Spending.
Prescription Drug Spending: Total payments made under the policy for prescription drugs on behalf of covered members, including payments made by insurers and member cost sharing = Allowed Dollar Amount.
Medical Claim Spending: Total payments made under the policy for medical claims submitted by health care providers on behalf of covered members, including payments made by issuers and member cost sharing = Allowed Dollar Amount.
Member Cost Sharing: Total payments made by members under the policy for prescription drugs, including copays, deductibles, and coinsurance = Allowed Dollar Amount – Paid Plan Cost.
Member Months: The total number of lives, including dependents, insured on a pre-specified day of each month of the reporting period.
Insurer Spending: Allowed Dollar Amount minus the member cost-sharing amount = Incurred Costs. (When used in the context of drug costs, this term does not include the effect of any Manufacturer Rebate.) Also known as Paid Plan Claim or Paid Plan Cost.
1 CIC § 10123.205(a) (1) A health insurer that reports rate information pursuant to Section 10181.3 or 10181.45 shall report the information described in paragraph (2) to the department no later than October 1 of each year, beginning October 1, 2018. (2) For all covered prescription drugs, including generic drugs, brand name drugs, and specialty drugs dispensed at a plan pharmacy, network pharmacy, or mail order pharmacy for outpatient use, all of the following shall be reported: (A) The 25 most frequently prescribed drugs. (B) The 25 most costly drugs by total annual plan spending. (C) The 25 drugs with the highest year-over-year increase in total annual plan spending. 2 CIC § 10123.205(b) The department shall compile the information reported pursuant to subdivision (a) into a report for the public and legislators that demonstrates the overall impact of drug costs on health care premiums. The data in the report shall be aggregated and shall not reveal information specific to individual health insurers.

4
Filings: Covered prescription drugs, include all covered drugs dispensed at a plan pharmacy, network pharmacy, or mail order pharmacy for outpatient use, and include the following drug categories: generic, brand name, and specialty. CDI-regulated insurers reported to the department the 25 most frequently prescribed drugs, the 25 most costly drugs by total annual spending, and the 25 drugs with the highest year-over-year increase in total annual spending. This report aggregates the data provided across all insurers and does not reveal any insurer-specific information. Cost and Utilization For All Prescription Drugs: For the 2017 calendar experience year, total combined annual prescription drug spending (insurer payment plus member cost-share), total insurer costs (insurer payment not including cost share), and the total number of prescriptions for all generic, brand name, and specialty drugs for all market segments (individual, small group, and large group) are summarized in Table 1:
All Prescription Drugs Generic Brand Name Specialty Total
Total Prescription Drug Spending ($ million) $258.9 $334.8 $636.3 $1,230.0
Total Prescription Drug Spending by Insurers ($ million) $172.6 $271.3 $605.8 $1,049.7
Total Number of Prescriptions (thousand) 8,861 1,417 270 10,548
Table 1
0%
20%
40%
60%
80%
100%
Total Annual Plan Spending Total Number of Prescriptions
All Prescription Drugs
Generic
Brand Name
Specialty

5
Utilizing the information from Table 1, the chart above shows how prescription drug spending and utilization differs by drug type: generic drugs comprise 84% of prescriptions and 21% of spending while specialty drugs comprise 3% of prescriptions and 52% of spending. Costs In Relation To Premiums for All Prescription Drugs: For 2017, for comprehensive medical plans with pharmacy benefits, total and per member per month (PMPM) costs for prescription drugs, medical claims, administrative expenses, etc., and health insurance premium are included in Table 2:
Component of Premium Total Dollars ($ million) PMPM
Prescription Drug Spending by Insurers $1,049.7 $81.18
Medical Claim Spending by Insurers $4,710.5 $364.28
Manufacturer Rebate Paid to Insurers -$186.2 -$14.40
Administrative Expenses Related to Medical Claims and Prescription Drug Coverage $650.0 $50.26
Other Expenses Related to Medical Claims and Prescription Drug Coverage3 $123.0 $9.51
Total Health Insurance Premium $6,346.9 $490.84
Total Member Months4 12,931,000
Table 2 Table 2 includes aggregated information that is based upon submissions from all insurance companies to CDI and includes data from all fully-insured policies in the individual, small group, and large group markets.
3 Other expenses include federal and state taxes and licensing or regulatory fees, risk margin, and profit.

6
Year-Over-Year Changes In Costs For All Prescription Drugs: Comparisons of PMPM costs between 2016 and 2017 for comprehensive medical plans that include pharmacy benefits are shown in Table 3:
Component of Premium PMPM (2017)
As a % of Premium
(2017)
PMPM (2016)
As a % of Premium
(2016) Prescription Drug Spending by Insurers $81.18 16.5% $76.48 16.3%
Medical Claim Spending by Insurers $364.28 74.2% $338.49 72.1%
Manufacturer Rebate -$14.40 -2.9% -$12.55 -2.7%
Administrative Expenses Related to Medical Claims and Prescription Drug Coverage
$50.26 10.2% $50.38 10.8%
Other Expenses Related to Medical Claims and Prescription Drug Coverage5
$9.51 1.9% $16.66 3.5%
Total Health Insurance Premium $490.84 100% $469.47 100%
Total Member Months 12,931,000
13,340,000
Table 3 From 2016 to 2017, the PMPM prescription drug cost, medical claim cost, and premium increased. Manufacturer rebates also increased. While the rebate serves to reduce the prescription drug cost (and thus is listed as a negative number in the above table), its increase may also indicate an increase in utilization of both brand name and specialty drugs, as there are typically no rebates paid on generic drugs.
All Prescription Drugs 2017 2016
Prescription Cost (Net of Rebates)
-as a % of Paid Medical + Rx Cost 15.5% 15.9%
-as a % of Total Health Care Premium 13.6% 13.6%
Table 4 As shown in Table 4, prescription drug costs, net of manufacturer rebates, are stable when measured as a percent of medical and drug cost and when measured as a percent of health
5 Other expenses include federal and state taxes and licensing or regulatory fees, risk margin, and profit.

7
insurance premiums. However, Table 4 measures the net cost borne by health insurers, but is not a measure of member cost sharing. Prescription Drug Costs PMPM for All Prescription Drugs: Total annual prescription spending, insurer spending, and member cost-sharing for all prescription drugs on a PMPM basis are summarized in Table 5:
All Prescription Drugs Generic (PMPM)
Brand Name
(PMPM)
Specialty (PMPM)
Total (PMPM)
Total Prescription Drug Spending $20.02 $25.89 $49.21 $95.12
Total Member Cost Sharing $6.68 $4.91 $2.36 $13.94 Total Insurer Prescription Drug Spending $13.35 $20.98 $46.85 $81.18
Table 5
In Table 5 member cost sharing for prescription drugs is 15% overall, measured as a percent of total annual prescription drug spending before rebates to insurers. Member cost sharing increases to 21% if measured as a percent of total annual prescription drug spending net of rebates. Separate rebate information for generic, brand name, and specialty drugs is not available. Prescription Drug Costs Per Script for All Prescription Drugs: Total annual prescription drug spending, paid prescription drug insurer spending, and member cost-sharing for all prescription drugs on a per script basis are summarized in Table 6. CIC § 10123.193 limits member cost-sharing for prescription drugs.6
6 CIC § 10123.193(f) (1) With respect to an individual or group policy of health insurance subject to Section 10112.28, the copayment, coinsurance, or any other form of cost sharing for a covered outpatient prescription drug for an individual prescription for a supply of up to 30 days shall not exceed two hundred fifty dollars ($250), except as provided in paragraphs (2) and (3). (2) With respect to products with actuarial value at or equivalent to the bronze level, cost sharing for a covered outpatient prescription drug for an individual prescription for a supply of up to 30 days shall not exceed five hundred dollars ($500), except as provided in paragraph (3). (3) For a policy of health insurance that is a “high deductible health plan” under the definition set forth in Section 223(c)(2) of Title 26 of the United States Code, paragraphs (1) and (2) of this subdivision applies only once an insured’s deductible has been satisfied for the year.

8
All Prescription Drugs Generic
(Per Script)
Brand Name (per
Script)
Specialty (per
Script)
Total (per Script)
Total Prescription Drug Spending $29.22 $236.35 $2,361.16 $116.62
Member Cost Sharing $9.74 $44.80 $113.03 $17.09
Insurer Prescription Drug Spending $19.48 $191.55 $2,248.12 $99.53
Table 6 The 25 Most Frequently Prescribed Drugs: For all market segments combined for the 2017 experience year, information for the 25 most frequently prescribed prescription drugs is summarized in Tables 7, 8, 9 and 10:
25 Most Frequently Prescribed Generic Brand Name Specialty Total
Total Prescription Drug Spending ($ million) $48.1 $131.2 $248.3 $427.6
Insurer Prescription Drug Spending ($ million) $19.9 $76.3 $234.0 $330.2
Total Number of Prescriptions (thousand) 3,360 716 135 4,212
Table 7
25 Most Frequently Prescribed Drugs All Other
Prescribed Drugs
Total
All Drugs Generic Brand Name
Specialty Overall
Total Percentage of Prescription Drugs 31.9% 6.8% 1.3% 39.9% 60.1% 100.0%
Total Annual Spending on Prescription Drugs
3.9% 10.7% 20.2% 34.8% 65.2% 100.0%
Impact on Total Health Insurance Premiums
0.3% 1.2% 3.7% 5.2% 11.3% 16.5%
Table 8 Tables 7 and 8 detail prescription drug cost by type and utilization. Prescription drug cost is before any rebates are subtracted from the cost. Separate rebate information for generic, brand name, and specialty drugs is not available.

9
25 Most Frequently Prescribed Generic (PMPM)
Brand Name
(PMPM)
Specialty (PMPM)
Total (PMPM)
Total Prescription Drug Spending) $3.72 $10.15 $19.20 $33.07
Member Cost Sharing $2.18 $4.24 $1.10 $7.53
Insurer Prescription Drug Spending $1.54 $5.90 $18.10 $25.54
Table 9
25 Most Frequently Prescribed Generic
(Per Script)
Brand Name (per
Script)
Specialty (per
Script)
Total (per Script)
Total Prescription Drug Spending $14.33 $183.18 $1,838.84 $101.54
Total Member Cost Sharing $8.39 $76.60 $105.63 $23.11 Insurer Prescription Drug Spending $5.93 $106.58 $1,733.20 $78.42
Table 10 Tables 9 and 10 show that member cost sharing constitutes approximately 23% of drug cost. The percentage is expected to be higher if rebate amounts are taken into consideration. The 25 Most Costly Drugs by Total Annual Spending: For all market segments combined for the 2017 experience year, information for the 25 most costly drugs by total spending is summarized in Tables 11, 12, 13 and 14:
25 Most Costly Generic Brand Name Specialty Total
Total Prescription Drug Spending ($ million) $80.4 $152.7 $327.9 $561.0
Insurer Prescription Drug Spending ($ million) $54.5 $130.3 $312.9 $497.7
Total Number of Prescriptions (thousand) 2,131 580 97 2,808
Table 11

10
25 Most Costly Drugs All Other
Prescribed Drugs
Total
All Drugs Generic Brand Name
Specialty Overall
Total Percentage of Prescription Drugs 20.2% 5.5% 0.9% 26.6% 73.4% 100.0%
Total Annual Spending on Prescription Drugs 6.5% 12.4% 26.7% 45.6% 54.4% 100.0%
Impact on Total Health Insurance Premiums 0.9% 2.1% 4.9% 7.8% 8.7% 16.5%
Table 12 For Tables 11 and 12, note that the prescription drug cost is before any rebates are subtracted from the cost. Separate rebate information for generic, brand name, and specialty drugs is not available.
25 Most Costly Generic (PMPM)
Brand Name
(PMPM)
Specialty (PMPM)
Total (PMPM)
Total Prescription Drug Spending $6.22 $11.81 $25.36 $43.38
Total Member Cost Sharing $2.00 $1.73 $1.16 $4.90
Insurer Prescription Drug Spending $4.22 $10.08 $24.20 $38.49
Table 13
25 Most Costly Generic
(Per Script)
Brand Name (per
Script)
Specialty (per
Script)
Total (per Script)
Total Prescription Drug Spending $37.72 $263.43 $3,374.55 $133.20
Total Member Cost Sharing $12.14 $38.70 $154.66 $15.04 Insurer Prescription Drug Spending $25.58 $224.74 $3,219.89 $118.16
Table 14 In Table 13, note that member cost sharing constitutes approximately 11% of drug cost. However, Tables 13 and 14 show that for costly drugs, members pay a smaller share, probably due to copay designs and limits on out-of-pocket maximum.

11
The 25 Prescription Drugs with the highest 2017-over-2016 Increase in Total Annual Spending: For all market segments combined, information for the 25 drugs with the highest 2017-over-2016 increases is summarized in Table 15:
25 with Highest Increase Generic ($ million)
Brand Name ($ million)
Specialty ($ million)
Total ($ million)
2017 Total Annual Prescription Drug Spending
$45.1 $102.3 $235.0 $382.4
2016 Total Annual Insurer Prescription Drug Spending
$21.5 $64.1 $132.1 $217.7
Table 15 The names of the drugs with the highest increases are listed in Tables 22-24.

12
II – Overview of the Filings Information received from the companies The findings presented here are based on CDI’s review of data received from insurance companies. We have accepted the submitted data to be accurate without conducting an independent audit or verification of the accuracy of the submitted data. We have no reason to assume the data is not accurate, but we cannot guarantee the accuracy and integrity of the submitted data. As much as possible, we have verified the data to be internally consistent, and when we have found inconsistencies, we have requested and received appropriate corrections and explanations from the companies. Background to the current filings This year is the first year insurance companies must report prescription drug data to the department pursuant to CIC § 10123.205. The department received filings from all insurers required to report prescription drug data.
13
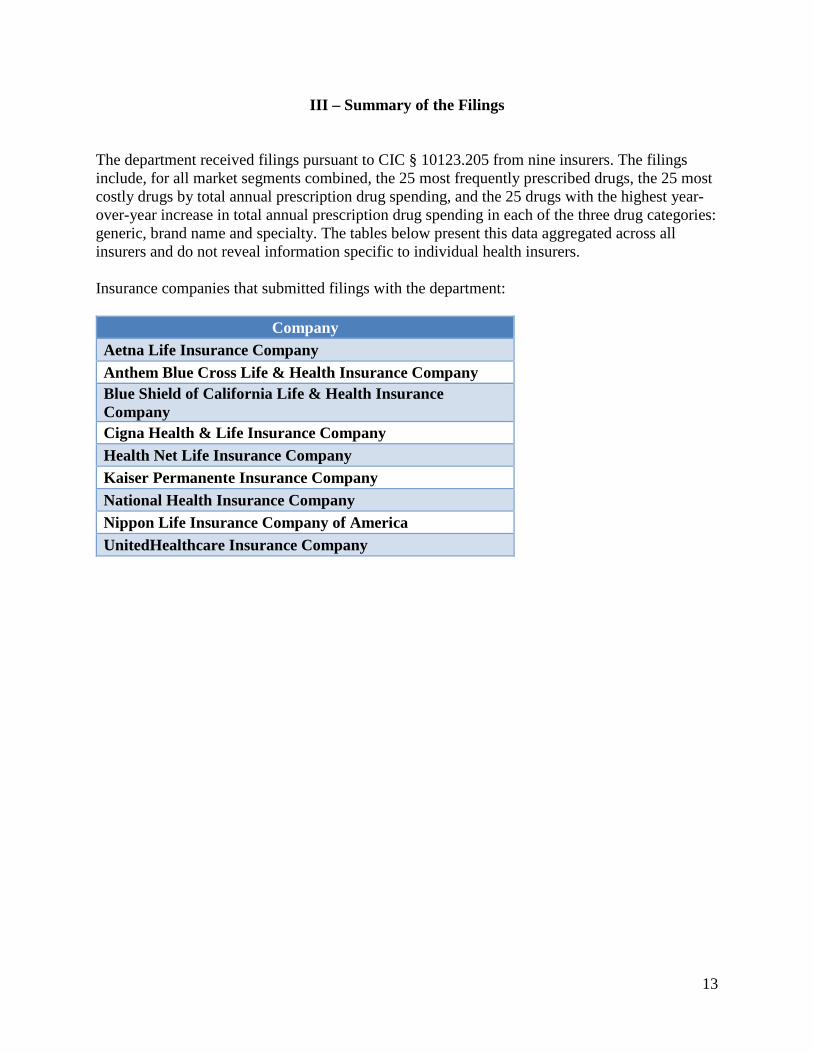
III – Summary of the Filings The department received filings pursuant to CIC § 10123.205 from nine insurers. The filings include, for all market segments combined, the 25 most frequently prescribed drugs, the 25 most costly drugs by total annual prescription drug spending, and the 25 drugs with the highest year-over-year increase in total annual prescription drug spending in each of the three drug categories: generic, brand name and specialty. The tables below present this data aggregated across all insurers and do not reveal information specific to individual health insurers. Insurance companies that submitted filings with the department:
Company Aetna Life Insurance Company Anthem Blue Cross Life & Health Insurance Company Blue Shield of California Life & Health Insurance Company Cigna Health & Life Insurance Company Health Net Life Insurance Company Kaiser Permanente Insurance Company National Health Insurance Company Nippon Life Insurance Company of America UnitedHealthcare Insurance Company

14
The 25 Most Frequently Prescribed Drugs: For all market segments combined, the following tables aggregate the 25 most frequently prescribed generic, brand name, and specialty drugs across all insurers. The 25 Most Frequently Prescribed Generic Drugs: Rank Prescription Drug Name Therapy Class
1 ATORVASTATIN CALCIUM Cardiovascular Agents
2 LEVOTHYROXINE SODIUM Hormonal Agents, Stimulant/Replacement/Modifying (Thyroid)
3 LISINOPRIL Cardiovascular Agents 4 AMLODIPINE BESYLATE Cardiovascular Agents 5 AZITHROMYCIN Antibacterials 6 AMOXICILLIN Antibacterials 7 LOSARTAN POTASSIUM Cardiovascular Agents 8 OMEPRAZOLE Gastrointestinal Agents 9 SIMVASTATIN Cardiovascular Agents 10 ALPRAZOLAM Anxiolytics 11 HYDROCHLOROTHIAZIDE Cardiovascular Agents 12 METFORMIN HCL Blood Glucose Regulators 13 SERTRALINE Antidepressants 14 ESCITALOPRAM OXALATE Antidepressants 15 ZOLPIDEM TARTRATE Sleep Disorder Agents 16 MONTELUKAST SODIUM Respiratory Tract/Pulmonary Agents 17 GABAPENTIN Anticonvulsants 18 PREDNISONE Anti-inflammatory Agents
19 AMOXICILLIN AND CLAVULANATE POTASSIUM Antibacterials
20 METOPROLOL SUCCINATE Cardiovascular Agents 21 METFORMIN HYDROCHLORIDE Blood Glucose Regulators 22 FLUOXETINE HCL Antidepressants
23 HYDROCODONE POLISTIREX AND CHLORPHENIRAMINE POLISTIREX PENNKINETIC
Analgesics
24 HYDROCODONE BITARTRATE AND ACETAMINOPHEN Analgesics
25 HYDROCODONE/APAP Analgesics Table 16

15
The 25 Most Frequently Prescribed Brand Name Drugs: Rank Prescription Drug Name Therapy Class
1 SYNTHROID Hormonal Agents – Thyroid 2 PROAIR Respiratory Tract Agents 3 VENTOLIN Respiratory Tract Agents 4 VYVANSE Central Nervous System Agents
5 LO LOESTRIN FE Hormonal Agents, Stimulant/Replacement/Modifying (Sex Hormones/Modifiers)
6 NUVARING Hormonal Agents – Sex Hormones/Modifiers
7 ONETOUCH REVOLUTION Blood Glucose Regulators
8 ARMOUR THYROID Hormonal Agents, Stimulant/Replacement/Modifying (Thyroid)
9 ADVAIR Respiratory Tract Agents 10 ADDERALL Central Nervous System Agents 11 CIALIS Genitourinary Agents 12 HUMALOG Blood Glucose Regulators 13 BYSTOLIC Cardiovascular Agents 14 SYMBICORT Respiratory Tract Agents 15 QVAR Respiratory Tract Agents 16 XARELTO Blood Products 17 DEXILANT Gastrointestinal Agents 18 INVOKANA Blood Glucose Regulators 19 JANUVIA Blood Glucose Regulators 20 LANTUS SOLOSTAR Blood Glucose Regulators 21 FLUALGIA Immunological Agents 22 VIAGRA Genitourinary Agents 23 CONCERTA Central Nervous System Agents 24 LYRICA Anticonvulsants 25 SUPREP BOWEL PREP Gastrointestinal Agents
Table 17

16
The 25 Most Frequently Prescribed Specialty Drugs: Rank Prescription Drug Name Therapy Class
1 TRUVADA Antivirals 2 HUMIRA Immunological Agents 3 HUMALOG Blood Glucose Regulators 4 VICTOZA Blood Glucose Regulators
5 ANDROGEL Hormonal Agents – Sex Hormones/Modifiers
6 TRULICITY Blood Glucose Regulators 7 LIALDA Inflammatory Bowel Disease Agents 8 ENBREL Immunological Agents 9 EPINEPHRINE Cardiovascular Agents 10 SUPREP BOWEL PREP Gastrointestinal Agents 11 LATUDA Antipsychotics 12 NOVOLOG Blood Glucose Regulators 13 GENVOYA Antivirals 14 CIALIS Genitourinary Agents 15 VIAGRA Genitourinary Agents 16 VIREAD Antivirals 17 STELARA Immunological Agents 18 TRIUMEQ Antivirals 19 ATRIPLA Antivirals 20 DESCOVY Antivirals 21 COPAXONE Immunological Agents 22 RELPAX Antimigraine Agents 23 TIVICAY Antivirals 24 MESALAMINE Inflammatory Bowel Disease Agents 25 FLUARIX QUADRIVALENT Immunological Agents
Table 18

17
The 25 Most Costly Drugs by Total Annual Prescription Drug Spending: For all market segments combined, the following tables aggregate the 25 most costly generic, brand name, and specialty drugs across all insurers. (see next page)

18
The 25 Most Costly Generic Drugs by Total Annual Prescription Drug Spending: Rank Prescription Drug Name Therapy Class
1 ARIPIPRAZOLE Antipsychotics 2 ATORVASTATIN CALCIUM Cardiovascular Agents 3 ROSUVASTATIN CALCIUM Cardiovascular Agents
4 LEVOTHYROXINE SODIUM Hormonal Agents, Stimulant/ Replacement/Modifying (Thyroid)
5 DEXTROAMPHETAMINE SULFATEEXTENDED-RELEASE Central Nervous System Agents
6 CLOBETASOL PROPIONATE Hormonal Agents, Stimulant/Replacement/Modifying (Adrenal)
7 METHYLPHENIDATE HYDROCHLORIDE Central Nervous System Agents 8 DULOXETINE DELAYED-RELEASE Antidepressants
9 ESTRADIOL Hormonal Agents – Sex Hormones/Modifiers
10 METHYLPHENIDATE Central Nervous System Agents 11 BUPROPION HYDROCHLORIDEXL Antidepressants 12 EZETIMIBE Cardiovascular Agents 13 METFORMIN HYDROCHLORIDE Blood Glucose Regulators 14 DOXYCYCLINE HYCLATE Antibacterials 15 MONTELUKAST SODIUM Respiratory Tract/Pulmonary Agents 16 BUDESONIDE Respiratory Tract Agents 17 OSELTAMIVIR PHOSPHATE Antivirals 18 VALACYCLOVIR Antivirals 19 ESCITALOPRAM OXALATE Antidepressants
20
DEXTROAMPHETAMINE SACCHARATE, AMPHETAMINE ASPARTATE, DEXTROAMPHETAMINE SULFATE, AND AMPHETAMINE SULFATE [TABLET, XR]
Central Nervous System Agents
21 LIDOCAINE Anesthetics
22
DEXTROAMPHETAMINE SACCHARATE, AMPHETAMINE ASPARTATE, DEXTROAMPHETAMINE SULFATE AND AMPHETAMINE SULFATE [CAPSULE]
Central Nervous System Agents
23 ESOMEPRAZOLE MAGNESIUM Gastrointestinal Agents 24 HYDROXYCHLOROQUINE SULFATE Antiparasitics 25 METOPROLOL SUCCINATE Cardiovascular Agents
Table 19

19
The 25 Most Costly Brand Name Drugs by Total Annual Prescription Drug Spending: Rank Prescription Drug Name Therapy Class
1 VYVANSE Central Nervous System Agents 2 HUMALOG Blood Glucose Regulators 3 ADVAIR Respiratory Tract Agents 4 JANUVIA Blood Glucose Regulators 5 INVOKANA Blood Glucose Regulators 6 XARELTO Blood Products 7 LYRICA Anticonvulsants 8 ADDERALL Central Nervous System Agents
9 NUVARING Hormonal Agents – Sex Hormones/Modifiers
10 LO LOESTRIN FE Hormonal Agents, Stimulant/Replacement/Modifying (Sex Hormones/Modifiers)
11 CIALIS Genitourinary Agents 12 SYMBICORT Respiratory Tract Agents 13 LANTUS SOLOSTAR Blood Glucose Regulators 14 ELIQUIS Blood Products 15 TRUVADA Antivirals 16 DEXILANT Gastrointestinal Agents 17 JARDIANCE Blood Glucose Regulators 18 ONETOUCH REVOLUTION Blood Glucose Regulators 19 QVAR Respiratory Tract Agents 20 TRULICITY Blood Glucose Regulators 21 LEVEMIR Blood Glucose Regulators 22 CONCERTA Central Nervous System Agents 23 PROAIR Respiratory Tract Agents 24 JANUMET Blood Glucose Regulators 25 SYNTHROID Hormonal Agents – Thyroid
Table 20

20
The 25 Most Costly Specialty Drugs by Total Annual Prescription Drug Spending: Rank Prescription Drug Name Therapy Class
1 HUMIRA Immunological Agents 2 ENBREL Immunological Agents 3 TRUVADA Antivirals 4 STELARA Immunological Agents 5 COPAXONE Immunological Agents 6 HARVONI Antivirals 7 TECFIDERA Immunological Agents 8 REVLIMID Antineoplastics 9 IBRANCE Antineoplastics 10 GENVOYA Antivirals 11 TRIUMEQ Antivirals 12 HUMALOG Blood Glucose Regulators 13 GILENYA Immunological Agents 14 VICTOZA Blood Glucose Regulators 15 ATRIPLA Antivirals 16 EPCLUSA Antivirals 17 COSENTYX Immunological Agents 18 OTEZLA Immunological Agents 19 XYREM Sleep Disorder Agents 20 SPRYCEL Antineoplastics
21 ANDROGEL Hormonal Agents – Sex Hormones/Modifiers
22 LATUDA Antipsychotics 23 SIMPONI Immunological Agents 24 XOLAIR Immunological Agents 25 LIALDA Inflammatory Bowel Disease Agents
Table 21

21
The 25 Drugs with the Highest 2017-over-2016 Increase in Total Annual Spending: For all market segments combined, the following tables aggregate the 25 generic, brand name, and specialty drugs with the highest year-over-year increase across all insurers. The 25 Generic Drugs with the Highest 2017-over-2016 Increase in Total Annual Prescription Drug Spending: Rank Prescription Drug Name Therapy Class
1 EZETIMIBE Cardiovascular Agents 2 OSELTAMIVIR PHOSPHATE Antivirals
3 YUVAFEM Hormonal Agents – Sex Hormones/Modifiers
4 ATORVASTATIN CALCIUM Cardiovascular Agents 5 ATOMOXETINE Central Nervous System Agents 6 ROSUVASTATIN CALCIUM Cardiovascular Agents
7 DEXTROAMPHETAMINE SULFATEEXTENDED-RELEASE Central Nervous System Agents
8 OLMESARTAN MEDOXOMIL Cardiovascular Agents 9 METHYLPHENIDATE HYDROCHLORIDE Central Nervous System Agents 10 MESALAMINE Inflammatory Bowel Disease Agents
11 BLISOVI 24 FE Hormonal Agents, Stimulant/Replacement/Modifying (Sex Hormones/Modifiers)
12 ROSUVASTATIN Cardiovascular Agents 13 ARIPIPRAZOLE Antipsychotics 14 DESVENLAFAXINE Antidepressants 15 MYORISAN Dermatological Agents
16
DEXTROAMPHETAMINE SACCHARATE, AMPHETAMINE ASPARTATE, DEXTROAMPHETAMINE SULFATE, AND AMPHETAMINE SULFATE [TABLET, XR]
Central Nervous System Agents
17 DESVENLAFAXINE SUCCINATE Antidepressants 18 LISINOPRIL Cardiovascular Agents 19 OMEPRAZOLE Gastrointestinal Agents 20 ESCITALOPRAM OXALATE Antidepressants 21 EPINEPHRINE Cardiovascular Agents 22 CLARAVIS Dermatological Agents 23 AMLODIPINE BESYLATE Cardiovascular Agents 24 SERTRALINE Antidepressants
25 LEVOTHYROXINE SODIUM Hormonal Agents, Stimulant/Replacement/Modifying (Thyroid)
Table 22

22
The 25 Brand Name Drugs with the Highest 2017-over-2016 Increase in Total Annual Prescription Drug Spending:
Rank Prescription Drug Name Therapy Class 1 VYVANSE Central Nervous System Agents 2 JARDIANCE Blood Glucose Regulators 3 HUMALOG Blood Glucose Regulators 4 TRULICITY Blood Glucose Regulators 5 ELIQUIS Blood Products 6 TRINTELLIX Antidepressants 7 XIIDRA Ophthalmic Agents 8 LYRICA Anticonvulsants 9 BASAGLAR Blood Glucose Regulators 10 BREO ELLIPTA Respiratory Tract/Pulmonary Agents 11 SYMBICORT Respiratory Tract Agents 12 INVOKANA Blood Glucose Regulators 13 ADVAIR Respiratory Tract Agents 14 TRESIBA Blood Glucose Regulators 15 CIALIS Genitourinary Agents
16 LO LOESTRIN FE Hormonal Agents, Stimulant/Replacement/Modifying (Sex Hormones/Modifiers)
17 XARELTO Blood Products 18 ADDERALL Central Nervous System Agents 19 JANUVIA Blood Glucose Regulators 20 CONCERTA Central Nervous System Agents
21 NUVARING Hormonal Agents – Sex Hormones/Modifiers
22 QVAR Respiratory Tract Agents 23 FARXIGA Blood Glucose Regulators 24 VENTOLIN Respiratory Tract Agents 25 TRADJENTA Blood Glucose Regulators
Table 23
23
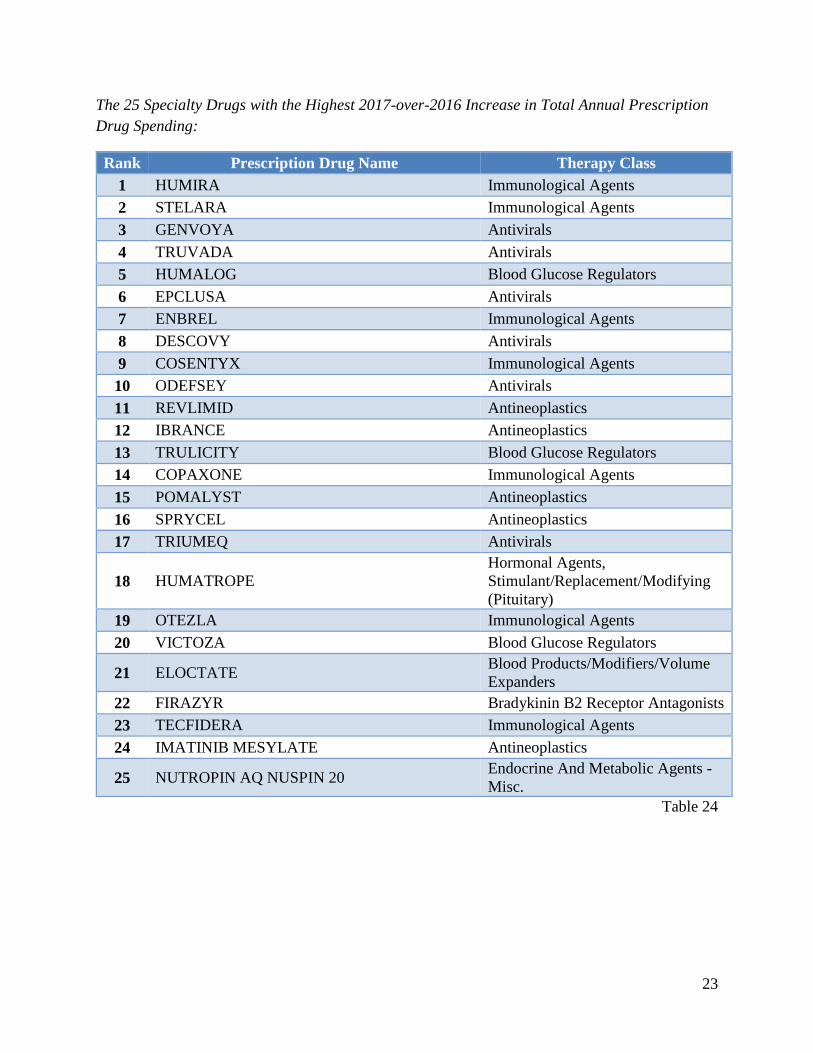
The 25 Specialty Drugs with the Highest 2017-over-2016 Increase in Total Annual Prescription Drug Spending:
Rank Prescription Drug Name Therapy Class 1 HUMIRA Immunological Agents 2 STELARA Immunological Agents 3 GENVOYA Antivirals 4 TRUVADA Antivirals 5 HUMALOG Blood Glucose Regulators 6 EPCLUSA Antivirals 7 ENBREL Immunological Agents 8 DESCOVY Antivirals 9 COSENTYX Immunological Agents 10 ODEFSEY Antivirals 11 REVLIMID Antineoplastics 12 IBRANCE Antineoplastics 13 TRULICITY Blood Glucose Regulators 14 COPAXONE Immunological Agents 15 POMALYST Antineoplastics 16 SPRYCEL Antineoplastics 17 TRIUMEQ Antivirals
18 HUMATROPE Hormonal Agents, Stimulant/Replacement/Modifying (Pituitary)
19 OTEZLA Immunological Agents 20 VICTOZA Blood Glucose Regulators
21 ELOCTATE Blood Products/Modifiers/Volume Expanders
22 FIRAZYR Bradykinin B2 Receptor Antagonists 23 TECFIDERA Immunological Agents 24 IMATINIB MESYLATE Antineoplastics
25 NUTROPIN AQ NUSPIN 20 Endocrine And Metabolic Agents - Misc.
Table 24

24
IV – Glossary Administrative Expenses/Costs: Business expenses associated with general administration, agents/brokers fees and commissions, direct sales salaries, workforce salaries and benefits, loss adjustment expenses, cost containment expenses, and community benefit expenditures. (Federal MLR definition: 45 CFR 158.160, https://www.ecfr.gov/cgi-bin/text-idx?SID=6ea1241a2b8614a67ad2f095f440d710&mc=true&node=se45.1.158_1160&rgn=div8.) Allowed Dollar Amount: Total payments made under the policy to health care providers on behalf of covered members, including payments made by issuers and member cost sharing. (Healthcare.gov Glossary, https://www.healthcare.gov/glossary/allowed-amount/.) Annual Plan Spending: Total payments made under the policy to health care providers on behalf of covered members, including payments made by issuers and member cost sharing = Allowed Dollar Amount. (Healthcare.gov Glossary, https://www.healthcare.gov/glossary/allowed-amount/.) In this report, the terms “Prescription Drug Spending” and “Medical Claim Spending” are used to describe these components of Annual Plan Spending. Biological Product: Biological products are regulated by the Food and Drug Administration (FDA) and are used to diagnose, prevent, treat, and cure diseases and medical conditions. Biological products are a diverse category of products and are generally large, complex molecules. These products may be produced through biotechnology in a living system. (FDA, https://www.fda.gov/Drugs/DevelopmentApprovalProcess/HowDrugsareDevelopedandApproved/ApprovalApplications/TherapeuticBiologicApplications/Biosimilars/ucm580419.htm.) Biosimilar Product: A biosimilar is a biological product that is highly similar to and has no clinically meaningful differences from an existing FDA-approved reference product. Treated in this report as Generic, unless the plan- or insurer-negotiated monthly cost exceeds the threshold for a Specialty Drug. (FDA, https://www.fda.gov/Drugs/DevelopmentApprovalProcess/HowDrugsareDevelopedandApproved/ApprovalApplications/TherapeuticBiologicApplications/Biosimilars/ucm580419.htm.) Brand Name Drug: Medications protected by patents that grant their makers exclusive marketing rights for several years. When patents expire, other manufacturers can sell generic copies at lower prices. (AARP Medicare Part D Glossary, https://www.aarp.org/health/medicare-insurance/info-11-2009/Medicare_partD_guide_glossery.html.) Dispensed at Pharmacy: Dispensed at a plan pharmacy, network pharmacy, or mail order pharmacy for outpatient use. (SB 17, https://leginfo.legislature.ca.gov/faces/billTextClient.xhtml?bill_id=201720180SB17.) Formulary: List of drugs used to treat patients in a drug benefit plan. Products listed on a formulary are covered for reimbursement at varying levels. (PBMI Drug Glossary,

25
https://www.pbmi.com/PBMI/Services/Drug_Benefit_Glossary/PBMI/Services/Drug_Benefit_Glossary.aspx?hkey=1051faba-063f-4ae3-a95b-70cd0476f1db.) Generic Drug: A generic drug is a medication created to be the same as an already marketed brand name drug in dosage, form, safety, strength, route of administration, quality, performance characteristics, and intended use. These similarities help to demonstrate bioequivalence, which means that a generic drug works in the same way and provides the same clinical benefit as its brand name version. In other words, a generic drug is an equal substitute for its brand name counterpart. (FDA, https://www.fda.gov/Drugs/ResourcesForYou/Consumers/QuestionsAnswers/ucm100100.htm.) Interchangeable Product: An interchangeable product is a biosimilar product that meets additional requirements outlined by the Biologics Price Competition and Innovation Act. (FDA, https://www.fda.gov/Drugs/DevelopmentApprovalProcess/HowDrugsareDevelopedandApproved/ApprovalApplications/TherapeuticBiologicApplications/Biosimilars/ucm580419.htm.) Mail Order: Licensed pharmacy established to dispense maintenance medications for chronic use in quantities greater than normally purchased at a retail pharmacy. The mail order pharmacy usually uses highly automated equipment so that non-pharmacists perform many routine tasks. As a result, mail order can typically dispense medication at a lower cost per prescription. (PBMI Drug Glossary, https://www.pbmi.com/PBMI/Services/Drug_Benefit_Glossary/PBMI/Services/Drug_Benefit_Glossary.aspx?hkey=1051faba-063f-4ae3-a95b-70cd0476f1db.) Member Cost Sharing: Total payments made by members under the policy for prescription drugs, including copays, deductibles, and coinsurances = Allowed Dollar Amount – Paid Plan Cost. Member Months: The total number of lives, including dependents, insured on a pre-specified day of each month of the reporting period. National Drug Code (NDC): Numeric system to identify drug products in the United States. A drug’s NDC number is often expressed using a 3-segment-number where the first segment identifies the manufacturer, the second identifies the product and strength, and the last identifies the package size and type. (PBMI Drug Glossary, https://www.pbmi.com/PBMI/Services/Drug_Benefit_Glossary/PBMI/Services/Drug_Benefit_Glossary.aspx?hkey=1051faba-063f-4ae3-a95b-70cd0476f1db.) Number of Prescriptions: A 30-day supply is treated as a unit. Between 1- to 30-day supply is 1 unit, between 31- to 60-day supply is 2 units, and more than a 60-day supply is treated as 3 units. Paid Dollar Amount: Allowed Dollar Amount minus the member cost-sharing amount = Incurred Costs. (If this term is related to drug cost only, excludes Manufacturer Rebate.)

26
Paid Plan Claim (Paid Plan Cost): Allowed Dollar Amount minus the member cost-sharing amount = Incurred Costs. (If this term is related to drug cost only, excludes Manufacturer Rebate.) Pharmacy Benefit Manager (PBM): Organization dedicated to administering prescription benefit management services to employers, health plans, third-party administrators, union groups, and other plan sponsors. A full-service PBM maintains eligibility, adjudicates prescription claims, provides clinical services and customer support, contracts and manages pharmacy networks, and provides management reports. (PBMI Drug Glossary, https://www.pbmi.com/PBMI/Services/Drug_Benefit_Glossary/PBMI/Services/Drug_Benefit_Glossary.aspx?hkey=1051faba-063f-4ae3-a95b-70cd0476f1db.) Pharmacy Benefits Carve-In: Management of the drug benefit is included with the management of the medical benefit, using a single entity and contract to administer both benefits. (PBMI Drug Glossary, https://www.pbmi.com/PBMI/Services/Drug_Benefit_Glossary/PBMI/Services/Drug_Benefit_Glossary.aspx?hkey=1051faba-063f-4ae3-a95b-70cd0476f1db.) Pharmacy Benefits Carve-Out: Management of the drug benefit is separate from the management of the medical benefit, using two different entities or two separate contracts to administer the benefits. (PBMI Drug Glossary, https://www.pbmi.com/PBMI/Services/Drug_Benefit_Glossary/PBMI/Services/Drug_Benefit_Glossary.aspx?hkey=1051faba-063f-4ae3-a95b-70cd0476f1db.) Prescription Drug: A self-administered drug approved by the FDA for sale to the public through retail or mail order pharmacies that requires a prescription and is not provided for use on an inpatient basis or administered in a clinical setting or by a licensed health care provider. The term includes: (i) disposable devices that are medically necessary for the administration of a covered prescription drug, such as spacers and inhalers for the administration of aerosol outpatient prescription drugs; (ii) syringes for self-injectable prescription drugs that are not dispensed in pre-filled syringes; (iii) drugs, devices, and FDA-approved products covered under the prescription drug benefit of the product pursuant to sections 1367.002 and 1367.25 of the Health and Safety Code, including any such over-the-counter drugs, devices, and FDA-approved products; and (iv) at the option of the health care service plan, any vaccines or other health benefits covered under the prescription drug benefit of the product. (FDA, https://www.fda.gov/Drugs/ResourcesForYou/Consumers/QuestionsAnswers/ucm100101.htm.) Reference Product: A reference product is the single biological product, already approved by the FDA, against which a proposed biosimilar product is compared. A reference product is approved based on, among other things, a full complement of safety and effectiveness data. Treated in this report as Brand Name or Brand Name Specialty. (FDA, https://www.fda.gov/Drugs/DevelopmentApprovalProcess/HowDrugsareDevelopedandApproved/ApprovalApplications/TherapeuticBiologicApplications/Biosimilars/ucm580419.htm.) Retail: Medications are purchased at a retail pharmacy.

27
Specialty Drug: A drug with a plan- or insurer-negotiated monthly cost that exceeds the threshold for a specialty drug under the Medicare Part D program (Medicare Prescription Drug, Improvement, and Modernization Act of 2003 (Public Law 108-173)). In 2018, the threshold amount is $670 for a one-month supply. (SB 17, https://www.cms.gov/Medicare/Health-Plans/MedicareAdvtgSpecRateStats/Downloads/Announcement2018.pdf.)