impact of price sensitivity on repurchase …
TRANSCRIPT
DOI: 10.18092/ulikidince.434866 Makalenin Geliş Tarihi (Recieved Date): 19.06.2018 Yayına Kabul Tarihi (Acceptance Date): 13.07.2018
IMPACT OF PRICE SENSITIVITY ON REPURCHASE INTENTION IN TERMS OF PERSONALITY FEATURES
Aypar USLU1, Bahman HUSEYNLI 2
A b s t r a c t The aim of the study is to determine the effect of price sensitivity on the intention of repurchasing in terms of personality characteristics, and also investigate the extent to which personality characteristics affect price sensitivity. Accordingly, the research was carried out in line with these objectives. In our research, price sensitivity, personality traits, socio-demographic characteristics and intention to repurchase were examined within the scope of marketing. The research was conducted on 519 consumers who consume soft drinks in Turkey. In the study, it was found out that price sensitivity differs from personality traits only with Neuroticism, Extraversion and Agreeableness dimensions. Furthermore, it was a variable income level, which varied according to the socio-demographic characteristics of the participants and the price sensitivity. When the literature is examined, it is possible that this research is beneficial to practitioners and it contributes to the academic literature, since there are few studies on the topic. Keywords: Big Five Personality Traits, Pricing, Price Sensitivity, Repurchase Intention JEL Classification: M31, D40, D12
KİŞİLİK ÖZELLİKLERİ AÇISINDAN FİYAT DUYARLILIĞININ YENİDEN SATIN ALMA NİYETİ ÜZERİNE ETKİSİ
Ö z Çalışmanın amacı, kişilik özellikleri açısından fiyat duyarlılığının yeniden satın alma niyetine olan etkisini belirlemek ve kişilik özelliklerinin fiyat duyarlılığı üzerindeki etkisini incelemektir. Bu bağlamda araştırma bu amaçlar doğrultusunda yürütülmüştür. Araştırmamızda fiyat duyarlılığı, kişilik özellikleri, sosyo-demografik özellikler ve yeniden satın alma niyeti pazarlama kapsamında incelenmiştir. Araştırma, Türkiye'de alkolsüz içecek tüketen 519 tüketici üzerinde gerçekleştirilmiştir. Çalışmada, fiyat duyarlılığının kişilik özellikleri arasında Duygusal Dengesizlik, Dışadönüklük ve Uyumluluk değişkenleri ile farklılık gösterdiği saptanmıştır. Ayrıca, sosyo-demografik özellikleri açısından katılımcıların yalnızca gelir seviyesine göre fiyat duyarlılığına göre farklılık gösterdiği bulunmuştur. Literatür incelendiğinde, bu araştırmanın uygulayıcılara faydalı olması ve akademik literatüre katkı sağlayacağını söylemek mümkündür, çünkü konuyla ilgili az çalışma bulunmaktadır. Anahtar Kelimeler: Beş Faktör Kişilik Özelikleri, Fiyatlandırma, Fiyat Duyarlılığı, Yeniden Satın Alma Niyeti JEL Sınıflandırması: M31, D40, D12
1 Prof.Dr., Marmara University, Department of Marketing, [email protected] 2 MSc Student, Marmara University, Departmenet of Marketing, [email protected]

516 UİİİD-IJEAS, 2018 (17. UİK Özel Sayısı):515-532 ISSN 1307-9832
International Journal of Economic and Administrative Studies
1. Introduction
Price sensitivity is a necessary element for marketing professionals to evaluate the target market; so it has a big impact on the bottom line or earnings of the company. Porter (1985) identified two basic competitive strategies that could provide a source of competitive advantage. These are the differentiation and low cost strategies. A firm can implement a low-cost strategy to ensure the continuity of its competitive advantage (Santonen, 2007). For this reason, price is an indispensable factor in consumers' purchasing decisions in low-cost strategies (Silva et al., 2012). Aliman and Othman (2007) found that price is one of the most important features in purchasing goods or in daily consumption. Furthermore, in some studies it has been seen that while consumers make a purchase decision in a category of products in order to maximize utility immediately; sometimes they pay attention to buying power, then to brand and quality. This is a sign that consumers have price sensitivity at a certain level when making their choices (i.e. intention to purchase).
The aim of the study is to determine the impact of price sensitivity on the intention of repurchase in terms of personality characteristics and to examine the level to which the personality characteristics impact price sensitivity. Three fundamental contributions are foreseen in our study. Hence, this investigation goals are below:
• whether price sensitivity affects repurchase intention;
• whether demographic characteristics differ according to price sensitivity; and
• whether the personality characteristics differ according to the price sensitivity.
To accomplish these objectives, a review of previous research was conducted by an exploratory investigation of category of beverages.
However, despite the widespread literature on these issues, very few investigations have been done on the price sensitivity of the effects of consumer uncertainty on brand or product quality. It is surprising when it is taken into account that consumers are more sensitive to price.
The next part of the paper is organized as follows: first, the theoretical background was summarized, then the hypothesis were developed; in the second part of the the paper the research methodology was given; in the third part, the data were analyzed; and finally, proposals for academics and practitioners have been proposed based on the findings and limitations and research directions for future studies have been presented.
2. Theoretical Background
2.1. Price
In the literature, there are many definitions about price. Monroe (1990: 5) defines price as “the amount of money we must sacrifice to acquire something we desire”. Voss and Seiders (2003) stated that price is a powerful managerial tool affecting product / brand image, own capital, position and purchasing. This is because price, which is one of the 4Ps of the marketing mix strategies, is accepted as the basic component of value. Needless to say that, price attracted the attention of research that resulted in a rich literature base.
According to Kotler and Keller (2006), pricing factors include: cost of goods / services sold, administrative costs, advertising and promotional expenses, market competition, economic status and perceived quality of the product. Strategies for determining prices are based on pricing strategies. These strategies are: cost-oriented pricing strategy, competition-oriented pricing strategy and demand-oriented pricing strategy (Cravens and Piercy, 2009, Kotler and Keller, 2006). All this shows itself at the price of the last product. If this price is low or high, it is reflected in consumers' purchasing decisions.

Aypar USLU, Bahman HUSEYNLI 517
Uluslararası İktisadi ve İdari İncelemeler Dergisi
During the boundless and free trade competition, companies competing in the marketplace must make great efforts to establish and maintain competitive advantage if they want to survive, succeed and grow (Hamel and Prahalad, 1993; Porter, 1985, 2008). In this case, market quotations must consist of reasonable prices, good quality and good services (Aaker, 1992, Kotler and Keller, 2006). In all of these cases, it is seen that pricing is an important component that causes firms to gain competitive advantage. As a matter of principle, it is assumed that price is an effect in the consumer’s decision-making process (Gijsbrechts, 1993).
When considered from a consumer’s point of view, the price indicates the amount consumers should give up to buy goods / services (Zeithaml, 1988). Many consumers view the price as a quality signal that reflects their classical intellect that "you get what you pay for" (Erickson and Johansson, 1985). According to Zeithaml (1988), consumers cannot remember real product prices. Instead, consumers codify the price in a way that is meaningful to them.
Moreover, the price may be perceived as monetary sacrifice as a measure of ability to pay. This means that, consumers should change their monetary sacrifices with offers when they evaluate the products. If consumers perceive that proposals are good value, that is, they will evaluate the money they have to pay, and they will be willing to buy it (Cram, 2008; Zeithaml, 1988).
2.2. Price Sensitivity
In today’s market, pricing strategies have an important place in the competitive advantage of companies. The price represents the amount of money that consumers have to pay to get offers they want to buy. Consumers are sensitive to the prices of things they have to pay. This is called price sensitivity.
The concept of price sensitivity is based on the analysis of economic theory and price elasticity. That is, as a consequence of the percentage change in the price, the percentage change in the quantity units is a matter of course (Diamantopoulos, 2003, Boonpattarakan, 2012). In general, "price sensitivity" is often used synonymously with "price elasticity" (Link, 1997), and therefore both of the terms are used synonymously in our research. Sensitivity of demand refers to how sensitive a product or service is in terms of volume for price changes. Sensitivity is an important tool in pricing strategies (Tucker, 1966). The concept of price elasticity of demand was developed by Alfred Marshall in his book Economics Principles in 1890. In general, price sensitivity is an essential tool in the analysis of goods and services demand and in understanding decision making processes related to pricing, investment and planning. Nowadays, this concept is a central issue when the demand is analyzed from a microeconomic point of view. The concept of "Price sensitivity" was first investigated by Gabor and Granger (1966). The authors make a research to determine the upper and lower price limits of some inexpensive products. As a result of this study, it was determined that the gap between the upper and lower price limits did not affect the purchasing intentions of the consumers, but rather affected the purchasing amount.
There are several definitions in the literature about price sensitivity. According to Tellis (1988:331), price sensitivity is defined as how consumers will change their purchases depending on the change in the price of a product. Briefly, price sensitivity is about how consumers perceive price differences or variations in products/services and, at the same time how they will react to it. According to Wakefield and Inman (2003), price sensitivity is usually related to price changes. Miller (2006) defines price sensitivity as the consumer's awareness of what the consumer perceives as a cost window to buy a particular product or service. Price sensitivity indicates a change in consumer's wishes as a result of a price reduction or increase. Diamantopoulos (2003) defines price sensitivity as an awareness of consumers' perception of the form of costs for a particular product or service consumers want to buy. As can be seen, in most definitions, price sensitivity is defined in terms of payments for products or services consumers want to buy. If the price is perceived as too high, consumers may be reluctant and hesitate to buy. On the contrary, if the price is
518 UİİİD-IJEAS, 2018 (17. UİK Özel Sayısı):515-532 ISSN 1307-9832
International Journal of Economic and Administrative Studies
considered reasonable and relevant, consumers will be willing to pay these bids (Boonpattarakan, 2012).
If the category is taken as a basis, the customer has a certain level of price sensitivity for all product and service categories. If the firm makes a small price change, the firm can have a significant influence on the revenue. When assessed in this respect, marketers are trying to understand the price sensitivity of target customers (Goldsmith, Flynn, and Kim, 2010). According to the literature, it is possible that price sensitivity is specific to the situation. In a study done, consumers were found to be less sensitive to the purchase of hedonic products. Nevertheless, consumers have been found to be more susceptible to the purchase of utilitarian products (Wakefield and Inman, 2003). According to Wakefield and Inman (2003) for example, hedonic versus utilitarian purchases constitute the factors that can cause shifts in social impact, time pressure, seasonal effects, shopping environment (eg crowd) and even mood price sensitivity. Furthermore, in other studies (Simonson, 1989), it has been shown that shoppers are making their choices according to the others' beliefs if they shop in the presence of others and that purchasing is socially risky (Midgley, 1983). Product involvement is also relevant for price sensitivity in that it is inversely related to price sensitivity: product involvement leads to brand loyalty and brand loyalty diminishes price sensitivity (Wakefield and Inman, 2003).
Lichtenstein, Ridgway and Netemey (1993) shows that, at least some of the product categories have pointed out to others that the prestige price sensitivity or price sensitivity is negatively related to the buyer due to perception. Given the theoretical expressions and empirical evidence, it has been found that there is a negative correlation between consumption and the price sensitivity of consumption and status. In a study it is suggested that consumption of status was negatively associated with clothing, price sensitivity (Goldsmith, 2010) was found to decrease in clothing, prices increased sensitivity to consumer desire for status. In this study by Ramirez and Goldsmith (2009), it has been shown that the participation of clothing increases depersonalization by its influence on perceptions of consumer innovation, brand loyalty and brand equity. It should also be noted that sales promotions may increase the price sensitivity (Aaker, 1991:11). Consumers often use price as a clue to product quality to justify paying higher (Lichtenstein, Ridgway and Netemeyer, 1993). Aaker (1991) notes that small effects such as colors, package design and brand name can also affect how much consumers will pay for many types of goods. Other than these, market factors that are not controlled by market factors can also affect price sensitivity.
When considered in this respect, price sensitivity concerns the price a customer is willing to pay at a particular time (Renison and Hardt, 2008). Consumers intend to pay higher prices in case of an emergency, when buying gifts or on holiday. For example, people who spend time with friends will be less responsive (Dickson and Sawyer, 1990).
2.3. Personality Traits
Personality traits used in different areas of social sciences have been studied for many years. This topic, which is mostly worked on by many researchers in the field of psychology, is also of interest of the marketers. Understanding the consumers' characteristics and developing appropriate marketing strategies are very important. In today's psychology, an important consensus has been reached regarding the identification of personality traits based on five factors. There are important studies in the literature related to the five factor personality traits (e.g. Costa and McCrae, 1992, 1995; De Raad and Schouwenburg, 1996; Digman, 1990; Furnham, 1996, 1997; Goldberg, 1990; Goldberg and Saucier, 1995).
Significant findings emerged from verbal research on personality traits and its structure (Goldberg, 1993; John, 1990; Saucier and Goldberg, 1996). This finding is known as five-factor personality traits. Personality traits, which are a five-factor structure, are called Big Five (Goldberg, 1981), which can capture most of the variance in personality traits. Goldberg (1981) made an

Aypar USLU, Bahman HUSEYNLI 519
Uluslararası İktisadi ve İdari İncelemeler Dergisi
introduction to linguistic analysis and created a new field for many personality researchers, and then found this knowledge in relation to the field of personality descriptors.
Studies on personality traits have been developed and tested on different demographic characteristics in different countries. Costa and McCrae (1988) noted that although theories of the effects of aging on the personality are interesting, they have not relied on long-term follow-up work. In the majority of the studies performed by the researchers involved five factors, five factors resembling the standard five were found. McCrae and Costa (1985) examined adjective scales and questionnaire measures in an adult sample where peer scores were available on parallel instruments, and showed that they converge between the five factors in both observers and instruments. Similar findings were found by Goldberg (1989) and Trapnell and Wiggins (1990). Along with that, note that the Big Five structure does not imply that personality differences can be reduced to only five traits. The Big Five dimensions represent personality at the highest level of abstraction and each dimension contains many different and more specific personality traits (Costa and McCrae, 1995; John, 1990).
With regards to personality traits in the literature, the Big Five Personality Factors may have been a source of inspiration for recent years. According to the Big Five Personality Factor model, the basic structure of personality is divided into five factors (Bipp, Steinmayr, and Spinath, 2008: 1455). These factors are: Neuroticism (N), Extraversion (E), Openness to Experience (O), Agreeableness (A), and Conscientiousness (C).
The characteristics of these five factors are also different. Based on the literature (Costa and McCrae, 1995; Busato, Prins, Elshout and Hamaker, 1998, Benet-Martinez and John, 1998), the differences between these factors can be summarized as follows:
• Neuroticism (N). This factor defines the degree to which people experience negative emotions. That is, neuroticism contradicts a wide range of negative effects such as emotional stability, anxiety, sadness, irritability and nervous tension.
• Extraversion (E). The extraversion factor attracts people to tend to be sociable, to have positive emotions and to a high degree of activity. This factor is characterized as dominance, activity and energy, insight, expressiveness, and positive emotions.
• Openness (O). This factor, called experiential openness, is associated with sensitivity to new ideas, preference for various senses, and intellectuality. This factor, called experiential openness, is linked to sensitivity to new ideas, intellectuality, and preferences for various senses.
• Agreeableness (A). This factor is associated with a tendency for satisfaction, self-sacrifice, trust and friendliness. Aggressiveness, prosocial orientation contrasts with hostility towards others and includes features such as altruism, tendermindedness, trust and humility.
• Conscientiousness (C). This factor relates to the qualities to reach, to be self-sustaining, to be persistent and to be reliable. The conscientious factor explains the socially predicted impulse control that facilitates task and target behavior.
2.4. Repurchase Intention
Loyalty is regarded as multiple dimensions, such as customer retention, repurchase, and recommendation to others (e.g., Kim et al. 2009; Srinivasana et al. 2002). Among these factors, repurchase intention is regarded as a main and a clear appearance of loyalty with the most direct mention on financial returns. Therefore, behavioral intentions are highly desired by the vendors and are also commercially viable (e.g., Oliver 1999; Otim and Grover 2006). The behavioral dimension of loyalty can be due to cognitive or affective dimension. But this can only reflect the intention and not reflect the product's liking (Evanschitzky and Wunderlich, 2006; Han and Back, 2008). For this reason, although it is not trusted to measure loyalty to a product, it can be used to determine the intention to repurchase (Han and Ryu, 2009). Customer's intention to repurchase is
520 UİİİD-IJEAS, 2018 (17. UİK Özel Sayısı):515-532 ISSN 1307-9832
International Journal of Economic and Administrative Studies
determined by the behavioral component related to the determination of the client by the cognitive component or the affective component (Back, 2005). Generally, repurchase intention is to repurchase from the same product, taking into account the individual's current situation and possible circumstances.
There are also studies in the literature on the internal reference price, which consumers have paid for the same product in the past (Winer, 1986; Mayhew and Winer, 1992; Rajendran and Tellis, 1994; Kalyanaram and Winer, 1995). Consumers have also improved their personal price forecasting rules, allowing them to compare this price with a normal price based on previous purchasing experience. When examined in this regard, consumers can use price as a reference when they think price increases repurchase decisions, since consumers' focus and complementary prices can represent the past price paid for certain items (Mayhew and Winer, 1992).
3. Research Methodology
3.1. Hyphothesis Development
Hypotheses were formed within the scope of the purpose of the study. We have developed 3 hypotheses based on previous studies in the literature. These hypotheses and the literature on which they are based are given below.
The first hypothesis suggests that customer price sensitivity differs considerably in terms of demographic variables. There are studies between socio-demographic characteristics and price sensitivity in the literature. There are different results in these studies. In one of the studies done (Munnukka, 2005), none of the demographic variables gave a positive result. Accordingly, it is stated that demographic variables can not be used to estimate the price sensitivity levels of mobile service customers. In another study (Gupta, 2011), it was determined that only sex has a significant effect among demographic variables. In marketing, the results between price sensitivity and socio-demographic characteristics are significant.
That is, a consumer may be affected by information about the price and price sensitivity of a particular product or service. This inherently depends on the demographic characteristics of the consumer. Demographic characteristics such as income, marital status, age and gender usually affect the price sensitivity and price perception of a person. For this reason, these features are often used for market segmentation (Munnukka, 2008). Therefore, the following hypothesis is offered:
Hypothesis 1. Price sensitivity can be significantly explained by a customer’s demographic variables. This difference would be changed by (a) gender, (b) marital status, (c) age, (d) education level, (e) profession and (f) income level.
The second aim of this research is to investigate whether the personality characteristics differ according to price sensitivity. There are limited studies about this topic in the literature in which the Big Five structure is used to predict consumer behavior (Casidy, 2012). A thorough review of the literature reveals that none of the previous studies in this area have examined the relationship between Big Five personality traits, price sensitivity, and repurchase intention.
Only a few studies have found that there are variables of prestige sensitivity and personality traits. Prestige sensitivity is defined as “favourable perceptions of the price cue based on feelings of prominence and status that higher prices signal to other people about the purchaser”. This means that people with high prestige tend to avoid purchasing products that are thought to be of poor quality. Since price sensitivity and personality traits are very important variables in the field of marketing, in our study we analyzed whether there is a difference between them. Therefore, the following hypothesis is offered:
Hypothesis 2. Price sensitivity can be significantly explained by a customer’s personality tratits.
Aypar USLU, Bahman HUSEYNLI 521
Uluslararası İktisadi ve İdari İncelemeler Dergisi
Price sensitivity can be explained by personality traits of a consumer. The price of the product is thought to be an important factor of the purchasing decision making mechanisms of consumers. Because, the price can give information to consumers about the quality of the product/ service (Erickson and Johansson, 1985). It is possible to explain, if the price of a product / service is perceived reasonably, consumers may intend to purchase more (Grewal, Krishnan, Baker, and Borin,1998).
Nowadays, price also plays an important element in guiding choice to purchase among consumers (Silva et al., 2012). When a consumer considers price, they tend to be sensitive to price changes (Noh et al., 2013). In addition, price sensitivity is inconsistent from one person to another, as consumers have the ability to change the consumer purchasing pattern (Noh et al., 2013), as well as it also influenced purchase intention.
When previous studies were examined, it was seen that some studies focused on determining the basic predecessor variables of the repurchase intention (Zahorik and Rust, 1992; Storbacka et al., 1994; Hocutt, 1998). Nevertheless, it has been determined by many researchers that customer satisfaction and attitude are among the important pioneers of the repurchase intent (Oliver, 1980, 1981; Bearden and Teel, 1983; Roest and Pieters, 1997). Taking all this into account, we have developed the following hypothesis to examine whether price sensitivity in our study affects consumers’ repurchase intentions. Hence, the following hypothesis is offered:
Hypothesis 3. Consumers’ price sensitivity has a positive influence on repurchase intention.
3.2. Measures
The survey instrument has four variables. There are price sensitivity, repurchase intention, personality traits, and socio-demographic factors. The scale of price sensitivity (nine items) was adopted on the studies of Lichtenstein, Ridgway and Netemeyer (1993), Sproles and Kendall (1986), and Maxwell (2001). The price sensitivity score of each participant was determined by calculating the average of the nine-item responses of that person. Higher score indicated higher price sensitivity, and lower score indicated less price sensitivity. In this study, a three-item scale was used to assess the intent of repurchase intention. The scale of repurchase intention was adopted and modified from Fullerton (2005). Finally, five factor personality trait scale was measured with the items proposed by Benet-Martinez and John (1998).
The adaptation of the scale to Turkish was done by Sümer and Sümer (2005) within the context of Turkey in a study (Schmitt etc., 2007) on the profiles and patterns of self-definition of people within 56 countries. All scales used in the study were adapted to the five-point Likert scale ranging from (1) strongly disagree to (5) strongly agree.
3.3. Design
We use one product category to represent potential uncertainty and sensitivity to such uncertainty. The category is beverages category such as soft drinks, fruit juice, energy drink, gaseous, and non-carbonated soda. The reason why the research design is made in the beverage category is that it is decided to make a purchase by oneself without being under the influence of others.
All the scales items are originally in English but the questionnaire were translated into Turkish by us. Prior to conducting the final survey, the developed questionnaire underwent pretest. Some grammatical modifications and other arrangements were done to some questions after the pretest. The final questionnaire included 66 questions.
4. Data Analysis and Results
In the analysis of the data, SPSS 25.0 program was used and independent t test, ANOVA and regression analyzes were performed.
522 UİİİD-IJEAS, 2018 (17. UİK Özel Sayısı):515-532 ISSN 1307-9832
International Journal of Economic and Administrative Studies
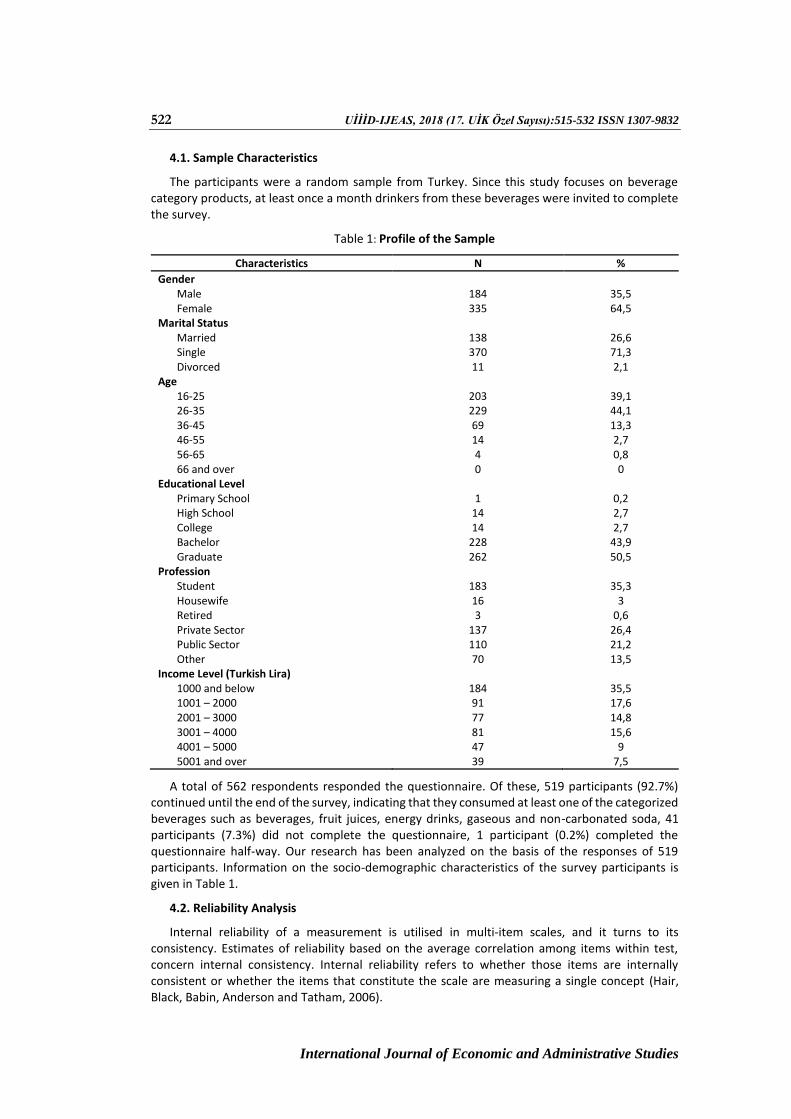
4.1. Sample Characteristics
The participants were a random sample from Turkey. Since this study focuses on beverage category products, at least once a month drinkers from these beverages were invited to complete the survey.
Table 1: Profile of the Sample
Characteristics N %
Gender Male 184 35,5 Female 335 64,5
Marital Status Married 138 26,6 Single 370 71,3 Divorced 11 2,1
Age 16-25 203 39,1 26-35 229 44,1 36-45 69 13,3 46-55 14 2,7 56-65 4 0,8 66 and over 0 0
Educational Level Primary School 1 0,2 High School 14 2,7 College 14 2,7 Bachelor 228 43,9 Graduate 262 50,5
Profession Student 183 35,3 Housewife 16 3 Retired 3 0,6 Private Sector 137 26,4 Public Sector 110 21,2 Other 70 13,5
Income Level (Turkish Lira) 1000 and below 184 35,5 1001 – 2000 91 17,6 2001 – 3000 77 14,8 3001 – 4000 81 15,6 4001 – 5000 47 9 5001 and over 39 7,5
A total of 562 respondents responded the questionnaire. Of these, 519 participants (92.7%) continued until the end of the survey, indicating that they consumed at least one of the categorized beverages such as beverages, fruit juices, energy drinks, gaseous and non-carbonated soda, 41 participants (7.3%) did not complete the questionnaire, 1 participant (0.2%) completed the questionnaire half-way. Our research has been analyzed on the basis of the responses of 519 participants. Information on the socio-demographic characteristics of the survey participants is given in Table 1.
4.2. Reliability Analysis
Internal reliability of a measurement is utilised in multi-item scales, and it turns to its consistency. Estimates of reliability based on the average correlation among items within test, concern internal consistency. Internal reliability refers to whether those items are internally consistent or whether the items that constitute the scale are measuring a single concept (Hair, Black, Babin, Anderson and Tatham, 2006).
Aypar USLU, Bahman HUSEYNLI 523
Uluslararası İktisadi ve İdari İncelemeler Dergisi
Principal components analysis with Varimax Rotation produces the dimension of differentiation which was used in order to confirm the scale for construct validity. To define if the subscales were suitable for factor analysis, KMO test was used. The Bartlet Test of Sphericity, in which it is examined if the subscales of the scale are inter-independent, and the latter is the criterion KMO (Kaiser-Meyer Olkin Measure of Sampling Adequacy, KMO) (Kaiser, 1974).
Cronbach‘s Coefficient Alpha is the most popular indicator of internal consistency that was utilised in this study to evaluate the reliabilities of measurement scales adopted (Hair et al, 2006). Nunnally (1978) suggested that an acceptable level of coefficient alpha to retain an item in a scale is at least 0.70 score. Furthermore, based on satisfactory standard (α≥0.70) suggested by Nunnally (1978), the present study found a very high internal consistency reliability for the all variables.
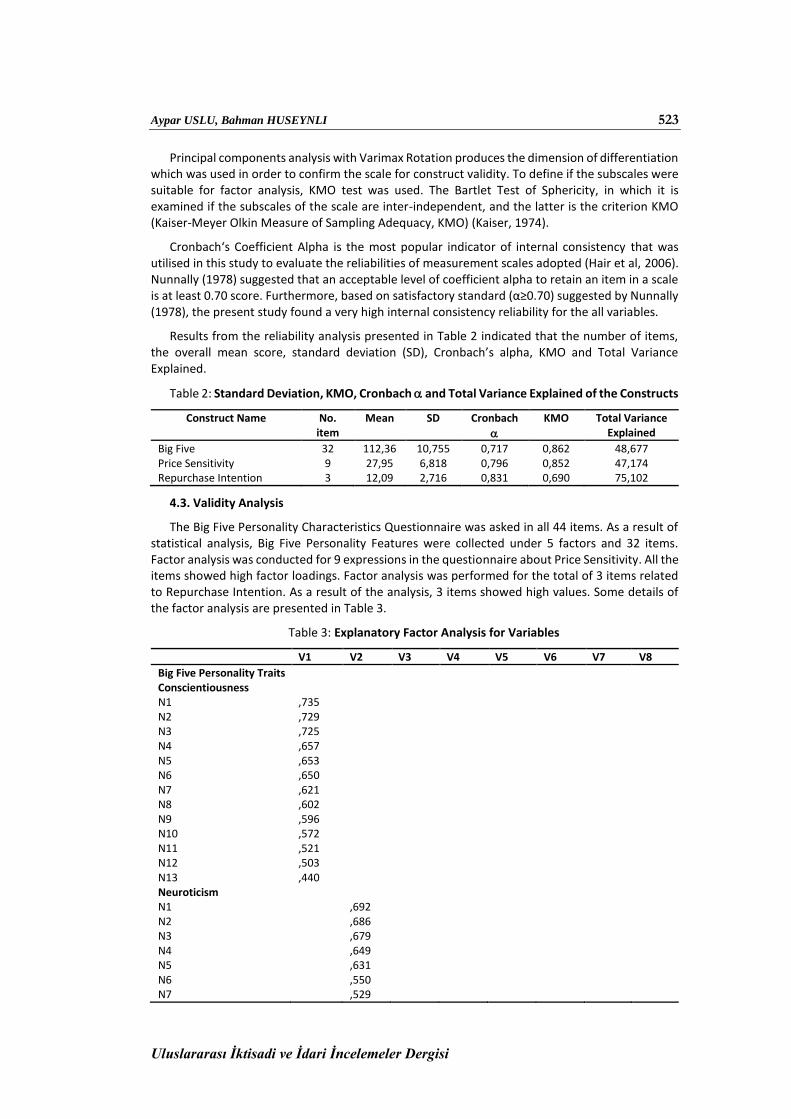
Results from the reliability analysis presented in Table 2 indicated that the number of items, the overall mean score, standard deviation (SD), Cronbach’s alpha, KMO and Total Variance Explained.
Table 2: Standard Deviation, KMO, Cronbach and Total Variance Explained of the Constructs
Construct Name No. item
Mean SD Cronbach
KMO Total Variance Explained
Big Five 32 112,36 10,755 0,717 0,862 48,677 Price Sensitivity 9 27,95 6,818 0,796 0,852 47,174 Repurchase Intention 3 12,09 2,716 0,831 0,690 75,102
4.3. Validity Analysis
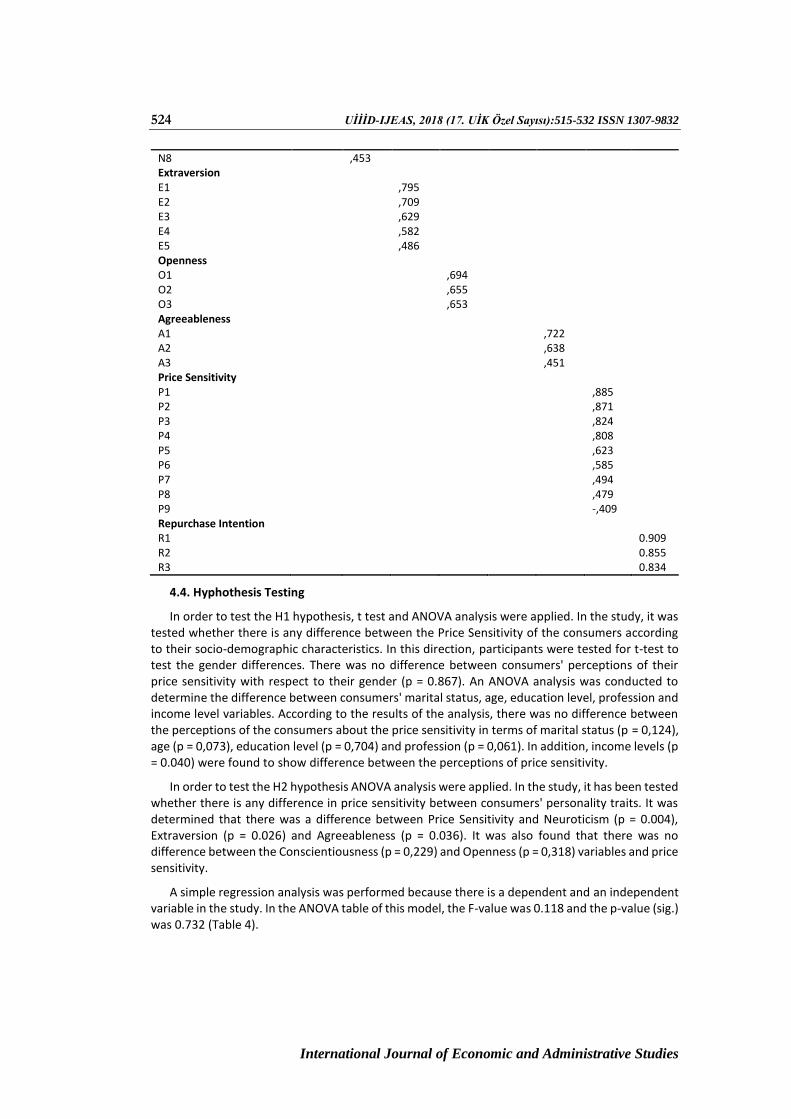
The Big Five Personality Characteristics Questionnaire was asked in all 44 items. As a result of statistical analysis, Big Five Personality Features were collected under 5 factors and 32 items. Factor analysis was conducted for 9 expressions in the questionnaire about Price Sensitivity. All the items showed high factor loadings. Factor analysis was performed for the total of 3 items related to Repurchase Intention. As a result of the analysis, 3 items showed high values. Some details of the factor analysis are presented in Table 3.
Table 3: Explanatory Factor Analysis for Variables
V1 V2 V3 V4 V5 V6 V7 V8
Big Five Personality Traits Conscientiousness N1 ,735 N2 ,729 N3 ,725 N4 ,657 N5 ,653 N6 ,650 N7 ,621 N8 ,602 N9 ,596 N10 ,572 N11 ,521 N12 ,503 N13 ,440 Neuroticism N1 ,692 N2 ,686 N3 ,679 N4 ,649 N5 ,631 N6 ,550 N7 ,529
524 UİİİD-IJEAS, 2018 (17. UİK Özel Sayısı):515-532 ISSN 1307-9832
International Journal of Economic and Administrative Studies
N8 ,453 Extraversion E1 ,795 E2 ,709 E3 ,629 E4 ,582 E5 ,486 Openness O1 ,694 O2 ,655 O3 ,653 Agreeableness A1 ,722 A2 ,638 A3 ,451 Price Sensitivity P1 ,885 P2 ,871 P3 ,824 P4 ,808 P5 ,623 P6 ,585 P7 ,494 P8 ,479 P9 -,409 Repurchase Intention R1 0.909 R2 0.855 R3 0.834
4.4. Hyphothesis Testing
In order to test the H1 hypothesis, t test and ANOVA analysis were applied. In the study, it was tested whether there is any difference between the Price Sensitivity of the consumers according to their socio-demographic characteristics. In this direction, participants were tested for t-test to test the gender differences. There was no difference between consumers' perceptions of their price sensitivity with respect to their gender (p = 0.867). An ANOVA analysis was conducted to determine the difference between consumers' marital status, age, education level, profession and income level variables. According to the results of the analysis, there was no difference between the perceptions of the consumers about the price sensitivity in terms of marital status (p = 0,124), age (p = 0,073), education level (p = 0,704) and profession (p = 0,061). In addition, income levels (p = 0.040) were found to show difference between the perceptions of price sensitivity.
In order to test the H2 hypothesis ANOVA analysis were applied. In the study, it has been tested whether there is any difference in price sensitivity between consumers' personality traits. It was determined that there was a difference between Price Sensitivity and Neuroticism (p = 0.004), Extraversion (p = 0.026) and Agreeableness (p = 0.036). It was also found that there was no difference between the Conscientiousness (p = 0,229) and Openness (p = 0,318) variables and price sensitivity.
A simple regression analysis was performed because there is a dependent and an independent variable in the study. In the ANOVA table of this model, the F-value was 0.118 and the p-value (sig.) was 0.732 (Table 4).
Aypar USLU, Bahman HUSEYNLI 525
Uluslararası İktisadi ve İdari İncelemeler Dergisi
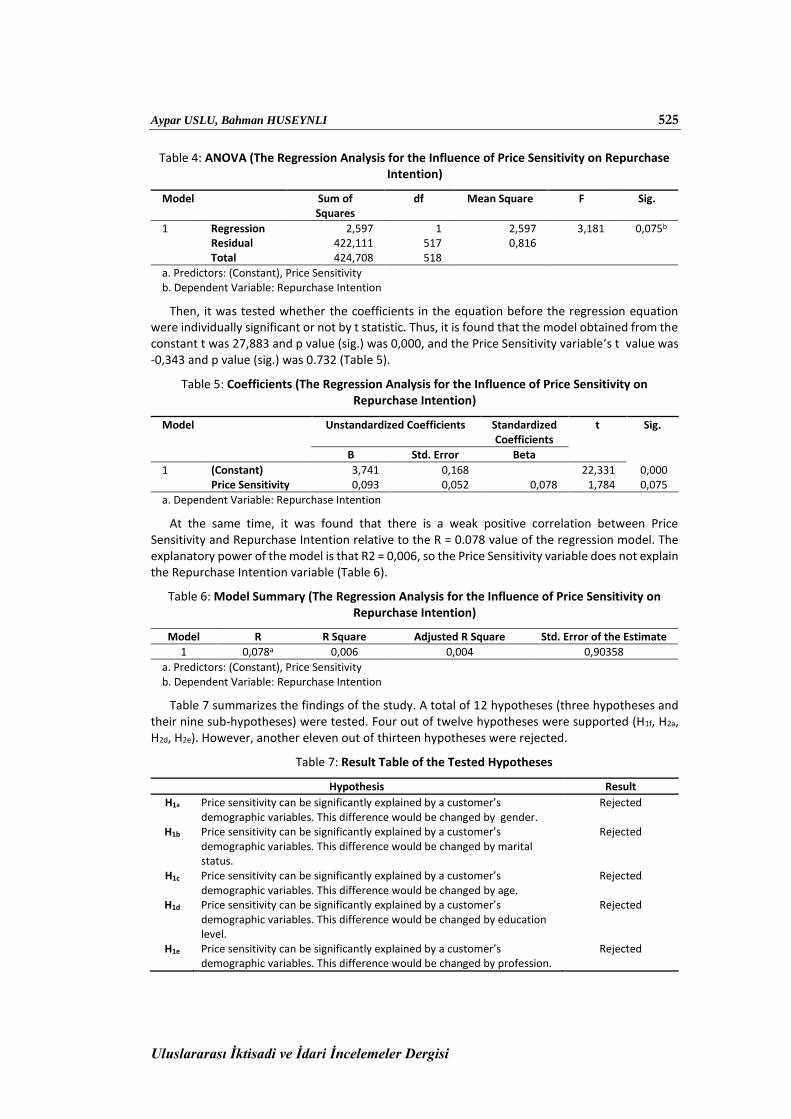
Table 4: ANOVA (The Regression Analysis for the Influence of Price Sensitivity on Repurchase Intention)
Model Sum of Squares
df Mean Square F Sig.
1 Regression 2,597 1 2,597 3,181 0,075b Residual 422,111 517 0,816 Total 424,708 518
a. Predictors: (Constant), Price Sensitivity b. Dependent Variable: Repurchase Intention
Then, it was tested whether the coefficients in the equation before the regression equation were individually significant or not by t statistic. Thus, it is found that the model obtained from the constant t was 27,883 and p value (sig.) was 0,000, and the Price Sensitivity variable’s t value was -0,343 and p value (sig.) was 0.732 (Table 5).
Table 5: Coefficients (The Regression Analysis for the Influence of Price Sensitivity on Repurchase Intention)
Model Unstandardized Coefficients Standardized Coefficients
t Sig.
B Std. Error Beta
1 (Constant) 3,741 0,168 22,331 0,000 Price Sensitivity 0,093 0,052 0,078 1,784 0,075
a. Dependent Variable: Repurchase Intention
At the same time, it was found that there is a weak positive correlation between Price Sensitivity and Repurchase Intention relative to the R = 0.078 value of the regression model. The explanatory power of the model is that R2 = 0,006, so the Price Sensitivity variable does not explain the Repurchase Intention variable (Table 6).
Table 6: Model Summary (The Regression Analysis for the Influence of Price Sensitivity on Repurchase Intention)
Model R R Square Adjusted R Square Std. Error of the Estimate
1 0,078a 0,006 0,004 0,90358
a. Predictors: (Constant), Price Sensitivity b. Dependent Variable: Repurchase Intention
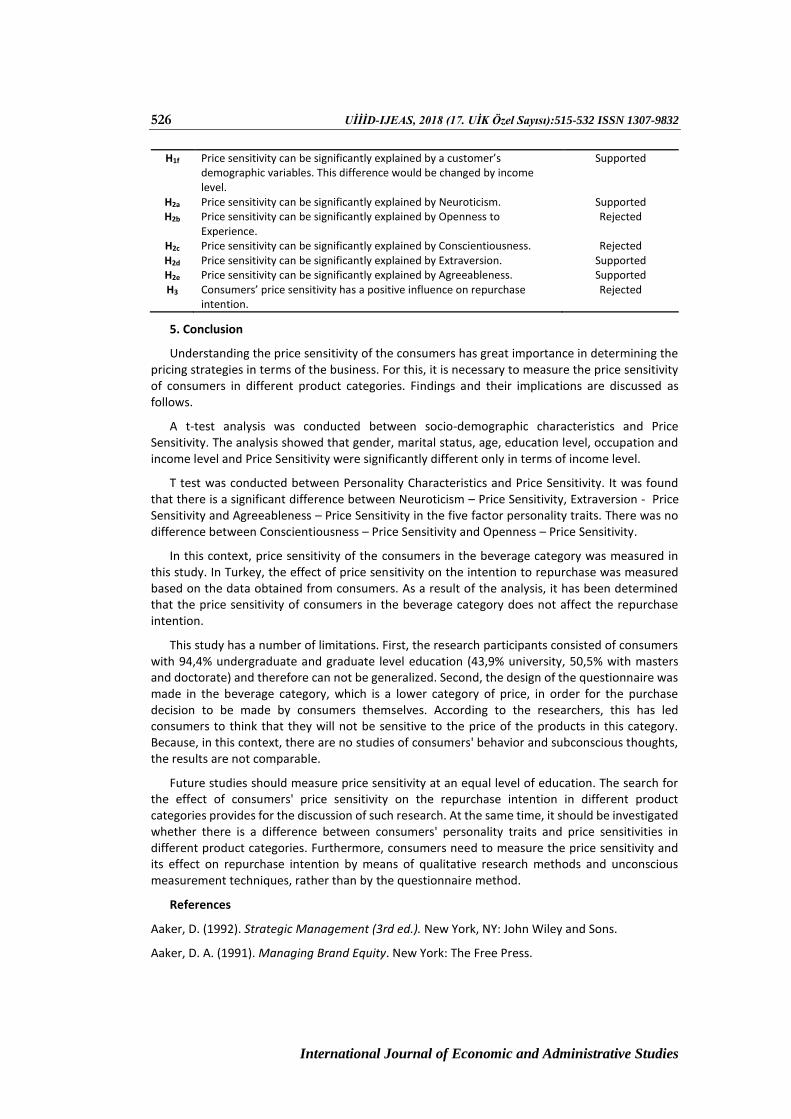
Table 7 summarizes the findings of the study. A total of 12 hypotheses (three hypotheses and their nine sub-hypotheses) were tested. Four out of twelve hypotheses were supported (H1f, H2a, H2d, H2e). However, another eleven out of thirteen hypotheses were rejected.
Table 7: Result Table of the Tested Hypotheses
Hypothesis Result
H1a Price sensitivity can be significantly explained by a customer’s demographic variables. This difference would be changed by gender.
Rejected
H1b Price sensitivity can be significantly explained by a customer’s demographic variables. This difference would be changed by marital status.
Rejected
H1c Price sensitivity can be significantly explained by a customer’s demographic variables. This difference would be changed by age.
Rejected
H1d Price sensitivity can be significantly explained by a customer’s demographic variables. This difference would be changed by education level.
Rejected
H1e Price sensitivity can be significantly explained by a customer’s demographic variables. This difference would be changed by profession.
Rejected
526 UİİİD-IJEAS, 2018 (17. UİK Özel Sayısı):515-532 ISSN 1307-9832
International Journal of Economic and Administrative Studies
H1f Price sensitivity can be significantly explained by a customer’s demographic variables. This difference would be changed by income level.
Supported
H2a Price sensitivity can be significantly explained by Neuroticism. Supported H2b Price sensitivity can be significantly explained by Openness to
Experience. Rejected
H2c Price sensitivity can be significantly explained by Conscientiousness. Rejected H2d Price sensitivity can be significantly explained by Extraversion. Supported H2e Price sensitivity can be significantly explained by Agreeableness. Supported H3 Consumers’ price sensitivity has a positive influence on repurchase
intention. Rejected
5. Conclusion
Understanding the price sensitivity of the consumers has great importance in determining the pricing strategies in terms of the business. For this, it is necessary to measure the price sensitivity of consumers in different product categories. Findings and their implications are discussed as follows.
A t-test analysis was conducted between socio-demographic characteristics and Price Sensitivity. The analysis showed that gender, marital status, age, education level, occupation and income level and Price Sensitivity were significantly different only in terms of income level.
T test was conducted between Personality Characteristics and Price Sensitivity. It was found that there is a significant difference between Neuroticism – Price Sensitivity, Extraversion - Price Sensitivity and Agreeableness – Price Sensitivity in the five factor personality traits. There was no difference between Conscientiousness – Price Sensitivity and Openness – Price Sensitivity.
In this context, price sensitivity of the consumers in the beverage category was measured in this study. In Turkey, the effect of price sensitivity on the intention to repurchase was measured based on the data obtained from consumers. As a result of the analysis, it has been determined that the price sensitivity of consumers in the beverage category does not affect the repurchase intention.
This study has a number of limitations. First, the research participants consisted of consumers with 94,4% undergraduate and graduate level education (43,9% university, 50,5% with masters and doctorate) and therefore can not be generalized. Second, the design of the questionnaire was made in the beverage category, which is a lower category of price, in order for the purchase decision to be made by consumers themselves. According to the researchers, this has led consumers to think that they will not be sensitive to the price of the products in this category. Because, in this context, there are no studies of consumers' behavior and subconscious thoughts, the results are not comparable.
Future studies should measure price sensitivity at an equal level of education. The search for the effect of consumers' price sensitivity on the repurchase intention in different product categories provides for the discussion of such research. At the same time, it should be investigated whether there is a difference between consumers' personality traits and price sensitivities in different product categories. Furthermore, consumers need to measure the price sensitivity and its effect on repurchase intention by means of qualitative research methods and unconscious measurement techniques, rather than by the questionnaire method.
References
Aaker, D. (1992). Strategic Management (3rd ed.). New York, NY: John Wiley and Sons.
Aaker, D. A. (1991). Managing Brand Equity. New York: The Free Press.

Aypar USLU, Bahman HUSEYNLI 527
Uluslararası İktisadi ve İdari İncelemeler Dergisi
Aliman, N.K. and Othman, M.N. (2007). Purchasing Local and Foreign Brands: What Product Attributes Metter? Proceedings of the 13th Asia Pacific Management Conference, 400-411, Melbourne, Australia,
Back, K. J. (2005). The Effects of Image Congruence on Customers’ Brand Loyalty in the Upper Middle-class Hotel Industry. Journal of Hospitality and Tourism Research, 29(4), 448-467.
Bearden, W. O. and Teel, J. E. (1983). Selected Determinants of Consumer Satisfaction and Complaint Reports. Journal of Marketing Research, 20(1), 21-28.
Benet-Martinez, V. and John, O. P. (1998). Los Cinco Grandes Across Cultures and Ethnic Groups: Multitrait-multimethod Analyses of the Big Five in Spanish and English. Journal of Personality and Social Psychology, 75(3), 729-750.
Bipp, T., Steinmayr, R. and Spinath, B. (2008). Personality and Achievement Motivation: Relationship among Big Five Domain and Facet Scales, Achievement Goals, and Intelligence. Personality and Individual Differences, 44(7), 1454-1464.
Boonpattarakan, A. (2012). An experimental Design to Test the Main and Interaction Effects of CSR Involvement, Brand Naming and Pricing on Purchase Intentions in Thailand. International Journal of Business and Management, 7(16), 62-79.
Busato, V. V., Prins, F. J., Elshout, J. J. and Hamaker, C. (1998). The Relation between Learning Styles, the Big Five Personality Traits and Achievement Motivation in Higher Education. Personality and Individual Differences, 26(1), 129-140.
Calder, B. J. and Burnkrant, R. E. (1977). Interpersonal Influence on Consumer Behavior: An Attribution Theory Approach. Journal of Consumer Research, 4(1), 29-38.
Casidy Mulyanegara, R. and Tsarenko, Y. (2009). Predicting Brand Preferences: An Examination of the Predictive Power of Consumer Personality and Values in the Australian Fashion Market. Journal of Fashion Marketing and Management: An International Journal, 13(3), 358-371.
Casidy, R. (2012). An empirical Investigation of the Relationship between Personality Traits, Prestige Sensitivity, and Fashion Consciousness of Generation Y in Australia. Australasian Marketing Journal (AMJ), 20(4), 242-249.
Costa, P. T. and Mccrae, R. R. (1985). The NEO Personality Inventory Manual. Odessa, FL: Psychological Assessment Resources.
Costa, P. T. and Mccrae, R. R. (1988). Personality in Adulthood: A Six-year Longitudinal Study of Self-reports and Spouse Ratings on the NEO Personality Inventory. Journal of Personality and Social Psychology, 54(5), 853.
Costa, P. T. and Mccrae, R. R. (1992). Four Ways Five Factors are Basic. Personality and Individual Differences, 13(6), 653-665.
Costa, P. T., and Mccrae, R. R. (1995). Domains and Facets: Hierarchical Personality Assessment Using the Revised NEO Personality Inventory. Journal of Personality Assessment, 64, 21-50.
Cravens, D. W., Piercy, N. F. and Baldauf, A. (2009). Management Framework Guiding Strategic Thinking in Rapidly Changing Markets. Journal of Marketing Management, 25(1-2), 31-49.
De Raad, B., And Schouwenburg, H. C. (1996). Personality in Learning and Education: A Review. European Journal of Personality, 10(5), 303-336.
Diamantopoulos, A. (2003). Pricing. In M. J. Baker (Ed.), The Marketing Book (pp. 342-359). Burlington, MA: Butterworth-Heinemann
528 UİİİD-IJEAS, 2018 (17. UİK Özel Sayısı):515-532 ISSN 1307-9832
International Journal of Economic and Administrative Studies
Dickson, P. R. and Sawyer, A. G. (1990). The Price Knowledge and Search of Supermarket Shoppers. The Journal of Marketing, 54(3), 42-53.
Digman, J. M. (1990). Personality Structure: Emergence of the Five-factor Model. Annual Review of Psychology, 41(1), 417-440.
Erickson, G. M. and Johansson, J. K. (1985). The Role of Price in Multi-Attribute Product Evaluations. Journal of Consumer Research, 12(2), 195-199.
Evanschitzky, H. and Wunderlich, M. (2006). An Examination of Moderator Effects in the Four-stage Loyalty Model. Journal of Service Research, 8(4), 330-345.
Fullerton, G. (2003). When Does Commitment Lead to Loyalty?. Journal of Service Research, 5(4), 333-344.
Furnham, A. (1996). The Big Five Versus the Big Four: The Relationship between the Myers-Briggs Type Indicator (MBTI) and NEO-PI Five Factor Model of Personality. Personality and Individual Differences, 21(2), 303-307.
Furnham, A. F. (1997). Knowing and Faking One's Five-factor Personality Score. Journal of Personality Assessment, 69(1), 229-243.
Gabor, A. and Granger, C. W. (1966). Price as an Indicator of Quality: Report on an Enquiry. Economica, 33(129), 43-70.
Gijsbrechts, E. (1993). Prices and Pricing Research in Consumer Marketing: Some Recent Developments. International Journal of Research in Marketing, 10(2), 115-151.
Goldberg, L. R. (1981). Language and Individual Differences: The Search for Universals in Personality Lexicons (Vol. 2, pp. 141 -165). In L. Wheeler (Ed.), Review of Personality and Social Psychology. Beverly Hills, CA: Sage.
Goldberg, L. R. (1990). An Alternative “Description of Personality”: The Big-Five Factor Structure. Journal of Personality and Social Psychology, 59(6), 1216-1229.
Goldberg, L. R. (1993). The Structure of Phenotypic Personality Traits. American Psychologist, 48(1), 26-36.
Goldberg, L. R. and Saucier, G. (1995). So What Do You Propose We Use Instead? A Reply to Block. Psychological Bulletin, 117(2), 221-225.
Goldsmith, R. E., Flynn, L. R. and Kim, D. (2010). Status Consumption and Price Sensitivity. Journal of Marketing Theory and Practice, 18(4), 323-338.
Grewal, D., Krishnan, R., Baker, J. and Borin, N. (1998). The Effect of Store Name, Brand Name and Price Discounts on Consumers' Evaluations and Purchase Intentions. Journal of Retailing, 74(3), 331-352.
Gupta, N. (2011). Extent of Susceptibility to Interpersonal Influence and Price Sensitivity among Indian Youth: Is here a Relationship between These Two Constructs?. Young Consumers, 12(4), 361-369.
Hair, J. F., Black, W. C., Babin, B. J., Anderson, R. E. and Tatham, R. L. (2006). Multivariate Data Analysis. (6th Ed.), Uppersaddle River: Pearson Prentice Hall.
Hamel, G. and Prahalad, C. K. (1993). Strategy as Stretch and Leverage. Harvard Business Review, 71(2), 75-84.
Han, H. and Back, K. J. (2008). Relationships among Image Congruence, Consumption Emotions, and Customer Loyalty in the Lodging Industry. Journal of Hospitality and Tourism Research, 32(4), 467-490.
Aypar USLU, Bahman HUSEYNLI 529
Uluslararası İktisadi ve İdari İncelemeler Dergisi
Han, H. and Ryu, K. (2009). The roles of the Physical Environment, Price Perception, and Customer Satisfaction in Determining Customer Loyalty in the Restaurant Industry. Journal of Hospitality and Tourism Research, 33(4), 487-510.
Hocutt, M.A. (1998). Relationship Dissolution Model: Antecedents of Relationship Commitment and the Likelihood of Dissolving a Relationship. International Journal of Service Industry Management, 9(2), 189-200.
John, O. P. (1990). The "Big Five" Factor Taxonomy: Dimensions of Personality in the Natural Language and in Questionnaires. In L. A. Pervin (Ed.), Handbook of Personality: Theory and Research (pp. 66- 100). New York: Guilford Press.
Jones, E. E. and Davis, K. E. (1965). From Acts to Dispositions the Attribution Process in Person Perception. In Advances in Experimental Social Psychology. (Vol. 2, pp.219-266), Academic Press.
Kaiser, H.F. (1974). An Index of Factorial Simplicity. Psychometrika, 39(1), 31-36.
Kalyanaram, G. and Winer, R. S. (1995). Empirical Generalizations from Reference Price Research. Marketing Science, 14(3), 161-169.
Kim, D. J., Ferrin, D. L. and Rao, H. R. (2009). Trust and Satisfaction, Two Stepping Stones for Successful E-commerce Relationships: A Longitudinal Exploration. Information Systems Research, 20(2), 237-257.
Kotler, P. and Keller, K. L. (2006). Marketing Management. (12th ed.) Prentice Hall, Upper Saddle River.
Lichtenstein, D. R., Ridgway, N. M. and Netemeyer, R. G. (1993). Price Perceptions and Consumer Shopping Behavior: A Field Study. Journal of Marketing Research, 30(2), 234-245.
Link, F. (1997). Diffusion Dynamics and the Pricing of Innovations. (Unpublished Doctoral Thesis). Lund Studies in Economics and Management, The Institute of Economic Research, Lund University, Lund, Sweden.
Marshall, A. (1890). Principles of Economics: An Introductory Volume. London: Macmillan.
Maxwell, S. (2001). An Expanded Price/Brand Effect Model – Demonstration of Heterogeneity in Global Consumption. International Marketing Review, 18(3), 325-43.
Mayhew, G. E. and Winer, R. S. (1992). An Empirical Analysis of Internal and External Reference Prices Using Scanner Data. Journal of Consumer Research, 19(1), 62-70.
Mccrae, R. R. and Costa, P. X, Jr. (1985). Comparison of EPI and Psychoticism Scales with Measures of the Five-factor Model of Personality. Personality and Individual Differences, 6(5), 587-597.
Miller, J. (2006). Online Marketing Research. In Grover, R. and Vriens, M. (2006). The Handbook of Marketing Research: Uses, Misuses, and future Advances (pp 110-131). Sage.
Munnukka, J. (2005). Dynamics of Price Sensitivity among Mobile Service Customers. Journal of Product and Brand Management, 14(1), 65-73.
Munnukka, J. (2008). Customers' Purchase Intentions as a Reflection of Price Perception. Journal of Product and Brand Management, 17(3), 188-196.
Nelson, E. C., Rust, R. T., Zahorik, A. and Rose, R. L. (1992). Do Patient Perceptions of Quality Relate to Hospital Financial Performance?. Marketing Health Services, 12(4), 6-13.
530 UİİİD-IJEAS, 2018 (17. UİK Özel Sayısı):515-532 ISSN 1307-9832
International Journal of Economic and Administrative Studies
Noh, M., Lee, K., Kim, S. and Garrison, G. (2013). Effects of Collectivism on Actual S-commerce Use and the Moderating Effect of Price Consciousness. Journal of Electronic Commerce Research, 14(3), 244–260.
Nunnally, C. J. (1978). Psychometric Theory. New York: McGraw Hill Book Co.
Oliver, R. L. (1999). Whence Customer Loyalty?. Journal of Marketing, 63(Special Issue), 33-44.
Oliver, R.L. (1980). A Cognitive Model of the Antecedents and Consequences of Satisfaction Decisions. Journal of Marketing Research, 17(4), 460-469.
Oliver, R.L. (1981). Measurement and Evaluation of Satisfaction Processes in Retail Settings. Journal of Retailing, 57(3), 25-48.
Otim, S. and Grover, V. (2006). An Empirical Study on Web-based Services and Customer Loyalty. European Journal of Information Systems, 15(6), 527-541.
Porter, M. E. (1985). Competitive Advantage: Creating and Sustaining Superior Performance. New York: FreePress.
Porter, M. E. (2008). The Five Competitive Forces that Shape Strategy. Harvard Business Review, 86(1), 79-93.
Rajendran, K. N. and Tellis, G. J. (1994). Contextual and Temporal Components of Reference Price. Journal of Marketing, 58(1), 22-34.
Ramirez, E. and Goldsmith, R. E. (2009). Some Antecedents of Price Sensitivity. Journal of Marketing Theory and Practice, 17(3), 199-214.
Rao, V. R. and Kartono, B. (2009). Pricing Objectives and Strategies: A Cross-country Survey. In Rao, V.R. (Ed.), Handbook of Pricing Research in Marketing, (pp. 9-36), Edward Elgar Publishing.
Renison, K. and Hardt, L. (2008). Price and Revenue Optimization for Banking. In Proceedings of the SAS Global Forum 2008, 1-7, San Antonio, Texas, USA
Roest, H. and Pieters, R. (1997). The Nomological Net of Perceived Service Quality. International Journal of Service Industry Management, 8(4), 336-351.
Santonen, T. (2007). Price Sensitivity as an Indicator of Customer Defection in Retail Banking. International Journal of Bank Marketing, 25(1), 39-55.
Saucier, G. and Goldberg, L. R. (1996). The Five-factor Model of Personality: Theoretical Perspectives. In Wiggins, J.S. (Ed)., The Language of Personality: Lexical Perspectives. (pp. 21-50), Guiford Press.
Schmitt, D. P., Allik, J., Mccrae, R. R. and Benet-Martinez, V. (2007). The Geographic Distribution of Big Five Personality Traits: Patterns and Profiles of Human Self-Description Across 56 Nations. Journal of Cross-Cultural Psychology, 38 (2), 173-212.
Silva, W. G. M., Udugama, J. M. M. and Jayasinghe-Mudalige, U. K. (2012). Consumer Perceptions on Quality Attributes of Liquid Food Products: An Empirical Analysis Based on Urban Households. Journal of Agricultural Sciences, 7(2), 85-96.
Simonson, I. (1989). Choice Based on Reasons: The Case of Attraction and Compromise Effects. Journal of Consumer Research, 16(2), 158-174.
Sproles, G.B. and Kendell, E.L. (1986). A Methodology for Profiling Consumers’ Decision Making Styles. The Journal of Consumer Affairs, 20(2), 267-79.
Srinivasana, S. S., Anderson, R. and Ponnavolu, K. (2002). Customer Loyalty in E-commerce: An Exploration of Its Antecedents and Consequences. Journal of Retailing,78(1), 41-50.
Aypar USLU, Bahman HUSEYNLI 531
Uluslararası İktisadi ve İdari İncelemeler Dergisi
Storbacka, K., Strandvik, T. and Grönroos, C. (1994). Managing Customer Relationships for Profit: The Dynamics of Relationship Quality. International Journal of Service Industry Management, 5(5), 21-38.
Sümer, N. and Sümer, H. C. (2005). Five Factor Personality Trait Scale. Unpublished Study.
Tellis, G. J. (1988). The Price Elasticity of Selective Demand: A Meta-analysis of Econometric Models of Sales. Journal of Marketing Research, 25(4), 331-341.
Trapnell, P. D. and Wiggins, J. S. (1990). Extension of the Interpersonal Adjective Scales to Include the Big Five Dimensions of Personality. Journal of Personality and Social Psychology, 59(4), 781-790.
Tucker, S. (1966). Pricing for Higher Profit: Criteria, method, applications. New York, NY. McGraw-Hill.
Voss, G. B. and Seiders, K. (2003). Exploring the Effect of Retail Sector and Firm Characteristics on Retail Price Promotion Strategy. Journal of Retailing, 79(1), 37-52.
Wakefield, K. L. and Inman, J. J. (2003). Situational Price Sensitivity: The Role of Consumption Occasion, Social Context and Income. Journal of Retailing, 79(4), 199-212.
Winer, R. S. (1986). A Reference Price Model of Brand Choice for Frequently Purchased Products. Journal of Consumer Research, 13(2), 250-256.
Zahorik, A. J. and Rust, R. T. (1992). Modeling the Impact of Service Quality on Profitability: A Review. Advances in Services Marketing and Management, 1(1), 247-76.
Zeithaml, V. A. (1988). Consumer Perceptions of Price, Quality, and Value: A Means-end Model and Synthesis of Evidence. The Journal of Marketing, 52(3), 2-22.

532 UİİİD-IJEAS, 2018 (17. UİK Özel Sayısı):515-532 ISSN 1307-9832
International Journal of Economic and Administrative Studies