impact of proposed commodity transaction tax on future … · 2012-01-16 · impact of proposed...
TRANSCRIPT

IMPACT OF PROPOSED COMMODITY TRANSACTION TAX ON FUTURES TRADING IN INDIA
Pravakar Sahoo Rajiv Kumar
Abstract
Trading in commodity derivatives on exchange platforms is an instrument to achieve price discovery better price risk management besides helping macro-economy with better resource allocation In the union budget 2008-09 the government has proposed to impose a commodity transaction tax (CTT) of 0017 In this context we examine the relationship between trading activity volatility and transaction cost using a three-equation structural model for five top selected commodities namely Gold Copper Petroleum Crude Soya Oil and Chana (Chickpea) Results suggest that there exists a negative relationship between transaction cost and liquidity and a positive relationship between transaction cost and volatility Therefore if the government imposes CTT it would lead to higher volatility and lower trading activity affecting market efficiency and liquidity Increased volatility may lead to more speculative activity and fail to achieve the price discovery and resource allocation objectives of the commodity markets Further the granger causality results reveal the efficiency of futures markets but do not provide any conclusive evidence about the nexus between price rise and futures trading
JEL Classification G19 G13 G14 L71 Q40 Key Words Commodity Transaction Tax Futures Market Liquidity Volatility
bull Senior Fellow Indian council for Research on International Economic Relations
(ICRIER) New Delhi bull Director and Chief Executive Indian council for Research on International Economic
Relations (ICRIER) New Delhi
Note We thank Prof B Kamaiah and ICRIER colleagues researchers for useful comments and suggestions We also thank Multi Commodity Exchange (MCX) for providing the required data and other useful information However the usual disclaimer applies
1
Impact of Proposed Commodity Transaction Tax on Futures Trading in India
I Introduction
A commodity exchange is defined as a market where multiple buyers and sellers trade
commodity-linked contracts on the basis of terms and conditions laid down by the exchange
(UNCTAD 2007) Since the commodity exchanges provide a forum for trading commodity-
linked contracts they reduce the transaction cost associated with finding a buyer or seller
Further most importantly the hedging and price discovery functions of future markets
promote more efficient production planning storage marketing rationalization of transaction
costs amp better margins for producers (Gilbert 1985 Varangis and Larson 1996 Morgan
1999 World Bank 1999) Since the inception of economic reforms in India in 1991 there
have been efforts to open up futures trading in commodity markets which led to withdrawal of
its prohibition in 2003 The volume of futures trade grew1 exponentially in agricultural
commodities till 2005-06 but the trade in bullion and other metals has overtaken it since
2006-07
Efficient functioning of future markets arguably results in many benefits for optimal
decision making and resource allocation such as (i) Price Discoveryndashwhich is determined in
this competitive market on the basis of estimated current and future supply and demand
However efficiency of price discovery depends on the continuous flow of information and
transparency2 (UNCTAD 2007) Price discovery in futures market guides producers to make
decisions on the timing of trade and farmers in making cropping decisions etc Overall price
discovery reduces the so-called ldquocobweb effectrdquo of inter-seasonal price fluctuations (ii) Risk
Reductionndashfutures markets allow market participants such as farmers traders processors etc
to hedge their risk against price volatility by offering trade in commodity forwards futures
and options The price discovery in futures markets which facilitates in stabilizing prices of
commodities can potentially offset losses or price risk by hedging (Morgan 2000) Hedging
can bring greater certainty over the planting cycle confidence to invest adjust cropping 1 See Table-1 and Table-2 in Appendix at the end All the tables are given in Appendix at end 2 Factors such as natural calamities political instability climate change etc can all have a major effect on supply and demand and as a result the present and future price of a commodity
2
patterns diversify risk profile and opt for higher-risk but higher-revenue crops3 (iii) Risk
Sharing - future commodity markets allows for risk sharing among various market
participants4 Thus overall future markets promote more efficient production planning
storage marketing and better margins for producers by providing a mechanism for risk
management and price discovery (Gilbert 1985 Varangis and Larson 1996 Morgan 1999
World Bank 1999)
However futures markets have also been criticized for several reasons namely (i)
futures trading drives up prices as speculators use liquid market to manipulate prices5 which
works against the interest of growers and consumers (ii) futures trading drives up volatility
though the existing limited empirical evidence does not support this view6 (Naik 1970
Dasgupta 2004) (iii) futures market is not transparent though the transparency depends upon
information symmetry and level of infrastructure
Government of India has proposed to impose transaction tax by 0017 in the 2008-
09 budget almost increasing the total transaction cost by more than 950 percent (see Table-3)
The stated rationale for imposing CTT is to contain price rise volatility in future markets and
to bring in more transparency But this rationale is not much rooted from literature Given the
benefits of the futures markets as briefly discussed and the nascent stage of commodity
exchange in India today this study makes an attempt to assess the impact of proposed
transaction tax on liquidity volatility prices and efficiency of commodity derivative markets
in India The findings of this paper it is hoped will also contribute to the general debate on
the welfare implications of future commodity markets
3 See UNCATD 2007 for details 4 For example farmers can sell in futures to ensure remunerative prices A manufacturing firm can buy in futures to hedge against volatile raw material costs An exporter can commit to a price to his foreign clients A stockistsupplier can hedge his carrying risk to ensure smooth prices of seasonal commodities round the year 5 For example in case of some bad news about the future the speculators start hoarding the commodities amp hence artificially drive up the prices But in case of some negative news about future the prices are going to go up irrespective of whether futures market is there or not
6 Contrary Naik (1970) finds that the fluctuation in prices of commodities was higher when there were no futures trading as compared to prices when there were futures trading
3
The rest of the paper is structured as follows Section-II describes the development of
commodity futures market in India Section-III explains the commodity transaction tax
Section-IV deals with the global experience with Commodity Transaction Tax (CTT)
Section-V explains the methodology and empirical analysis of CTT on liquidity volatility
prices and efficiency Section-VI presents the conclusions and the policy implications
II Development of Commodity Futures Market in India
India is one of the top producers of agricultural commodities and a major consumer of
bullion and energy products Given the importance of commodity production and
consumption in India it is necessary to develop the commodity markets with proper
regulatory mechanism for efficiency and optimal resource allocation In this section we
review the growth and performance of commodity markets in India
Origin of Commodity market The history of organized commodity futures market
in India goes back to the nineteenth century when the cotton trade association started futures
trading in 1875 followed by derivatives trading in oilseeds in Bombay (1900) raw jute and
jute goods in Calcutta (1912) wheat in Hapur (1913) and bullion in Bombay (1920)
However many feared that derivatives fuelled unnecessary speculation and the Government
of Bombay prohibited options business in cotton in 1939 Further forward trading was
prohibited in oilseeds and some other commodities including food-grains spices vegetable
oils sugar and cloth in 1943 Post independence the Indian constitution listed the subject of
ldquoStock Exchanges and Futures Marketsrdquo under the union list and a legislation called Forward
Contract Act 1952 was enacted on the basis of recommendations of the Shroff Committee
providing legal framework for organized forward trading The first organized future trading
was by the India Pepper and Spices Trade Association (IPSTA) in Cochin in 1957 However
futures trade was prohibited in most of the commodities thereafter Since then both the
Dantawala Committee (1966) and the Khusro Committee (1980) have recommended the
revival of futures trading in agricultural commodities7
7 See the Report ldquoThe Impact of Future Trading on Agricultural Commoditiesrdquo 2008 for more on history of future trading in India Now onwards Expert Committee Report 2008 (EC 2008) Brief Review of the EC report has been given in Appendix
4
After the 1991 reforms the Government set up a Committee in 1993 headed by Dr
KN Kabra to examine the role of futures trading The committee recommended that futures
trading in 17 commodities be permitted Further National Agricultural Policy (2000) and the
expert committee on strengthening and developing Agricultural Marketing (2001 Guru
Committee) supported commodity futures trading In February 2003 the government revoked
the ban and accepted most of these recommendations allowing futures trading in 54
commodities in bullion and agricultural sectors Responding positively to the favourable
policy changes several Nation-wide Multi-Commodity Exchanges (NMCE) were up since
2002 using modern practices such as electronic trading and clearing The Forward Markets
Commission (FMC) regulates these exchanges8
Structure of Commodity Market in India Trading in commodity market takes
place in two distinct forms such as the Over-The-Counter (OTC) which is basically spot
market and the exchange-based market Further as in equities there exists the spot where
participation is restricted to people who are involved with that commodity such as the farmer
processor wholesaler etc and the derivatives segments where trading takes place through the
exchange-based markets like equity derivatives
At present there are 23 exchanges operating in India and carrying out futures trading
activities in as many as 146 commodity items (see Fig-1) As per the recommendation of the
FMC the Government of India recognized the National Multi-Commodity Exchange
(NMCE) Ahmedabad Multi Commodity Exchange (MCX) and National Commodity and
Derivative Exchange (NCDEX) Mumbai as nation-wide multi-commodity exchanges
NMCE commenced in November 2002 and MCX in November 2003 and NCDEX in
8 At present there are three tiers of regulations of forwardfutures trading system in India viz Government of India Forward Markets Commission and Commodity Exchanges
5
December 2003 Unlike the stock markets the commodity markets in India have a single
product (only futures) and a single user9 (only traders including corporates)
Growth of Commodity Futures Market The volume of trade has increased
exponentially since 2004-05 to reach Rs 4065 lakh crore in 2007-08 Almost 95 of this is
now accounted for by the two national exchanges viz Mumbai (MCX) with around 75
share and NCDEX with 20 share (see Figure-2) There are more then 3000 members
registered with the exchanges More than 20000 terminals spread over more than 800
townscities of the country provide access to the trading platforms (EC 2008) Gold silver
and petroleum crude recorded the highest turnover in MCX while in NCDEX soya oil guar
seed and soyabean was dominant in NMCE pepper rubber and raw jute were the most
actively traded commodities Though in India agricultural products dominate the commodity
sectors trading in non-agricultural commodities has been dominating particularly from 2006-
07 onwards The trading volumes of non-agricultural commodities have shot up almost twice
that of agricultural commodities during the same period Overall the Indian commodity
market has shown tremendous growth in terms of both value and the number of commodities
traded in the last five years As the largest commodity futures exchange during 2006-07 both
in terms of turnover and number of contracts the growth of MCX is comparable (see Figure-
3) with some of the international commodity futures exchanges such as Dow Jones AIG
Commodity Index (DJAIG) and ReutersJefferies Commodity Research Bureau (RJCRB) A
comparative picture of the volume of trade in major commodity derivative market is reported
in Table-4
Performance of Indian Commodity Derivatives Market There are few empirical
studies on the performance of Indian commodity derivatives market A study by Lokare
(2007) finds that although Indian commodity market is yet to achieve minimum critical
liquidity in some commodities (sugar peper gur and groundnut) almost all the commodities
show an evidence of co-integration between spot and future prices revealing the right
direction of achieving improved operational efficiency albeit at a slower pace Further 9 The stock markets in India have options and indices meeting the needs of people with various risk taking ability Further unlike in stock markets commodity markets are not open to banks mutual funds and foreign institutional investors
6
hedging proves to be an effective proposition in respect of some commodities However in a
few commodities the volatility in the future price has been substantially lower than the spot
price indicating an inefficient utilisation of information Several commodities also appear to
attract wide speculative trading One of the reasons for low volumes could be attributed to
some of the measures that FMC undertook in the recent period such as daily mark to market
margining time stamping of trades demutualisation for the new exchanges etc with a view
to promote market integrity and transparency The exchanges have attributed subsequent fall
in the volume of trade to introduction of these measures 10(Kolamkar 2003) Thomas (2003)
reports that major stumbling blocks in the development of derivatives market are the
fragmented physicalspot markets Supporting this view Lokare (2007) suggests that national
level derivative exchanges cannot be founded on fragmented localized cash markets Because
of fragmentation prices of major commodities vary widely across Mandis These differences
arise because of poor grading differential rates of taxes and levies and inadequacy of storage
facilities (Bhattacharya 2007) Similarly Raizada and Sahi (2007) found that commodity
futures market is not efficient in the short-run and social loss statistics also indicate poor price
discovery in the commodity market Spot price leads the futures price determination and the
futures markets are not performing their main role of price discovery There were also doubts
that the growth of commodity futures market volume has an impact on the inflation level in
India Though EC (2008) report does not find any conclusive evidence between futures
trading in agricultural commodities and their price level The change in price level and
volatility in top ten agricultural commodities are shown in fig-4 and fig-5 The analysis of the
EC report does not show any clear evidence of either reduced or increased volatility of spot
prices due to futures trading Further the fact that agricultural price inflation accelerated during the
post futures period does not however necessarily mean that this was caused by futures trading One
reason for the acceleration of price increase in the post futures period was that the immediate pre-
futures period had been one of the relatively low agricultural prices reflecting an international
downturn in commodity prices
10 The exchanges like Bombay Commodity Exchange and Kanpur Commodity Exchange which implemented most of these reforms were literally deserted by all the traditional players (Kolamkar 2003)
7
IV Commodity Transaction Tax in India
The government has proposed to impose CTT in budget 2008-09 in line with the
Securities Transaction Tax (STT) thereby bringing the futures market under the net of service
tax CTT shall be charged in respect of every taxable commodities transaction The sale of an
option in goods or an option in commodity derivative or sale of any other commodity
derivative would attract 0017 of CTT which is payable by the seller and is calculated on
the basis of option premium and selling price respectively This entails a rise of total
transaction cost from Rs 200 per lakh to Rs 1925 per lakh ndash more than 950 percent increase
on an average (see Table-3 and Table-5) Increase in CTT is contrary to the observation in the
Economic Survey 2007-08 ldquoDirect participation of the framers in the commodity futures
markets is somewhat difficult at this stage as the large lot size daily margining high
membership fees etc work as deterrent for framersrsquo participation in these marketsrdquo and the
increase in CTT will further increase the cost11 Though Agricultural Produce Marketing
Committee (APMC) Act makes provision that no tax cess or mandi fee is payable by the
farmers they will pay CTT as it is proposed to be levied on sellers It implies that a farmer
who sells a futures contract to protect himself against price risk will be required to pay CTT12
Generally commodity derivatives are based on global asset class and investors can
choose between MCX NCDEX NMCE or NYMEX (New York) CBOT (Chicago)
TOCOM (Tokyo) SFE (Shanghai) for trading Therefore Indian commodity exchanges have
to match the transaction costs applicable at their international peers to attract investors Any
increase in the transaction tax beyond the international level may drive the volume to
international exchanges or unofficial dabbas Hence applying CTT means exporting our
market to other global exchanges as CTT is not levied in these leading exchanges (Table-5) It
is clear that the transaction cost for trading value of Rs 1 lakh will be the highest in the world
after the levy of CTT and service tax
11 There is also no evidence of imposition of CTT in other exchanges in the rest of the world
12 Some of exchanges also claim that the commodity before it comes for trading in commodity exchanges is already charged to the tune of almost 12 per cent with taxes such as mandi tax the cess the handling cost and warehousing charges
8
The Argument for CTT The rationale for levying CTT may have been guided by the
following argument (i) generating revenue- one of the motives for levying CTT is to generate
tax revenues However actual realization of revenue from CTT may not be significant if the
volume of trading falls in response to the CTT Further traders may migrate their investment
to foreign exchanges in order to seek lower transaction tax and retain profit (Umlauf 1993)
(ii) tracking information for better tax compliance CTT may have been designed as an anti-
evasion measure But all national commodity exchanges have world class surveillance
systems with proper auditing and are regulated by FMC Hence tracking is always possible
even without imposition of CTT (iii) reducing excess volatility proponents believe that the
transaction tax could act as a fundamental function to reduce excess volatility by reducing
noise trading However there is also the possibility that increase in transaction tax may not
necessarily check price volatility (see Roll 1989 Kupiec 1991 Grundfest and Shovel 1990)
IV Impact of Transaction Tax Global Experience
There have been considerable debates on the costs and benefits of imposing
transaction taxes on the securities and derivatives markets In general proponents of a
transaction tax argue that it would generate revenues (see Kiefer 1990) and discourage
speculative trading Transaction taxes can also help reduce noise trading a significant source
of price fluctuations and hence decrease the return volatility (see Stiglitz 1989 Summer and
Summer 1989)
Opponents argue that the benefits of a transaction tax are likely to be outweighed by
its potential costs because it would increase the cost of capital (Amihud and Mendelson
1993) reduce market liquidity (ie decrease in trading volume and increase in bid-ask
spreads) not necessarily reduce excess price volatility (Kupiec 1991 Grundfest and Shoven
1990) and bring down securitiesrsquo values (Amihud and Mendelson 1990) Recently Lo
Mamaysky and Wang (2003) developed a theoretical model showing that fixed transactions
costs would induce large ldquono-traderdquo regions decrease securitiesrsquo liquidity and result in a
significant illiquidity discount in asset prices
9
Edwards (1993) examines the rationale for extending tax on security markets futures
to commodity markets futures in the USA and analyzes the potential effect His findings
reveal that tax on futures market will not generate substantial tax revenues and it will increase
bid-ask spread and may shift trading volume to overseas markets weakening the international
competitiveness of US futures markets Further a transaction tax would generate indirect
costs for hedgers as they need to pay higher risk premiums to speculators due to the reduction
in trading volume
On the effect of transaction tax on trading volume Ericssion and Lindgren (1992)
analyze the cross-sectional data for twenty three exchanges in twenty two countries They find
that an increase in the transaction tax would reduce average turnover (measured as trading
volumeshares outstanding) Wang and Yau (1994) examine the relations between trading
volume bid ask spread and price volatility in four US futures markets Inferring that a
transaction tax would have the same effects as wider bid-ask spreads they find that such a tax
will reduce trading volume increase price volatility and generate moderate increase in tax
revenues Baltagi et al (2006) find that an increase in the Chinese stamp tax rate by 02
percentage points reduces the trading volume by one third
Roll (1989) examines whether countries with transaction taxes have a lower volatility
and finds the answer to be negative Similarly Umlauf (1993) finds that the introduction of
or increase in the Swedish transaction tax would lead to an increase in stock market price
volatility Examining the effect of changes in transaction taxes in four Asian countries Hu
(1998) finds insignificant impact of transaction taxes on price volatility but significant
negative impact on stock returns in some countries Saporta and Kan (1997) investigate the
effect of the UK stamp duty on the volatility of continuously compounded 15-minute returns
over daily weekly and monthly time periods The results reveal that there is no evidence of
any kind of effect positive or negative on the volatility
There is also empirical evidence that imposition of increase in STT would decrease
return Hu (1998) finds that upon the announcement of the tax the average return fell 157 per
cent in Taiwan and by 055 per cent in Korea Umlauf (1993) estimates that the Swedish All-
Share equity index fell 22 per cent when the 1 per cent tax was announced in 1983 and by 08
10
per cent when the tax rate was increased in 1986 In the UK Saporta and Kan (1997) report
that the equity index declined by 333 per cent on the announcement of an increase in stamp
duty rate from 1 per cent to 2 per cent When the stamp duty was decreased from 2 per cent to
1 per cent and then from 1 per cent to 05 per cent the index increased by 0558 per cent and
1054 per cent respectively
Potential revenue and ease of collection from imposition of a transaction tax are
attractive to governments However Umlauf (1993) reports that the decreased levels of
trading in response to transaction tax resulted in decreased capital gains revenue in Sweden
Table 6 presents an international comparison of direct revenues from transaction taxes in the
mid 1980s The table includes a wide range of seemingly contradictory entries Switzerland
with a tax rate not much different from that of Germany raised twelve times as much revenue
in relation to the size of the economy Italy with a relatively low tax rate generates an
impressive amount of revenue The UK tax which also brings in an ample amount of revenue
taxes away 001 of the market value of equity far out of line with the tax in other countries
such as Germany that raise less revenue Recently a study by Schulmeister Schratzenstaller
and Picek (2007) estimates the transaction tax revenue of different countries It is seen that the
revenue from transaction tax varies between 001 for France to 17 for Spain depending on
the tax rate (see Table 7)
Chou and Lee (2002) provide interesting empirical evidence on the effect of the
transaction tax on liquidity and market efficiency They demonstrate that after the tax
reduction on the Taiwan Futures Exchange (TAIFEX) the TAIFEX assumed a leading role
over the Singapore Stock Exchange (SGX) in the price discovery process for the index futures
contracts Supporting Chou and Lee Hsieh (2004) also notes that the information advantage
of SGX has diminished as the TAIFEX lowered its transaction tax Finally in a review article
by Habermeier and Kirilenko (2003) they conclude that transactions taxes have a significant
impact on the transformation of investor demands into transactions Transaction taxes are
found to delay the price discovery process increase volatility and reduce market liquidity
11
Using futures market data Aliber et al (2003) find a positive relationship between
transaction costs and volatility and a negative relation between trading volume and
transaction cost in the foreign exchange futures market for the British Pound Japanese Yen
and Swiss Franc (against the US Dollar) Constantinides (1986) and Hegde and Miller
(1989) show that increases in transaction costs cause investors to reduce the frequency and
volume of trading Another study by Aitken Duffy and Frino (194) documents a decrease in
trading activity by 15 due to increase in transaction fee by $1 per contract for the case of
Austria Similarly Chou and Wang (2005) found that following the reduction in transaction
tax the trading volume had increased and the bid-ask spread had decreased
Futures Market and Inflation Empirical literature on Futures Market and inflation
compare spot market volatility before and after the introduction of futures trading and
investigate the impact of futures activity on spot volatilities Kamara (1982) finds that the
introduction of commodity futures trading generally reduced or at least did not increase the
cash price volatility Further Singh (2000) investigated the hessian cash (spot) price
variability before and after the introduction of futures trading (1988-1997) in Indian markets
using the multiplicative dummy variable model and concluded that futures trading had
reduced the price volatility in the hessian cash market However Yang et al (2005) showed
that an unexpected and unidirectional increase in futures trading volume drove up the cash
price volatility
On the other hand the study by Nitesh (2005) reveals that futures trading in soya oil
futures was effective in reducing the seasonal price volatilities but not the daily price
volatilities in India Similarly Sahi (2006) finds that the nature of volatility did not change
with the introduction of futures trading in wheat turmeric sugar cotton raw jute and soya
oil Nevertheless a weak destabilizing effect of futures on spot prices was found in case of
wheat and raw jute Further the results of granger causality tests indicated that the unexpected
increase in futures activity in terms of rise in volumes and open interest caused an increase in
the cash price volatilities in all the commodities listed Nath and Reddy (2007) find that
futures activity leads to price volatilities in the case of urad dal but not in the case of gram
12
and wheat Therefore the study concludes that the belief that futures trading contributes to
rise in inflation (WPI) appears to have no merit in the present context
A study by the Indian Institute of Management Bangalore (IIMB) in 2008 explains
that changes in fundamentals (mainly from the supply side) along with government policies
were causing higher post-futures price rise and the role of futures trading remained unclear
EC (2008) while analyzing the impact of futures trading on commodity prices found that out
of 21 commodities price volatility increased in 10 commodities remained unchanged in two
and declined in 9 after the introduction of futures trading13 However the committee could
not find any strong conclusion on whether introduction of futures trade is associated with
decrease or increase in spot price volatility Looking at price growth and price volatility of top
ten agricultural commodities consisting major future trade it is not clear whether future
trading contributes to price rise or price volatility
Migration to Overseas Market Empirical evidence (Umlauf 1993 Edwards 1993
Habermeier and Kirilenko 2003) suggests that when a government levies or increases
transaction tax on local markets investors shift their trading to overseas markets For
example the Euro-dollar market developed in response to American governmentrsquos attempts to
control capital exports and place other regulations on the banking system Euro-dollar market
grew from US $20 billion in 1964 to over US $3 trillion in gross size by 1988 Switzerland a
world banking centre also suffered from financial migration Its stamp duty also caused the
mutual fund business to migrate to Luxembourg and the Eurobond and equity business to go
to London By 1993 22 of trading in Swiss companies was taking place in London up from
16 only two years earlier In 1993 the Swiss government abolished the 15 stamp duty on
a wide variety of securities to stem such migration
The impact of transaction tax on the location of financial transactions was also felt in
Germany and France In 1989 before the elimination of Germanyrsquos taxes 30 of trading in
German government bonds and 50 of trades in other DM-denominated bonds took place in
London Moreover about one-third of the trading in French and German public companies
took place in London where almost one-half of the daily volume of trade is in shares of 13 See Fig-5 and Fig-6 for top ten commodities taken out these 21 commodities
13
foreign companies In the case of Sweden Umlauf (1993) reports that when the STT was
increased to 2 per cent in 1986 60 per cent of the trading volume of the 11 most actively
traded Swedish share classes migrated to London where there was no transaction tax This
was equal to 30 per cent of the total trading volume By 1990 the volume had increased to 50
per cent
V Empirical Methodology
Following Aliber Chowdhry and Yan (2003) and Chou and Wang (2005) we
examine the effects of transaction costs due to imposition of CTT on volatility and volume
of trading Following previous empirical literature and assuming that imposition of CTT
would increase the transaction cost which is proxied by the bid-ask spread we estimate the
relationship between trading volume volatility and transaction cost in commodity futures
market14 in a three-equation structural model framework The empirical structural model is
specified as follows
IVt = a1+ b11 BASt + b12 TVt + b13 IVt-1 + b14 VSPt + e1t helliphelliphelliphellip (1) TVt = a2+ b21 BASt + b22 IVt + b23 TVt-1 + b24 OIt + e2t helliphelliphelliphellip (2) BASt = a3+ b13 BASt-1 + b23 IVt + b33 TV + e3t helliphelliphelliphelliphelliphelliphellip (3)
Where IVt is the daily price volatility defined as
σi =
2
1)(sum
minus
n
ttr helliphelliphelliphelliphellip(4)
Where rt is the return series calculated as log (PtPt-1) Pt is the future price at period t and Pt-1
is the future price at period t-1 nit is the number of trading days TVt is the trading volume of
the futures market on the tth day and BASt is the intraday effective bid-ask spreads on the ith
day Effective Bid-Ask spread is defined as BASt = (AskndashBid) (Bid + Ask) OIt is the open
14 The trading volume and trading volatility is calculated for five commodities traded in MCX which is the major commodity exchange market
14
interest and VSPt is the spot price volatility defined in equation-4 IVt is intraday price
volatility on the tth day
In equation 1 volatility in future price (IVt) is a function of trading volume in futures
contracts (TVt) the effective bid-ask spread (BASt) the lagged volatility (IVt-1) and the Spot
Price Volatility (VSPt) Admati and Pfleider (1990) argue that the informed traders are more
likely to trade than the liquidity traders15 (who bring volume to the market) This suggests that
higher volume in futures will lead to higher volatility and hence there exists a simultaneity
relationship between volatility and volume Similarly Aliber et al (2003) found a positive
relationship between transaction costs (BASt) and volatility for foreign exchange market In
equation 2 trading in futures contract (TVt) is modeled as a function of the effective bid-ask
spread (BASt) price volatility (IVt) lagged trading volume (TV t-1) and open interest (OIt)
The bid-ask spread represents a major component of the transaction cost which is
expected to have an adverse impact on the trading volume Higher transaction cost would
reduce the opportunity for market participants to make profitable trades thereby forcing them
to search for alternative trading vehicles with lower transaction cost Hence trading volume is
expected to be negatively related to the size of the bid-ask spread (Constantinides 1986
Hegde and Miller 1989 Aliber et al 2003) Open interest is the total number of outstanding
futures contracts It is expected to a have a positive impact on trading volume because higher
open interest generates more trading volume
Following prior research Aitken and Frino (1994) argue that an increase in the price
volatility of a security causes market participants to place larger bid-ask spread owing to
increased information risk whilst higher trading activity causes narrower spreads as the
waiting time to trade decreases This further suggests a third equation which models
transaction costs (bid-ask spread) in appropriate order to properly catch the simultaneity in
the relationship between transaction costs volatility and trading activity
At this point a note on the lagged variables in equations (1) (2) and (3) (ie TVt-1
BASt-1 and IVt-1) is warranted A partial adjustment model is specified in each equation to take
into account the distributed lag (persistence) effect in the dependent endogenous variable 15 They are mostly speculators
15
Thus the lagged term of the dependent endogenous variable in each equation is entered as an
explanatory variable in the model
To take account of the potential simultaneous equation bias we use the Two Stage
Least Square Method (2SLS) to correct endogeneity problem Lag of independent and
exogenous variables are used as instruments Number of instruments used is equal or more
than independent variables in each equation All three equations in the system developed
above are exactly identified Then to avoid any spurious relationship among the variables due
to the presence of a unit root in the time series the Augmented Dickey-Fuller test (ADF) is
applied to test for stationarity
Data Source The intraday and daily futures data on spot price future price bid-ask
quotes trading volume and open interest are obtained from the Multi-Commodity Exchange
(MCX) For the purpose of our study we select five commodities mostly traded from four
commodity categories namely Gold from precious metals Copper from basic metals
Petroleum Crude from energy Refined Soya Oil and Chana (Chick pea) from agricultural
commodities The share of five commodities together in MCX total trading and in respective
total (five commodities together) in all commodity exchanges are around 63 and 88
respectively All these commodities selected are in the top ten traded commodities in the
MCX The sample period covers May 1 2006 to April 30 2008
Result Analysis The empirical results of the ADF tests are reported in Table-9 We
find that the time series of trading volume bid-ask spreads price volatility (future and spot)
and open interest are stationary at level Based on these results we estimate our three-
equation model in the level form for all variables The results reveal that there exists a
negative relationship between bid-ask spread (transaction cost) and trading volume The
negative and significant coefficient of the transaction cost variable suggests that increase in
transaction costs causes a decrease in trading activity Results for five commodities are
reported below in Table-I to Table-V
The coefficient of the daily realized price volatility (IVt) is positive and statistically
significant for all except Chana This result is expected and consistent with the empirical
findings of Tauchen and Pitts (1983) Bessembinder and Seguin (1993) and Wang Yau and
16
Baptiste (1997) and Chou and Wang (2005) In addition the result is consistent with the
theory that an increase in price volatility changes the reserve price of speculators and
increases the demand for risk-transfer by hedgers Both effects are presumed to lead to a
higher trading volume The coefficient of open interest (OIt) is positive and statistically
significant for all except Chana indicating that an increase in open interest will result in an
increase in trading volume a result that is consistent with our expectation
The empirical estimates of volatility equation indicate that the coefficients for both
trading volume (TVt) and bid-ask spreads (BASt) are positive and significant From the
estimated price volatility equation we can trace the sources of change in the observed price
volatility into two components (1) the information component approximated by trading
volume (TVt) and (2) the intraday liquidity component represented by the bid-ask spreads
(BASt)
It is interesting to note that the coefficient of spot price volatility (VSPt) is positive and
significant at the 5 level Current physical volatility is included in the model as there is an
arbitrage relationship between the future price and the spot price (Siegel and Siegel 1990) It
is often argued that derivatives market attracts informed traders who cause market activity in
the derivative market to lead that in the physical commodity markets
In the bid-ask spread equation the coefficient of trading volume (TVt) is negative and
statistically significant This result is consistent with those of Wang and You (2000) and Chou
and Wang (2005) The coefficient of price volatility (IVt) is significantly positive An increase
in price volatility implies higher risk for the market maker as mentioned previously The
coefficient of the lagged bid-ask spreads (BASt-1) is statistically significant Therefore this
result supports our specification of partial adjustment in the bid-ask equation
Table-I Empirical results on trading volume bid-ask spreads
and price volatility of Gold Futures
Variable TVt IVt BAStConstant 1445 (359) 0017 (054) 0009 (1534) TVt 0001 (168) -0001 (-631) TV t-1 014 (309) IVt 3261 (495) 0006 (729) IVt-1 035 (892)
17
OIt 055 (176) BASt -61988 (-638) 948 (550) BASt-1 008122) VSPt 016 (447) R2 026 029 024 Numbers in parentheses denote t-statistics and denote significance at the 1 5 and 10 levels respectively
Table II Empirical results on trading volume bid-ask spreads
and price volatility of Crude Futures
Variable TVt IVt BAStConstant 547 (198) -003 (-073) 0018 (1410) TVt 004 (590) -0001 (-775) TV t-1 028 (626) IVt 2102 (318) 0015 (854) IVt-1 026 (728) OIt 152 (668) BASt -36732 (-417) 999 (858) BASt-1 016 (434) VSPt 009 (299) R2 037 027 039 Numbers in parentheses denote t-statistics and denote significance at the 1 and 5 levels respectively
Table III Empirical results on trading volume bid-ask spreads
and price volatility of Copper Futures
Variable TVt IVt BAStConstant 2301 (484) -025 (-442) 0016 (880) TVt 0006 (746) -0002 (-467) TV t-1 024 (647) IVt 1464 (583) 0005 (754) IVt-1 032 (943) OIt 065 (321) BASt -41295 (-412) 1747 (738) BASt-1 025 (586) VSPt 023 (805) R2 031 038 038 Numbers in parentheses denote t-statistics and denote significance at the 1 and 5 levels respectively
Table IV Empirical results on trading volume bid-ask spreads
and price volatility of Ref Soya Oil Futures
Variable TVt IVt BAStConstant 017 (152) -002 (-073) 0020 (718) TVt 005 (426) -0012 (-641)
18
TV t-1 035 (915) IVt 078 (314) 005 (462) IVt-1 015 (461) OIt 041 (754) BASt -504 (-430) 099 (280) BASt-1 -012 (281) VSPt 078 (17 3) R2 043 051 018 Numbers in parentheses denote t-statistics and denote significance at the 1 and 5 levels respectively
Table V Empirical results on trading volume bid-ask spreads
and price volatility of Chana Futures
Variable TVt IVt BAStConstant 011 (316) -004(-062) -007 (-334) TVt 023 (245) -012(321) TV t-1 060 (1663) IVt 005 (085) 012 (221) IVt-1 028 (762) OIt 011 (107) BASt -020 (241) 017 (213) 136 (2135) BASt-1 VSPt 050 (1154) R2 042 035 027 Numbers in parentheses denote t-statistics and denote significance at the 1 and 5 levels respectively
Simulation Results Having seen the basic relationship among the variables we
simulate the results of the imposition of CTT on the commodity futures market As
previously mentioned Aitken Duffy and Frino (1994) and Chou and Wang (2005) explain
that when CTT is imposed the transaction cost (bid-ask spread) would increase at least by
that much percentage16 So we give external shocks to the bid-ask spread in equation-1 and
equation-2 to derive the simulation results We have three alternative scenarios First we
assume that when 00125 of CTT is imposed17 the transaction cost is increased by 00125
(scenario-1) Second we assume that with the imposition of 0017 tax the transaction cost
is increased by 017 (scenario-2) Third we assume that with the imposition of 0017 tax
the transaction cost is increased by 017 (scenario-3)The simulation results of trading 16 The increase in cost may be more than the CTT due to increase in other costs 17 Recently it has been reported in print media that government is planning to impose CTT between 0125 to 0017
19
volume and daily volatility because of imposition of CTT for five commodities are presented
in Table-VI (also see simulations from fig-6 to fig-15) It is clear that with the increase in
transaction tax by 00125 trading volume will decrease for all commodities within the
range starting from 2434 for Gold to minimum 222 for Chana As a result it will have a
negative impact on the market efficiency Similarly daily volatility will increase within the
range starting from 2624 for gold to minimum 216 for Chana Therefore if the
government imposes the transaction tax of 0017 liquidity of the commodity futures market
will decrease and volatility will increase The negative impact on trading volumes and
positive impact on volatility increase in case of scenario-2 and scenario-3 when transaction
cost increases by 0017 and 002 respectively due to imposition of CTT
Table VI Simulated Result of the Impact of Increase in Transaction Tax
on Liquidity and Volatility
Trading Volume Volatility
Scenario 1 Scenario 2 Scenario 3 Scenario 1 Scenario 2 Scenario 3
Gold -2434 -3193 -3771 2624 3125 345
Crude -1643 -2462 -2731 2022 2563 3013
Copper -1733 -2479 -2982 1356 1954 2476
Ref Soya
Oil
-542 -623 -727 435 616 787
Chana -222 -325 -475 216 371 458
Notes In scenario 1 transaction cost increases by 00125 in scenario 2 transaction cost increases
by 0017 and in scenario 3 transaction cost increases by 002
Futures Price and Inflation The functioning of futures markets came under scrutiny
during 2006-07 and the government ordered delisting of futures contracts in agricultural
commodities like urad tur wheat and rice in early 2007 on the suspicion that futures trading
in these commodities had been contributing to the rise in spot prices Similarly the
Government of India banned futures trading in chana potato and soya oil in May 2008 in an
attempt to contain the price rise in essential commodities and curb the spiraling inflation rate
in the country In this section we present evidence about the role of futures market in
20
inflation by carrying out Granger causality test between trading volume and spot prices for
five commodities It has been argued that futures trading in commodities leads to higher
inflation as speculators drive the prices up beyond the fundamental value If trading volume
leads the spot price then it is assumed that inflation is caused by futures trading On the other
hand if spot price causes futures price there is no evidence against future market leading to
higher inflation
Given that our price series are stationary we use granger causality test to examine whether
futures trading influences spot prices The granger causality test is carried out at levels and the
results are presented in Table-VII Results show that out of five commodities we have only
one case (crude) where causality runs from volume to spot prices All other four cases there
is no causality from volume to spot prices Therefore we do not have sufficient evidence to
support that futures market leads to higher inflation
Table-VII Granger Causality between volume of trading and Spot Prices
Commodity Null Hypothesis F-Statistics P-value
Volume does not Granger Cause Spot Price 087 058
Gold Spot Price does not Granger Cause Volume 344 0001
Volume does not Granger Cause Spot Price 243 004
Crude Spot Price does not Granger Cause Volume 287 002
Volume does not Granger Cause Spot Price 113 034
Copper Spot Price does not Granger Cause Volume 089 049
Volume does not Granger Cause Spot Price 067 071
Ref Soya Oil Spot Price does not Granger Cause Volume 317 002
Volume does not Granger Cause Spot Price 057 079
Chana Spot Price does not Granger Cause Volume 096 046 denotes the rejection of Null hypothesis at 1 level denotes the rejection of Null hypothesis at 5 level Optimal lag length is selected o the basis of AIC Criterion
Futures Trading volume and Spot price Having found inconclusive evidence
regarding whether futures trading granger causes spot prices we proceed further to examine
the efficiency through price discovery mechanism by doing causality analysis between future
21
prices and spot prices Since both spot and future return series are I (0) we carry out granger
causality at levels The results (Table-VIII) reveal that in all five commodities future prices
ganger cause spot prices Previous literature also suggests that when there is causality running
from future return series to spot return series the market is efficient This implies that the
commodity futures market is efficient for the five commodities
Table-VIII Granger Causality between Future Prices and Spot Prices
Commodity Null Hypothesis F-Statistics P-value
Spot does not Granger Cause Future 166 014
Gold Future does not Granger Cause Spot 11756 000
Spot does not Granger Cause Future 0721 066
Crude Future does not Granger Cause Spot 12534 000
Spot does not Granger Cause Future 148 011
Copper Future does not Granger Cause Spot 38043 000
Spot does not Granger Cause Future 251 002
Ref Soya Oil Future does not Granger Cause Spot 796 000
Spot does not Granger Cause Future 182 005
Chana Future does not Granger Cause Spot 538 000 denotes the rejection of Null hypothesis at 1 level Optimal lag length is selected o the basis of AIC
Criterion
Cointegration and causality test results indicate that there exists a cointegrating
relationship between future prices and spot prices for all commodities Results from causality
test indicate as follows (1) Trading volume does not granger cause Spot price in four
commodities except Crude (2) Future price granger causes spot price for all the commodities
There we donrsquot find the enough evidence to conclude that futures trading causes inflation
Further the futures markets are efficient
VI Conclusion and Policy Implications
Commodity derivatives and futures are instruments to achieve price discovery and price risk
management After withdrawal of prohibition on futures trading in 2003 the volume of
22
futures trade increased exponentially in agricultural commodities till 2005-06 but the trade in
Bullion and other metals over took it in 2006-07 Overall Non-agricultural commodities have
been dominating the futures markets in India International experience shows decrease in
trading volume due to either increase or imposition of security transaction tax Further we do
not find any commodity transaction tax in other major commodity futures trading markets
After imposition of tax by 017 transaction cost would increase substantially and may be
highest in world
The empirical results for five top selected commodities namely Gold Copper Crude
Soya Oil and Chana suggest that there exists a negative relationship between transaction cost
and trading volume and a positive relationship between transaction cost and volatility
Therefore any increase in transaction cost would lead to lower trading activity and higher
volatility Having seen the basic relationship among the variables we simulated the variables
because of increase in transaction cost due to imposition of CTT by the amount of 00125
0017 and 002 It is clear that with the increase in transaction tax by 00125 trading
volume will decrease for all commodities within the range starting from 2434 for copper to
minimum 222 for Chana As a result it will have negative impact on the market efficiency
Similarly daily volatility will increase within the range starting from 2624 for gold to
minimum 216 for Chana The negative impact on trading volumes and positive impact on
volatility increases in case of higher transaction cost due to imposition of CTT by 0017 and
002 respectively Increased volatility may also lead to more speculative activities and fail
to achieve price discovery and resource allocation objectives of the commodity markets
However agricultural commodities such as refined Soya oil and Chana are least affected in
terms of volume and volatility in response to the imposition of transaction tax This may be
due to fact that agricultural commodities are traded domestically while the other three
products are traded internationally Also the forward trades in agricultural commodities are
for very short periods whereas for the other three commodities forward trades are for distant
periods
The issue of future trading leading to inflation is examined by using granger causality
between futures trading and spot prices Results show that out of five commodities we have
23
only one case (crude) where causality runs from volume to spot prices In the other four
cases there is no causality from volume to spot prices Therefore we do not have sufficient
evidence to support that futures market leads to higher inflation Further the cointegration and
causality analysis results support that futures markets for these five commodities are efficient
Any increase in transaction tax as proposed would increase the transaction cost and may
keep farmers and hedgers out of the market an outcome which would fail to achieve the
objectives of commodity futures markets However this is an exploratory study examining
the impact of CTT on certain dimensions such as trading volume and volatility for five
commodities in one exchange The results need to be established by further research on larger
commodity base and exchanges in a comprehensive manner
24
Reference
Admati AR and P Pfleiderer (1988) ldquoA Theory of Intraday Patterns Volume and Price
Variabilityrdquo The Review of Financial Studies Vol1 No1 pp3-40 Aitken M and A Frino (1993) ldquoThe Determinants of Market Bid Ask Spreads on the
Australian Stock Exchange Cross-Sectional Analysisrdquo SIRCA Working Papers 1993 pp2-23
Aitken M Matthew Duffy and A Frino (1994) ldquoTrading Activity Volatility and Transaction Costs for the Sydney Futures Exchange SPI Future The Impact of Specification Changes wwwsircaorgauPapers1994012pdf
Aliber RZ B Chowdhry and S Yan 2003 Some evidence that a Tobin tax on foreign exchange transactions may increase volatility European Finance Review 7 481510
Amihud Y and Mendelson H (1993) ldquoTransaction taxes and stock valuesrdquo in Lehn K and Kamphius R eds Modernizing US Securities Regulation Economic and Legal Perspectives Irwin Homewood Illinois
Baltagi B H Li D Li Q (2006) Transaction Tax and Stock Market Behavior Evidence from an Emerging Market Empirical Economics 31(2) pp 393-408
Bhattacharya H (2007) ldquoCommodity Derivatives market in Indiardquo Economic and Political Weekly March
Bessembinder H and Seguin P L (1993) ldquoPrice volatility trading volume and market depth evidence from futures marketsrdquo Journal of Financial and Quantitative Analysis 28 21-39
Chou R K and Lee J H (2002) ldquoThe relative efficiencies of price execution between the Singapore exchange and the Taiwan futures exchangerdquo Journal of Futures Market 22 173-196
Constantinides GM (1986) ldquoCapital Market Equilibrium with Transaction CostsrdquoJournal of Financial Economics August
Dasgupta B (2004) Role of Commodity Futures Market in Spot Price Stabilization Production and Inventory Decisions with Reference to India Indian Economic Review 39 pp 315-325
Edwards F R (1993) ldquoTaxing transactions in futures markets objectives and effectsrdquo Journal of Financial Services Research 7 75-93
Ericsson J Lindgren R (1992) Transaction Taxes and Trading Volume on Stock Exchanges An International ComparisonStockholm School of Economics Working Paper (39)
GOI Ministry of Commerce (1950) Report of the Export Committee on the Futures Markets (Regulation) Bill 1950 (Chairman A D Shroff) New Delhi
GOI (1966) Report of the Forward Markets Review Committee (Chairman M L Dantwala) New Delhi
GOI Ministry of Civil Supplies (1980) Report of the Committee on Forward Markets (Chairman A M Khusro) New Delhi
GOI (1994) Report of the Committee on Forward Market (Chairman M N Kabra) New Delhi
25
Gilbert CJ (1985) ldquoFutures Trading and the Welfare Evaluation of Commodity Price Stabilisationrdquo Economic Journal 95 pp 637-661
Grundfest J A and Shoven J B(1991) ldquoAdverse implications of a security transaction excise taxrdquo Journal of Accounting Auditing and Finance 6 409-442
Habermeier K and Kirilenko A A (2003) ldquoSecurities transaction taxes and financial marketsrdquo IMF Staff Papers 50 165-180
Hsieh W-L G (2004) ldquoRegulatory changes and information competition The case of Taiwan index futuresrdquo Journal of Futures Markets 24 399-412
Hu S (1998) The Effects of the Stock Transactions Tax on the Stock Market Experiences from Asian Markets Pacific-Basin Finance Journal 1998 6(3) pp 347-364
Indian Institute of Management (2008) ldquoImpact of Futures Trading in Wheat Sugar Pulses and Guar seed on Farmersrdquo Bangalore
Kolamkar D S (2003) ldquoRegulation and Policy issues for Commodity Derivatives in Indiardquo In Thomas S editor Derivatives Markets in India OUP
Kamara A (1982) lsquoIssues in Futures Markets A Surveyrsquo Journal of Futures Markets Vol 2 pp 261ndash94
Kiefer D W (1990) ldquoThe Securities Transaction Tax An Overview of the Issues Washington
Kupiec P H (1996) Noise traders excess volatility and a securities transaction tax Journal of Financial Services Research 3 pp 117-120
Lindgren R (1994) Transactions Taxes and Stock Market Volatility Stockholm School of Economics Working Paper 1994 (59)
Lo A W Mamaysky H and Wang J (2004) ldquoAsset prices and trading volume under fixed transactions costsrdquo Journal of Political Economy112 1054-1091
Nath GC and T Lingareddy (2008) ldquoCommodity Derivative Market and its Impact on Spot Marketrdquo Available at SSRN httpssrncomabstract=1087904
Nitesh Ranjan (2005) Role Of Commodity Exchanges Futures amp Options - A Case Study On Soya Oil Occasional paper 46 Department of Economic analysis and research
NABARD Robin K Chou and George H K Wang (2006) ldquoTransaction Tax and Market Quality of the
Taiwan Stock Index Futuresrdquo Journal of Futures Markets 26 (12) 1195-1216 Roll R (1989) Price Volatility International Market Links and Their Implications for
Regulatory Policies Journal of Financial Services Research 3(2-3) pp 211-246 Pavaskar M G (1970) ldquo Futures Trading and Price Variationsrdquo Economic andPolitical
Weekly February Sahi Gurpreet S (2006) ldquoInfluence of Commodity Derivatives on Volatility of underlying
(2006)rdquo Available at SSRN httpssrncomabstract=953594Saporta V Kan K (1997) The Effects of Stamp Duty on the Level and Volatility of UK
Equity Prices Bank of England Working Paper (71) Schulmeister S M Schratzenstaller and O Picek ldquoA General Financial Transaction Tax ndash
Motives Revenues Feasibility and Effectsrdquo WIFO Working Paper 2007
Schwert G W and Seguin P J (1993) ldquoSecurities transaction taxes an overview of costs benefits and unresolved questionsrdquo Financial Analysts Journal 49 27-35
Siegel DR and DF Siegel (1990) Futures Markets The Dryden Press Sydney
26
Singh Jatinder Bir (2000) Futures Markets and Price Stabilization - Evidence from Indian Hessian Market httpwwwsasnetluseEASASpapers8JatinderSinghpdf
Stiglitz Joseph E (1989) Using tax policy to curb speculative short-term trading Journal of Financial Services Research 3 101-115
Sahu D (2008) ldquoDoes Securities Transaction Tax Distort Market Microstructure Evidence from Indian Stock Marketrdquo papersssrncomsol3paperscfm
Summers LH and VP Summers (1989) When Financial Markets Work Too Well A Cautious Case For a Securities Tax Journal of Financial Services Research Vol 3 p 275
Tauchen G E and Pitts M (1983) ldquoThe price variability-volume relationship on speculative marketsrdquo Econometrica 5 485-505
Thomas Susan (2003) ldquo Agricultural commodity markets in India Policy issues for growth Technical Report IGIDR
Umlauf S R (1993) ldquoTransaction taxes and the behavior of the Swedish stock marketrdquo Journal of Financial Economics 33 227-240
Wang G H K and Yau J (2000) ldquoTrading volume bid-ask spread and price volatility in futures marketsrdquo Journal of Futures Markets 20 943-970
Wang GH K Yau J and Baptiste T (1997) ldquoTrading volume and transaction costs in futures marketsrdquo Journal of Futures Markets 17 757-780
World Bank (1999) ldquoUsing Markets to Deal with Commodity Price Volatilityrdquo PREM Notes ndashEconomic Policy January No13
Varangis P and Larson D (1996) ldquoDealing with Commodity Price Uncertaintyrdquo Policy Research Working Paper 1167 World Bank Washington DC
27
Figure 1 Structure of the Commodity Market
Ministry of Consumer Affairs
FMC
Commodity Exchanges
National Exchanges Regional Exchanges
NCDEX MCX NMCE NBOT 20 OtherRegional Exchange
Ministry of Consumer Affairs
FMC
Commodity Exchanges
National Exchanges Regional Exchanges
NCDEX MCX NMCE NBOT 20 OtherRegional Exchange
Figure 2 Share of the Main Commodity Exchanges in India
Percentage share of Exchanges(2007)
2173
7422
071221
113
Multi Commodity Exchange (MCX) NCDEX NMCE(Ahemdabad) NBOT(Indore) Others
Figure 3 MCX COMDEX vs Other Global Indices
80
90
100
110
120
130
140
150
160
Jun-
05
Jul-0
5
Aug
-05
Sep
-05
Oct
-05
Nov
-05
Dec
-05
Jan-
06
Feb
-06
Mar
-06
Apr
-06
May
-06
Jun-
06
Jul-0
6
Aug
-06
Sep
-06
Oct
-06
Nov
-06
Dec
-06
Jan-
07
Feb
-07
Mar
-07
Apr
-07
May
-07
Jun-
07
Jul-0
7
Aug
-07
Sep
-07
Oct
-07
Nov
-07
CRB DJ AIG Index Comdex Note After converting to the same base period of all the indices to 100 from June 2005 (base unit
days and major unit months on X-axis)
28
Figure-4 Monthly Trend Growth Rate and Volatility of WPI of Selected (Top Ten in terms of Value) Agricultural Commodities in which Futures are traded
Monthly Trend Growth Rate and Volatility in WPI
-30-20-10
0102030405060
Cha
naG
ram
Soy
Oil
Pepp
er
Soyb
ean
Soy
Seed
Rap
e Se
ed
Mus
tard
Seed Po
tato
Turm
eric
Cas
tor S
eed
Suga
r
WPI Volatility () Pre-Futures WPI Volatility () Post-Futures
WPI Trend Grow th Rate () Pre-Futures WPI Trend Grow th Rate () Post-Futures
Figure-5 Daily Volatility in Major Agricultural Commodities
Daily Volatility in Some Major Commodities
0
50
100
150
200
250
300
Potatoes Turmeric Pepper Guarseed
Soybeanoil
Sugar Chana Castorseed
Pre-futures Post-futures
29
Simulated Trading Volume
Gold Crude
-60
-40
-20
0
20
40
60
80
100
06M04 06M07 06M10 07M01 07M04 07M07
TV (Baseline)TV (Scenario 1)
TV (Scenario 2)TV (Scenario 3)
-40
-20
0
20
40
60
80
100
06M04 06M07 06M10 07M01 07M04 07M07
TV (Baseline)TV (Scenario 1)
TV (Scenario 2)TV (Scenario 3)
Copper Refined Soya
-40
-20
0
20
40
60
80
100
2006M07 2007M01 2007M07
TV (Baseline)TV (Scenario 1)
TV (Scenario 2)TV (Scenario 3)
-3
-2
-1
0
1
2
3
4
5
06M04 06M07 06M10 07M01 07M04
TV (Baseline)TV (Scenario 1)
TV (Scenario 2)TV (Scenario 3)
Chana
-2
-1
0
1
2
3
4
5
6
7
06M04 06M07 06M10 07M01 07M04
TV (Baseline)TV (Scenario 1)
TV (Scenario 2)TV (Scenario 3)
30
Simulated Daily Volatility of
Gold Crude
00
02
04
06
08
10
12
14
06M04 06M07 06M10 07M01 07M04 07M07
IV (Baseline)IV (Scenario 1)
IV (Scenario 2)IV (Scenario 3)
00
04
08
12
16
20
24
06M04 06M07 06M10 07M01 07M04 07M07
IV (Baseline)IV (Scenario 1)
IV (Scenario 2)IV (Scenario 3)
Copper Refined Soya
00
04
08
12
16
20
24
28
32
2006M07 2007M01 2007M07
IV (Baseline)IV (Scenario 1)
IV (Scenario 2)IV (Scenario 3)
00
04
08
12
16
20
24
06M04 06M07 06M10 07M01 07M04
IV (Baseline)IV (Scenario 1)
IV (Scenario 2)IV (Scenario 3)
Chana
00
05
10
15
20
25
30
06M04 06M07 06M10 07M01 07M04
IV (Baseline)IV (Scenario 1)
IV (Scenario 2)IV (Scenario 3)
31
Table-1 Commodity Group-wise Value of Trade (Rs Lakh Crores)
Commodity Groups 2004-05 2005-06 2006-07 2007-08
Bullion and other metals
180 (3147)
779 (3615)
2129 (5790)
2624 (6455)
Agriculture 390 (6818)
1192 (5531)
1317 ( 3582)
941 (2315)
Energy 002 (035)
182 (845)
231 (628)
500 (1230)
Others 000 (000)
002 (009)
0001 (000)
(000) (000)
Total 572 (10000)
2155 (10000)
3677 (10000)
4065 (10000)
Note Figures in parenthesis indicate percentage to total value Adopted from EC (2008) report
Table 2 Turnover in Commodity Futures Market (Rs crore)
Exchanges 2004 2005 2006 2007 MCX 165147 961633 1621803 2505206
NCDEX 266338 1066686 944066 733479
NMCE (Ahmadabad) 13988 18385 101731 24072
NBOT( Indore) 58463 53683 57149 74582
Others 67823 54735 14591 37997 All Exchanges 571759 2155122 2739340 3375336 of GDP 183 610 900 Source wwwfmcgovin
Table 3 Impact of Commodity Transaction Tax (CTT) on Transaction Cost
Cost Components Present Cost Transaction cost after CTT Exchange transaction fees Rs 2 to 3 per Rs 100000 Rs 2 per Rs 100000 Service Tax Nil Rs O25 (of 125 Service
Tax) CTT Nil Rs 17 per Rs 100000 Total Cost Rs 2 per Rs 100000 Minimum of Rs 1925 per Rs
100000
Source Forward Market Commission
32
Table-4 Volume of Trade in Major Commodity Derivative Market Major Exchanges 2003-04 2004-05 2005-06 2006-07 New York Mercantile Exchange (NYMEX) 16315 2046 (25) 2762 (35) 3533 (28) Dalian Commodity Exchange (DCE) 883 9917 (13) 1207 (19) 1855 (54) Chicago Board of Trade (CBOT) 599 6746 (12) 8058 (19) 9457 (20) Tokyo Commodity Exchange (TOCOM) 744 618 (-17) 637 (3) 477 (-26) London Metals Exchange (LME) 719 783 (93) 869 (11) 925 (7) Shanghai Futures Exchange (SHFE) 4057 337 (-167) 581 (72) 855 (48) Multi Commodity Exchange (MCX) 204 4563 (122) 689 (51) National Commodity amp Derivatives Exchange (NCDEX)
515 5327 (4) 345 (-34)
Chicago Mercantile Exchange (CME) 805 10903 35) 1409 (29) 2804 (50) Source Futures Industry Association Various years Notes Figures in the Bracket are change Table 5 Transaction Cost A Global Comparison (Cost Comparison of a Sale of Rs 1 lakh) Exchanges Exchange
Fee Service Tax
Regulatory Fee
Stamp Duty
CTT Others
charge
Total
Cost MCX 200 025 Nil 100 170 Nil 2025 NYMEX 074 Nil 007 Nil Nil Nil 081 CBOT 293 Nil 025 Nil Nil Nil 318 ICE 082 Nil Nil Nil Nil Nil 082 TOCOM 123 Nil Nil Nil Nil 006 129 CZCE 476 Nil Nil Nil Nil Nil 476 NYBOT 241 Nil 040 Nil Nil Nil 282 CME 266 Nil 018 Nil Nil 284 DCE 364 Nil Nil Nil Nil Nil 364 MDEX 289 Nil Nil Nil Nil Nil 289 WINNEPEG 562 Nil Nil Nil Nil Nil 562
Source Authorrsquos compilation
Table 6 Transactions Taxes and Revenues
TAX REVENUE AS A PERCENTAGE OF Country TAX (in basis points) TOTAL
REVENUE GNP MARKET
VALUE OF EQUITY
FRANCE 30 amp 15 026 012 119 GERMANY 25 014 004 028 ITALY 15 110 038 610 JAPAN 18 amp 55 142 017 034 NETHERLANDS 50 on small
trades 063 032 117
SWEDEN 100 087 036 155 SWITZERLAND 15 amp 30 233 048 094
33
UNITED KINGDOM 50 080 030 001 UNITED STATES various state
taxes 017 003 008
Source LH Summers and VP Summers When Financial Markets Work Too Well A Cautious Case For a Securities Tax Journal of Financial Services Research Vol 3 1989 p 275
Table-7 Tax Rates and Tax Revenues in Different Countries
COUNTRY Tax Rate () Tax Revenue of GDP (2005)
Austria 1 003 Belgium 05 (abolished in 2006) 0053 France 03 001 Greece 1 08 Ireland 05 (abolished in 2006) 16 Spain 1 17 UK 05 08 Japan 07 02 Portugal 04 00 Italy 0009 - 014 04 Finland 16 04 Luxembourg 1 06 Tawian 01 -03 NA China 03 NA Hong Kong 01 NA
Source Schulmeister Schratzenstaller and Picek ldquoA General Financial Transaction Tax ndashMotives Revenues Feasibility and Effectsrdquo WIFO Working Paper 2007
34
Table 8 Impact of STT on Financial Market A Global Experience
Impact of STT Studies Price Volatility
Liquidity and
and Volume
Market Efficiency
Others
Umalauf 1993 Increased reduced Migration of Volume
Amhud and Mendlson 1993 reduced Edwards 1993 reduced Migration of
Volume Wang and You 1994 Increased reduced Migration of
Volume to Overseas market
Marion G Wroble 1996 reduced Jones and Seguin 1996 reduced Saporta and Kan 1997 insignificant Hu 1998 insignificant insignificant Chou and Lee 2002 reduced Negative
effect
Chou and Wang 2005 Increased reduced Habermeier and Kirilenko 2003
increased reduced Migration of Volume
Source Authorrsquos Compilation
Table-9 ADF Unit Root Test
ADF TEST
TV IV BAS OI VSP
GOLD -648 -723 -645 -327 -447
Crude -546 -624 -527 -432 -491
Copper -479 -6134 -757 -335 -524
Ref Soya oil -644 -837 -671 -547 -522
Chana -532 -729 -543 -543 -665 indicates the rejection of null hypothesis of unit root at 1 level indicates the rejection of null hypothesis of unit root at 5 level The critical values of the ADF unit root test at the 1 and the 5 levels are ndash3382 and ndash2594
35
36
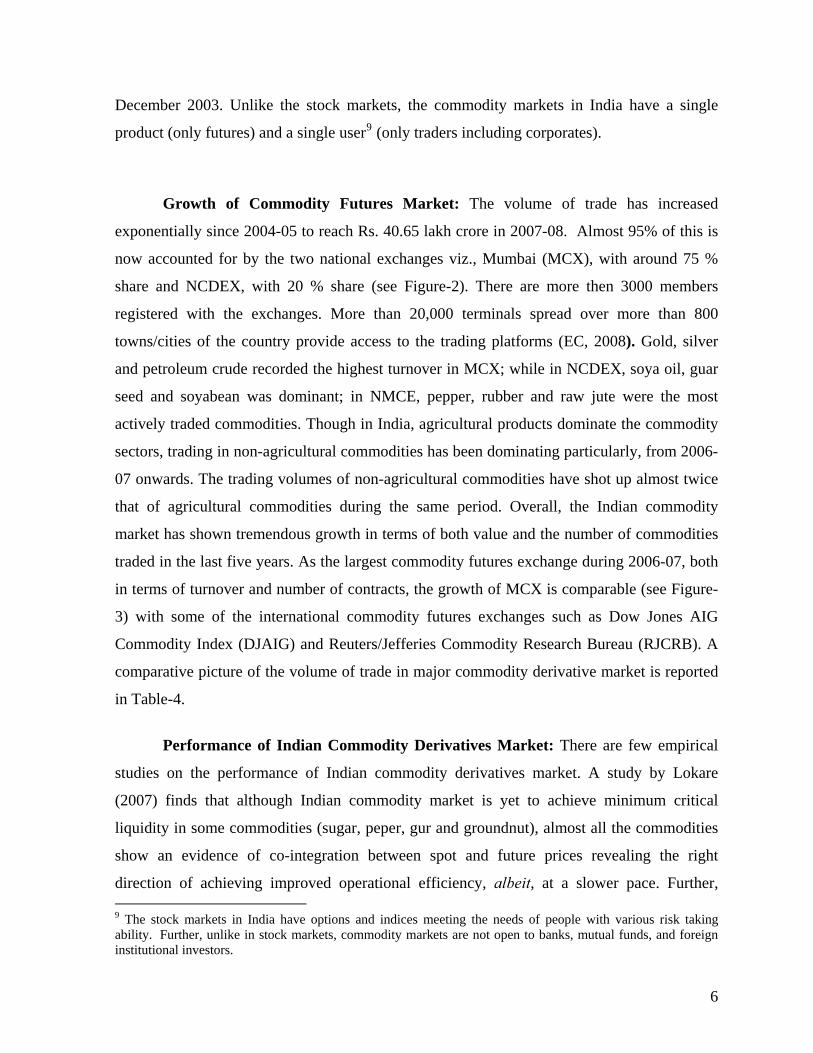

36