impact of protein intake on protein metabolism and …...ii impact of protein intake on protein...
TRANSCRIPT

Impact of Protein Intake on Protein Metabolism and Exercise Performance in
Endurance-Trained Males
by
Eric Williamson
A thesis submitted in conformity with the requirements
for the degree of Master of Science in Exercise Science
Faculty of Kinesiology and Physical Education
University of Toronto
© Copyright by Eric Williamson 2017

ii
Impact of Protein Intake on Protein Metabolism and Exercise Performance in Endurance-Trained
Males
Eric Williamson
Master of Science
Department of Exercise Science
University of Toronto
2017
Abstract:
Background: Current recommendations for athletes consider dietary protein requirements that
maintain nitrogen (i.e. protein) balance rather than an optimal dosage to enhance metabolism and
exercise performance. Purpose: The primary objective of this study was to determine how
differing protein intakes alter protein metabolism and exercise performance. Methods: Using a
double blind randomized crossover design, 10 male runners completed 3 trials involving 4 days
of controlled training and ingestion of either 0.94 (LOW), 1.20 (MOD) or 1.83 g protein/kg body
weight/d (HIGH). Whole body protein metabolism and exercise performance were assessed.
Results: Whole body net protein balance displayed a relative dose-response (HIGH > MOD >
LOW, P < 0.05). Inferential statistics revealed that 1.83 g protein/kg provides notable benefits in
exercise performance compared to intakes of 0.94 g/kg or 1.2 g/kg. Conclusion: These data
suggest that consuming protein towards the high end of recommendations (1.2-2g/kg) better
maintains metabolism and exercise performance.

iii
Table of Contents Table of Contents ......................................................................................................................... iii
List of Abbreviations .................................................................................................................... v
List of Figures ................................................................................................................................ v
List of Tables ................................................................................................................................. v
Chapter 1. Literature Review ...................................................................................................... 1
1.1 Introduction ................................................................................................................... 1
1.1.1 Protein as Building Blocks of Body Tissue ................................................... 1
1.1.2 Protein as a Fuel Source ................................................................................. 2
1.1.3 Dietary Protein ............................................................................................... 3
1.2 Protein Turnover ........................................................................................................... 4
1.2.1 Protein Synthesis ............................................................................................ 5
1.2.2 Protein Breakdown......................................................................................... 6
1.2.3 Amino Acid Oxidation during Exercise ........................................................ 8
1.3 Protein Requirements for Endurance Athletes .............................................................. 9
1.3.1 Performance as an Indicator of Protein Requirements ................................ 10
1.3.2 Research Gaps and Conclusion .................................................................... 13
Chapter 2. Study Proposal ......................................................................................................... 14
2.1 Introduction ................................................................................................................. 14
2.2 Hypothesis................................................................................................................... 14
2.3 Phases of Research ...................................................................................................... 15
2.4 Knowledge Translation ............................................................................................... 17
Chapter 3. Methodology ............................................................................................................. 18
3.1 Introduction ................................................................................................................. 18
3.2 Participants and Study Design .................................................................................... 18
3.3 Participant Consent, Explanation of Study and Familiarization ................................. 19
3.4 Training Periods and Performance Assessments ........................................................ 22
3.4.1 Stable Isotopes ............................................................................................. 24
3.5 Controlled Diet and Test Drinks ................................................................................. 25
3.6 Data Analysis .............................................................................................................. 26
3.7 Precision of Estimation and Statistical Inference. ...................................................... 26

iv
Chapter 4. Results ....................................................................................................................... 28
4.1 Participants .................................................................................................................. 28
4.2 Whole Body Protein Metabolism................................................................................ 29
4.2.1 Whole Body Protein Synthesis .................................................................... 29
4.2.2 Whole Body Protein Breakdown ................................................................. 30
4.2.3 Whole Body Protein Net Balance ................................................................ 30
4.3 Performance ................................................................................................................ 32
4.3.1 MVC ............................................................................................................ 32
4.3.2 5kmTT.......................................................................................................... 32
4.3.3 Jump ............................................................................................................. 33
Chapter 5. Discussion ................................................................................................................. 35
5.1 Changes in Protein Metabolism .................................................................................. 36
5.2 Performance ................................................................................................................ 43
5.2.1 5kmTT.......................................................................................................... 44
5.2.2 MVC ............................................................................................................ 45
5.2.3 Jump ............................................................................................................. 47
5.2.4 Performance Implications ............................................................................ 49
5.3 Strengths and Limitations ........................................................................................... 50
5.4 Avenues for Future Research ...................................................................................... 54
5.5 Conclusion .................................................................................................................. 56
References .................................................................................................................................... 58
Appendices ................................................................................................................................... 86
A. Statistical Results and Raw Data ................................................................................. 87
B. Consent and Assent Forms ........................................................................................... 93
C. Elicitation Tools ......................................................................................................... 105

v
List of Abbreviations
BCAAs - Branched-Chain Amino Acids
EAAs - Essential Amino Acids
EAR - Estimated Average Requirement
FFM - Fat-Free Mass
FM - Fat Mass
FP – Follicular Phase
IAAO- Indicator Amino Acid Oxidation
LP – Luteal Phase
MPS - Muscle Protein Synthesis
MVC - Maximum Voluntary Isometric Contraction
NBAL - Nitrogen Balance
NIN - Nitrogen Intake
NOUT - Nitrogen Excretion
PAR‐Q – Physical Activity Readiness Questionnaire
RDA - Recommended Dietary Allowance
REE - Resting Energy Expenditure
SD – Standardized Differences
TT - Time Trial
List of Figures
Figure 1. Protein turnover and amino acid flux 4
Figure 2. Study overview 23
Figure 3. Protein synthesis 29
Figure 4. Protein breakdown 30
Figure 5. Protein net balance 31
List of Tables Table 1. Project timeline 17
Table 2. Inclusion and exclusion criteria 19
Table 3. Participant characteristics 28
Table 4. Inferential performance outcomes 34

1
Chapter 1. Literature Review
1.1 Introduction
It is the evidenced-based consensus in the exercise science community that proteins play an
important role in both exercise performance and recovery (Beleen et al., 2010; Howarth et al.,
2009; Phillips, Moore & Tang, 2007). Proteins play many important structural and mechanical
roles in living organisms. At the biochemical level, they consist of polymer chains made up of a
series of 20 different amino acids linked together by peptide bonds. ‘The sequence of the
polymer chain of amino acids in the protein determines its structure, physical and chemical
properties and function. Understanding of protein structures and function is of particular
relevance in exercise science in general and endurance training in particular because different
proteins serve different cellular functions within the human body acting as enzymes, antibodies,
cell receptors, hormones and structural proteins. Additionally, individual amino acids can also
be cleaved from the protein and provide a source of energy to the body’s cells.
1.1.1 Protein as Building Blocks of Body Tissue
In addition to fat and water, the human body is comprised of protein. The building blocks for
this protein and for the peptide synthesis process are amino acids. Body muscles, such as those
connected to the musculoskeletal system, are able to contract because of the force generated and
exerted from motor proteins. The degradation of old proteins into individual amino acids and
the reutilization of these amino acids to synthesize new proteins, a process called protein
turnover, is important for the maintenance of an adequate quantity and quality of body proteins.
Protein turnover will be discussed in greater detail in subsequent sections.

2
1.1.2 Protein as a Fuel Source
As a fuel source, proteins contain 4 kilocalories (17 kJ) of energy per gram. To provide energy
to the cell complete proteins are cleaved into individual amino acids which can then be oxidized
in the citric acid cycle to generate ATP. A portion of energy being generated within the human
body is provided through oxidation of amino acids at any given time. However, the percentage
of fuel sourced from amino acids relative to other macronutrients is dependent on a number of
factors including exercise and nutrition, which will be discussed in further detail below. There
are two ways in which amino acids can ultimately provide as a fuel source. The first pathway is
through direct oxidation in the citric acid cycle and the other is by being converted into glucose
through the process of gluconeogenesis for subsequent use in glycolysis or oxidation. Amino
acid oxidation is a constant process which is elevated when the body is not obtaining adequate
fuel from carbohydrate or fat sources, such as during prolonged exercise and/or fasting (Graham
et al., 1995; Wagenmakers, et al., 1991).
High levels of protein intake that exceed the rate at which amino acids can be incorporated into
body tissue also upregulates key enzymes involved in oxidation of these amino acids (Brosnan,
2003; Bowtell et al., 1998). Moderate-intensity exercise and low glycogen availability (Lemon
& Mullin, 1980) increase rates of amino acid oxidation, particularly of the branched chain amino
acids (BCAAs) (Rennie et al., 1981). Given that oxidized amino acids are not available to
participate in protein synthesis, the greater amino acid oxidation during, particularly prolonged
and/or higher intensity, exercise may ultimately impact the nutritional requirements during
endurance training; these concepts will be discussed in detail below.

3
1.1.3 Dietary Protein
Protein is an essential nutrient to the human body as it is the only dietary source of nitrogen. In
free living humans, amino acids are obtained through the consumption of foods containing
protein. Of the 20 amino acids, nine are essential. These essential amino acids (EAAs), which
cannot be directly synthesized by the body, are required to stimulate synthesis of new tissues and
can come from dietary protein and/or crystalline amino acids (Tipton, Gurkin et al., 1999;
Tipton, Ferrando et al., 1999). Sources of dietary protein that contain all non-essential and
essential amino acids in adequate compositions necessary for physiological needs are termed
complete proteins or whole proteins. In sufficient quantities, foods such as most meat products,
milk products, eggs, soy, and fish are sources of complete protein (Matthews et al., 1982). These
food sources can also be imitated through mirrored compositions of crystalline amino acids to
stimulate protein synthesis in the same manner (Tipton, Gurkin et al., 1999; Volpi et al., 2003).
Likewise, body proteins are made up of complete proteins and the synthesis of new tissue
requires all amino acids. Remaining amino acids not incorporated into body proteins are oxidized
in the citric acid cycle (Brosnan, 2003; Bowtell et al., 1998). Dietary protein needs for humans
are largely based on overall energy intake, stage of life, physical activity and the presence of
illness or injury (Phillips, Chevalier & Leidy, 2016). For the general adult population, Health
Canada has set the Recommended Dietary Allowance (RDA) of protein intake at 0.8g/kg (Health
Canada, 2006). However, these minimum requirements may not be suitable for those engaged in
chronic exercise such as endurance athletes.

4
1.2 Protein Turnover
Protein is the main building block of tissue within the human body and it is in a state of
continuous metabolic flux known as protein turnover (Figure 1) (Tarnopolsky, 2004). This is an
energy requiring process that represents about 20% of an adult’s metabolic rate (Schutz, 2011).
After digestive breakdown of proteins into amino acids and their subsequent absorption, they are
then reassembled and sequenced into specific proteins to make up tissue in the body in a process
known as protein synthesis. Alternately, these bodily proteins can then be broken down for use
in other tissues and/or to be used as a fuel source, as previously discussed. Within the body,
muscle protein synthesis and muscle protein breakdown continually occur; however, the rates at
which they occur is influenced by many factors. If protein synthesis is occurring at a greater rate
than protein breakdown this leads to net positive protein balance and anabolism. If protein
breakdown is occurring at a greater rate than protein synthesis this leads to negative net balance
and catabolism. Measured overall net effects on whole body protein turnover are a reflection of
the turnover rates within the different protein pools (e.g. muscle, organs, etc.) of the body which
vary in size and rates of turnover (Waterlow, 1995).
Figure 1. Protein turnover and amino acid flux. (Rasmussen & Phillips, 2003)

5
1.2.1 Protein Synthesis
Protein synthesis fluctuates throughout the day depending on influences such as nutrition and
exercise. Due to reductions in the amino acid pool, protein synthesis occurs at a reduced rate in
the fasted-state compared to the fed state (Rennie & Tipton, 2000; Rasmussen, Wolfe & Volpi,
2002). In the fasted state (such as after an overnight fast), free amino acids are largely provided
via endogenous sources that have been broken down and released into the blood stream (Biolo et
al., 1997) allowing the body to recycle its own sources of amino acids. With this greater rate of
protein breakdown over protein synthesis, protein turnover is in a net negative balance (Phillips
et al., 1997). Protein turnover becomes positive in the fed state, primarily due to an amino acid-
induced stimulation of protein synthesis, which occurs with the ingestion or infusion of an amino
acid-containing meal (Biolo et al., 1997; Aguirre, van Loon & Baar, 2013). Both intracellular
amino acids and extracellular amino acids (i.e. within the blood) are now said to be in the free
amino acid pool. Increases in this pool serve as the main facilitator of whole body protein
synthesis (Arnal et al., 1987) and, therefore, consumption of dietary proteins allows the body to
build and repair tissues.
Skeletal muscle is highly plastic tissue and responses to exercise stimuli must relate to changes
in protein synthesis, which has shown to be greater with increasing intensities of exercise
(Wilkinson et al., 2008; Di Donato et al., 2014). Following exercise, there is an increase in
protein synthesis that has been proposed as a “catching up” mechanism. This mechanism is
suggested to compensate for the depression of protein synthesis and increase in breakdown
observed during exercise (Rennie et al., 1981). The increase in synthesis rates, which can have
an overall net anabolic effect with the ingestion of dietary protein (Levenhagen et al., 2002),

6
contributes to adaptations (e.g. improved oxidative capacity, muscle hypertrophy, etc.) to
induced physiological demands of exercise training (Atherton & Smith, 2012; Mascher et al.,
2011; Di Donato et al., 2014).
Protein synthesis specifically induced by endurance exercise has shown to be elevated for up to
~28 h following activity (Di Donato et al., 2014). Di Donato et al. (2014) found that over a 24–
28 h post-endurance exercise period, mitochondrial protein synthesis was significantly greater
after a high intensity bout of training (cycling at 60% Wattsmax) compared to a low intensity bout
(cycling at 30% Wattsmax). Over 0.5-4.5 h protein synthesis was increased equivalently during
recovery, but remained elevated at 24–28 h post exercise only after high intensity exercise.
Therefore, this increase in synthesis rates following exercise with the ingestion of protein can
lead to a positive net balance resulting in greater myofibrillar and mitochondrial turnover as well
as greater mitochondrial protein content. When repeated over time this could translate into
subsequent improvements in strength and power generation (Frontera et al., 1988), and greater
muscle oxidative capacity and resistance to fatigue (Hawley, 2002; Di Donato et al., 2014),
although endurance training studies with targeted post-exercise recovery nutrition are currently
lacking.
1.2.2 Protein Breakdown
The body is able to add to the free amino acid pool through degradation of its own tissue. The
process of degradation is also known as protein breakdown and there are three major systems
which carry out this action: ubiquitin-proteosome pathway, the lysosomal systems, and the
calpain systems (Lecker et al., 1999; Belcastro, Shewchuk, & Raj, 1998). Protein breakdown of

7
endogenous tissue produces single amino acids and smaller polypeptides through the hydrolysis
of peptide bonds. The rate of this process can be influenced by pH and temperature, but is
largely dependent on the activation of protease cellular enzymes which catalyze the reaction.
Once cleaved from the tissue, the free amino acids can either be used in the synthesis of other
proteins, serve as a fuel source via oxygenation or gluconeogenesis, or be converted into citric
acid cycle intermediates (Wagenmakers, 1998). Protein breakdown provides an essential quality
control mechanism to eliminate abnormally folded or damaged proteins that have arisen by
faulty mutations, biosynthetic errors, damage by oxygen radicals, or denaturation (Lecker et al.,
1999).
Similar to synthesis, breakdown is elevated by exercise. This has been shown in both whole
body protein breakdown measures (Wolfe et al., 1982; Phillips et al., 1993) as well as muscle
protein breakdown measures (Rennie et al., 1981). Even small accelerations in degradation, if
sustained, can result in a marked loss of tissue mass that may have important implications for
endurance athletes, specifically concerning muscle tissue (Lecker et al., 1999).
In addition to the need for amino acids as a fuel source in endurance exercise, muscle proteins
are subject to damage via free radicals, which also increases muscle protein breakdown rates
(Davies et al., 1982). This muscle remodeling is essential to break down damaged protein and
resynthesize new functional proteins. Thus, the stimulation of protein synthesis can replace
oxidative losses as well as provide qualitative changes in muscle protein fractions (e.g. increased
concentration of energy producing mitochondrial proteins) and the ultimate adaptive response to
endurance training (e.g. more fatigue resistance).

8
Due to both the elevation in breakdown as well as a reduction in synthesis, previous reports have
shown that protein turnover net balance is reduced when glycogen stores are low (Howarth et al.,
2010; Van Hall, Saltin & Wagenmakers, 1999). This is particularly true for the BCAAs which is
noteworthy considering they are a major component of muscle tissue (Ferrando et al., 1995).
There is no uptake of BCAAs at rest, during exercise the uptake is substantial (13-16 µmol
BCAAs/min/kg dry muscle) (Howarth et al., 2010) and low glycogen levels further exaggerate
this effect (Wagenmakers et al., 1991; Jackman et al., 1997). This result of breakdown being
most amplified in the state of low glycogen storage can be induced by either inadequate
carbohydrate intake or, of relevance to endurance athletes, from glycogen depleting exercise
such as intense and/or prolonged training.
1.2.3 Amino Acid Oxidation during Exercise
Although the dominant substrates catabolized for energy during exercise are carbohydrates and
fat, exercise also increases the total rate of amino acid oxidation as a function to spare muscle
glycogen and increase potential for prolonged high metabolic rates (Hawley & Hopkins, 1995).
The contribution of amino acid oxidation to energy is approximately 3-10% depending on certain
exercise factors and nutrition status (Tarnopolsky, 2004; Gibala, 2001). Notable influences are
intensity and duration; both of which increase this rate of oxidation through increases in overall
energy demands and through glycogen depletion (Rennie et al., 1981). Following degradation,
amino acids subsequently travel to the liver for gluconeogenesis and/or are deaminated and
oxidized within muscle mitochondria as a fuel source (Tarnopolsky, 2004). This has recovery
and potential subsequent performance implications for endurance athletes as these amino acids
are now unavailable to be recycled or participate in the recovery process. Kato, Suzuki, Bannai

9
and Moore (2016) estimated an amino acid oxidation total of ~14g or the equivalent of
~0.2g/kg/d over a 20 km run and point out that this rate would be greater alongside inadequate
carbohydrate intake. Replacing this loss through dietary means needs to be considered in
addition to needs for recovery of damaged tissue and generation of new tissue.
1.3 Protein Requirements for Endurance Athletes
Current protein intake recommendations for athletes stand at 1.2-2.0 g/kg body weight/d
(ACSM, 2016). This recommendation is largely based on research examining protein intakes
required to achieve nitrogen balance (NBAL), such as that which was conducted by Meredith et
al. (1989). This study tested 3 different protein intakes (0.6, 0.9 and 1.2 g/kg/d) on nitrogen
balance in 12 endurance trained adults. The training was reported to be an average of 9.9
h/week, was uncontrolled, and the participants were asked to maintain normal activity in their
habitual environment (cycling, running, rowing, and/or calisthenics). Their results demonstrated
a mean protein requirement needed to maintain nitrogen balance of 0.94 g/kg/d, putting their
RDA at 1.26 g/kg/d. However, these recommendations, as well as those found in studies of
similar design, have been questioned given that there is little direct link to performance (Phillips,
2006; Phillips, Moore & Tang, 2007; Phillips, Chevalier & Leidy, 2016). In other words, they
merely encompass a minimal requirement to offset deficiency rather than an optimal dosage to
maximize recovery and improvements in performance. More recently, Kato et al. (2016) have
demonstrated a need for much greater requirements in this population. This group studied a
range of protein intakes (0.2–2.8g/kg/d) in 6 endurance trained men after a 20km training session
within a 3-day controlled training period using the indicator amino acid oxidation (IAAO)
method. This method measures amino acid oxidation, with the reciprocal being whole body

10
protein synthesis, suggesting that the intake determined may be more likely to maximize
recovery. The mean protein requirement suggested by Kato et al. (2016) was 1.65g/kg/d and the
RDA was 1.83 g/kg/d. The discrepancy in findings between these two studies is likely primarily
a result of the difference in methodologies used in measurement of protein turnover with the
IAAO method suggested to be more accurate and allowing for a more precise requirement due to
the greater number of intakes that can be tested compared to controlled nitrogen balance studies
(Zello et al., 1995; Elango, Ball, & Pencharz, 2008).
It is important to note that higher protein intakes above the RDA have also demonstrated
effectiveness in reducing frequency of illness, including upper respiratory tract infections,
particularly during periods of intensified training (Gleeson, 2007). This is suggested to be a
result of improvements in immune function (Witard et al., 2014; Witard et al., 2012). These
additional benefits not only improve performance adaptations but also would result in less time
away from training due illness.
1.3.1 Performance as an Indicator of Protein Requirements
For an endurance athlete, the primary goal of adequate protein consumption is not at a
fundamental level, nitrogen balance, but rather to be able to support increased protein synthesis
to improve performance. Therefore, it would be valuable for research to not only focus on
measurements of metabolic processes but also on measures of performance. However,
unfortunately it has remained rather unusual for measures of performance to be included in
combination with research analyzing protein metabolism. This is a limitation as regardless of
whether or not greater protein is required to achieve nitrogen balance, protein intakes above the

11
current recommendation could be beneficial and desirable if performance is enhanced. Direct
measurements such as those of strength, power and resistance to fatigue could potentially be
used to demonstrate changes in performance.
Of the few studies that have used performance measurements, there appears to be a delay (i.e.
>24 h) in which performance differences can be observed with differing protein intakes. This
may be related to the mRNA response to endurance exercise having a peak at 8-12 h post-
exercise (Yang et al., 2005) and adaptive protein synthesis being a cumulative process
augmented by recovery periods between bouts (Hood et al., 2006). Rowlands et al. (2008)
showed that a less negative nitrogen balance is correlated with better performance after 4 days of
controlled training in endurance trained cyclists. The protein enriched diet, which allowed for
the less negative nitrogen balance, provided 0.8 g/kg fat free mass per hour (averaging 1.9 g/kg/d
for their sample) while the non-enriched condition provided 0.12 g/kg fat free mass per hour
(averaging 1.2 g/kg/d). The greater protein intake had no impact on the 15-h performance, but
showed enhancements (4.1%) in the 60-h subsequent performance tests.
Some research has shown next day performance benefits in tests of endurance time to
exhaustion; however, this is only when greater protein intakes are given with supplemental
carbohydrate (compared to supplemental carbohydrate alone) (Berardi et al., 2006; Saunders,
Kane & Todd 2004; Zawadski, Yaspelkis & Ivy, 1992; Niles et al., 2001). This is attributed to
enhanced glycogen resynthesis. Protein intakes above 0.8 g/kg/d given without supplemental
carbohydrate have consistently shown no next day performance benefits (cycling sprint power)
(Rowlands et al., 2007; Rowlands & Wadsworth, 2011). However, a less negative nitrogen

12
balance is correlated with greater rates of recovery, notably through reductions in plasma
creatine kinase and later onset tiredness and muscle soreness (Rowlands et al., 2008; Rowlands
et al., 2007; Rowlands & Wadsworth, 2011; Millard-Stafford et al., 2005). This, along with the
findings of Rowlands et al. (2008), provides evidence that greater intakes of protein than
currently recommended could contribute to greater subsequent performance ability after multiple
days. According to Rowlands et al. (2008) this intake for performance benefits is 1.2 g/kg;
however, no other intakes were tested. It seems that numerous exposures are required to produce
a summative and detectable response and that future research should focus on testing
performance after a longer period, beyond the next day. This is also supported by the findings of
a meta-analysis by Pasiakos et al. (2014) who determined that only when protein
supplementation continued for extended periods, were performance benefits for strength, peak
power output and total work performed evident.
A range of protein intakes is yet to be examined to determine a more precise requirement for this
population to enhance performance and/or mitigate performance decrements between controlled
training sessions. The study by Rowlands et al. (2008) only compared two intakes with the
higher intake (average 1.9 g/kg/d) resulting in an ergogenic effect over the lower intake (average
0.8 g/kg/d). The study by Meredith et al. (1989) compared the effects of multiple protein intakes
(0.6, 1.9 and 1.2 g/kg/d) on whole body protein turnover but did not include any measures of
performance.

13
1.3.2 Research Gaps and Conclusion
Protein is a key dietary component for any athlete seeking the adaptations required to enhance
performance. With there being additional benefits to protein intakes above the RDA (Witard et
al., 2014; Witard et al., 2012; Rowlands et al., 2008; Rowlands et al., 2007; Rowlands &
Wadsworth, 2011; Millard-Stafford et al., 2005) as well as a point at which, if exceeded,
additional protein does not provide any benefits (Brosnan, 2003; Bowtell et al., 1998), a
definition of an optimal requirement could be facilitated (Millward et al., 1998).
The key gaps that currently remain within the literature pertaining to dietary protein needs for
endurance exercise include:
1. Current recommendations only take into account minimal requirements rather than an
optimal dosage to enhance recovery and improvements in performance.
2. The important practical objective related to dietary protein intake of performance has
rarely been measured concurrently with protein metabolism.

14
Chapter 2. Study Proposal
2.1 Introduction
The purpose of this study was to determine the effects of different protein doses on performance
and recovery during a period of controlled training characterized by repeated days of high
volume exercise. Dietary intake was controlled with participants receiving a specific amount of
protein in differing quantities: LOW (0.94 g protein /kg/d), MOD (1.20 g /kg/d) and HIGH (1.83
g/kg/d). The LOW protein intake represented the current estimated average requirement (EAR)
to maintain nitrogen balance for endurance athletes (Meredith et al., 1989). The MOD protein
intake represented the RDA for endurance trained men (Meredith et al., 1989) and the current
lower limit of the recommended protein intake for endurance athletes advised by the American
College of Sports Medicine (ACSM, 2000). The HIGH protein intake represented that which was
determined to be adequate using the indicator amino acid oxidation (IAAO) method by Kato et
al. (2016).
2.2 Hypothesis
It was hypothesized that following a period of controlled training, the high protein group would
experience the least negative whole body protein balance. Furthermore, based on the link
between protein metabolism and performance, it was expected that this less negative balance
would lead to an attenuation in performance decrements as a result of frequent training in
strength, jump measures and 5km run trial time. This hypothesis was based primarily on the
recently published study mentioned above using the contemporary IAAO technique (Kato et al.,

15
2016). The results of this study suggest that the intake provided in the high group will maximize
whole body protein synthesis. By doing so, enhanced adaptive tissue remodeling associated with
up-regulation of endurance-exercise specific gene expression (Yang et al., 2005; Hawley et al.
2007) and amino-acid stimulated protein synthesis (Howarth et al., 2009) can occur in an optimal
capacity. Particularly, due to the comparable nature of the test to the training, it was expected
that the mitigations in performance decrements would be most pronounced in the 5km time trial
performance test.
2.3 Phases of Research
The proposed study was divided into a preliminary session and three separate intervention trials.
It was conducted as a double-blind, randomized 3-way crossover design. The preliminary
session required one visit and each intervention trial required 11 days of total monitoring with 6
total visits. A 7-day washout period was required between each trial. During each of the trials,
participants received one of the described protein dosages for their 4 days of intensified training.
Phase I- Introduction and consent
Phase 1 consisted of a single laboratory visit lasting approximately 1.5 h and had two primary
objectives. First, it served to provide a comprehensive oral introduction to ensure participants
were properly informed of the study protocol, their duties as participants and any associated risks
and benefits. Subsequent to the detailed explanation of the study and answering of all of the
participants’ questions, those who wished to participate in the study were given the consent
document to read and sign. Other documents that were completed during this phase include: the
Physical Activity Readiness Questionnaire (PAR-Q+) (Appendix C) to ensure the participants

16
were physically suited to perform the study protocol safely and a self-reported training log to
ensure they were currently active enough to be considered ‘trained’ (Shepherd, 2015).
Phase II- Fitness Assessment
Phase 2 consisted of a single laboratory visit lasting approximately 5 h in length. The objectives
of this phase was to obtain general anthropometric measurements (body weight, height and
composition), resting energy expenditure (REE), and baseline physical performance tests
(maximal aerobic power (VO2peak), vertical jump impulse and peak force, maximum voluntary
contraction (MVC) and 5 km time trial (TT)).
Phase III – Experimental Trials
There were 3 experimental trials, each including performance testing before and after the 4-day
period of controlled training. Each trial consisted of a total of 11 days. Days 1 and 2 consisted
of voluntary exercise, day 3 was a rest day and pre-training performance testing will be
completed on day 4. Participants then rested on days 5 and 6 prior to commencing the training
protocol through days 7 to 10 in which one of the 3 protein dosages were given. Post training
performance testing was done on day 11. An in-depth review of the experimental trial
methodology is provided in the Methodology section.

17
2.4 Knowledge Translation
The data obtained from this study will provide novel insight into the effects of differing protein
dosages on whole body protein metabolism, recovery and physical performance, which will be
important in the development of guidelines and recommendations for endurance exercisers.
Upon study completion and data analysis/interpretation, the results will be communicated to the
scientific community through non-peer-reviewed publications, peer-reviewed journal(s), and
conference presentations. Table 1 shows the projected timeline to complete each phase of the
research process.
Table 1. Project timeline
Stage Start Date End Date
Ethics Submission and
Approval
January 2016 May 2016
Participant Recruitment May 2016 June, 2016
Proposal Defense September 2016 September 2016
Data Collection
(Phases I-III)
June 2016 December 2016
Data Analysis Jan. 2017 April 2017
Thesis Writing and
Submission
May 2017 August 2017

18
Chapter 3. Methodology
3.1 Introduction
The following will provide detailed information on the research design, participants, materials,
testing procedures, analytical methods and statistical analyses. Figure 2 provides a schematic
representation of the sequence of research execution. All participant testing and analysis was
conducted at the Goldring Centre for High Performance Sport within the University of Toronto.
3.2 Participants and Study Design
Based on former studies (Pacy et al., 1994; Meredith et al., 1989), the effect size in whole body
protein net balance we expect to detect is 0.6, with 3 repeated measurements, α = 0.05 and a
power of 0.80, the a priori power calculation using G*power3 (Faul et al., 2007) stuggested a
total sample size of 24 (i.e. 8 participants * 3 repeated measures was required). Thus, N=8
provided sufficient power to detect differences in whole body protein net balance. In order to
account for a potential 10% dropout and noncompliance, we recruited N=11 participants. The
sample consisted of healthy endurance trained males between the ages of 18 and 50 yr. Trained
was defined as a recent (over the past 4 weeks) running history of ≥45 km/week. Those who run
less than this benchmark were not considered eligible to participate. Participation was
completely voluntary and participants were free to withdraw from the study at any time without
penalty. Other criteria for exclusion included regular tobacco use or use of anabolic drugs (eg.
growth hormone, testosterone, etc.). Please see Table 2 for further inclusion/exclusion criteria
information. Participants considered safe to engage in the study were determined by the PAR-
Q+.

19
Table 2. Inclusion and exclusion criteria
Inclusion Exclusion
Male
Healthy
Age of 18-50 years
Recent running history >45km or 4.5
hours/week
VO2max at least “very good” based on standards
by Shvartz & Reibold*
Ability to cover 10 km in less than 60 min after
the VO2peak test and 5 km Time trial in session
2
Regular tobacco use
Illicit drug use (e.g. growth hormone,
testosterone, etc.)
Inability to meet health and physical activity
guidelines according to the PAR-Q+
* VO2max of ≥57 ml/kg/min (18-24 y), ≥54 ml/kg/min (25-29 y), ≥52 ml/kg/min (30-34 y), ≥49
ml/kg/min (35-39 y), ≥47 ml/kg/min (40-44 y), ≥44 ml/kg/min (45-50 y) according to age
(Shvartz & Reibold, 1990)
3.3 Participant Consent, Explanation of Study and Familiarization
Individuals interested in participating in the study were scheduled for session 1 to complete the
requirements of phase 1. During this initial meeting, the study was explained in detail, a training
log retrospective of the last 4 weeks was completed to ensure adequate training load to meet our
definition of trained and the PAR-Q was completed to confirm eligibility to participate.
Participants were given the opportunity to ask any questions pertaining to the study. All who
qualified and agreed to participate in the study were required to sign a detailed consent form and
were booked for session 2 to undergo the requirements of phase 2. They were given an
accelerometer to wear and a dietary log to complete for 3 days prior to their session 2 date. The
data collected from these tools were used to assess typical activity patterns, energy expenditure
and food intake.
At session 2, participants arrived at the lab in the morning after a minimum of 7 hours of fasting
(i.e. no food or fluid intake with the exception of water). The following assessments were then
completed:

20
Resting Energy Expenditure (REE): The participant’s REE was measured using open circuit
indirect calorimetry (GA-300, iWorxSystems Inc.). REE was calculated from oxygen
consumption (VO2) and carbon dioxide production (VCO2) using the abbreviated Weir equation
(WEIR, 1949). This data was used to provide an estimation of energy requirements for the
controlled diet.
Body Composition: Following completion of the REE assessment, the participants underwent
body composition measurement via air displacement plethysmography and a correction for
internal volumes (Bod Pod, COSMED USA Inc., Chicago, IL). This method measures body
mass (weight) using a calibrated scale, and volume by sitting inside the Bod Pod to determine
body density. Body density can then be used to estimate fat mass (FM) and fat-free mass (FFM).
VO2peak: Following body composition analysis the participants warmed up on the treadmill
before engaging in a VO2peak test. This test required participants to wear a heart rate monitor
and aerobic fitness was assessed by measurement of respiratory gas exchange throughout a ramp
protocol. Participants performed the graded exercise test to exhaustion. VO2peak was
determined via open-circuit spirometry on a metabolic cart (GA-300, iWorxSystems Inc.). A
constant running speed was maintained while treadmill incline (starting at 0%) was increased by
2% every 2 minutes. VO2peak was be defined as the oxygen consumption at which the
participant’s RER is 1.15, HR (beats/min) of the age-predicted maximum, and/or the point at
which the participant was unable to continue running (volitional fatigue).

21
5-Km Time Trial (5kmTT): Following an appropriate rest (however long the participant
chose/until they were ready) after the VO2peak test, participants ran 5 km at a 0° slope as fast as
possible. This test was performed within the lab on a powered treadmill (LifeFitness 9500HR,
Brunswick and Co.). Participants were free to adjust the speed as desired using the buttons on
the treadmill. No information was given on heart rate, speed, or time; the participants were only
able to see the distance they had covered. Water was provided for participants to consume ad
libitum during the entire test. This test is comparable to the training of the participants. It has a
high specificity to the improvements in performance desired by this population and also has a
high degree of reliability (Russell et al., 2004).
Maximum Voluntary Contraction (MVC): After completion of the 5kmTT, participants rested
before performing 3 MVC strength tests. The MVC requires the participants to sit in a chair-like
apparatus with their right leg secured to an immovable arm in a bent 90° position by straps on
the lower leg. The participants were then asked to perform a maximal isometric contraction of
their knee extensors by attempting to straighten their leg against the lower pad of the machine for
~5 seconds. Participants were allowed three 5-second attempts with 1 min of rest between
attempts and the maximal strength of their right knee extensors was determined through force
output signals recorded using PowerLab with LabChart Pro v.8.0.5 (ADInstruments Inc.,
Colorado Springs, CO, USA). This strength test provided a measure of changes in muscle fatigue
as defined as an exercise-induced reduction in maximal voluntary force (Place et al., 2007) as
well as differences in muscle damage (Clarkson & Hubal, 2002).

22
Jump Impulse and Peak Force (Jump): Jump impulse and peak force were then assessed via a
vertical jump test (using AMTI NetForce software) on force platforms. Participants were
directed on how to perform a countermovement jump to achieve maximal jump height. They
were then given 3 jumps to attain maximal jump height separated by 1 minute of recovery. Jump
impulse and peak force exerted on the force platform during the takeoff phase of the jump was
assessed. This test was used to measure differences in neuromuscular fatigue (Gathercole,
Sporer & Stellingwerff, 2015) associated with the concentric power production of the leg
extensors (Arteaga et al., 2000).
The 5kmTT, MVC and jump tests in session 2 are to familiarize the participant with the tests
they were expected to perform during phase 3. In order to familiarize the participants with the
training protocol as well, they ran 10 km at a self-selected pace on a treadmill in the lab.
Participants were then be scheduled for sessions 3, 4 and 5 to undergo the experimental trials of
phase 3.
3.4 Training Periods and Performance Assessments
Phase 3 involved the performance tests (MVC, 5kmTT and Jump) as described previously on
days 4 and 11 as well as the training protocol on days 7 through 10. This allowed for a
comparison of the described measurements before and after the controlled training. Training
consisted of 20km, 5km, 10km, 20km respectively each training day. These training volumes
were completed at the runner’s convenience. An HR and GPS monitor (M400, Polar Electro,
Kempele, Finland) was provided for participants to wear for 5 minutes in the morning before
breakfast to record morning heart rate and during each training session. This allowed the
researcher to control and measure the quantity and intensity of each training bout. Participants

23
were asked to refrain from all other exercise during the day with the exception of normal daily
activities (eg. commuting, shopping, etc.). The 3 sessions involved in phase 3 were separated by
a minimum of 7 days. For a detailed schematic please see Figure 2.
The exercise load (20km, 5km, 10km, 20km running) was selected to provide a stimulus that
would presumably enhance mitochondrial protein synthesis (Harber et al., 2010; Wilkinson et al.,
2008) and induce elevations in post exercise muscle protein synthesis sensitivity to feeding
(Harber et al., 2010). It is also reflective of the habitual training of trained distance runners
aiming to augment aerobic adaptations and improve their performance.
- Explanation of the study in detail- Assent, Consent Information- PAR-Q + self-reported training log
- Resting energy expenditure- BodPod Measurements- Fitness Assessment (VO2max test.5 km TT)- Performance test (strength test) - Familiarization run (10 km)
Fig. 1 – Overview of this study
Session1 - Introduction: ~1.5h Session2-Fitness Assessment: ~5h
Session3Training periods (11 days)
Session 4Training session (11 days)
Intensified training 4 days
(20,5,10,20 km)
Rest2 days
Blood sampling
test
3 days - Dietary and activity log
test
Voluntary Exercise 2 days
rest
High 1.83 g/kg
Low0.94 g/kg
Moderate 1.2g/kg
Protein metabolism
Washout at least 7 days
Habitual diet (2days)
Dietary log (4 days)
Nitrogen balance
( )*
*: one randomly selected session of the three sessions
Session 5Training session (11 days)
Washout at least 7 days
Figure 2. Study overview

24
3.4.1 Stable Isotopes
On day 3 (of one of these sessions, randomly selected), day 7, and day 10 of each session, whole
body protein metabolism for 24 hours was assessed using the oral [15N] glycine method. Day 3
of the randomly selected session allowed determination of protein balance on a rest day
(refraining from structured exercise). Measurement on day 7 and day 10 allowed a comparison
of resting metabolism to training day (20 km run) metabolism during each trial. The principle
behind this method is that the isotopically labelled nitrogen, which was ingested in the morning
of the metabolic trial day, was diluted by non-labelled nitrogen derived from de novo synthesis
(which arose from endogenous protein degradation). The enrichment of [15N] in urinary
ammonia and urea was used to calculate whole body nitrogen turnover over 12h (fed period;
[15N]ammonia) and 24h (harmonic mean of [15N]ammonia and urea) (Duggleby & Waterlow,
2005). Subsequently, on day 8 and day 9, nitrogen balance for 24 hours was estimated by
measuring 24-h urinary nitrogen excretion and approximating other losses based on past data in
similar populations (Consolazio et al., 1963; Calloway, Odell, & Margen, 1971). In order to
account for potential variation in nitrogen loss through sweat (Consolazio et al., 1963),
participants were required to weigh themselves before and after the runs and record how much
fluid they consumed (100g = 100ml of body water).
Whole-body turnover (Q) could then be calculated using the formula:
Q = NIN/NOUT or Q = S + NOUT = B + NIN
NOUT (Nitrogen Excretion) is the 15N enrichment of urea. Assuming the N metabolic pool is in
steady-state, then the flux (i.e. Q) equals the amount of N leaving the pool (S + NOUT, where S is
synthesis and NOUT is urinary N excretion) and equals the amount of N entering the pool (B +

25
NIN, where B is breakdown and NIN is intake). NOUT and NIN could be measured and therefore S
and B could be calculated. Whole body protein synthesis and breakdown were calculated after
determination of total nitrogen intake and excretion (i.e. from the major nitrogen-containing
metabolites and estimated average sweat and miscellaneous losses). Miscellaneous nitrogen
excretion including that of sweat, fecal and other losses was estimated using a miscellaneous to
urinary loss ratio determined from the data of Tarnopolsky, MacDougall & Atkinson (1988) who
measured urine, sweat and fecal nitrogen losses in a trained endurance running population
consuming 1.7 g/kg/d of protein.
3.5 Controlled Diet and Test Drinks
Participants consumed the controlled diet providing 0.8 g/kg/d of protein, 6-9 g carbohydrate
/kg/d and an energy intake to cover 1.6x their REE calculated from the indirect calorimetry in
session 2 and their estimated exercise-induced energy expenditure.
In order to increase the protein intake to the target levels and maintain the double-blind nature of
the trial, test drinks consisting of a complete profile of crystalline amino acids were provided to
increase the protein intake by 0.14 g/kg/d (LOW), 0.40 g/kg/d (MOD) or 1.03 g/kg/d (HIGH) to
meet the needs of the tested dosages. Participants were instructed to not consume anything other
than water, outside of the prepared meals and snacks, and were required to complete a dietary
checklist to indicate that they had consumed the provided meals. The test drinks were provided
in powdered form and mixed/dissolved in water by the participant. Participants took 3 test-drinks
per day separated by at least 3 hours; they consumed 1 drink immediately after exercise and the
other 2 drinks between two of the main meals of the day (e.g. mid-afternoon and before bed).

26
3.6 Data Analysis
All protein turnover variables were analyzed using a two-way (pre-post * diet) repeated
measures ANOVA. Differences between means for significant main effects or interactions were
determined using a Holm-Sidak post-hoc test. The relationship between protein intake and all
variables was analyzed using bilinear regression analysis and biphasic linear regression analysis
according to the situation. Statistical significance is established at P < 0.05, and all data were
expressed as means ± SD.
3.7 Precision of Estimation and Statistical Inference.
Adopting recommendations for progressive inferential statistics published in Medicine and
Science in Sports and Exercise (Hopkins et al., 2009) and elsewhere (Cohen, 1994; Schmidt &
Hunter, 1997), performance data was analyzed by magnitude-based inference (Hopkins, 2004).
This approach was taken due to the fact that, in traditional statistics based on the null hypothesis
and a P-value, the real-world importance of an effect (e.g. performance benefit) may be present
and clinically meaningful but could be misinterpreted as a non-significant effect by these classic
statistical approaches (Hopkins et al., 2009). This more intuitive approach to inferences is based
on where the confidence interval lies in relation to threshold values for substantial effects rather
than the null value (Batterham & Hopkins, 2006). Probabilistic determination that effects are
greater than, less than, or equivalent to the defined practically or mechanistically quantitative
thresholds are provided with this method.
Estimated precision was set at 95% confidence interval. After standardization, probabilistic
inferences about the true value for outcomes except performance were qualified using the

27
standardized difference (adopted from the Cohen effect size d: mean difference/appropriate SD).
Standardized difference thresholds were as follows: very small = 0.01-0.2 (Sawilowsky, 2009),
Small = 0.2–0.5, moderate = 0.5-0.8, large = >0.8 (Cohen, 1988). Probability thresholds were
obtained from the t distribution with likelihoods ordered into cutoffs and inferred as follows:
almost certainly not <0.5%, very unlikely = 0.5%–5%, unlikely = 5%–25%, possibly = 25%–
75%, likely = 75%–95%, very likely = 95%–99%, and almost certain >99% (Hopkins et al.,
2009).
The smallest worthwhile effect for qualitative inferences of the MVC and Jump measures was set
at 0.2 based on the small standardized difference threshold of Cohen, 1988. The smallest
worthwhile effect for qualitative inferences of the 5kmTT was set at 0.16. This is based on the
smallest worthwhile difference of 4 seconds determined for this test by Stevens et al. (2015)
divided by the pooled between subjects SD.

28
Chapter 4. Results
4.1 Participants
A total of 11 endurance trained male participants were recruited for the study. All participants
met our definition of trained as determined in their activity history report taken in session 1 and
in the fitness assessment in session 2. All participants completed all sessions with the exception
of one participant who voluntarily withdrew from the study after session 3 (Trial #1) due to
upcoming time conflicts. Participant characteristics are provided in Table 3. Characteristics and
results do not include those of the participant who withdrew.
Table 3 Participant characteristics
Participant characteristics (n=10)
Characteristic Value (mean ± SD)
Age, y 31.5±7.6
Height, cm 180.3±8.3
Body weight, kg 73.7±7.5
FFM, kg 65.9±6.8
Percent Body Fat, % 10.3±5.3
VO2peak, ml/kg/min 64.7±7.9
Prior 4 week running history, km/wk 62.3±29.7
29
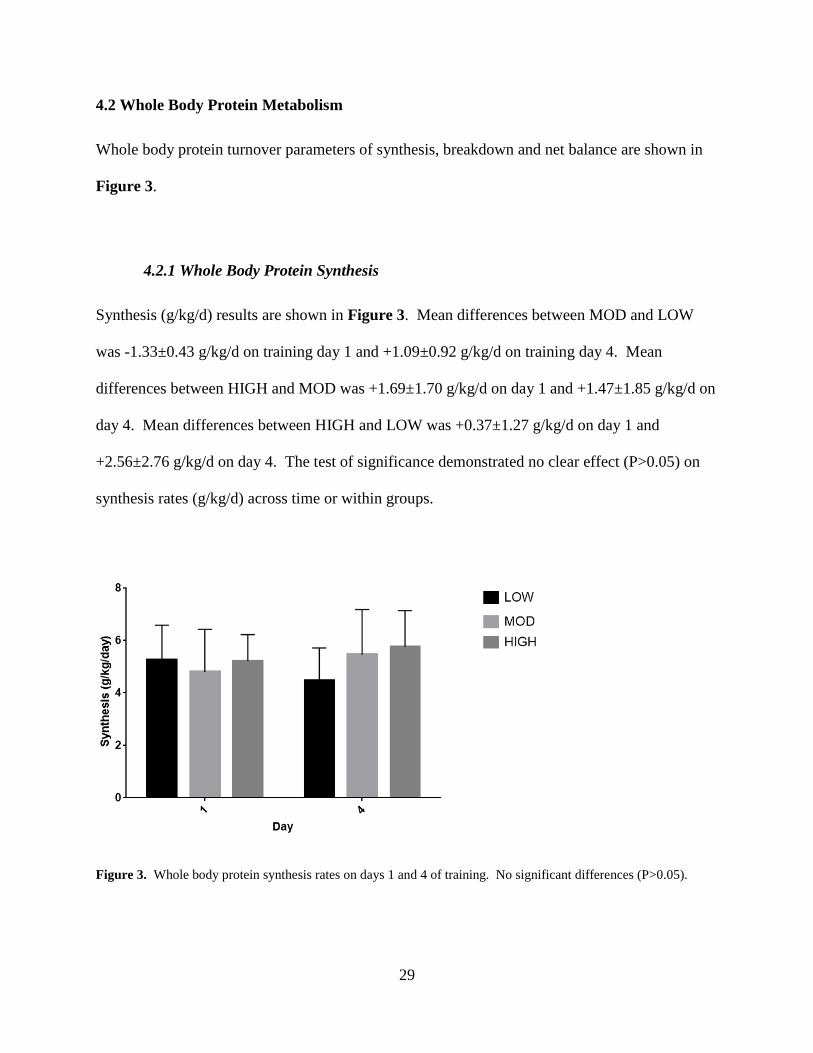
4.2 Whole Body Protein Metabolism
Whole body protein turnover parameters of synthesis, breakdown and net balance are shown in
Figure 3.
4.2.1 Whole Body Protein Synthesis
Synthesis (g/kg/d) results are shown in Figure 3. Mean differences between MOD and LOW
was -1.33±0.43 g/kg/d on training day 1 and +1.09±0.92 g/kg/d on training day 4. Mean
differences between HIGH and MOD was +1.69±1.70 g/kg/d on day 1 and +1.47±1.85 g/kg/d on
day 4. Mean differences between HIGH and LOW was +0.37±1.27 g/kg/d on day 1 and
+2.56±2.76 g/kg/d on day 4. The test of significance demonstrated no clear effect (P>0.05) on
synthesis rates (g/kg/d) across time or within groups.
Figure 3. Whole body protein synthesis rates on days 1 and 4 of training. No significant differences (P>0.05).

30
4.2.2 Whole Body Protein Breakdown
Breakdown (g/kg/d) results are shown in Figure 4. Mean differences between MOD and LOW
was -1.47±0.26 g/kg/d on day 1 and +0.91±1.03 g/kg/d on day 4. Mean differences between
HIGH and MOD was +1.34±1.24 g/kg/d on day 1 and +1.18±1.41 g/kg/d on day 4. Mean
differences between the HIGH and LOW was +0.13±0.98 g/kg/d on day 1 and +2.09±2.44 g/kg/d
on day 4. The test of significance demonstrated no clear effect (P>0.05) on breakdown rates
(g/kg/d) across time or within groups.
Figure 4. Whole body protein breakdown rates on days 1 and 4 of training. No significant differences (P>0.05).
4.2.3 Whole Body Protein Net Balance
Net balance (g/kg/d) results are shown in Figure 5. HIGH demonstrated the most positive net
balance (mean of 0.21±0.65 g/kg/d) and MOD was less negative (mean of -0.02±0.52 g/kg/d)
than LOW (mean of -0.18±0.28 g/kg/d). A significant difference was found in net balance
between all 3 conditions (LOW-MOD, P=0.03; LOW-HIGH, P=0.01; MOD-HIGH, P=0.02) and
significant differences were found on day 1 (LOW-MOD, P=0.05; LOW-HIGH, P=0.01; MOD-

31
HIGH, P=0.01) and day 4 (LOW-HIGH, P=0.04).
Net balance day 1 to day 4 had mean increases of 0.07±0.12, 0.10±0.29, 0.07±0.10 g/kg/d for
LOW, MOD and HIGH respectively, but no significant effect (P>0.05) of time was
demonstrated.
Figure 5. Capital letters indicate main effect of condition (P<0.05); * indicates different from LOW within Day
(P<0.05); † indicates different from MOD within Day. Whole body net protein balance rates within groups on days
1 and 4 of training. Significant differences (P<0.05) were found between all groups without the effect of time.
Significant differences (P<0.05) were also found between all groups on day 1 and between groups LOW and HIGH
on day 4.

32
4.3 Performance
4.3.1 MVC
MVC performance outcomes are summarized in Table 4. HIGH had improved MVC
performance (mean of +0.40 N/kg or ~2.6%) from pre to post testing, whereas LOW resulted in
a mean decrease in MVC performance (mean of -0.87 N/kg or ~ -5.6%) putting the standard
difference at 1.27 g N/kg (ES=0.57±0.77) for HIGH over LOW. MOD also showed a decrease
in MVC performance from pre to post (mean of -0.58 N/kg or ~ -3.7%) with a standard
difference of 0.98 N/kg (ES=0.42±0.70) for HIGH over MOD. There was a standard difference
of 0.29 N/kg (ES=0.12±0.68) for MOD over LOW. For mean pre to post performance outcomes
and graphic depictions of mean differences please see Appendix A.
4.3.2 5kmTT
Inferential 5kmTT performance outcomes are summarized in Table 4. LOW and MOD had pre
to post increases in mean time trial time (decrease in performance) of +7.8 seconds (0.7%) and
+8.4 seconds (0.8%) respectively. The standard difference for MOD over LOW is -0.84 seconds
(ES= -0.02±0.60). HIGH had a mean pre to post reduction in time trial time (increase in
performance) of -7.8 seconds (-0.7%). The standard difference for HIGH over MOD is -16.0
seconds (ES=-0.26±0.50) and the standard difference for HIGH over LOW is -15.2 seconds
(ES=-0.24±0.25). For mean pre to post performance outcomes and graphic depictions of mean
differences please see Appendix A.

33
Analysis of pre-performance data (irrespective of treatment) indicated no significant differences
[trial 1 vs. trial 2 (P=0.70); trial 1 vs. trial 3 (P=0.06); trial 2 vs. trial 3 (P=0.93)]. This
demonstrates that there was unlikely to be an order or learning effect between trials, suggesting
that participants did not require further familiarization.
4.3.3 Jump
Jump performance outcomes are summarized in Table 4. There are no clear effects on jump
impulse or peak force performance within the three protein conditions. The mean differences in
impulse pre to post performance are -0.08 kg.m/s (-2.4%), -0.28 kg.m/s (-8.3%) and -0.18 kg.m/s
(-5.3%) for LOW, MOD and HIGH respectively. The standard differences are: -0.20 kg.m/s
(ES=-0.13±0.31) for MOD over LOW, 0.10 kg.m/s (ES=0.10±0.27) for HIGH over MOD, and -
0.10 kg.m/s (ES=-0.11±0.31) for HIGH over LOW. The mean differences in peak force pre to
post performance are -0.21 N/kg (-0.9%), -0.45 N/kg (-2.0%) and -0.33 N/kg (-1.5%) for LOW,
MOD and HIGH respectively. The standard differences are: -0.25 N/kg (ES=-0.08±0.32) for
MOD over LOW, 0.12 N/kg (ES=0.07±0.38) for HIGH over MOD, and -0.13 N/kg (ES=-
0.06±0.21) for HIGH over LOW. For mean pre to post performance outcomes and graphic
depictions of mean differences please see Appendix A.

34
Table 4 Inferential performance outcomes
Outcome
MOD - LOW HIGH - MOD HIGH - LOW
ES;CI Qualitative inference
Probability of a substantial effect ES;CI Qualitative inference
Probability of a substantial effect ES;CI Qualitative inference
Probability of a substantial effect
MVC 0.12±0.68 Possible beneficial very small effect 39% 0.42±0.70
Likely beneficial small effect 77% 0.57±0.77
Likely beneficial moderate effect 87%
5kmTT -0.02±0.60 Unlikely effect 23% -0.26±0.50 Possible beneficial small effect 69% -0.24±0.25
Likely beneficial small effect 79%
Jump Impulse -0.13±0.31 Very unlikely effect 1% 0.10±0.27 Unlikely effect 18% -0.11±0.31 Very unlikely effect 2%
Jump Peak Force 0.08±0.32 Unlikely effect 18% 0.07±0.38 Unlikely effect 20% -0.06±0.21 Very unlikely effect 1%
Standardized difference thresholds were as follows: very small = 0.01-0.2 (Sawilowsky, 2009), Small = 0.2–0.5, moderate = 0.5-0.8, large = >0.8 (Cohen, 1988)
Probability thresholds were obtained from the t distribution with likelihoods ordered into cutoffs and inferred as follows: almost certainly not <0.5%, very unlikely = 0.5%–5%,
unlikely = 5%–25%, possibly = 25%–75%, likely = 75%–95%, very likely = 95%–99%, and almost certain >99% (Hopkins et al., 2009)

35
Chapter 5. Discussion
The aim of the present study was to determine the effects of different protein dosages, being 1.83
g/kg/d (HIGH), 1.2 g/kg/d (MOD) and 0.94 g/kg/d (LOW) of daily protein intake, on
performance and recovery during a period of controlled endurance training. This data shows for
the first time that over four days of controlled variable distance exercise, 1.83 g/kg has marked
benefits for performance (MVC and 5kmTT) and improvements in whole body net protein
balance over 1.2 and 0.94 g/kg in trained male adult endurance exercisers.
The HIGH condition had the most positive net balance in protein turnover values as it was the
only group that demonstrated a positive overall net balance. This group also had the greatest
retention of performance in both the right quadricep MVC and the 5km time trial performance
tests. Thus, these data suggest that the typical intake of this population (1.2-1.6 g/kg/d)
(Tarnopolsky, 2004) as well as the low end of the current ACSM recommendation for endurance
athletes (1.2-2.0 g/kg/d) (ACSM, 2016) may be suboptimal for recovery and performance. The
RDA of 1.83 g/kg suggested by Kato et al. (2016) may be closer to that needed for this
population to best adapt to or sustain performance during a typical endurance training regimen.
The following sections contextualize the results considering previous studies that have
determined protein requirements using various techniques to measure protein turnover and
performance variables. Suggestions for avenues of future research are proposed in light of a
discussion of the strengths, limitations, and implications of the present study.

36
5.1 Changes in Protein Metabolism
Nitrogen balance (NBAL) is a classic method used to determine the protein requirements of
humans. The technique involves quantifying all the protein that enters the body (diet or
intravenous) and all the nitrogen that is excreted. Because the body excretes nitrogenous
compounds rather than whole proteins and proteins are approximately 16% nitrogen, NBAL
involves measurement of total nitrogen intake (NIN) and total nitrogen excretion (NOUT = urine +
feces + sweat + miscellaneous, i.e., menstrual loss, hair, semen, and skin). NBAL is deemed to
be positive during net anabolism and negative if a person is losing more protein than he or she is
taking in.
According to international health organizations “energy requirements change with activity and
lifestyle [but] protein requirements do not” (World Health Organization, 1985). However, it has
been demonstrated that amino acid oxidation rates are elevated during exercise, especially as
glycogen becomes depleted such as during prolonged (>1.5 hr) endurance training (Graham et
al., 1995; Wagenmakers, et al., 1991; Lemon & Mullin, 1980). Also, protein is needed not only
to replace these losses but to also provide the building blocks to repair damaged tissue and
generate new tissue that serve as the adaptations to the training stimuli. Essential amino acids
(EAAs) cannot be synthesized by the body, meaning they must be obtained through dietary
sources or in crystalline amino acid form, such as those given within this study, as they in
particular are required to stimulate synthesis of this new tissues (Tipton, Gurkin et al., 1999;
Tipton, Ferrando et al., 1999). Past studies have indeed shown that synthesis rates are increased
following endurance training for as long as 24-28 h (Wilkinson et al., 2008; Di Donato et al.,
2014).

37
Our study supports the hypothesis that dietary protein needs are increased by physical activity
such as endurance exercise as demonstrated by the less negative net protein balance with the
increasing protein intakes. Furthermore, the overall net balance with the LOW protein intake
was negative despite being slightly higher (additional 0.14 g/kg) than the RDA suggested for the
general population (Health Canada, 2006), further highlighting the inadequacy of this intake for
athletic populations. The additional amino acids are posited to be required to replace oxidative
losses that occur secondary to exercise-induced increases in breakdown. In addition, these amino
acids may also support increased rates of protein synthesis to repair and generate new tissue
during recovery. As supported by our performance data (benefits in quadriceps strength and
5kmTT speed), these processes ultimately serve as the adaptations that are ultimately of
paramount importance to the endurance athlete.
Whole body protein metabolism was assessed using the oral [15N] glycine method. This method
allows whole body protein turnover (synthesis and breakdown) to be calculated using measures
and estimates of nitrogen intake and excretion. By measuring [15N] urea and ammonia
enrichment after the continuous administration of [l5N] glycine over a controlled training period,
protein turnover rates were determined over days rather than hours. This allows integration of
rest, exercise and recovery from exercise, the fed state and the fasted state, as well as daily
activities and sleeping. Moreover, unlike invasive muscle biopsies that can cause muscle
soreness and discomfort during the hours to days after the procedure, the noninvasive nature of
our oral tracer would have little to no discernible impact on the athletes’ metabolism and thus
represent an ideal methodology when assessing parallel measures of performance. The data from
this measurement suggests that whole body net protein balance becomes less negative with each

38
increase in protein intake used in our study as LOW was negative (-0.18±0.28 g/kg/d), MOD was
neutral (-0.02±0.52 g/kg/d) and HIGH was positive (+0.21±0.65 g/kg/d).
Despite the robust differences in net balance, there were no significant differences found in rates
of protein synthesis or protein breakdown. Past studies have demonstrated that it is likely that
increases in rates of protein synthesis are more of a driving factor than reductions in breakdown
on changes in net balance (Koopman et al., 2004; Levenhagen et al., 2001). Meredith et al.
(1989) found significantly lower synthesis rates at protein intakes of 0.6 g/kg/d compared to 1.2
g/kg/d. However, synthesis rates cannot be attributed to the total difference in net balance. It is
likely that subtle changes in both synthesis and breakdown are translating into the observable
effects on net balance. It is also important to note that these subtle differences in synthesis,
breakdown and net balance following exercise at the whole body level have shown in past data to
be magnified at the muscle level (Levenhagen et al., 2002) supporting the suggestion that these
processes are contributing to recovery and adaptation of this tissue. Thus, maximizing whole
body net balance would be ideal as this would ensure most/all relevant protein pools are
enhanced and protein synthesis is presumably maximized, the latter of which has been suggested
to be the main recovery goal for athletes (Phillips & van Loon, 2011).
In addition to this study, there are three others which have suggested that protein intakes at or
just below 1.0 g/kg/d are not adequate to meet the needs of most men and women with this type
of exercise. Phillips et al. (1993) examined the effect of the then Canadian recommended daily
protein intake of 0.8 g/kg/d on NBAL in endurance-trained men and women. The participants in
this study were trained runners and had a reported running frequency of 4.4±1.4 days/wk for

39
males and 5.0±1.2 days/wk for females. Their activity during the study was uncontrolled but
was within the realm of their habitual activity according to their training logs. Their reported
weekly mileage was 50.3±22.3 km for the male participants and 43.3±11.0 km the female
participants, which is just below what our participants were asked to do within 4 days (55 km).
Following the 10-d adaptation period, participants were found to be in negative NBAL, which
would be consistent with our athletes on the LOW diet. Lamont, Patel and Kalhan (1990)
studied male and female endurance trained cyclists and runners consuming protein at 1.0 g/kg/d.
Training was not controlled but participants were asked to rest 3 days prior to metabolic
measurement as the purpose of the study was to understand protein metabolism kinetics in a
resting state for this population. At the time of measurement, participants were found to be in
slightly negative NBAL (women, −0.22 g N/d; men, −3.95 g N/d). Similar to our study, Meredith
et al. (1989) who measured NBAL in male trained adults had their participants consume three
different protein intakes (0.61, 0.92, and 1.21 g/kg/d). Participants had a 2-40 year regular
training history of cycling, running, rowing and/or calisthenics. Training during the study was
not controlled but participants were asked to maintain their habitual activity in their habitual
environment. The results found a mean protein intake for a zero NBAL of 0.94 g/kg/d and an
RDA of 1.26 g/kg/d. These above studies’ protein intake recommendations were assessing the
minimal intake of protein required to offset deficiency (i.e. a zero NBAL) rather than an optimal
dosage for eliciting adaptive improvements in performance. Meredith et al.’s (1989) findings are
the basis for the ACSMs lower end of protein intake recommendations (ACSM, 2016) and were
the support for the previous more specific recommendations of 1.2-1.4 g/kg in 2009 (ACSM,
2009).

40
Two studies, one by Butterfield and Calloway (1983) and the other by Todd, Butterfield &
Calloway (1984), proposed that protein requirements are less in active individuals based on their
finding that nitrogen retention was improved in this population. In both studies, participants
were housed for 108 days and their daily controlled training consisted of 1 hr on a treadmill and
1 hr on a cycle ergometer at an intensity calculated to result in a combined energy expenditure of
15% of total daily energy needs. Butterfield and Calloway (1983) state that “apparent slight
retention of N even with the marginal protein intake suggests that tissue is being laid down under
these circumstances”. However, this is not a basis that the protein intakes are maximizing the
utilization of protein for tissue to adapt to the training. Indeed, Young et al. (1987) have
demonstrated that participants who are given insufficient leucine intakes of 7 and 14 mg/kg/d are
able to maintain leucine balance by reducing rates of protein synthesis whereas with 30 mg/kg/d
they were in balance at higher rates of synthesis. This suggests that part of the way the body
compensates for lower intakes is by reducing synthesis rates which could be affecting the
potential for muscle growth and other adaptations to exercise. In other words, this instead may
be evidence of a shift in the hierarchy of amino acid–requiring processes toward muscle protein
synthesis getting a “greater share” of circulating amino acids in both fasted and fed states. This
may also be occurring in the studies which only found slight increases in protein intake to be
needed such as 0.46 g/kg above the RDA for sedentary individuals suggested by Meredith et al.
(1989). It is arguable that athletes are seeking maximal benefits from their training rather than
just accommodation of their body to meet hierarchical needs.
With the above studies in mind, which base their recommendations on that which is needed to
achieve a net zero nitrogen balance, it brings forth the consideration that the primary goal of

41
adequate protein consumption is not at a fundamental level, protein balance, but rather to be able
to support increased protein retention and utilization to procure greatest adaptation potential. For
endurance athletes wishing to have protein tissue adequately repaired and turned over, a positive
net protein balance is the desired goal. This is presumably because of the periodic stimulation of
protein synthesis, which, if it is to support the net gain of new proteins or enhanced
remodeling/repair, could require net extra amino acids (Philips, Moore & Tang 2007; Phillips,
2006; Phillips, 2004; Rennie & Tipton, 2000; Rennie et al., 2004). Adequate protein intake could
be partially defined as maximizing the increase in protein synthesis that occurs after exercise
(Carraro et al., 1990; Miller et al., 2005; Sheffield-Moore et al., 2004) as well as balancing the
losses of BCAAs which are oxidized to an appreciable extent during endurance exercise
(Lamont, McCollough & Kalhan, 1999; Lamont, McCollough & Kalhan, 2001; McKenzie et al.
2000). These could also be said to be primary goals of an endurance athlete aspiring to
maximize their performance improvement from training.
If a proposed protein requirement were to be based on a net zero protein balance alone, our data
would suggest that requirements for this population would be closer to Meredith et al.’s (1989)
RDA of 1.26g/kg/d as our 1.2 g/kg/d intake resulted in a mean net balance just below zero (-0.02
g N/kg/d). However, at a zero net balance it is possible that physiological (mal)adaptations may
be present (such as curtailing of other important processes) in addition to the demonstrated
reduced synthesis rates (Young et al., 1987). Past studies have also shown benefits of higher
intakes such as improved immune function (Gleeson, 2007; Witard et al., 2014; Witard et al.,
2012). In other words, this could be an indicator that the body is sacrificing amino acids for the
tissue repair process over other relevant processes and that a zero net balance is an inappropriate

42
index for the basis of a suggested requirement.
The IAAO method of measuring protein turnover has been posited to provide a better indication
of the true protein intake needs for optimization (i.e. maximization of the body’s use of protein
for tissue turnover, repair and development) (Zello et al., 1995; Elango, Ball, & Pencharz, 2008).
This method measures amino acid oxidation, with the reciprocal being whole body protein
synthesis, suggesting that the intake determined would optimize recovery. Indeed, Levenhagen
et al. (2002) demonstrated that muscle protein synthesis displays a greater magnitude of change
compared to whole body protein synthesis, suggesting that all tissue is similarly being stimulated
with protein ingestion after exercise. Therefore, these intakes would presumably allow the body
the ability to use dietary protein for performance enhancement rather than just for maintaining
basic physiological functioning. The protein intake required to maximize synthesis rates would
be less likely to result in a downgrading of the use of protein for any physiologically relevant
processes. Considering the inherent problems associated with the nitrogen balance method
(Pencharz & Bell, 2003), many have hypothesized that the protein requirements it provides are
underestimated (Pencharz, Elango & Ball 2008; Tarnopolsky, 2004; Phillips, Chevalier & Leidy,
2016; Lamont, 2012; Phillips, Moore & Tang, 2007). The IAAO method on the other hand is
suggested to be more accurate (Pencharz, Elango & Ball, 2008; Pencharz & Ball, 2003) and
allows for a greater number of test protein intakes to be performed within a given participant to
find a more precise requirement (Elango, Ball & Pencharz, 2012; Elango et al., 2009). As
further support, the Institute of Medicine encourages this method for the determination of amino
acid requirements (Institute of Medicine, 2005). This method could not be used with our
participants due to impracticalities in a “free living” situation. However, our reasoning for our
43
HIGH protein dose is based on the findings of Kato et al. (2016) who used the IAAO method to
determine this intake to be what is required in this population to maximize synthesis rates.
Another important note is that we used crystalline amino acids that reflected the amino acid
composition of egg whites which could have influenced our results. This amino acid profile is
considered “high quality” (i.e., PDCAAS >1) due to its high EAA content. These amino acids in
particular are the primary drivers of protein synthesis (Tipton, Ferrando et al., 1999, Tipton,
Gurkin et al., 1999). Dietary protein in other forms could lead to differences in support of
maximal rates of synthesis after exercise and ultimately adaptation to training (Tang et al.
2009). This has implications for more varied diets which consist of more or exclusively protein
from plant based sources. These sources of protein are typically lower in EAAs and therefore
may require a greater overall protein intake to achieve maximal synthesis rates (Phillips, 2006).
Thus, inasmuch as the protein quality influenced the present results, dietary protein quality may
have varied effects on protein metabolism and our choice of protein for our test drinks would
further support maximal synthesis rates. However, vegetarian or vegan athletes may require a
greater protein intake that utilized within the present study to obtain similar metabolic and
performance benefits due to the generally lower protein quality of their plant-based diets.
5.2 Performance
This study is the first of its kind to examine the effects of multiple protein intakes to enhance
performance and/or mitigate performance decrements in a trained endurance running population
during controlled training. The studies that have shown that active individuals adapt to less than
adequate protein intakes by lowering nitrogen excretion (Butterfield & Calloway, 1984; Todd,

44
Butterfield & Calloway, 1984) indicate that there is no apparent relationship between nitrogen
balance and physical activity. Despite these earlier results, our study suggests that there is a
likely compromise of some physiologically relevant processes in our trained population as
performance (MVC and 5kmTT) was not retained with the MOD condition as well as it was with
the HIGH condition. These performance decrements will be discussed in detail below.
5.2.1 5kmTT
This test was selected because it has a high specificity to the improvements in performance
desired by this population as it simulates endurance competition. It also has a high degree of
reliability (Russell et al., 2004; Stevens et al., 2015;). A meta-analysis by Laursen et al. (2007)
has shown that time trial tests are less variable than their often-used counterpart being time-to-
exhaustion tests for endurance performance testing.
Stevens et al. (2015) have suggested that for trained runners who can run a 5km time trial within
17-23 minutes, a 4s difference is meaningful and worthwhile. All of our participants’ time trial
results fell within this range with the exception of one participant whose time trial was
completed in 16.65 minutes. The difference from pre to post performance between HIGH and
LOW and between HIGH and MOD was 15.6 seconds and 16.2 seconds respectively suggesting
a meaningful difference outside of the typical variability suggested by Stevens et al. (2015). It is
also of note that the HIGH treatment was the only group to improve their time trial time from pre
to post. This is a novel finding as no past studies have analyzed time trial performance in
relation to differing protein intakes alone. Millard-Stanford et al. (2005) compared a
carbohydrate plus protein recovery drink to carbohydrates alone following a 21km run plus

45
treadmill run to fatigue at 90% VO2max. Diet was not controlled but instructions outside of the
test drinks were provided (55% carbohydrate, 15% protein, 30% fat). No significant differences
in 5kmTT performance were found. Our study used a training regime more specific to how this
population trains (i.e. multiple days of variable distance running). Also, as speculated by the
authors in the article, it is unlikely that 24 hours was long enough to result in a detectable
difference. This will be discussed in further detail below. Our study incorporated 4 days of
training between pre and post testing, which the performance (MVC and 5kmTT) would suggest
allowed sufficient time for the benefits of the additional protein to be realized. Both factors,
being high relevance and sufficient training time, add precedence to our novel and important
finding in the results of this test.
5.2.2 MVC
The MVC test may be a biomarker of changes in muscle damage as defined as an exercise-
induced reduction in maximal voluntary isometric force (Place et al., 2007; Clarkson & Hubal,
2002). This test has been used in runners in past studies to assess recovery of muscle function
(Green et al., 2008; Etheridge, Philp & Watt, 2008) and it does so by directly measuring leg
extensor strength. The direct results of this measurement are relevant to this population as
increases in leg extensor strength have shown to contribute to positive effects on running
performance by enhancing running economy (Vikmoen et al., 2016; Støren et al., 2008; Sedano
et al., 2013).
Mean performance in the MVC test from pre to post testing was better retained in MOD over
LOW and improved from pre to post only in HIGH. This is in line with our hypothesis that the

46
HIGH protein intake would demonstrate the greatest performance benefit related to this group
having the least negative nitrogen balance. This is consistent with previous findings showing
that a less negative nitrogen balance is correlated with greater rates of recovery, notably through
reductions in plasma creatine kinase and later onset tiredness and muscle soreness (Rowlands et
al., 2008; Rowlands et al., 2007; Rowlands & Wadsworth, 2011; Millard-Stafford et al., 2005).
The reductions in performance from pre to post testing are suggested to be a result of increased
rates of muscle protein breakdown from the induced training (Rennie et al., 1981). These broken
down amino acids would subsequently be used for oxidation (Tarnopolsky, 2004) and, if not
replaced via adequate dietary amino acids, would result in less usable tissue for subsequent
performance (Lecker et al., 1999). Increases in muscle protein synthesis following the training
via provision of adequate amino acids would expectedly result in not only the repair of damaged
proteins, but the synthesis of new functional myofibrillar protein leading to greater strength
improvements/retention. This likely played a role in the strength improvements seen in the
HIGH group.
Counter to our results, Rowlands and Wadsworth (2011) found reductions in perceived leg
strength after high protein feeding (0.7 g/kg/h) for 4 hours comparatively to a low protein control
group (0.1 g/kg/h) following 2 days of controlled training. This study was done in 12 endurance
trained female cyclists and performance testing was completed on day 2 (as part of the controlled
training) and day 4. Perceptions of leg strength were taken via a visual analog scale. Ethridge,
Philp & Watt (2008) tested the effects of protein supplementation compared to a calorie free
water placebo. It was found that although delayed onset muscle soreness is still present 72 hours
after a downhill running bout, MVC performance had returned to pre-testing levels. They state,

47
“although this appears contradictory, it may indicate that participants’ perceptions of pain are not
a strong indicator of the decline in muscle function”. In other words, perceived pain may not
accurately reflect muscular damage and (or) may follow a different time course response. This
could explain the discrepancy between our findings and Rowlands and Wadsworth’s
(2011). The participants in Rowlands and Wadsworth (2011) may have perceived their leg
strength to be lower due to the feeling of soreness, but their actual strength may have been
recovered. This argument is also supported by the findings of a systematic review by Pasiakos,
Lieberman & McLellan (2014) who determined little evidence to support a relationship between
changes in markers of muscle damage or soreness and recovery of muscle function with protein
supplementation within a 24 hour period. However, they found that when protein
supplementation continued for extended periods, indirect markers of muscle damage (i.e. MVC)
appear to be reduced. Given LOW, MOD and HIGH were in negative, neutral and positive net
balance, respectively, these findings that a less positive nitrogen balance leads to leg strength
performance reductions are also supported by Nelson et al. (2012) and Lunn et al. (2012). Both
of these studies determined that ergogenic effects associated with protein supplementation on
physical performance are only evident over several days of training when compared to
participants who are in less positive balance.
5.2.3 Jump
Jump performance using force plate software has been shown to be an indicator of
neuromuscular fatigue (Gathercole, Sporer, & Stellingwerff, 2015) associated with power
production of the leg extensors (Arteaga et al., 2000). This test is of practical importance to
athletes as performance can be impaired by exercise-induced muscle damage resulting in

48
neuromuscular fatigue (Bryne, Twist & Eston, 2004). Both neuromuscular fatigue and muscle
damage have been observed to increase the physiological demand of endurance exercise (Bryne,
Twist & Eston, 2004). We observed no clear difference in performance within the different
protein intakes. A high variation in jump impulse and peak force in each condition indicates that
individual responses to the intervention contributed to the unclear performance outcome.
Jumping metrics have not been used as a measure of performance in this population to compare
protein intakes in the past. A potential reason for the lack of mean difference between groups in
the present study could be the fact that performance in this test has previously shown to be
strongly related to the fiber-type profile of the muscle with a more type II dominated
musculature resulting in greater improvements in jump performance (Mero, Jaakkola & Komi,
1991). This fiber type experiences increases in hypertrophy to a much larger degree following
resistance training relative to endurance exercise (Farup, Sørensen & Kjølhede, 2014).
Differences in jumping performance have been seen within 24 hours following just 1 bout of
resistance exercise (West et al., 2017) and to a greater degree after 14 weeks of resistance
training (Andersen et al., 2005) in a resistance trained population.
In general, endurance trained participants display a greater proportion of type I muscle fibers
(Gollnick et al., 1972; Costill et al., 1979; Harber et al., 2004) and endurance training elicits less
change to these muscle fibers relative to resistance training, particularly in a trained population
(Trappe et al., 2006). Therefore, a longer training intervention may be required to detect
noticeable differences.

49
5.2.4 Performance Implications
Other studies that have examined the effect of different protein intakes on performance measured
repeated-sprint mean power in endurance cyclists after one training session and within only 24
hours (Rowlands et al., 2007; Rowlands & Wadsworth, 2011; Rowlands et al., 2008). Rowlands
et al. (2008) tested performance 24 h and 60 h post training and showed that performance
differences were not detectable at 24 h, but were at 60 h. This may be related to the time needed
to generate new tissue in order to bring about a detectable difference. Our results, although on
different performance measures, support the construct that there is an effect after multiple days
(Pasiakos, Lieberman & McLellan, 2014).
The present study’s performance data also expand on Rowlands et al.’s (2008) findings related to
the effect of different dietary protein intakes on performance benefits. This group compared two
intakes with the higher intake (average 1.9 g/kg/d) resulting in a protection against performance
deterioration over the lower intake (average 0.8 g/kg/d). The HIGH protein dosage in the present
study was based on the RDA determined through the IAAO methodology by Kato et al. (2016).
This intake is posited to allow amino-acid stimulated protein synthesis to occur at an optimal
capacity and, thus, lead to physiological adaptations that provide improvements in performance.
The benefits demonstrated in the MVC and 5kmTT tests in the HIGH intake over the other
treatments in our study support this.
Reviews on protein requirements for exercising individuals by Phillips, Moore & Tang (2007),
Phillips and van Loon (2011) and Tarnopolsky (2004) have suggested that NBAL is insufficient
to determine an optimal intake. Proposedly, using signs of physiological adaptation along with

50
differences in measured metabolism are more accurate presumptions for distinction of a protein
intake recommendation on with this method. In this study, differences in metabolism were found
and signs of physiological adaptations were measured via performance, the latter of which is
arguably the most relevant outcome for this athletic population. Of the three intakes tested, 1.83
g/kg would be most optimal for an endurance exerciser to consume based on these findings.
5.3 Strengths and Limitations
The participants’ food intake and exercise were rigorously controlled within the realm of free-
living practicality in this study. This gives further precedence to the findings as it reduces the
“noise” of other influences to determine the true relationships between the variables being tested
and measured. However, due to some inherent flaws of the modality of protein metabolism
measurements and common issues that come with controlling free living humans, this study is
not without its limitations.
Although there was no clear distinction of differences in breakdown and synthesis, there is
evidence to suggest that protein synthesis is the primary driver of increases in net balance
following endurance exercise (Koopman et al., 2004; Levenhagen et al., 2001). It is not
surprising that there was a lack of detectable difference in synthesis and breakdown in our study
as it was powered for net balance, which is arguably the more important factor that suggests
protein retention for tissue development. Net balance is a function of synthesis and breakdown
rates and subtle changes in both can produce differences in net balance. It is also important to
note that whole body protein turnover is less sensitive but that changes are magnified at the
muscle level in this population (Levenhagen et al., 2002). Future studies should include more

51
participants and study kinetics at both the whole body and muscle level to further determine the
magnitude of effects that synthesis and breakdown have on net balance in this group.
The length of the training period is critical to produce detectable differences in performance as a
result of differing protein intakes. Not only did our study measure metabolism alongside effects
on performance, which is a unique feature of the study design, but the training stimulus had
reason to be long enough to elicit noticeable changes according to prior research (Rowlands et
al., 2008). This is a strength when compared to past studies which looked at nitrogen balance
alone (Phillips et al., 1993; Lamont, Patel & Kalhan, 1990; Butterfeild & Calloway, 1984; Todd,
Butterfield & Calloway, 1984; Meredith et al., 1989) and those that took performance
measurements too soon to elicit detectable results (Rowlands et al., 2007; Rowlands &
Wadsworth, 2011). However, it could also be observed as a limitation that it was not longer. An
even longer period of controlled training may have provided greater divergence between groups
giving better insight into the differences in both protein turnover and performance that could be
expected over weeks, months and years of training for this population.
It is important to note that our results and the results of past studies using this method to measure
protein turnover may not be an accurate representation of actual net balance due to potential
inaccuracies in measurement. This, as well as the fact that training was not controlled are
indicated as limitations by Meredith et al.’s (1989) determined RDA for this population. Against
this background, our use of estimation of nitrogen losses could be viewed as a limitation and
contributed to an underestimation of actual net balance (Phillips, Moore, & Tang, 2007; Phillips
& Loon, 2011; Tarnopolsky, 2004). We measured urinary output which accounts for ≥75% of

52
total losses of nitrogen (Tarnopolsky, MacDougall & Atkinson 1988) leaving ≤25% of our losses
participant to possible errors in estimation. Part of this ≤25% includes nitrogen losses in sweat,
which may represent a significant route of nitrogen loss in active populations (Calloway, Odell
& Margen, 1971). Differences in sweat rates of our participants may be seen as a limitation as
this could impact our error in nitrogen excretion estimation. For example, participants generally
trained outdoors and therefore could be under the influence of ambient temperature, which could
have induced variations in sweat, and thus nitrogen, losses. However, to account for this
possibility, participants were asked to weigh themselves before and after their training and to
indicate how much water they had to drink during to estimate sweat loss. No significant
differences were found between protein intake groups for sweat losses, suggesting that the
amount of error within groups was the same (Appendix A). Thus, while absolute net balance
may have been subject to a small systematic bias it would not invalidate our between group
differences. All of our excretion estimates were based on previously established values
determined on the population used in this study (Meredith et al., 1989). The magnitude of the
differences between groups should be looked at as a reliable indicator of actual differences due
to same assumptions made within groups. As this method of measurement has been postulated
to underestimate requirements (Pencharz, Elango & Ball, 2008; Tarnopolsky, 2004; Phillips,
Chevalier & Leidy, 2016; Lamont, 2012; Phillips, Moore, & Tang, 2007), performance along
with measured differences in net balance between groups are likely more accurate presumptions
to base the distinction of an optimal intake.
Finally, the limitation of how the participants chose to break up their runs may have influenced
their whole body net balance. Running the entire 20 km in one bout may be suggested to have

53
increased glycogen store losses over the period of the run since it has been determined that
glycogen can be depleted within 90-120 minutes of exercise when there are no carbohydrates
supplied exogenously (Coyle & Coggan, 1984). Since amino acid oxidation rates increase as
glycogen stores become depleted (Lemon & Mullin, 1980; Wagenmakers et al., 1991; Jackman
et al., 1997), this running distance could have resulted in a greater total amino acid oxidation.
This would increase protein needs following the run to replace these losses compared to multiple
shorter runs which would have given the opportunity to recover glycogen stores. A total of 9 out
of 60 (15%) of the 20km training sessions were run differently from other 20km training sessions
among the participants which could cause an increase in estimation error when comparing these
training sessions to the others. Tarnopolsky, MacDougall & Atkinson (1988) suggest that
endurance participants consuming a similar protein intake (1.7 g/kg/d) and running a similar
distance to our participants have a total N excretion of 23.46 g/d. If we use Kato et al.’s
(2016) estimated amino acid oxidation total being ~14g over a 20km run, this converts to 2.25 g
N. These studies combined suggest N excretion from a 20km run would account for
approximately 9.6% of total N excretion in a day. Therefore, nitrogen losses from a 20 km run
likely made up <10% of total losses throughout the day regardless of how the run was broken up.
Also, to reduce the risk of glycogen depletion and therefore differences in amino acid oxidation
rates, participants were fed 6-8g/kg of carbohydrate per day as part of their controlled diet. This
falls within the ACSM recommendation of 6-10 g/kg/d said to meet the needs of “high quality
and at high intensity” endurance training lasting 1-3 hours (ACSM, 2016). All participants’ 20
km runs were completed within this time frame.

54
5.4 Avenues for Future Research
With this data as a background, many more avenues for future research are presented involving
alterations to the population, training and nutrition. The following are next steps for future
research.
As past research has demonstrated metabolic differences between trained and untrained
populations, particularly in skeletal muscle (Carter et al., 2001), it would be beneficial to repeat a
similar study in an untrained population. It has been shown that when untrained individuals are
started on a new exercise regimen, especially one which is strenuous and of long duration, there
is a transient period of increased N loss (Molé & Johnson, 1971; Gontzea, Sutzesco &
Dumitrache, 1962). McKenzie et al. (2000) determined that total BCAA oxidation is higher
during and away from exercise in untrained participants, implying that more amino acids are
being used as a fuel source (Tarnopolsky, 2004). Therefore, it seems that there is a protein
sparing effect of being endurance trained both during and away from exercise. Furthermore,
studies have shown muscle hypertrophy as an initial adaptation to endurance training, including
running and cycling, in untrained individuals (Konopka & Harber, 2014). It is likely that
untrained individuals’ dietary protein needs would be greater to both provide the amino acid
building blocks to generate new tissue as well as to replace the extra losses compared to those
who are trained. This would be in order to retain both a positive net balance and performance
since performance has been shown to be reduced over multiple days when individuals are in
negative NBAL (Lunn, Nelson & Rowlands, 2008).
Many studies have determined sex differences in metabolic fuel selection during endurance

55
activity (McKenzie et al., 2000; Tarnopolsky et al., 1990; Phillips et al., 1993). Women use
proportionately more endogenous lipid and less carbohydrate and protein (Riddell et al., 2003)
during endurance exercise than do men. Taking an average of 5 studies, a review by Tanopolsky
(2004) found a mean in endurance trained women of 2.1% of their fuel sourced from amino acids
whereas 5.5% of fuel is sourced from amino acids in endurance trained men during training
sessions that averaged an intensity of 67% VO2max. With this being said, as protein breakdown
losses would be reduced, it is possible that intake requirements for women to optimize
adaptations to their training is less than that of men’s. Studies that include women and men find
a reduced NBAL in the men during periods of endurance training (Phillips et al., 1993; Lamont,
Patel & Kalhan, 1990; McKenzie et al., 2000). However, women also have the added variable of
the menstrual cycle with the phases influencing protein metabolism in different ways.
Specifically, studies have found amino acid oxidation to be greater in the luteal phase (LP)
compared with the follicular phase (FP) at rest (Kriengsinyos et al., 2004; Lariviere, Moussalli &
Garrel, 1994; Toth et al., 2006). Bailey, Zacher and Mittleman (2000) as well as Lamont, Lemon
and Bruot (1987) have reported that protein catabolism is greater in the LP due to the effects
of progesterone as it appears to increase amino acid oxidation (Kriengsinyos et al., 2004), while
estrogen, which is higher in the FP has been shown to reduce protein catabolism (Hamadeh,
Devries & Tarnopolsky, 2005). In addition to this, performance differences have been seen
depending on menstrual cycle phase (Oosthuyse & Bosch, 2010) with improved endurance time
trial performance in the FP (Oosthuyse, Bosch & Jackson, 2005; Campbell, Angus & Febbraio,
2001). Therefore, phase of menstrual cycle would need to be taken into consideration when
examining protein metabolism and performance. Differences in requirements between the
phases should be examined.

56
The effects of differing intensities, durations and nutritional strategies on protein metabolism and
requirements for optimization of adaptation should also be compared. With increasing duration,
glycogen stores would be depleted resulting in increased amino acid oxidation rates (Graham et
al., 1995; Wagenmakers, et al., 1991; Lemon & Mullin, 1980). Increasing intensity has shown to
proportionally increase amino acid oxidation (Lemon et al., 1982). Therefore, training periods
with longer durations and (or) greater intensities would likely increase protein intake
requirements to both retain a positive nitrogen balance as well as performance. Nutritionally,
“training low”, which involves training with low carbohydrate availability, is becoming
increasingly common. It is speculated to be a potential means of stimulating increased
mitochondrial protein bio-genesis to improve resistance to fatigue (ACSM, 2016; Jeukendrup,
2017). With amino acids being the required building blocks for this desired process, protein
intake requirements should also be studied in this nutritional state. Since this dietary strategy
involves periodized low glycogen availability or glycogen depletion prior to training (ACSM,
2016; Jeukendrup, 2017) it is likely that amino acid oxidation rates would be higher both during
(Wagenmakers et al., 1991; Jackman et al., 1997) and away from (Manninen, 2004) training.
With this, it would be posited that dietary protein intake requirements would be higher during
these times.
5.5 Conclusion
The hypothesis that dietary protein needs are increased by endurance exercise is supported. The
additional dietary protein is suggested to be required to replace losses as a result of increased
breakdown rates and to stimulate synthesis to repair and generate new tissue. Previously
determined intakes do not consider an optimal dosage to support what endurance exercisers are

57
seeking, which is arguably improvements in performance. Our data suggests that a protein
intake of 1.83 g/kg enhances whole body net protein balance and provides small but notable
benefits in exercise performance compared to intakes of 0.94 g/kg or 1.2 g/kg. The IAAO
method used to determine a robust breakpoint of what would be optimal to maximize rates of
whole body synthesis and, thus, adaptation to the induced demands of exercise are supported in
the performance improvements found in the group consuming the amount of protein determined
by this method.
These data suggest that endurance exercisers who consume dietary protein towards the high end
of current recommendations by the ACSM (1.2-2g/kg) would better maintain protein metabolism
and exercise performance as compared to previous endurance-trained specific recommendations
(i.e. 1.2-1.4 g/kg).

58
References
Aguirre, N., van Loon, L. J., & Baar, K. (2013). The role of amino acids in skeletal muscle
adaptation to exercise. Nestle Nutrition Institute Workshop Series, 76, 85-102.
doi:10.1159/000350261
Alexiou, D., Anagnostopoulos, A., & Papadatos, C. (1979). Total free amino acids, ammonia,
and protein in the sweat of children. The American Journal of Clinical Nutrition, 32(4), 750-
752.
American College of Sports Medicine (ACSM), American Dietetic Association, & Dietitians of
Canada. (2000). Joint position statement: Nutrition and athletic performance. american
college of sports medicine, american dietetic association, and dietitians of canada. Medicine
and Science in Sports and Exercise, 32(12), 2130-2145.
American College of Sports Medicine (ACSM), American Dietetic Association, & Dietitians of
Canada, Rodriguez, N.R., Di Marco, N.M., & Langley, S. (2009). American College of
Sports Medicine position stand. Nutrition and athletic performance. Medicine and Science in
Sports and Exercise, 41(3), 709-731. doi:10.1249/MSS.0b013e31890eb86.
American College of Sports Medicine (ACSM), American Dietetic Association, & Dietitians of
Canada, Thomas, D.T., Erdman, K.A., Burke, L.M. (2016). Position of the Academy of
Nutrition and Dietetics, Dietitians of Canada, and the American College of Sports Medicine:
Nutrition and Athletic Performance. Journal of the Academy of Nutrition and Dietetics,
116(3), 501-528. doi:10.1016/j.jand.2015.12.006.

59
American College of Sports Medicine (ACSM), Sawka, M. N., Burke, L. M., Eichner, E. R.,
Maughan, R. J., Montain, S. J., & Stachenfeld, N. S. (2007). American college of sports
medicine position stand. Exercise and fluid replacement. Medicine and Science in Sports
and Exercise, 39(2), 377-390. doi:10.1249/mss.0b013e31802ca597
Andersen, Lars L., Goran Tufekovic, Mette K. Zebis, Regina M. Crameri, George Verlaan,
Michael Kjær, Charlotte Suetta, Peter Magnusson, and Per Aagaard. (2005). The effect of
resistance training combined with timed ingestion of protein on muscle fiber size and
muscle strength." Metabolism 54, no. 2: 151-156.
Arnal, M., Obled, C., Attaix, D., Patureau-Mirand, P., & Bonin, D. (1987). Dietary control of
protein turnover. Diabetes & Metabolisme, 13(6), 630-642.
Arteaga, R., Dorado, C., Chavarren, J., & Calbet, J. A. (2000). Reliability of jumping
performance in active men and women under different stretch loading conditions. The
Journal of Sports Medicine and Physical Fitness, 40(1), 26-34
Atherton, P. J., & Smith, K. (2012). Muscle protein synthesis in response to nutrition and
exercise. The Journal of Physiology, 590(5), 1049-1057. doi:10.1113/jphysiol.2011.225003
Bailey, S. P., Zacher, C. M., & Mittleman, K. D. (2000). Effect of menstrual cycle phase on
carbohydrate supplementation during prolonged exercise to fatigue. Journal of Applied
Physiology, 88(2), 690-697.
Baj, Z., Kantorski, J., Majewska, E., Zeman, K., Pokoca, L., Fornalczyk, E., . . . Lewicki, R.
(1994). Immunological status of competitive cyclists before and after the training season.
International Journal of Sports Medicine, 15(6), 319-324. doi:10.1055/s-2007-1021067

60
Balagopal, P., Schimke, J. C., Ades, P., Adey, D., & Nair, K. S. (2001). Age effect on transcript
levels and synthesis rate of muscle MHC and response to resistance exercise. American
Journal of Physiology.Endocrinology and Metabolism, 280(2), E203-8.
Batterham, A.M., Hopkins, W.G. (2006). Making meaningful inferences about magnitudes.
International Journal of Sports Physiology and Performance, 1, 50-57.
Belcastro, A. N., Shewchuk, L. D., & Raj, D. A. (1998). Exercise-induced muscle injury: A
calpain hypothesis. Molecular and Cellular Biochemistry, 179(1-2), 135-145.
Beleen, M., Burke, L.M., Gibala, M.J. & van Loon, L.JC. (2010). Nutritional strategies to
promote postexercise recovery. International journal of sport nutrition and exercise
metabolism, 20(6), 515-532.
Berardi, J. M., Price, T. B., Noreen, E. E., & Lemon, P. W. (2006). Postexercise muscle
glycogen recovery enhanced with a carbohydrate-protein supplement. Medicine and Science
in Sports and Exercise, 38(6), 1106-1113. doi:10.1249/01.mss.0000222826.49358.f3
Biolo, G., Maggi, S. P., Williams, B. D., Tipton, K. D., & Wolfe, R. R. (1995). Increased rates of
muscle protein turnover and amino acid transport after resistance exercise in humans. The
American Journal of Physiology, 268(3 Pt 1), E514-20.
Biolo, G., Tipton, K. D., Klein, S., & Wolfe, R. R. (1997). An abundant supply of amino acids
enhances the metabolic effect of exercise on muscle protein. The American Journal of
Physiology, 273(1 Pt 1), E122-9.
Boirie, Y., Dangin, M., Gachon, P., Vasson, M. P., Maubois, J. L., & Beaufrere, B. (1997). Slow
and fast dietary proteins differently modulate postprandial protein accretion. Proceedings of
the National Academy of Sciences of the United States of America, 94(26), 14930-14935.

61
Bowtell, J. L., Leese, G. P., Smith, K., Watt, P. W., Nevill, A., Rooyackers, O., . . . Rennie, M. J.
(1998). Modulation of whole body protein metabolism, during and after exercise, by
variation of dietary protein. Journal of Applied Physiology (Bethesda, Md.: 1985), 85(5),
1744-1752.
Brosnan, J. T. (2003). Interorgan amino acid transport and its regulation. The Journal of
Nutrition, 133(6 Suppl 1), 2068S-2072S.
Burd, N. A., Tang, J. E., Moore, D. R., & Phillips, S. M. (2009). Exercise training and protein
metabolism: Influences of contraction, protein intake, and sex-based differences. Journal of
Applied Physiology (Bethesda, Md.: 1985), 106(5), 1692-1701.
doi:10.1152/japplphysiol.91351.2008
Burke, L. M., Kiens, B., & Ivy, J. L. (2004). Carbohydrates and fat for training and recovery.
Journal of Sports Sciences, 22(1), 15-30. doi:10.1080/0264041031000140527 [doi]
Butterfield, G. E., & Calloway, D. H. (1984). Physical activity improves protein utilization in
young men. British Journal of Nutrition, 51(2), 171-184.
Byrne, C., Twist, C., & Eston, R. (2004). Neuromuscular function after exercise-induced muscle
damage. Sports medicine, 34(1), 49-69.
Calloway, D. H., Odell, A. C., & Margen, S. (1971). Sweat and miscellaneous nitrogen losses in
human balance studies. The Journal of Nutrition, 101(6), 775-786.
Campbell, S. E., Angus, D. J., & Febbraio, M. A. (2001). Glucose kinetics and exercise
performance during phases of the menstrual cycle: effect of glucose ingestion. American
Journal of Physiology-Endocrinology and Metabolism, 281(4), E817-E825.

62
Carraro, F., Stuart, C. A., Hartl, W. H., Rosenblatt, J., & Wolfe, R. R. (1990). Effect of exercise
and recovery on muscle protein synthesis in human subjects. American Journal of
Physiology-Endocrinology and Metabolism, 259(4), E470-E476.
Carter, S. L., Rennie, C. D., Hamilton, S. J., & Tarnopolsky, M. A. (2001). Changes in skeletal
muscle in males and females following endurance training. Canadian journal of
physiology and pharmacology, 79(5), 386-392.
Champakam, S., Srikantia, S. G., & Gopalan, C. (1968). Kwashiorkor and mental development.
The American Journal of Clinical Nutrition, 21(8), 844-852.
Clarkson, P. M., & Hubal, M. J. (2002). Exercise-induced muscle damage in humans. American
Journal of Physical Medicine & Rehabilitation / Association of Academic Physiatrists,
81(11 Suppl), S52-69. doi:10.1097/01.PHM.0000029772.45258.43
Cohen, J. (1988). Statistical power analysis for the behavioral sciences. Hillsdale, NJ: Lawrence
Earlbaum Associates.
Cohen, J. (1994). The Earth is round (P<0.05). American Psychologist, 49, 997–1003.
Consolazio, C. F., Nelson, R. A., Matoush, L. O., Harding, R. S., & Canham, J. E. (1963).
Nitrogen excretion in sweat and its relation to nitrogen balance requirements. The Journal of
Nutrition, 79, 399-406.
Costill, D. L., Coyle, E. F., Fink, W. F., Lesmes, G. R., & Witzmann, F. A. (1979). Adaptations
in skeletal muscle following strength training. Journal of Applied Physiology, 46(1), 96-
99.
Coutts, A. J., Reaburn, P., Piva, T. J., & Rowsell, G. J. (2007). Monitoring for overreaching in
rugby league players. European Journal of Applied Physiology, 99(3), 313-324.
doi:10.1007/s00421-006-0345-z

63
Coyle, E. F., Coggan, A. R. Effectiveness of Carbohydrate Feeding in Delaying Fatigue during
Prolonged Exercise. Sports Medicine, 1(6), 446-458.
Dangin, M., Guillet, C., Garcia-Rodenas, C., Gachon, P., Bouteloup-Demange, C., Reiffers-
Magnani, K., . . . Beaufrere, B. (2003). The rate of protein digestion affects protein gain
differently during aging in humans. The Journal of Physiology, 549(Pt 2), 635-644.
doi:10.1113/jphysiol.2002.036897
Davies, K. J., Quintanilha, A. T., Brooks, G. A., & Packer, L. (1982). Free radicals and tissue
damage produced by exercise. Biochemical and Biophysical Research Communications,
107(4), 1198-1205. doi:S0006-291X(82)80124-1
Di Donato, D. M., West, D. W., Churchward-Venne, T. A., Breen, L., Baker, S. K., & Phillips,
S. M. (2014). D. Influence of aerobic exercise intensity on myofibrillar and mitochondrial
protein synthesis in young men during early and late postexercise recovery. American
Journal of Physiology, Endocrinology and Metabolism, 306(9), E1025-32.
doi:10.1152/ajpendo.00487.2013
Duggleby, S. L., & Waterlow, J. C. (2005). The end-product method of measuring whole-body
protein turnover: A review of published results and a comparison with those obtained by
leucine infusion. The British Journal of Nutrition, 94(2), 141-153. doi:S0007114505001662
Elango, R., Ball, R. O., & Pencharz, P. B. (2008). Indicator amino acid oxidation: Concept and
application. The Journal of Nutrition, 138(2), 243-246. doi:138/2/243
Elango, R., Humayun, M. A., Ball, R. O., & Pencharz, P. B. (2009). Indicator amino acid
oxidation is not affected by period of adaptation to a wide range of lysine intake in
healthy young men. The Journal of nutrition, 139(6), 1082-1087.

64
Elango, R., Ball, R. O., & Pencharz, P. B. (2012). Recent advances in determining protein and
amino acid requirements in humans. British Journal of Nutrition, 108(S2), S22-S30.
Ethridge, T., Philp, A., & Watt, P. W. (2008). A single protein meal increases recovery of muscle
function following an acute eccentric exercise bout. Applied physiology, nutrition, and
metabolism, 33(3), 483-488.
Faul, F., Erdfelder, E., Lang, A. G., & Buchner, A. (2007). G*Power 3: A flexible statistical
power analysis program for the social, behavioral, and biomedical sciences. Behavior
Research Methods, 39(2), 175-191.
Farup, J., Sørensen, H., & Kjølhede, T. (2014). Similar changes in muscle fiber phenotype with
differentiated consequences for rate of force development: Endurance versus resistance
training. Human movement science, 34, 109-119.
Ferrando, A. A., Williams, B. D., Stuart, C. A., Lane, H. W., & Wolfe, R. R. (1995). Oral
branched-chain amino acids decrease whole-body proteolysis. JPEN. Journal of Parenteral
and Enteral Nutrition, 19(1), 47-54.
Fern, E. B., Garlick, P. J., McNurlan, M. A., & Waterlow, J. C. (1981). The excretion of isotope
in urea and ammonia for estimating protein turnover in man with [15N]glycine. Clinical
Science (London, England : 1979), 61(2), 217-228.
Flynn, M. G., Pizza, F. X., Boone, J. B.,Jr, Andres, F. F., Michaud, T. A., & Rodriguez-Zayas, J.
R. (1994). Indices of training stress during competitive running and swimming seasons.
International Journal of Sports Medicine, 15(1), 21-26. doi:10.1055/s-2007-1021014 [doi]
Frontera, W. R., Meredith, C. N., O'Reilly, K. P., Knuttgen, H. G., & Evans, W. J. (1988).
Strength conditioning in older men: Skeletal muscle hypertrophy and improved function.
Journal of Applied Physiology, 64(3), 1038-1044.
65
Fry, R. W., Morton, A. R., & Keast, D. (1992). Periodisation of training stress--a review.
Canadian Journal of Sport Sciences = Journal Canadien Des Sciences Du Sport, 17(3),
234-240.
Gathercole, R., Sporer, B., & Stellingwerff, T. (2015). Countermovement jump performance
with increased training loads in elite female rugby athletes. International Journal of Sports
Medicine, 36(9), 722-728. doi:10.1055/s-0035-1547262
Gibala, M. J. (2001). Regulation of skeletal muscle amino acid metabolism during exercise.
International Journal of Sport Nutrition and Exercise Metabolism, 11(1), 87-108.
Gleeson, M. (2007). Immune function in sport and exercise. Journal of Applied Physiology
(Bethesda, Md.: 1985), 103(2), 693-699. doi:00008.2007
Gleeson, M., McDonald, W. A., Cripps, A. W., Pyne, D. B., Clancy, R. L., & Fricker, P. A.
(1995). The effect on immunity of long-term intensive training in elite swimmers. Clinical
and Experimental Immunology, 102(1), 210-216.
Graham, T. E., Turcotte, L. P., Kiens, B., & Richter, E. A. (1995). Training and muscle ammonia
and amino acid metabolism in humans during prolonged exercise. Journal of Applied
Physiology (Bethesda, Md.: 1985), 78(2), 725-735.
Green, M. S., Corona, B. T., Doyle, J. A., & Ingalls, C. P. (2008). Carbohydrate-protein drinks
do not enhance recovery from exercise-induced muscle injury. International journal of sport
nutrition and exercise metabolism, 18(1), 1-18.

66
Greenhaff, P. L., Karagounis, L. G., Peirce, N., Simpson, E. J., Hazell, M., Layfield, R., . . .
Rennie, M. J. (2008). Disassociation between the effects of amino acids and insulin on
signaling, ubiquitin ligases, and protein turnover in human muscle. American Journal of
Physiology.Endocrinology and Metabolism, 295(3), E595-604.
doi:10.1152/ajpendo.90411.2008
Gollnick, P. D., Armstrong, R. B., Saubert, C. W. T., Piehl, K., & Saltin, B. (1972). Enzyme
activity and fiber composition in skeletal muscle of untrained and trained men. Journal of
Applied Physiology, 33(3), 312-319.
Gontzea, I., Sutzesco, P., & Dumitrache, S. (1962). Influence of adaptation to effort on nitrogen
balance in man. Archives des sciences physiologiques, 16, 127-138.
Halson, S. L., Bridge, M. W., Meeusen, R., Busschaert, B., Gleeson, M., Jones, D. A.,
Jeukendrup, A. E. (2002). Time course of performance changes and fatigue markers during
intensified training in trained cyclists. Journal of Applied Physiology, 93(3), 947–956.
Hagg, S. A., Morse, E. L., & Adibi, S. A. (1982). Effect of exercise on rates of oxidation,
turnover, and plasma clearance of leucine in human subjects. The American Journal of
Physiology, 242(6), E407-10.
Hamadeh, M. J., Devries, M. C., & Tarnopolsky, M. A. (2005). Estrogen supplementation
reduces whole body leucine and carbohydrate oxidation and increases lipid oxidation in
men during endurance exercise. The Journal of Clinical Endocrinology & Metabolism,
90(6), 3592-3599.
Haralambie, G., & Berg, A. (1976). Serum urea and amino nitrogen changes with exercise
duration. European Journal of Applied Physiology and Occupational Physiology, 36(1), 39-
48.
67
Harber, M. P., Konopka, A. R., Jemiolo, B., Trappe, S. W., Trappe, T. A., & Reidy, P. T. (2010).
Muscle protein synthesis and gene expression during recovery from aerobic exercise in the
fasted and fed states. American Journal of Physiology.Regulatory, Integrative and
Comparative Physiology, 299(5), R1254-62. doi:10.1152/ajpregu.00348.2010
Harber, M. P., Gallagher, P. M., Creer, A. R., Minchev, K. M., & Trappe, S. W. (2004). Single
muscle fiber contractile properties during a competitive season in male runners. American
Journal of Physiology-Regulatory, Integrative and Comparative Physiology, 287(5),
R1124-R1131.
Hasten, D. L., Pak-Loduca, J., Obert, K. A., & Yarasheski, K. E. (2000). Resistance exercise
acutely increases MHC and mixed muscle protein synthesis rates in 78-84 and 23-32 yr
olds. American Journal of Physiology.Endocrinology and Metabolism, 278(4), E620-6.
Hawley, J. A. (2002). Adaptations of skeletal muscle to prolonged, intense endurance training.
Clinical and Experimental Pharmacology & Physiology, 29(3), 218-222.
Hawley, J. A., & Hopkins, W. G. (1995). Aerobic glycolytic and aerobic lipolytic power
systems. A new paradigm with implications for endurance and ultraendurance events. Sports
Medicine (Auckland, N.Z.), 19(4), 240-250.
Hawley, J. A., Gibala, M. J., Bermon, S., & International Association of Athletics Federations.
(2007). Innovations in athletic preparation: Role of substrate availability to modify training
adaptation and performance. Journal of Sports Sciences, 25 Suppl 1, S115-24.
doi:787621769
Hood, D. A., Irrcher, I., Ljubicic, V., & Joseph, A. M. (2006). Coordination of metabolic
plasticity in skeletal muscle. The Journal of Experimental Biology, 209(Pt 12), 2265-2275.
doi:209/12/2265

68
Hooper, S. L., MacKinnon, L. T., Gordon, R. D., & Bachmann, A. W. (1993). Hormonal
responses of elite swimmers to overtraining. Medicine and Science in Sports and Exercise,
25(6), 741-747.
Hopkins, W.G. (2004). How to Interpret Changes in an Athletic Performance Test. Sportscience
8, 1-7.
Hopkins, W.G., Marshall S.W., Batterham A.M. & Hanin, J. (2009). Progressive statistics for
studies in sports medicine and exercise science. Medicine and Science in Sports and
Exercise, 41(1),3–13.
Howarth, K. R., Moreau, N. A., Phillips, S. M., & Gibala, M. J. (2009). Coingestion of protein
with carbohydrate during recovery from endurance exercise stimulates skeletal muscle
protein synthesis in humans. Journal of Applied Physiology (Bethesda, Md.: 1985), 106(4),
1394-1402. doi:10.1152/japplphysiol.90333.2008
Howarth, K. R., Phillips, S. M., MacDonald, M. J., Richards, D., Moreau, N. A., & Gibala, M. J.
(2010). Effect of glycogen availability on human skeletal muscle protein turnover during
exercise and recovery. Journal of Applied Physiology (Bethesda, Md.: 1985), 109(2), 431-
438. doi:10.1152/japplphysiol.00108.2009
Institute of Medicine (2005). Food and Nutrition Board dietary reference intakes: energy,
carbohydrate, fiber, fat, fatty acids, cholesterol, protein and amino acids. Washington, DC:
National Academy Press
Ivy, J. L., Goforth, H. W.,Jr, Damon, B. M., McCauley, T. R., Parsons, E. C., & Price, T. B.
(2002). Early postexercise muscle glycogen recovery is enhanced with a carbohydrate-
protein supplement. Journal of Applied Physiology (Bethesda, Md.: 1985), 93(4), 1337-
1344. doi:10.1152/japplphysiol.00394.2002

69
Jackman, M. L., Gibala, M. J., Hultman, E., & Graham, T. E. (1997). Nutritional status affects
branched-chain oxoacid dehydrogenase activity during exercise in humans. The American
Journal of Physiology, 272(2 Pt 1), E233-8.
Jeukendrup, A. E. (2017). Periodized Nutrition for Athletes. Sports Medicine, 47(1), 51-63. doi:
10.1007/s40279-017-0694-2
Jeukendrup, A. E., Hesselink, M. K., Snyder, A. C., Kuipers, H., & Keizer, H. A. (1992).
Physiological changes in male competitive cyclists after two weeks of intensified training.
International Journal of Sports Medicine, 13(7), 534-541. doi:10.1055/s-2007-1021312
Kato, H., Suzuki, K., Bannai, M., & Moore, D. (2016). Protein Requirements Are Elevated in
Endurance Athletes after Exercise as Determined by the Indicator Amino Acid Oxidation
Method. PLoS One, 11(6), e0157406.
Knapik, J., Meredith, C., Jones, B., Fielding, R., Young, V., & Evans, W. (1991). Leucine
metabolism during fasting and exercise. Journal of Applied Physiology (Bethesda, Md.:
1985), 70(1), 43-47.
Koopman, R., Pannemans, D. L., Jeukendrup, A. E., Gijsen, A. P., Senden, J. M., Halliday, D.,
Saris, W.H., van Loon, L.J. & Wagenmakers, A. J. (2004). Combined ingestion of protein
and carbohydrate improves protein balance during ultra-endurance exercise. American
Journal of Physiology-Endocrinology and Metabolism, 287(4), E712-E720.
Konopka, A. R. & Harber, M. P. (2014). Skeletal muscle hypertrophy after aerobic exercise
training. Exercise and sports sciences reviews, 42(2), 53-61. doi:
10.1249/JES.0000000000000007

70
Kriengsinyos, W., Wykes, L. J., Goonewardene, L. A., Ball, R. O., & Pencharz, P. B. (2004).
Phase of menstrual cycle affects lysine requirement in healthy women. American Journal
of Physiology-Endocrinology and Metabolism, 287(3), E489-E496.
Lamont, L. S. (2012). A critical review of recommendations to increase dietary protein
requirements in the habitually active. Nutrition research reviews, 25(1), 142-149
Lamont, L.S., Lemon, P.W., & Bruot, B.C. (1987). Menstrual cycle and exercise effects on
protein catabolism. Medicine and Science in Sports and Exercise, 19(2), 106-110
Lamont. L. S., Patel, D. G., Kalhan S.C. (1990). Leucine kinetics in endurance-trained humans.
Journal of Applied Physiology, 69(1):1-6.
Lamont, L. S., McCullough, A. J., & Kalhan, S. C. (1995). Beta-adrenergic blockade heightens
the exercise-induced increase in leucine oxidation. The American Journal of Physiology,
268(5 Pt 1), E910-16.
Lamont, L. S., McCullough, A. J., & Kalhan, S. C. (1999). Comparison of leucine kinetics in
endurance-trained and sedentary humans. Journal of Applied Physiology (Bethesda, Md.:
1985), 86(1), 320-325.
Lamont, L. S., McCullough, A. J., & Kalhan, S. C. (2001). Relationship between leucine
oxidation and oxygen consumption during steady-state exercise. Medicine and Science in
Sports and Exercise, 33, 237-241.
Lariviere, F., Moussalli, R., & Garrel, D. R. (1994). Increased leucine flux and leucine oxidation
during the luteal phase of the menstrual cycle in women. American Journal of
Physiology-Endocrinology And Metabolism, 267(3), E422-E428.

71
Laursen, P. B., Francis, G. T., Abbiss, C. R., Newton, M. J., & Nosaka, K. (2007). Reliability of
time-to-exhaustion versus time-trial running tests in runners. Medicine and science in
sports and exercise, 39(8), 1374-1379.
Lecker, S. H., Solomon, V., Mitch, W. E., & Goldberg, A. L. (1999). Muscle protein breakdown
and the critical role of the ubiquitin-proteasome pathway in normal and disease states. The
Journal of Nutrition, 129(1S Suppl), 227S-237S.
Lehmann, M., Wieland, H., & Gastmann, U. (1997). Influence of an unaccustomed increase in
training volume vs intensity on performance, hematological and blood-chemical parameters
in distance runners. The Journal of Sports Medicine and Physical Fitness, 37(2), 110-116.
Lemon, P. W., & Mullin, J. P. (1980). Effect of initial muscle glycogen levels on protein
catabolism during exercise. Journal of Applied Physiology: Respiratory, Environmental and
Exercise Physiology, 48(4), 624-629.
Lemon, P. W., Nagle, F. J., Mullin, J. P., & Benevenga, N. J. (1982). In vivo leucine oxidation at
rest and during two intensities of exercise. Journal of Applied Physiology, 53(4), 947-
954.
Levenhagen, D. K., Gresham, J. D., Carlson, M. G., Maron, D. J., Borel, M. J., & Flakoll, P. J.
(2002). Postexercise protein intake enhances whole-body and leg protein accretion in
humans. Medicine and science in sports and exercise, 34(5), 828-837.
Levenhagen, D. K., Gresham, J. D., Carlson, M. G., Maron, D. J., Borel, M. J., & Flakoll, P. J.
(2001). Postexercise nutrient intake timing in humans is critical to recovery of leg
glucose and protein homeostasis. American Journal of Physiology-Endocrinology And
Metabolism, 280(6), E982-E993.

72
Lunn, W. R., Pasiakos, S. M., Colletto, M. R., Karfonta, K. E., Carbone, J. W., Anderson, J. M.,
& Rodriguez, N. R. (2012). Chocolate milk and endurance exercise recovery: protein
balance, glycogen, and performance. Medicine & Science in Sports & Exercise, 44(4),
682-691.
Manninen, A. M. (2004). Metabolic effects of the very-low-carbohydrate diets: misunderstood
"villains" of human metabolism. Journal of the International Society of Sports Nutrition,
1(2), 7-11.
Mascher, H., Ekblom, B., Rooyackers, O., & Blomstrand, E. (2011). Enhanced rates of muscle
protein synthesis and elevated mTOR signalling following endurance exercise in human
subjects. Acta Physiologica (Oxford, England), 202(2), 175-184. doi:10.1111/j.1748-
1716.2011.02274.x
Matthews, D. E., Schwarz, H. P., Yang, R. D., Motil, K. J., Young, V. R., & Bier, D. M. (1982).
Relationship of plasma leucine and alpha-ketoisocaproate during a L-[1-13C]leucine
infusion in man: A method for measuring human intracellular leucine tracer enrichment.
Metabolism: Clinical and Experimental, 31(11), 1105-1112. doi:0026-0495(82)90160-3
McKenzie, S., Phillips, S. M., Carter, S. L., Lowther, S., Gibala, M. J., & Tarnopolsky, M. A.
(2000). Endurance exercise training attenuates leucine oxidation and BCOAD activation
during exercise in humans. American Journal of Physiology-Endocrinology and
Metabolism, 278(4), E580-E587

73
Meeusen, R., Duclos, M., Foster, C., Fry, A., Gleeson, M., Nieman, D., . . . American College of
Sports Medicine. (2013). Prevention, diagnosis, and treatment of the overtraining syndrome:
Joint consensus statement of the european college of sport science and the american college
of sports medicine. Medicine and Science in Sports and Exercise, 45(1), 186-205.
doi:10.1249/MSS.0b013e318279a10a
Meredith, C. N., Zackin, M. J., Frontera, W. R., & Evans, W. J. (1989). Dietary protein
requirements and body protein metabolism in endurance-trained men. Journal of Applied
Physiology (Bethesda, Md.: 1985), 66(6), 2850-2856.
Mero, A., Jaakkola, L., & Komi, P. V. (1991). Relationships between muscle fibre characteristics
and physical performance capacity in trained athletic boys. Journal of sports sciences,
9(2), 161-171.
Millard-Stafford, M., Warren, G. L., Thomas, L. M., Doyle, J. A., Snow, T., & Hitchcock, K.
(2005). Recovery from run training: Efficacy of a carbohydrate-protein beverage?
International Journal of Sport Nutrition and Exercise Metabolism, 15(6), 610-624.
Miller, B.F., Olesen, J.L., Hansen, M., Døssing, S., Crameri, R.M., Welling, R.J., Langberg, H.,
Flyvbjerg, A., Kjaer, M., Babraj, J.A. and Smith, K., (2005). Coordinated collagen and
muscle protein synthesis in human patella tendon and quadriceps muscle after exercise.
The Journal of physiology, 567(3), .1021-1033.
Millward, D. J. (1998). Metabolic demands for amino acids and the human dietary requirement:
Millward and rRvers (1988) revisited. The Journal of Nutrition, 128(12 Suppl), 2563S-
2576S.

74
Millward, D. J., Davies, C. T., Halliday, D., Wolman, S. L., Matthews, D., & Rennie, M. (1982).
Effect of exercise on protein metabolism in humans as explored with stable isotopes.
Federation Proceedings, 41(10), 2686-2691
Mole, P. A., & Johnson, R. E. (1971). Disclosure by dietary modification of an exercise-induced
protein catabolism in man. Journal of applied physiology, 31(2), 185-190.
Moore, D. R., Camera, D. M., Areta, J. L., & Hawley, J. A. (2014). Beyond muscle hypertrophy:
Why dietary protein is important for endurance athletes. Applied Physiology, Nutrition, and
Metabolism = Physiologie Appliquee, Nutrition Et Metabolisme, 39(9), 987-997.
doi:10.1139/apnm-2013-0591
Morgan, W. P., Brown, D. R., Raglin, J. S., O'Connor, P. J., & Ellickson, K. A. (1987).
Psychological monitoring of overtraining and staleness. British Journal of Sports Medicine,
21(3), 107-114.
Health Canada (2006). Dietary reference intakes: The essential guide to nutrient requirements.
National Academy of Sciences. Retrieved from
https://fnic.nal.usda.gov/sites/fnic.nal.usda.gov/files/uploads/DRIEssentialGuideNutReq.pdf
Nelson, A.R., Phillips, S.M., Stellingwerff, T., Rezzi, S., Bruce, S.J., Breton, I., Thorimbert, A.,
Guy, P.A., Clarke, J., Broadbent, S. and Rowlands, D.S. (2012). A protein–leucine
supplement increases branched-chain amino acid and nitrogen turnover but not
performance. Medicine & Science in Sports & Exercise, 44(1), pp.57-68.
Nieman, D. C. (2000). Is infection risk linked to exercise workload? Medicine and Science in
Sports and Exercise, 32(7 Suppl), S406-11.

75
Niles ES, Lachowetz T, Garfi J, Sullivan W, Smith JC, Leyh BP, Headley SA. 2001.
Carbohydrate-protein drink improves time to exhaustion after recovery from endurance
exercise. Journal of Exercise Physiology, 4(1): 45-52
Oosthuyse, T., & Bosch, A. N. (2010). The effect of the menstrual cycle on exercise metabolism.
Sports Medicine, 40(3), 207-227.
Oosthuyse, T., Bosch, A. N., & Jackson, S. (2005). Cycling time trial performance during
different phases of the menstrual cycle. European Journal of Applied Physiology, 94(3),
268-276.
Pacy, P. J., Price, G. M., Halliday, D., Quevedo, M. R., & Millward, D. J. (1994). Nitrogen
homeostasis in man: The diurnal responses of protein synthesis and degradation and
amino acid oxidation to diets with increasing protein intakes. Clinical Science (London,
England : 1979), 86(1), 103-116.
Parry-Billings, M., Budgett, R., Koutedakis, Y., Blomstrand, E., Brooks, S., Williams, C., . . .
Newsholme, E. A. (1992). Plasma amino acid concentrations in the overtraining syndrome:
Possible effects on the immune system. Medicine and Science in Sports and Exercise,
24(12), 1353-1358.
Pasiakos, S. M., Lieberman, H. R., & McLellan, T. M. (2014). Effects of protein supplements on
muscle damage, soreness and recovery of muscle function and physical performance: a
systematic review. Sports Medicine, 44(5), 655-670.
Pencharz, P. B., & Ball, R. O. (2003). Different approaches to define individual amino acid
requirements. Annual Review of Nutrition, 23(1), 101-116.
Pencharz, P.B., Elango, R., & Ball, R. O. (2008). An Approach to Defining the Upper Safe
Limits of Amino Acid Intake. The Journal of Nutrition, 138(10), 19965-20025.

76
Place, N., Maffiuletti, N. A., Martin, A., & Lepers, R. (2007). Assessment of the reliability of
central and peripheral fatigue after sustained maximal voluntary contraction of the
quadriceps muscle. Muscle and Nerve, 35(4), 486-495. doi:10.1002/mus.20714
doi:10.1146/annurev.nutr.23.011702.073247
Phillips, S. M. (2006). Dietary protein for athletes: From requirements to metabolic advantage.
Applied Physiology, Nutrition, and Metabolism = Physiologie Appliquee, Nutrition Et
Metabolisme, 31(6), 647-654. doi:h06-035
Phillips, S. M. (2014). A brief review of critical processes in exercise-induced muscular
hypertrophy. Sports Medicine (Auckland, N.Z.), 44 Suppl 1, S71-7. doi:10.1007/s40279-
014-0152-3
Phillips, S. M., Atkinson, S. A., Tarnopolsky, M. A., & MacDougall, J. D. (1993). Gender
differences in leucine kinetics and nitrogen balance in endurance athletes. Journal of
Applied Physiology (Bethesda, Md.: 1985), 75(5), 2134-2141.
Phillips, S. M., Moore, D. R., & Tang, J. E. (2007). A critical examination of dietary protein
requirements, benefits, and excesses in athletes. International Journal of Sport Nutrition and
Exercise Metabolism, 17 Suppl, S58-76.
Phillips, S. M., Tipton, K. D., Aarsland, A., Wolf, S. E., & Wolfe, R. R. (1997). Mixed muscle
protein synthesis and breakdown after resistance exercise in humans. The American Journal
of Physiology, 273(1 Pt 1), E99-107.
Phillips, S. M. (2004). Protein requirements and supplementation in strength sports. Nutrition,
20(7), 689-695.
Phillips, S. M., & van Loon, L. J. (2011). Dietary protein for athletes: from requirements to
optimum adaptation. Journal of sports sciences, 29(sup1), S29-S38.

77
Phillips, S. M., Chevalier, S., & Leidy, H. J. (2016). Protein “requirements” beyond the RDA:
implications for optimizing health. Applied Physiology, Nutrition, and Metabolism, 41(5),
565-572.
Rand, W. M., Pellett, P. L., & Young, V. R. (2003). Meta-analysis of nitrogen balance studies for
estimating protein requirements in healthy adults. The American Journal of Clinical
Nutrition, 77(1), 109-127.
Rasmussen, B.B., Phillips, S.M. (2003). Contractile and Nutritional Regulation of Human
Muscle Growth. Exercise and Sports Medicine Reviews, 31(3), 127-131.
Rasmussen, B. B., Wolfe, R. R., & Volpi, E. (2002). Oral and intravenously administered amino
acids produce similar effects on muscle protein synthesis in the elderly. The Journal of
Nutrition, Health and Aging, 6(6), 358-362.
Rennie, M. J., Edwards, R. H., Krywawych, S., Davies, C. T., Halliday, D., Waterlow, J. C., &
Millward, D. J. (1981). Effect of exercise on protein turnover in man. Clinical Science
(London, England: 1979), 61(5), 627-639.
Rennie, M. J., & Tipton, K. D. (2000). Protein and amino acid metabolism during and after
exercise and the effects of nutrition. Annual Review of Nutrition, 20, 457-483.
doi:10.1146/annurev.nutr.20.1.457
Rennie, M. J., Wackerhage, H., Spangenburg, E. E., & Booth, F. W. (2004). Control of the size
of the human muscle mass. Annual Review of Physiology, 66, 799-828.
Riddell, M. C., Partington, S. L., Stupka, N., Armstrong, D., Rennie, C., & Tarnopolsky, M. A.
(2003). Substrate utilization during exercise performed with and without glucose
ingestion in female and male endurance-trained athletes. International Journal of Sport
Nutrition and Exercise Metabolism, 13(4), 407-421.

78
Robson-Ansley, P. J., Blannin, A., & Gleeson, M. (2007). Elevated plasma interleukin-6 levels
in trained male triathletes following an acute period of intense interval training. European
Journal of Applied Physiology, 99(4), 353-360. doi:10.1007/s00421-006-0354-y [doi]
Rowlands, D. S., & Wadsworth, D. P. (2011). Effect of high-protein feeding on performance and
nitrogen balance in female cyclists. Medicine and Science in Sports and Exercise, 43(1), 44-
53. doi:10.1249/MSS.0b013e3181e93316
Rowlands, D. S., Rossler, K., Thorp, R. M., Graham, D. F., Timmons, B. W., Stannard, S. R., &
Tarnopolsky, M. A. (2008). Effect of dietary protein content during recovery from high-
intensity cycling on subsequent performance and markers of stress, inflammation, and
muscle damage in well-trained men. Applied Physiology, Nutrition, and Metabolism =
Physiologie Appliquee, Nutrition Et Metabolisme, 33(1), 39-51. doi:10.1139/H07-136 [doi]
Rowlands, D. S., Thorp, R. M., Rossler, K., Graham, D. F., & Rockell, M. J. (2007). Effect of
protein-rich feeding on recovery after intense exercise. International Journal of Sport
Nutrition and Exercise Metabolism, 17(6), 521-543.
Russell, R. D., Redmann, S. M., Ravussin, E., Hunter, G. R., & Larson-Meyer, D. E. (2004).
Reproducibility of endurance performance on a treadmill using a preloaded time trial.
Medicine and Science in Sports and Exercise, 36(4), 717-724. doi:00005768-200404000-
00021
Saunders, M. J., Kane, M. D., & Todd, M. K. (2004). Effects of a carbohydrate-protein beverage
on cycling endurance and muscle damage. Medicine and Science in Sports and Exercise,
36(7), 1233-1238. doi:00005768-200407000-00022
Sawilowsky, S. S. (2009). New effect size rules of thumb. Journal of Modern Applied Statistical
Methods, 8(2), 597 – 599.

79
Schmidt, F.L. & Hunter, J.E. (1997). Eight common but false objections to the discontinuation of
significance testing in the analysis of research data. In: Harlow L, Mulaik S, Steiger J,
editors. What If There Were No Significance Tests? Florence (KY): Routledge, 37–64.
Schricker, T., Kugler, B., Trager, K., Anhaupl, T., Vogt, J., & Georgieff, M. (1993). Effects of
xylitol on carbohydrate and protein metabolism after trauma and during sepsis. Nutricion
Hospitalaria, 8(8), 471-478.
Schutz, Y. (2011). Protein turnover, ureagenesis and gluconeogenesis. International Journal for
Vitamin and Nutrition Research.Internationale Zeitschrift Fur Vitamin- Und
Ernahrungsforschung.Journal International De Vitaminologie Et De Nutrition, 81(2-3),
101-107. doi:10.1024/0300-9831/a000064
Sedano, S., Marín, P. J., Cuadrado, G., & Redondo, J. C. (2013). Concurrent training in elite
male runners: the influence of strength versus muscular endurance training on
performance outcomes. The Journal of Strength & Conditioning Research, 27(9), 2433-
2443.
Sheffield-Moore, M., Yeckel, C.W., Volpi, E., Wolf, S.E., Morio, B., Chinkes, D.L., Paddon-
Jones, D. and Wolfe, R.R., 2004. Postexercise protein metabolism in older and younger
men following moderate-intensity aerobic exercise. American Journal of Physiology-
Endocrinology and Metabolism, 287(3), pp.E513-E522.
Shepherd, R.J. (2015). Qualified Fitness and Exercise as Professionals and Exercise Prescription:
Evolution of the PAR-Q and Canadian Aerobic Fitness Test. Journal of physical activity
and health, 12(4), 454-461.

80
Shimomura, Y., & Harris, R. A. (2006). Metabolism and physiological function of branched-
chain amino acids: Discussion of session 1. The Journal of Nutrition, 136(1 Suppl),
232S-3S. doi:136/1/232S
Shvartz, E., & Reibold, R. C. (1990). Aerobic fitness norms for males and females aged 6 to 75
years: A review. Aviation, Space, and Environmental Medicine, 61(1), 3-11.
Stevens, C. J., Hacene, J., Sculley, D. V., Taylor, L., Callister, R., & Dascombe, B. (2015). The
reliability of running performance in a 5 km time trial on a non-motorized treadmill.
International Journal of Sports Medicine, 36(09), 705-709.
Støren, Ø., Helgerud, J. A. N., Støa, E. M., & Hoff, J. A. N. (2008). Maximal strength training
improves running economy in distance runners. Medicine and Science in Sports and
Exercise, 40(6), 1087-1092.
Smith, K., & Rennie, M. J. (1996). The measurement of tissue protein turnover. Bailliere's
Clinical Endocrinology and Metabolism, 10(4), 469-495.
Tang, J.E., Moore, D.R., Kujbida, G.W., Tarnopolsky, M.A. & Phillips, S.M. (2009). Ingestion
of whey hydrolysate, casein, or soy protein isolate: effects on mixed muscle protein
synthesis at rest and following resistance exercise in young men. Journal of applied
physiology, 107(3), 987-992. doi:10.1152/japplphysiol.00076.2009.
Tarnopolsky, M. (2004). Protein requirements for endurance athletes. Nutrition (Burbank, Los
Angeles County, Calif.), 20(7-8), 662-668. doi:10.1016/j.nut.2004.04.008
Tarnopolsky, M. A., Atkinson, S. A., Phillips, S. M., & MacDougall, J. D. (1995). Carbohydrate
loading and metabolism during exercise in men and women. Journal of Applied Physiology
(Bethesda, Md.: 1985), 78(4), 1360-1368.

81
Tarnopolsky, M. A., MacDougall, J. D., & Atkinson, S. A. (1988). Influence of protein intake
and training status on nitrogen balance and lean body mass. Journal of Applied Physiology
(Bethesda, Md.: 1985), 64(1), 187-193.
Tarnopolsky, L. J., MacDougall, J. D., Atkinson, S. A., Tarnopolsky, M. A., & Sutton, J. R.
(1990). Gender differences in substrate for endurance exercise. Journal of Applied
Physiology, 68(1), 302-308.
Tessari, P., Kiwanuka, E., Zanetti, M., & Barazzoni, R. (2003). Postprandial body protein
synthesis and amino acid catabolism measured with leucine and phenylalanine-tyrosine
tracers. American Journal of Physiology, Endocrinology and Metabolism, 284(5), E1037-
42. doi:10.1152/ajpendo.00416.2002
Thompson, G. N., Pacy, P. J., Merritt, H., Ford, G. C., Read, M. A., Cheng, K. N., & Halliday,
D. (1989). Rapid measurement of whole body and forearm protein turnover using a
[2H5]phenylalanine model. The American Journal of Physiology, 256(5 Pt 1), E631-9.
Tipton, K. D., Ferrando, A. A., Phillips, S. M., Doyle, D.,Jr, & Wolfe, R. R. (1999). Postexercise
net protein synthesis in human muscle from orally administered amino acids. The American
Journal of Physiology, 276(4 Pt 1), E628-34.
Tipton, K. D., Gurkin, B. E., Matin, S., & Wolfe, R. R. (1999). Nonessential amino acids are not
necessary to stimulate net muscle protein synthesis in healthy volunteers. The Journal of
nutritional biochemistry, 10(2), 89-95.
Todd K.S., Butterfield G.E., Calloway D.H. (1984). Nitrogen balance in men with adequate and
deficient energy intake at three levels of work. Journal of Nutrition, 114(11):2107-18.

82
Toth, M. J., Sites, C. K., Matthews, D. E., & Casson, P. R. (2006). Ovarian suppression with
gonadotropin-releasing hormone agonist reduces whole body protein turnover in women.
American Journal of Physiology-Endocrinology and Metabolism, 291(3), E483-E490.
Trappe, S., Harber, M., Creer, A., Gallagher, P., Slivka, D., Minchev, K., & Whitsett, D. (2006).
Single muscle fiber adaptations with marathon training. Journal of Applied Physiology,
101(3), 721-727.
Van Hall, G., Saltin, B., & Wagenmakers, A. J. (1999). Muscle protein degradation and amino
acid metabolism during prolonged knee-extensor exercise in humans. Clinical Science
(London, England: 1979), 97(5), 557-567.
van Loon, L. J., Saris, W. H., Kruijshoop, M., & Wagenmakers, A. J. (2000). Maximizing
postexercise muscle glycogen synthesis: Carbohydrate supplementation and the application
of amino acid or protein hydrolysate mixtures. The American Journal of Clinical Nutrition,
72(1), 106-111.
Vikmoen, O., Raastad, T., Seynnes, O., Bergstrøm, K., Ellefsen, S., & Rønnestad, B. R. (2016).
Effects of heavy strength training on running performance and determinants of running
performance in female endurance athletes. PloS one, 11(3), e0150799.
Volpi, E., Kobayashi, H., Sheffield-Moore, M., Mittendorfer, B., & Wolfe, R. R. (2003).
Essential amino acids are primarily responsible for the amino acid stimulation of muscle
protein anabolism in healthy elderly adults. The American Journal of Clinical Nutrition,
78(2), 250-258.
Wagenmakers, A. J. (1998). Muscle amino acid metabolism at rest and during exercise: Role in
human physiology and metabolism. Exercise and Sport Sciences Reviews, 26, 287-314.

83
Wagenmakers, A. J. (1999). Tracers to investigate protein and amino acid metabolism in human
subjects. The Proceedings of the Nutrition Society, 58(4), 987-1000.
Wagenmakers, A. J., Beckers, E. J., Brouns, F., Kuipers, H., Soeters, P. B., van der Vusse, G. J.,
& Saris, W. H. (1991). Carbohydrate supplementation, glycogen depletion, and amino acid
metabolism during exercise. The American Journal of Physiology, 260(6 Pt 1), E883-90.
Waterlow, J. C. (1995). Whole-body protein turnover in humans--past, present, and future.
Annual Review of Nutrition, 15, 57-92. doi:10.1146/annurev.nu.15.070195.000421 [doi]
Waterlow, J. C., Garlick, P. J., Millward, D. J. (1978). Protein turnover in mammalian tissues
and in the whole body. Elsevier, North-Holland: Biomedical Press.
WEIR, J. B. (1949). New methods for calculating metabolic rate with special reference to protein
metabolism. The Journal of Physiology, 109(1-2), 1-9.
West, D. W., Abou Sawan, S., Mazzulla, M., Williamson, E., & Moore, D. R. (2017). Whey
Protein Supplementation Enhances Whole Body Protein Metabolism and Performance
Recovery after Resistance Exercise: A Double-Blind Crossover Study. Nutrients, 9(7),
735.
Wilkinson, S. B., Phillips, S. M., Atherton, P. J., Patel, R., Yarasheski, K. E., Tarnopolsky, M.
A., & Rennie, M. J. (2008). Differential effects of resistance and endurance exercise in the
fed state on signalling molecule phosphorylation and protein synthesis in human muscle.
The Journal of Physiology, 586(15), 3701-3717. doi:10.1113/jphysiol.2008.153916 [doi]
Witard, O. C., Jackman, S. R., Breen, L., Smith, K., Selby, A., & Tipton, K. D. (2014).
Myofibrillar muscle protein synthesis rates subsequent to a meal in response to increasing
doses of whey protein at rest and after resistance exercise. The American Journal of Clinical
Nutrition, 99(1), 86-95. doi:10.3945/ajcn.112.055517

84
Witard, O. C., Turner, J. E., Jackman, S. R., Tipton, K. D., Jeukendrup, A. E., Kies, A. K., &
Bosch, J. A. (2012). High-intensity training reduces CD8+ T-cell redistribution in response
to exercise. Medicine and Science in Sports and Exercise, 44(9), 1689-1697.
doi:10.1249/MSS.0b013e318257d2db
Wolfe, R. R., Goodenough, R. D., Wolfe, M. H., Royle, G. T., & Nadel, E. R. (1982). Isotopic
analysis of leucine and urea metabolism in exercising humans. Journal of Applied
Physiology: Respiratory, Environmental and Exercise Physiology, 52(2), 458-466.
World Health Organisation Ad Hoc Expert Committee. (1985). Energy and protein requirements.
In World Health Organization Technical Report Series (No.724).
Yang, Y., Creer, A., Jemiolo, B., & Trappe, S. (2005). Time course of myogenic and metabolic
gene expression in response to acute exercise in human skeletal muscle. Journal of Applied
Physiology (Bethesda, Md.: 1985), 98(5), 1745-1752. doi:01185.2004
Young, V. R., Bier, D. M., & Pellett, P. L. (1989). A theoretical basis for increasing current
estimates of the amino acid requirements in adult man, with experimental support. The
American Journal of Clinical Nutrition, 50(1), 80-92.
Young V.R., Gucalp C., Rand W.M., Matthews D.E., & Bier D.M. (1987). Leucine kinetics
during three weeks at submaintenace-to-maintenance intakes of leucine in men: adapation
and accommodation. Human Nutrition, Clinical Nutrition, 41(1):1-18.
Zamora, A. J., Tessier, F., Marconnet, P., Margaritis, I., & Marini, J. F. (1995). Mitochondria
changes in human muscle after prolonged exercise, endurance training and selenium
supplementation. European Journal of Applied Physiology and Occupational Physiology,
71(6), 505-511.

85
Zawadzki, K. M., Yaspelkis, B. B.,3rd, & Ivy, J. L. (1992). Carbohydrate-protein complex
increases the rate of muscle glycogen storage after exercise. Journal of Applied Physiology
(Bethesda, Md.: 1985), 72(5), 1854-1859.
Zello, G. A., Wykes, L. J., Ball, R. O., & Pencharz, P. B. (1995). Recent advances in methods of
assessing dietary amino acid requirements for adult humans. The Journal of Nutrition,
125(12), 2907-2915.

86
Appendices

Appendix
A. STATISTICAL RESULTS AND RAW DATA

Performance Mean Differences, Standard Differences and Effect
Sizes
MVC
-1 -0.8 -0.6 -0.4 -0.2 0 0.2 0.4 0.6
Low
Mod
High
Mean Difference Pre-Post (N/kg)
0 0.2 0.4 0.6 0.8 1 1.2 1.4
M - L
H - M
H - L
STD Diff
-1 -0.5 0 0.5 1 1.5
M-L
H-M
H-L
ES

5kmTT
-0.15 -0.10 -0.05 0.00 0.05 0.10 0.15 0.20
Low
Mod
High
Mean Difference Pre-Post (min)
-0.3 -0.25 -0.2 -0.15 -0.1 -0.05 0 0.05
M - L
H - M
H - L
STD Diff (min)
-1 -0.5 0 0.5 1
M-L
H-M
H-L
ES

Jump
Impulse Peak Force
-0.30 -0.25 -0.20 -0.15 -0.10 -0.05 0.00
Low
Mod
High
Mean Difference Pre-Post (kg.m/s)
-0.50 -0.40 -0.30 -0.20 -0.10 0.00
Low
Mod
High
Mean Difference Pre-Post (N/kg)
-0.3 -0.2 -0.1 0 0.1 0.2
M - L
H - M
H - L
STD Diff
-0.3 -0.2 -0.1 0 0.1 0.2
M - L
H - M
H - L
STD Diff (N/kg)
-0.6 -0.4 -0.2 0 0.2 0.4 0.6
M-L
H-M
H-L
ES
-0.4 -0.2 0 0.2 0.4 0.6
M-L
H-M
H-L
ES

Participants’ 20km Run Splits
Participant Intake Day 7 Day 10
Session
Distance
1
Distance
2
Distance
3
# of
Runs
Distance
1
Distance
2
Distance
3
# of
Runs
01 Low 3 20.11 1 20.01 1
Mod 4 20.02 1 20 1
High 5 20.02 1 20.02 1
02 L 4 16.01 4.02 2 12.51 7.51 2
M 5 20.02 1 14.31 5.71 2
H 3 15.03 5.02 2 18.02 2.02 2
03 L 4 20 1 20 1
M 5 20 1 20 1
H 3 5.01 15.01 2 20.01 1
05 L 4 20.03 1 15.29 4.88 2
M 3 11.79 10.07 2 14.49 6.7 2
H 5 20.03 1 20.04 1
06 L 4 10.52 9.5 2 20.01 1
M 3 15.44 4.87 2 13.93 6 2
H 5 6.84 8.19 5.01 3 20 1
08 L 3 20.18 1 18.93 1
M 4 19.02 1 11.93 7.72 2
H 5 20 1 20 1
10 L 5 20.01 1 20.02 1
M 3 20.01 1 20.01 1
H 4 20.06 1 20 1
12 L 3 20.49 1 20.02 1
M 5 20.01 1 20.01 1
H 4 20.02 1 20.03 1
13 L 5 20.05 1 20 1
M 4 19.98 1 20 1
H 3 20.08 1 18.5 1
14 L 4 20.02 1 20.19 1
M 3 20.12 1 20.63 1
H 5 22.44 1 20.12 1
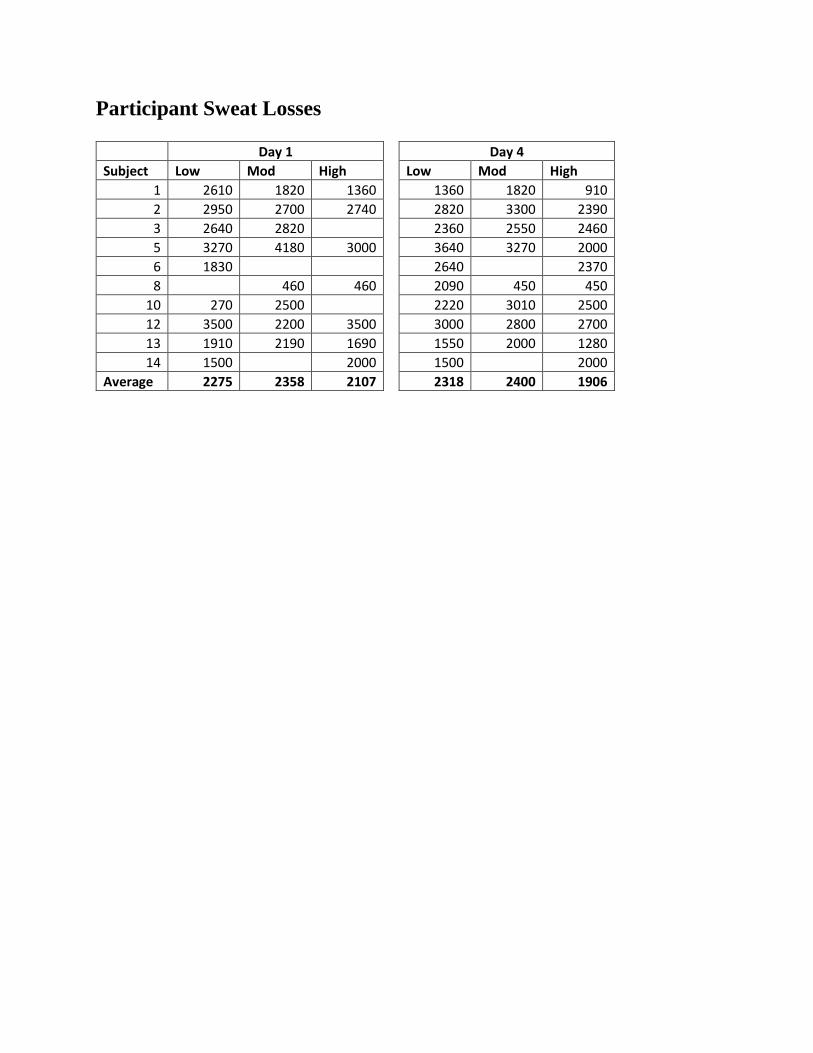
Participant Sweat Losses
Day 1 Day 4
Subject Low Mod High Low Mod High
1 2610 1820 1360 1360 1820 910
2 2950 2700 2740 2820 3300 2390
3 2640 2820 2360 2550 2460
5 3270 4180 3000 3640 3270 2000
6 1830 2640 2370
8 460 460 2090 450 450
10 270 2500 2220 3010 2500
12 3500 2200 3500 3000 2800 2700
13 1910 2190 1690 1550 2000 1280
14 1500 2000 1500 2000
Average 2275 2358 2107 2318 2400 1906

Appendix
B. CONSENT AND ASSENT FORMS

Consent Form
Title of Research Project: • Impact of the protein intake on the amino acid and protein metabolism in the endurance-trained adults during intensified training period Investigators
Daniel Moore Professor, Faculty of Kinesiology and Physical Education, University of Toronto 416-946-4088; [email protected] Hiroyuki KATO, Faculty of Kinesiology and Physical Education, University of Toronto & Institute for Innovation, Ajinomoto Co., Inc. 416-946-5620; [email protected] Eric Williamson, Faculty of Kinesiology and Physical Education, University of Toronto 416-946-5620; [email protected] Purpose of the Research:
Protein is an essential nutrient that we need to eat enough of in our diet to maintain important bodily functions and to recover from exercise. In a recent study, we determined how much protein is needed in healthy, endurance-trained adults after a single 20 km run, which appears to be slightly more than what is currently recommended to be consumed (i.e. the recommended daily allowance or “RDA”) according to world nutrition consensus statements. However, it still remains to be determined what impact consuming the RDA for protein compared to our new estimated minimum intake has on the athletic performance and protein metabolism over repeated days of exercise. A better understanding of the specific importance for protein in male adult endurance athletes is needed to ensure that they are meeting the body’s protein needs, including that for optimal recovery from exercise. Description of the Research:
If you decide to enter this study, we will assess your physical performance and mood state before and after 4 days of high volume training while consuming three levels of dietary protein to determine the influence of the habitual protein intake on athletic performance. Protein metabolism will be assessed through the 4 days training period. This study will involve a total of 5 separate sessions including today’s information session (Session 1: Information; Session 2: Fitness Assessment and Familiarization; Sessions 3, 4 and 5: Intervention; see Figure.1 and below for details). All the sessions will be separate but will be completed over a period spanning approximately 2 to 6 months.

Session 1; Introduction
In the event that you agree to participate in the study, the remainder of this session will serve to assess your habitual physical activity levels and general health through the completion of two questionnaires. Following the completion of the questionnaires, we will provide you with an accelerometer (a device used to measure normal activity patterns and energy expenditure), dietary log and instructions of dietary log to record 3 days of your habitual food intake. For the 3 days prior to returning to the Iovate/Muscletech Exercise Metabolism and Sports Science Lab (IM lab) at the Goldring Centre for High Performance Sport (GC) at the University of Toronto for Session 2, you will be required to wear the accelerometer as well as record your normal food intake. Session 2; Fitness assessment and familiarization
You will return to the IM Lab in the morning after at least 7h of an overnight fast (i.e. no food or drink intake, with the exception of water). First, you will be required to breathe into a mouthpiece or mask for 30 minutes, which will allow us to assess how much oxygen you use during rest as an estimate of your body’s normal (resting) energy expenditure. After completion of the resting energy expenditure assessment, you will consume a carbohydrate energy drink prior to undergoing body composition testing to assess the amount of fat and fat-free mass you have using non-invasive method of the Bod Pod, which is commonly used for individuals of all ages and sizes. The Bod Pod will involve you having

to provide your body weight on a standard scale prior to entering an air tight, pressure controlled pod-like device (with a small window) that is slightly larger than your body. This “pod” will tell us how much volume your body has, which will allow us to determine your body density to approximate your fat mass and fat-free mass (i.e. total amount of muscle, bone, organs, etc.). The time spent in the “pod” will only be a few minutes and will require you to wear a tight-fitting bathing suit and swimmer’s cap. This method is completely safe but may make you anxious if you are uncomfortable with small spaces.
Upon completion of the body composition measures, and following a warm-up, you will
engage in a 12-minute treadmill-based fitness assessment. You will be required to wear a heart rate monitor on your chest and breathe into a mouthpiece or mask, which will allow us to assess how much oxygen you use during a treadmill exercise test as an estimate of your fitness level. Although the mask or mouthpiece may be uncomfortable, it will not cause any pain. This treadmill test will require you to begin running on a treadmill at a comfortable pace after which the work rate will increase at a constant rate; this will be done by maintaining the treadmill speed but increasing the treadmill inclination (i.e. you will feel like you are starting to run uphill). The test will finish when you reach a point in which you can no longer continue (volitional fatigue), which should occur within approximately 12-minutes.
Once the treadmill-based fitness assessment has been completed, you will be given an
opportunity to rest prior to performing a 5-Km Time trial (5kmTT) to familiarize yourself with this test. This exercise bout will involve running at a race pace for 5 km. You will be required to run 5 km as fast as you can. You can adjust your running speed during the time trial. During this test you will not be given any feedback on your performance other than your distance traveled. This test will simulate your performance in a standard 5-km road race, for example.
After completion of the 5kmTT, you will be given an opportunity to rest prior to
performing the other exercise test that will be conducted twice on the subsequent trials. These exercise tests will measure your muscle strength (maximum voluntary contraction; MVC), vertical jump, and muscle soreness. The maximal strength test will require you to sit on a chair-like apparatus with your leg secured to an immovable arm in a bent 90° position by straps on your thigh and lower leg. You will then be asked to perform a maximal voluntary contraction (MVC) in which you attempt to straighten your leg against the lower pad of the machine for ~5 seconds. The machine will limit the movement of your leg but will be able to measure how much force your leg can produce (i.e. measure your MVC). You will be asked to perform 3 MVC tests separated by ~1 min of rest each. This test will be performed on days 2 and day 9 of sessions 3 and 4 (see below for details). We will also test your peak power be determining how high you can jump (vertical jump) while standing on a force platform in the lab. For this test you will jump 3 separate times separated by ~60s rest on days 2 and day 9 of sessions 3 and 4. As new or unaccustomed exercise can be associated with some mild muscle stiffness or soreness, your subjective ratings of muscle soreness (quadriceps and

gastrocnemius/soleus) will be collected using a validated visual analogue scale. Muscle soreness will be rated with a visual analog scale that incorporated a 100-mm line, with 0 indicating no pain and 100 representing extremely painful. You will be asked to mark their perceived soreness on the 100-mm line when the knee joint was forced to be flexed and extended by an investigator and when an investigator palpates your calf muscle and thigh muscle. Finally, you will be required to run 10 km on a treadmill at self-selected pace for familiarization with 20 km run. You will engage in a total of approx. 20 km on session 2. Session 3, 4, 5; Training session See details in Table.1.
Day 1, 2; Monitoring days You will record a dietary log for 2 days. Training will not be controlled or restricted for these two days. Day 3; Rest day and basal protein metabolism (one randomly selected session) On day 3, you will be required to refrain from any exercise during the day with the exception of normal daily activities (e.g. commuting, shopping and normal daily living). In
Table 1. Contents of Session 3, 4, 5
Day 1 2 3 4 5 6 7 8 9 10 11
Lab visit ■ ■
POMS * ■ ■
DALDA # ■ ■ ■ ■ ■ ■ ■ ■ ■ ■ ■
Test Drink ■ ■ ■ ■
Diet Fast
Accelerometer ■ ■ ■ ■ ■ ■ ■ ■ ■ ■ ■
Exercise Rest 20K 5K 10K 20K
Performance
test■ ■
24h urine
collection(■) ■ ■ ■ ■
15N glycine (■) ■ ■
Blood (■) ■
(■): Single ramdomly selected session of three sessions
*: POMS: Profile of Mood Status
#: DALDA: Daily Analysis of Life Demand of Athlete
HAB INT
Voluntary Rest
Dietary recordControlled
DietControlled diet

addition, you will be required to keep a dietary log. On day 3 of one of the sessions, we will measure how your body breaks down and rebuilds proteins in your body throughout your usual daily life. To do this, you will be required to provide a spot urine in the morning. After this you will consume a drink containing 2 mg/kg of [15N]glycine* dissolved in water before breakfast. To fully understand how much protein the body is making, we will have to collect all of the urine you produce during the day. Therefore, we will give you two special containers: one to collect urine that you produce during the day up to and including just before you go to bed and the other to collect what you produce during the night including the first urination on the following day. You will store the urine at 4 °C and will either drop it off at the lab or we will pick it up at your home the following day. *: [15N]glycine is an amino acid (building block of protein) that is slightly heavier than most of the naturally occurring [14N]glycine in the body: this is called a stable isotope. Your body contains [15N]glycine naturally, just at a very low level. By providing this stable isotope, we will be able to measure how the glycine is being used in the body. [15N]glycine is safe and non-radioactive and will allow us to measure how much protein your body is making.
Day 4; Blood sampling (one of the sessions) & Pre-Performance test You will report to the GC in the morning after an overnight fast (i.e. having refrained from breakfast). Of one of the sessions (randomly selected), your blood (~10 ml) will be drawn. A small needle will be inserted into a forearm vein by a trained phlebotomist and a single blood sample (~10 ml) will be taken into a special, evacuated tube. The discomfort of this procedure is transient and is very similar to having an injection by a needle or when donating blood. The phlebotomist will make every effort to minimize the discomfort and take the sample as quickly as possible. Topical anesthetics will be applied to the phlebotomy sites to minimize needle injection pain if desired. Upon removal of the needle any discomfort should subside. In this experiment the blood taken is ~ 10 ml, which is approximately ~2% of the blood removed during a donation to a blood bank. It is not enough to affect physical performance or health in any way and your body will naturally replace this blood loss over the following days. After each blood sample has been taken, pressure will be placed on the site in order to minimize bleeding and facilitate healing. This type of blood sampling is a common medical practice and involves few risks if proper precautions are taken. The needles are single-use and sterile and the site of the sample collection will be thoroughly cleaned and sterilized prior to the sample being taken; however, there is a theoretical risk of infection. There is a chance of internal bleeding if adequate pressure is not maintained upon removal of the needle. This may cause some minor discomfort and could result in bruising/skin discoloration which could last up to a few weeks. In very rare occasions, trauma to the vessel wall could result in the formation of a small blood clot, which could travel through the bloodstream and become lodged in a smaller vessel. However, we have never experienced such a complication after several thousand blood draws. After completion of blood sampling, your body composition will be measured using the Bodpod. After this you will consume a protein-free breakfast that will contain carbohydrate that will provide a standardized amount of energy for the following performance tests. After taking the breakfast, you will be required to fill out a questionnaire that will assess
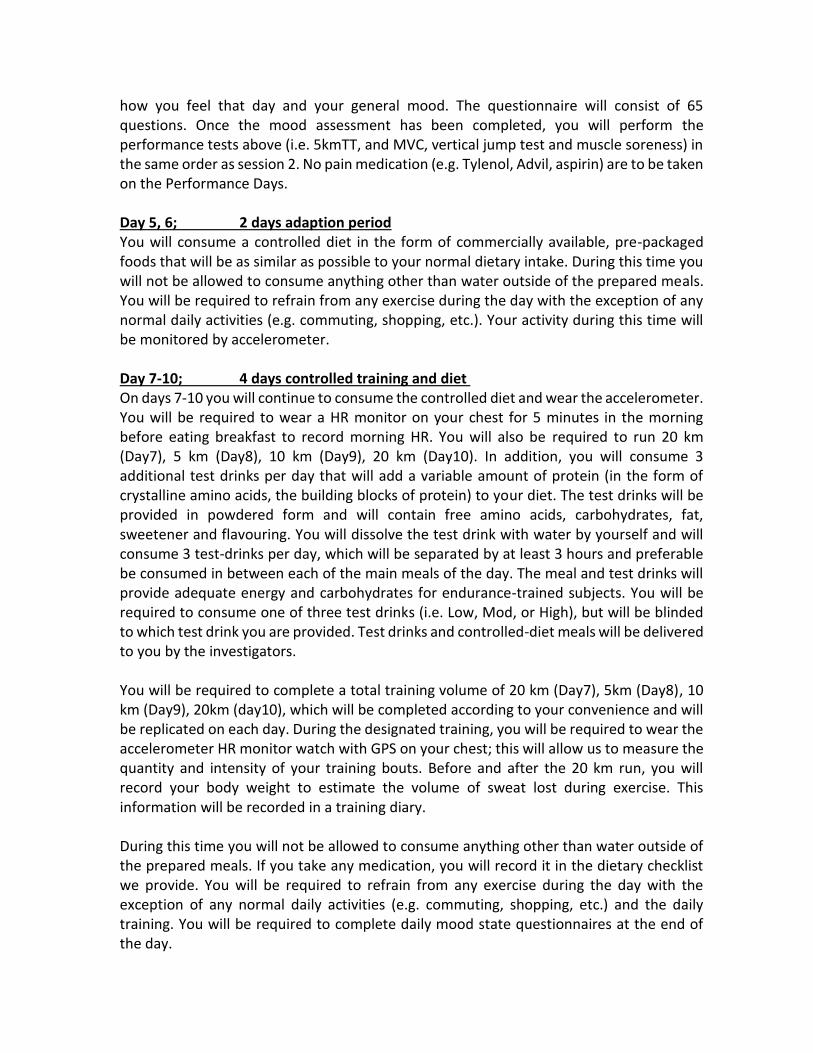
how you feel that day and your general mood. The questionnaire will consist of 65 questions. Once the mood assessment has been completed, you will perform the performance tests above (i.e. 5kmTT, and MVC, vertical jump test and muscle soreness) in the same order as session 2. No pain medication (e.g. Tylenol, Advil, aspirin) are to be taken on the Performance Days. Day 5, 6; 2 days adaption period You will consume a controlled diet in the form of commercially available, pre-packaged foods that will be as similar as possible to your normal dietary intake. During this time you will not be allowed to consume anything other than water outside of the prepared meals. You will be required to refrain from any exercise during the day with the exception of any normal daily activities (e.g. commuting, shopping, etc.). Your activity during this time will be monitored by accelerometer. Day 7-10; 4 days controlled training and diet On days 7-10 you will continue to consume the controlled diet and wear the accelerometer. You will be required to wear a HR monitor on your chest for 5 minutes in the morning before eating breakfast to record morning HR. You will also be required to run 20 km (Day7), 5 km (Day8), 10 km (Day9), 20 km (Day10). In addition, you will consume 3 additional test drinks per day that will add a variable amount of protein (in the form of crystalline amino acids, the building blocks of protein) to your diet. The test drinks will be provided in powdered form and will contain free amino acids, carbohydrates, fat, sweetener and flavouring. You will dissolve the test drink with water by yourself and will consume 3 test-drinks per day, which will be separated by at least 3 hours and preferable be consumed in between each of the main meals of the day. The meal and test drinks will provide adequate energy and carbohydrates for endurance-trained subjects. You will be required to consume one of three test drinks (i.e. Low, Mod, or High), but will be blinded to which test drink you are provided. Test drinks and controlled-diet meals will be delivered to you by the investigators. You will be required to complete a total training volume of 20 km (Day7), 5km (Day8), 10 km (Day9), 20km (day10), which will be completed according to your convenience and will be replicated on each day. During the designated training, you will be required to wear the accelerometer HR monitor watch with GPS on your chest; this will allow us to measure the quantity and intensity of your training bouts. Before and after the 20 km run, you will record your body weight to estimate the volume of sweat lost during exercise. This information will be recorded in a training diary. During this time you will not be allowed to consume anything other than water outside of the prepared meals. If you take any medication, you will record it in the dietary checklist we provide. You will be required to refrain from any exercise during the day with the exception of any normal daily activities (e.g. commuting, shopping, etc.) and the daily training. You will be required to complete daily mood state questionnaires at the end of the day.

Day 7-10; Protein metabolism (24h urine collection) On the first and last day of training we will measure how your body breaks down and rebuilds protein in your body, which are normal processes that may be increased by exercise and can be influenced by your dietary intake. To do this, you will be required to provide a spot urine on the mornings of days 7 and 10. After this you will consume a drink containing 2 mg/kg of [15N]glycine dissolved in water before breakfast. To fully understand how much protein the body is making, we will have to collect all of the urine you produce during the day. Therefore, we will give you two special containers: one to collect urine that you produce during the day up to and including just before you go to bed and the other to collect what you produce during the night including the first urination on the following day. On the second and third day of training, we will measure your protein balance (protein synthesis – protein breakdown). To this end, you will be required to collect all the urine you produced into a single container. You will store the urine at 4 °C and will either drop it off at the lab or we will pick it up at your home the following day. Day 11 Blood sampling & post Performance test The procedure will be the same as Day4 of session3. You will report to the GC in the morning after an overnight fast (i.e. having refrained from breakfast). After completion of blood sampling, you will consume a protein-free breakfast, have your body composition measured, fill out the questionnaire and then perform the physical performance tests (MVC, vertical jump test, muscle soreness and 5 km TT) with the accelerometer and the HR monitor in the GC. Any concomitant medications are not allowed. These 3 sessions will be separated by a minimum of 7 days. Throughout session 3, 4, 5, you will be required to wear an accelerometer for the entire day to estimate your usual daily energy expenditure. This small device will be worn on your waist and will measure your activity levels. Mood state questionnaires will also be required to be completed at the end of each day. Potential Harms: • The VO2Max test will finish when you reach a point in which you can no longer continue
(volitional fatigue). Therefore, there is a risk of falling, although handrails are provided on the treadmill and you will be monitored closely by an investigator during the whole test.
• There is a risk that the training for 4 consecutive days (which may be an increase from your habitual training) may lead to an increased risk of infection (e.g. developing a common cold) and/or an overuse injury (e.g. Plantar fasciitis, Shin splints, Achilles tendonitis, Iliotibial band (ITB) friction syndrome, and Runner’s knee, etc.). To minimize these risks, you should ensure that you get enough rest when not performing the prescribed training, get enough sleep (at least 7 hours), and that you consume the entire diet provided to you in the study.

• There is a theoretical risk that the blood sampling procedure may lead to infection: however, this will be minimized by cleansing the area to be sampled and using sterile equipment.
• There is a small risk that the blood sampling may lead to local discolouration and bruising at the site of the needle; this risk will be minimized by applying pressure after the procedure.
• There is a theoretical risk that a small clot might form within your blood vessel after the procedure, which in the worst case scenario could lead to a complication like a stroke; however this has never happened in our experience.
• As you will run 20 km, 5 km, 10 km, 20 km run for 4 consecutive days (which may be an increase from your habitual training) you may experience increased feelings of tiredness from usual and your mood state may change (e.g. you may feel increased tension, depression, anger, fatigue, and confusion). Thus, there is a theoretical risk that academic/work performance could be mildly affected by the study. To help reduce this risk you should ensure you get proper rest (e.g. at least 7 hours of sleep) when you are not exercising. In addition, we can arrange the date of each session according to your preferred schedule (e.g. participants would have the opportunity to avoid busy times at work or school, such as exams).However, any changes to your mood state are likely to be related to how tired you feel and therefore once you complete the intensified training you should return to your pre-study state.
• As you may perform 4 days of training that have a greater volume than what you do normally, your muscles may become mildly sore and this may persist for up to 7 days after you complete the exercise. However, this is a normal part of how your body responds to changes in training (you may have already experienced this in your normal training) and therefore this soreness is only temporary. If it persists for greater than 7 days you should report this immediately to a study investigator.
• While this study does not cause harm we recognize that the length of the trial day, the number of days required to complete the study, and travel to the University of Toronto (a total of 8 visits are necessary, including this introduction session) might pose an inconvenience to you.
If you are uncomfortable with small spaces then you may experience some anxiety during the short time when you are in the Bodpod.
The test drink that you will consume during the consecutive 4 days will have a distinct taste that some people find unpleasant. Additional flavouring will be provided to help improve the taste. In addition, a small protein-free cookie will be provided to consume after the drink, which will remove most, if not all, of any potential unpleasant after taste of the test drink.
The discomfort of blood sampling is transient and is very similar to having an injection by a needle, or when donating blood. Upon removal of the needle any discomfort should subside. However, topical anesthetics could be applied to phlebotomy sites to minimize needle injection pain, if you want.
Potential Benefits: • You will be given personal testing results (i.e. VO2Max, Body composition, resting

energy expenditure and results of performance tests) • Your participation will contribute to the scientific understanding of protein requirements for endurance-trained young adults, which is essential for optimal health. Confidentiality: • We will respect your privacy. No information with which you can be identified will be given to anyone or be published without your permission, unless required by law. For example, the law could require us to provide your information if you have been abused, if you have an illness that could spread to others, if you or someone else talks about suicide (killing themselves), or if court orders us to give them the study papers.
The data produced from this study will be stored in a secure, locked location. Only members of the research team will have access to the data. This could include external research team members. Following completion of the research study the data will be kept five years following the study completion then destroyed as required by University of Toronto policy. Published study results will not reveal your identity.
Reimbursement: • The proposed compensation is meant to adequately reimburse you for any costs incurred (e.g. parking and a small post-study meal) and to provide a token gift of appreciation for your effort. A total of $1150 will be provided as a compensation, after the completion of all sessions.
Should you choose to withdraw from the study for personal reasons, your reimbursement will be pro-rated at the following rate: session 2: $50; 1 training session (contains additional blood withdrawal and additional measurement of 24h protein metabolism): $400; 2 training sessions4, 5: $350 each for a total of $1150 (note: each of session 3, 4 and 5 will be further prorated based on percentage of trial commenced). Participation: • It is your choice to take part in this study. You can stop at any time. You will be compensated for all trials that you partake in. • Participation in this study without meeting the minimum fitness level can put you at an increased risk for physical injuries. Therefore, you will be required to meet minimum standards on the fitness and performance tests as well as during the familiarization session. • Any data collected and analyzed up to your decision to stop will remain in the study database. • New information that we get while we are doing this study may affect your decision to take part in this study. If this happens, we will tell you about this new information. And we will ask you again if you still want to be in the study.

Conflict of Interest: • This study is sponsored by Ajinomoto co., Inc. which produces crystalline amino acids used in this study. The sponsor can access the data which is coded with a study identification number and does not contain the participants’ personal information. The results might be utilized for the company’s business. • Hiroyuki KATO is an employee of Ajinomoto co., Inc.
Declaration of Helsinki • This study will be conducted in accordance with the Declaration of Helsinki.

Consent: By signing this form, I agree that: 1) You have explained this study to me. You have answered all my questions. 2) You have explained the possible harms and benefits (if any) of this study. 3) I understand that I have the right to refuse to participate in the study. I also understand
that have the right to withdraw from the study at any time without penalty and that any data analyzed during my participation will remain in the study database.
4) I am free now, and in the future, to ask questions about the study. 5) I understand that no personal information about myself will be given to anyone or be published without first asking my permission. 6) I have also been provided the study timeline and been given demonstrations of all the measures to be used. 7) I agree, or consent, that I ___________________ may take part in this study. _________________________________ __________________________ Printed Name of participant Participant’s signature & date _________ ___________________________ Printed Name of person who explained consent Signature of Person who explained consent & date
If you have any questions about this study, please call Dr. Daniel Moore at 416-946-4088 or by email at [email protected]
If you have questions about your rights as a subject in a study or if you experience injuries related with this study protocol, please contact either of the investigators or the ethics review board at [email protected] or 416 946 3273. The research study you are participating in may be reviewed for quality assurance to make sure that the required laws and guidelines are followed. If chosen, (a) representative(s) of the Human Research Ethics Program (HREP) may access study-related data and/or consent materials as part of the review. All information accessed by the HREP will be upheld to the same level of confidentiality that has been stated by the research team.

Appendix
C. ELICITATION TOOLS

Habitual Food Intake Record INSTRUCTIONS FOR KEEPING YOUR THREE DAY FOOD RECORD
1. Record EVERYTHING that you eat and drink for the 72h before your trial.
2. Record EXACT AMOUNTS when possible. Record WEIGHT of each food item if available (e.g. meat weight; 6 oz of grilled salmon, etc.). Household measuring cups or spoons can also be used to estimate portions (e.g. ½ cup of plain oatmeal, dry; 1 cup cooked pasta, etc)..
3. Record BRAND NAMES, if known (e.g. Nature Value Harvest Bar, Oats ‘N Honey).
4. If eating out, record foods eaten as accurately as possible, including the NAME OF The ESTABLISHMENT and the SPECIFIC FOOD ITEM ORDERED.
5. Always specify METHOD OF PREPARATION. Examples include: baked, broiled, fried, breaded, sautéed, etc.
6. Describe all foods as fully as possible. For example: 3 oz. baked chicken thigh, no skin.
7. List ALL INGREDIENTS for sandwiches, casseroles, and other mixed dishes. Example: Peanut butter sandwich – 2 pieces whole wheat bread, 1 ½ Tbsp. creamy peanut butter.
8. For accuracy, it is best to record each meal or snack immediately after it is eaten. Be sure to include drinks (water, coffee, tea, soda, etc.)
9. Include all ADDITIONS to food at the table, such as salt, sugar, or milk. Record each addition on a separate line.
10. Record the time of day in which each item of food was eaten.
Example: Time
Food Be specific, include brand names
Preparation
How did you cook it
What did you add to it
Quantity
(ml, g, cup, tsp, tbsp)
Quantity Left Over (ml, g, cup, tsp, tbsp)
6:15 pm Skinless chicken breast Baked 200 g 0
Diana’s BBQ sauce n/a 3 tbsp 0
Broccoli Steamed ½ cup 0
Brown rice Boiled ½ cup 0
Water n/a 2 cups 0

Day of Week (circle): Mon Tue Wed Thu Fri Sat Sun Time
Food Be specific, include brand names
Preparation
How did you cook it
What did you add to it
Quantity
(ml, g, cup, tsp, tbsp)
Quantity Left Over (ml, g, cup, tsp, tbsp)
For Office Use Only
Initials Entered ____
Initials Proof ____

Day of Week (circle): Mon Tue Wed Thu Fri Sat Sun Time
Food Be specific, include brand names
Preparation
How did you cook it
What did you add to it
Quantity
(ml, g, cup, tsp, tbsp)
Quantity Left Over (ml, g, cup, tsp, tbsp)
For Office Use Only
Initials Entered ____

PAR-Q


Study Training Record
Training Schedule
Day 7 Date: _____________
Morning heart rate (5 mins) HR bpm Time (HH:MM) : ~ : Exercise (a total of 20 km)
PRE Body weight
(kg or lbs)
Start time (HH:MM)
End time (HH:MM)
POST Body weight
(kg or lbs)
Drink volume
(ml)
Mileage (km)
1st run
: :
2nd run (if any)
: :
3rd run (if any)
: :
Urine collection
Bottle Time Instruction
Base :
Morning pee before intake Glycine
FED : All urine must be collected into “FED” bottle. Keep the bottle cool. :
:
:
:
: Last pee before going to bed.
DALDA Check

Day 8 Date: _____________
Morning heart rate (5 mins) HR bpm Time (HH:MM) : ~ : Exercise (a total of 5 km)
PRE Body weight
(kg or lbs)
Start time (HH:MM)
End time (HH:MM)
POST Body weight
(kg or lbs)
Drink volume
(ml)
Mileage (km)
1st run
: :
2nd run (if any)
: :
Urine collection
Bottle Time Instruction
FAST :
Morning pee
Day8 : All urine up to tomorrow morning must be collected into “Day8” bottle. Keep the bottle cool. :
:
:
:
: Last pee before going to bed.
DALDA Check

Day 9 Date: _____________
Morning heart rate (5 mins) HR bpm Time (HH:MM) : ~ : Exercise (a total of 10 km)
PRE Body weight
(kg or lbs)
Start time (HH:MM)
End time (HH:MM)
POST Body weight
(kg or lbs)
Drink volume
(ml)
Mileage (km)
1st run
: :
2nd run (if any)
: :
3rd run (if any)
: :
Urine collection
Bottle Time Instruction
Day 8 :
Morning pee
Day9 : All urine up to tomorrow morning must be collected into “Day 9” bottle. Keep the bottle cool.
:
:
:
:
: Last pee before going to bed.
DALDA Check

Day 10 Date: _____________
Morning heart rate (5 mins) HR bpm Time (HH:MM) : ~ : Exercise (a total of 20 km)
PRE Body weight
(kg or lbs)
Start time (HH:MM)
End time (HH:MM)
POST Body weight
(kg or lbs)
Drink volume
(ml)
Mileage (km)
1st run
: :
2nd run (if any)
: :
3rd run (if any)
: :
Urine collection
Bottle Time Instruction
Base :
Morning pee before intake Glycine
FED : All urine must be collected into “FED” bottle. Keep the bottle cool. :
:
:
:
: Last pee before going to bed.
DALDA Check

Day 11 Date: _____________
Morning heart rate (5 mins) HR bpm Time (HH:MM) : ~ : Urine collection
Bottle Time Instruction
FAST :
Morning pee

Urine Collection Instructions
Urine collection Procedure (Day7, Day11)
- BASE On the day of the collection, collect the first morning urine void into “PRE”
bottle.
- DAY All the urination before going to bed, should be collected and pooled. The urine sample will be collected into the 1 L container and transferred
the “DAY” 3 L jug. The 3 L jug will be kept in the refrigerator until the investigators collects it.
- NIGHT Anytime the participant needs to urinate while at home (up until 07.00h,
or before the first meal of the day the following morning), the urine sample will be collected into the 1 L container and transferred the 3 L jug.

Habitual Training Questionnaire
Preliminary assessment
Date:___________________________ subject ID:___________________________
Birthday (dd/mo/yr): ___/____/______ Age (yr):___________
Height (cm or inch):______________ Weight (kg or lbs):___________
Training log of previous month
Weekly training volume (time (h) or running distance (km))
Last week ________________________
Last 2nd week ________________________
Last 3rd week ________________________
Last 4th week ________________________
Maximum mileage per week (in the last 6 months) _______________km / wk
Recent records (on the previous 1 year)
(example;
Date: 2014/11/26 Distance: 10 km Time: 0:38:00)
Date: Distance: km time: -
Date: Distance: km time: -
Date: Distance: km time: -
Others
Regular Tabaco use : Yes / No
Anabolic drugs (e.g. growth hormone, testosterone, etc.) use : Yes / No