impact of secondary schools on the second wave
TRANSCRIPT

Impact of secondary schools on the second waveInitial findings & sources of uncertainty
DataScienceLaboratory

DataScienceLaboratory
What’s in this pack?
The DfE Data Science Lab were commissioned by the ONS-led working group on Covid in schools to investigate whether we can learn anything from the half term natural experiment about the impact of the schools system on the spread of the virus
After analysing the problem from a variety of angles, using a range of different data sources, and consulting with epidemiologists from SPI-M, we concluded that:
The data are consistent with their being an effect of schools on increasing the spread of the virus amongst children
But we cannot tell how large this effect is
Nor can we tell what the impact of it is (if any) on the wider community
This is due to the combination of:
The short period of time covered by half term
The high degree of uncertainty inherent in most available data sources
Confounding factors occurring at the same time (e.g. wider interventions, behavioural impacts, etc)
This pack sets out what analyses we have investigated, and explains why the degree of uncertainty is so high.
2

Why have we done this analysis?
3

DataScienceLaboratory
Our aim was to investigate one piece of the puzzle, to
contribute to answering the school attendance policy question
4
Should we encourage attendance at
education settings?i.e. Full attendance vs rotas & closures etc
Benefits Costs
Existing research
(e.g. DfE Central Economics Team, academia, the DfE
Learning Loss project)
PHE/Cambridge
modelling unit
Warwick
UniversityONS
Russell Viner
& colleaguesDfE Daslab
There are several
groups doing
analysis related to
this question – we
are one of those
groups
DfE’s Covid
Science Team and
Covid Response
Unit will lead on
bringing all of this
together to
provide holistic
advice

How have we done it?
5

DataScienceLaboratory
Our investigation covered three main areas
6
Trends in test result & ONS infection study data
Analysing trends in the various data sources before, during and
after half term, to estimate how much slower the virus spread
amongst young people while schools were closed
Contact tracing
Deep dive into contact tracing data, to explore how likely secondary
school pupils are to report close contact with other age groups, and
a demonstration of the limitations of this data
Wider impact
Investigation of the feasibility of using these datasets in
combination with published estimates for (e.g.)
hospitalisation rates to quantify wider impacts on hospital
admissions and deaths

Part 1: Half term trendsInvestigation of what the Covid test data and ONS Infection Study can tell us about transmission amongst children during half term
7

DataScienceLaboratory
Methodology notes
These notes explain which data we used and how we used it.
1. We use non deduplicated SGSS data for this analysis (which is one row per Covid test).
2. We calculate a 7 day rolling average of cases to smooth out the within-week variation.
3. We have not factored in local level lockdown tiers which were implemented around half term and could have had an impact on behaviour and infections.
4. The graphs in this pack were created by using all of the data. In other words, we have not filtered out lateral flow tests or filtered to just symptomatic tests.
5. We did re run the analysis filtering to just include symptomatic cases. We saw the same patterns, which (combined with the timings of half term) tells us mass testing isn’t responsible for the trends we see. We have not included this additional analysis in this pack.
6. As we are using non deduplicated SGSS data, patients can appear in the data multiple times, and can count towards multiple positive and negative results.
7. This positivity rate methodology differs from the one used in the weekly Test and Trace publication because PHE don’t use the 7 day rolling average, and they use a new de-duplication methodology.
8. This new methodology for creating de-duplicated test data had not been finalised at the time this analysis was conducted. For simplicity, we therefore used the non-deduplicated data as we wanted a picture of historic positivity rates that would not change when people got retested in the future. We would not expect it to substantially impact the headline message presented in this paper
8

DataScienceLaboratory
What would we expect to see if half term had an effect?
If schools being closed for half term had an effect on the positivity rate, you would expect to see:
Increasing positivity rate until half term
Due to the 5-7 day lag (infection to developing symptoms to getting tests) you would expect it to keep increasing through half term
After half term, you would expect the effect to start showing, and you would see a drop in positivity rate
Then, following schools being back for a week or two, you would expect the rate to start climbing again
9
Time
Po
siti
vit
y r
ate
Half term

DataScienceLaboratory
Positivity plots around half term
10Note that this high-level picture could obscure local-level variation: specific Local Authorities could have substantially different trends to the average for their group overall
Percentage of tests that are positive, by age groupRed line = Leicester and Leicestershire, where half term was a week earlier
Blue line = 137 other LA’s, where half term was a week later This trend in positivity is
exactly what we see for both sets of LAs in secondary-aged children – and we see it at different times depending on when half term was.
This kind of consistent pattern wasn’t observed for adult age groups. It’s therefore more likely to be to do with schools closing rather than other interventions
Positivity in all age groups has decreased since the national lockdown was introduced
Date is on the x axis; the y axis shows test positivity standardised
so that the maximum point for each line on each mini-chart
equals 1. This is to make it easier to compare the trend in each
line – it doesn’t tell you anything about the absolute values.
The black line shows when the
national lockdown was
implemented

DataScienceLaboratory
However, what happens when we look at number of
tests taken?
The number of tests being taken decreased over the half term period.
This behaviour change is to be expected. It is less important to test mild symptoms in children when they’re not going into school and interacting with others.
However, it means that our trend on the previous page could be mostly driven by this behaviour change: if people with milder symptoms are less likely to get tested then positivity will increase.
11
This would lead to artificially inflated positivity during half term, followed by a drop the following week, which is what we see.
In fact, the steepness of the increase duringhalf term tells us that testing behaviour change is very likely having an effect.
Number of tests taken, by age groupRed line = Leicester and Leicestershire, where half term was a week earlier
Blue line = 137 other LA’s, where half term was a week later
The black line shows when
the national lockdown was
implemented Positivity taken from previous slide
Sta
nd
ard
ised
num
ber
of
test
s ta
ken

DataScienceLaboratory
Does this trend occur at UTLA level?
12
Proportion of LAs where test positivity is
increasing vs decreasingHalf term week outlined in black.
The national lockdown happened the week after.
Test positivity was rising amongst 11-16 year olds in almost all LAs before half term – but then started falling almost everywhere immediately after the break. After schools had been open for one week, the proportion with rising trends increased again.
However, we don’t know what can be attributed to schools being closed, and what is just due to changes in testing behaviour: more LA’s have downwards trends after half term, but they may simply be returning to normal levels after an artificially inflated peak

DataScienceLaboratory
The ONS Infection Study appears to show a dip during
and after half term
13
Half term for most schools
DataScienceLaboratory
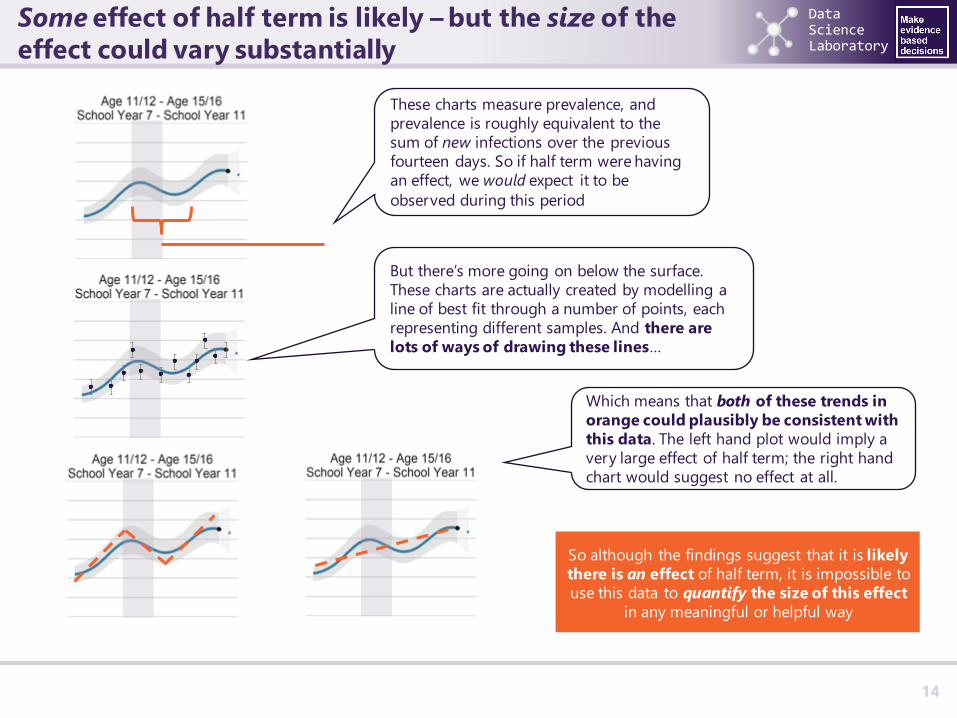
Some effect of half term is likely – but the size of the
effect could vary substantially
14
These charts measure prevalence, and
prevalence is roughly equivalent to the
sum of new infections over the previous
fourteen days. So if half term were having
an effect, we would expect it to be
observed during this period
But there’s more going on below the surface.
These charts are actually created by modelling a
line of best fit through a number of points, each
representing different samples. And there are
lots of ways of drawing these lines…
Which means that both of these trends in
orange could plausibly be consistent with
this data. The left hand plot would imply a
very large effect of half term; the right hand
chart would suggest no effect at all.
So although the findings suggest that it is likely
there is an effect of half term, it is impossible to
use this data to quantify the size of this effect
in any meaningful or helpful way

DataScienceLaboratory
Part 1 summary and conclusion
Summary
We see similar patterns in the positivity and prevalence data that we would expect to see if schools being closed decreased infection amongst Secondary school aged children.
However:
We also see that during half term, testing amongst that age group decreased which could explain some or all of the pattern in positivity rates that we see.
Even for the ONS prevalence study, there is a lot of uncertainty around the size of the effect that is seen.
Drops in infection while school is closed does not mean that these infections were happening in school. For example, it could be from travelling into school or due to more mixing between parents.
There will be differences across the country, particularly because of the different lockdown tiers, and we haven’t explored this variation.
Conclusion
While this could be evidence for a “half term” effect on infection amongst school aged pupils, we do not have enough evidence here to prove this conclusively, or to quantify the size of the effect and how it interacts with other factors.
15

Part 2: Contact between children and older adultsInvestigation of the reliability of the contact tracing data from Test & Trace, and whether it can tell us about the level of contact between children and older/vulnerable adults
16

DataScienceLaboratory
Available test and trace data shows that older adults are
rarely reported as close contacts by infected children
According to this data source, a small proportion of over-70s are exposed to the virus by children
17
The majority of older people listed as contacts appear to be exposed to the virus by other adults over the age of 50

DataScienceLaboratory
However bias and data quality issues make it extremely
difficult to infer the true exposure patterns
18
➢ Around 30% of contacts have no age data. If this information is not
missing at random, the age profile of exposers for contacts over 70
could be very different, in either direction.
➢ Children are more often asymptomatic than adults, but Test and Trace data only records symptomatic cases and associated contacts. As a
consequence, exposure events where over-70s come into contact with
infected children may be more common than shown by the data.
Stylised representation of
observed exposer age profile for
contacts aged over 70.
Relatively few exposure events
involve infected
symptomatic children.
A plausible version of
exposer age profile for
contacts aged over 70, if
asymptomatic exposures
were taken into account.
The true size of this bias is
unknown, but it would
always underestimate
exposure by younger
people.
Age of exposers for contacts aged over 70

DataScienceLaboratory
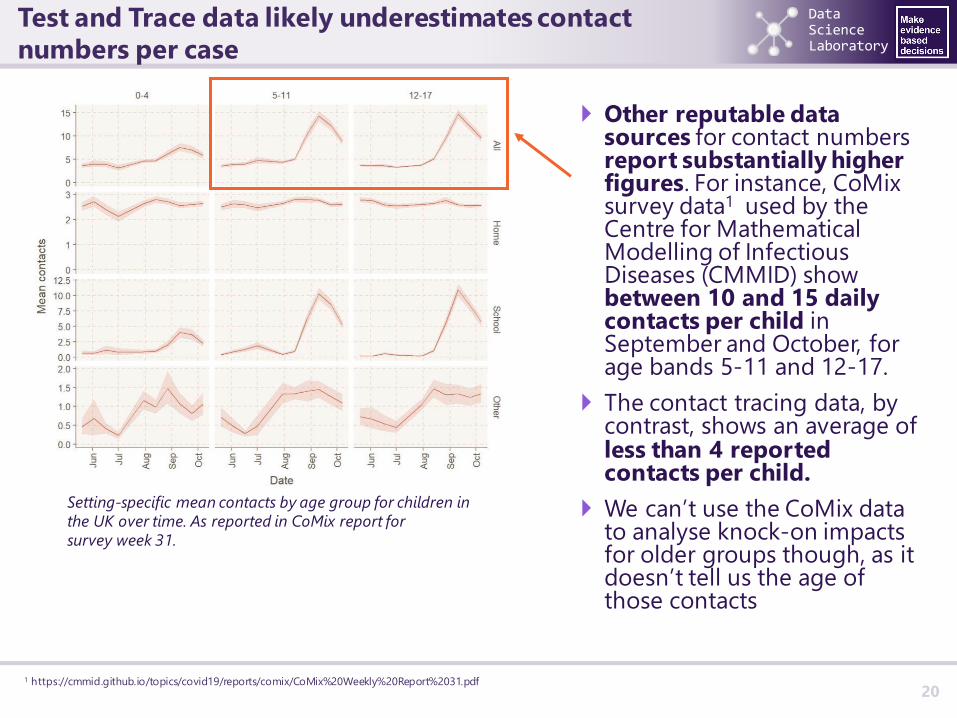
Test and Trace data likely underestimates contact
numbers per case
191 https://cmmid.github.io/topics/covid19/reports/comix/CoMix%20Weekly%20Report%2031.pdf
The Test and Trace system records the close contacts reported by individuals who tested positive to Covid-19.
Under-reporting means these values are likely underestimates of true contact numbers.
The average number of contacts between infected children and their own age groups are unexpectedly low given they almost all attend school. These figures can be compared with other published data for sense checking.
DataScienceLaboratory
Test and Trace data likely underestimates contact
numbers per case
201 https://cmmid.github.io/topics/covid19/reports/comix/CoMix%20Weekly%20Report%2031.pdf
Other reputable data sources for contact numbers report substantially higher figures. For instance, CoMixsurvey data1 used by the Centre for Mathematical Modelling of Infectious Diseases (CMMID) show between 10 and 15 daily contacts per child in September and October, for age bands 5-11 and 12-17.
The contact tracing data, by contrast, shows an average of less than 4 reported contacts per child.
We can’t use the CoMix data to analyse knock-on impacts for older groups though, as it doesn’t tell us the age of those contacts
Setting-specific mean contacts by age group for children in
the UK over time. As reported in CoMix report for
survey week 31.

DataScienceLaboratory
Part 2 summary and conclusion
There are major sources of uncertainty in the Test and Trace data:
Large amounts of contact records with missing age data
Asymptomatic cases and associated contacts not reported
Under-reporting of contacts for recorded cases
Other main data sources for overall contact rates show substantially different, higher estimates
Although infected children do come into contact with older adults, the limitations listed above mean that true contact rates cannot be accurately estimated from the Test and Trace data. Consequently, this data should not be used to quantitatively assess the role of children on transmission to high-risk groups.
21

Part 3: Wider impactsInvestigation of whether it is possible to combine the half term analysis with various published estimates to quantify the knock-on impacts of school attendance for hospital admissions and deaths
22
DataScienceLaboratory
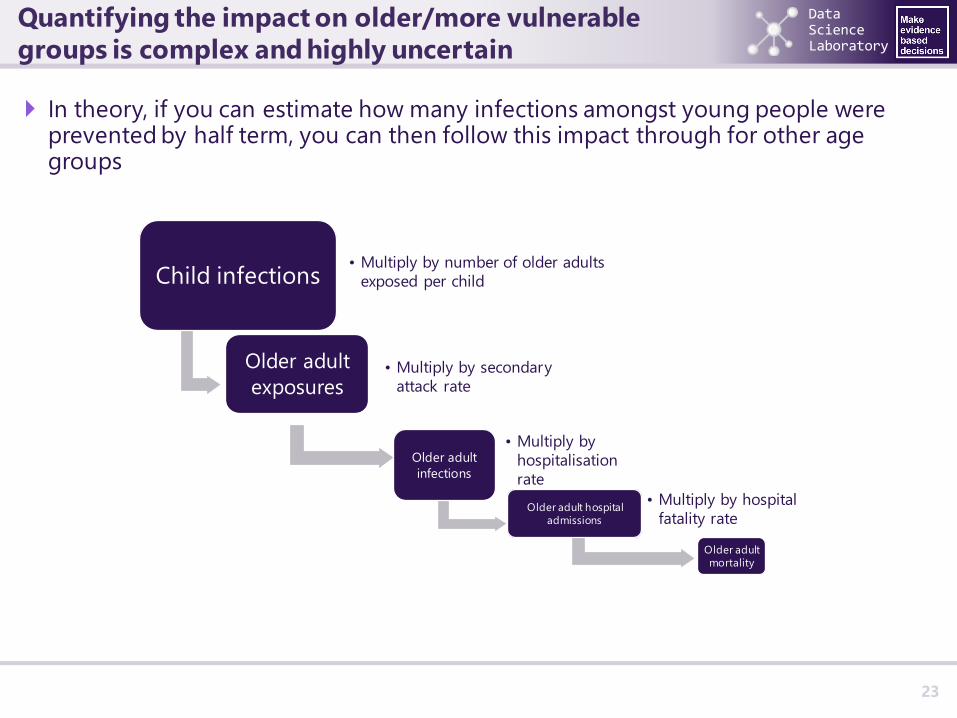
Quantifying the impact on older/more vulnerable
groups is complex and highly uncertain
In theory, if you can estimate how many infections amongst young people were prevented by half term, you can then follow this impact through for other age groups
23
Child infections• Multiply by number of older adults
exposed per child
Older adult
exposures• Multiply by secondary
attack rate
Older adult
infections
• Multiply by
hospitalisation
rate
Older adult hospital
admissions
• Multiply by hospital
fatality rate
Older adult
mortality
DataScienceLaboratory
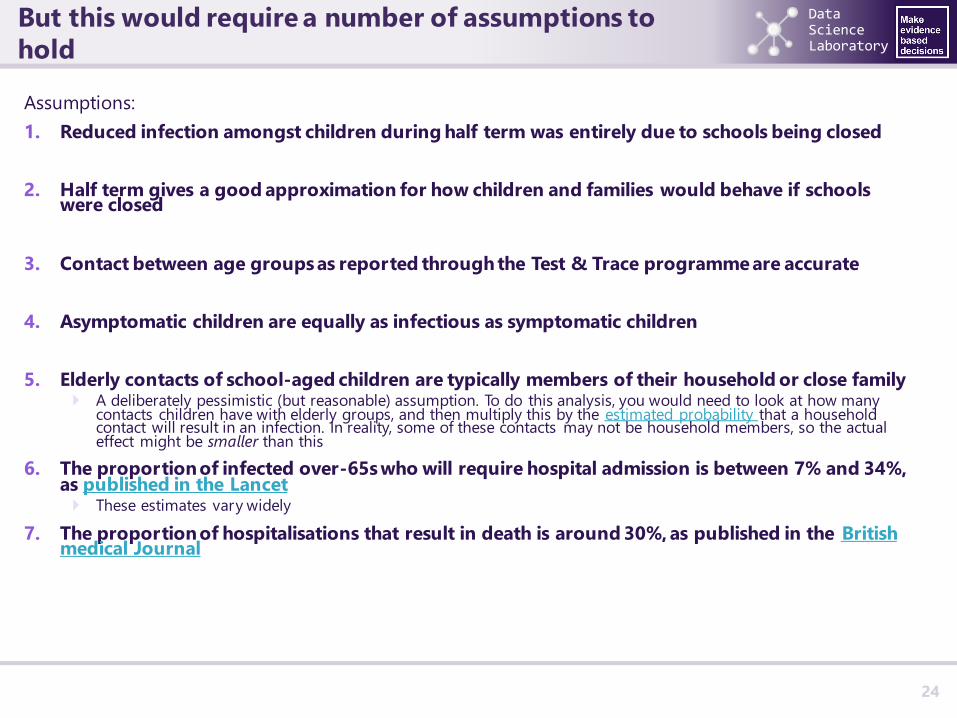
But this would require a number of assumptions to
hold
Assumptions:
1. Reduced infection amongst children during half term was entirely due to schools being closed
2. Half term gives a good approximation for how children and families would behave if schools were closed
3. Contact between age groups as reported through the Test & Trace programme are accurate
4. Asymptomatic children are equally as infectious as symptomatic children
5. Elderly contacts of school-aged children are typically members of their household or close family A deliberately pessimistic (but reasonable) assumption. To do this analysis, you would need to look at how many
contacts children have with elderly groups, and then multiply this by the estimated probability that a household contact will result in an infection. In reality, some of these contacts may not be household members, so the actual effect might be smaller than this
6. The proportion of infected over-65s who will require hospital admission is between 7% and 34%, as published in the Lancet These estimates vary widely
7. The proportion of hospitalisations that result in death is around 30%, as published in the British medical Journal
24

DataScienceLaboratory
And many of these do not stack up
Highlighted assumptions in particular are problematic
1. Reduced infection amongst children during half term was entirely due to schools being closed
This is very hard to be confident about, due to the range of other local factors and interventions in place at the time
2. Half term gives a good approximation for how children and families would behave if schools were closed
This might not be the case. If schools were closed during term-time and children had remote learning during the day, they might have fewer contacts than during half term. Alternatively, children might spend more time with their family during half term than term-time, and so term-time school closure periods might see more contact between children than in half term
3. Contact between age groups as reported through the Test & Trace programme are accurate
We know this is not the case (see earlier sections of this report). People under-report the number of contacts they have, and the Comix survey suggests this problem is particularly acute for children. Any estimates of knock-on effects using this data would therefore be highlyuncertain
4. Asymptomatic children are equally as infectious as symptomatic children
We still don’t know whether this is true or not – there is little either way in the scientific literature. This assumption would therefore add another substantial source of uncertainty to any such analysis.
5. Elderly contacts of school-aged children are typically members of their household or close family
To do this analysis, you would need to look at how many contacts children have with elderly groups, and then multiply this by the estimated probability that a household contact will result in an infection. In reality, some of these contacts may not be household members, so the actual effect might be smaller than this. Even if they were all household contacts, estimates of the secondary attack rate from children to family members vary substantially between studies
6. The proportion of infected over-65s who will require hospital admission is between 7% and 34%, as published in the Lancet
These estimates vary widely, adding further uncertainty
25
Plus, the any estimates for the number of child infections prevented by half term –
the first domino in the line – vary extremely widely. After multiplying through by
these parameters, all of which include a confidence range, we would end up with a
‘plausible range’ of impacts that would be far too wide to be useful.
Conclusions & next stepsWhere do we go from here?
26

DataScienceLaboratory
The wider impacts of the school system need to be
considered alongside other settings
Our key findings from this analysis were:
1. A variety of data sources suggest that secondary school-aged children became infected at a slower rate during half term than during the preceding term-time period.
2. There is far too much uncertainty in readily available data sources to be able to:
Quantify this size of this effect
Quantify the extent to which it was driven by schools being closed vs other factors
Attribute it to any specific causes within the school system (e.g. transmission within school buildings; transport to and from school; activities surrounding school; transmission from teachers to children or vice versa, etc)
3. Quantifying the wider knock-on effects for the rest of society would require complex epidemiological modelling and comparisons against other sectors
All we can say is that no substantial ‘half-term ripple’ showed up for older age groups in the period after half term – so if there was an effect, it wasn’t big enough to be obvious
Our recommendation is to ask for a commission to SPI-M to undertake this modelling, as the national experts in the field. The aim would be to provide a holistic answer on the relative contributions of education and other settings (hospitality, household visits etc) on transmission as a whole.
27