impact of service quality, corporate image and perceived...
TRANSCRIPT
Full Terms & Conditions of access and use can be found at
http://hrmars.com/index.php/pages/detail/publication-ethics
Impact of Service Quality, Corporate Image and Perceived Value on Brand Loyalty with Presence and Absence of Customer Satisfaction: A Study of four Service Sectors of Pakistan
Sarfraz Ashraf, Rashid Ilyas, Majid Imtiaz, Sajjad Ahmad
To Link this Article: http://dx.doi.org/10.6007/IJARBSS/v8-i2/3885 DOI: 10.6007/IJARBSS/v8-i2/3885
Received: 28 Jan 2018, Revised: 25 Feb 2018, Accepted: 28 Feb 2018
Published Online: 10 Mar 2018
In-Text Citation: (Ashraf, Ilyas, Imtiaz, & Ahmad, 2018) To Cite this Article: Ashraf, S., Ilyas, R., Imtiaz, M., & Ahmad, S. (2018). Impact of Service Quality, Corporate
Image and Perceived Value on Brand Loyalty with Presence and Absence of Customer Satisfaction: A Study of four Service Sectors of Pakistan. International Journal of Academic Research in Business and Social Sciences, 8(2), 452–474.
Copyright: © 2018 The Author(s)
Published by Human Resource Management Academic Research Society (www.hrmars.com) This article is published under the Creative Commons Attribution (CC BY 4.0) license. Anyone may reproduce, distribute, translate and create derivative works of this article (for both commercial and non-commercial purposes), subject to full attribution to the original publication and authors. The full terms of this license may be seen at: http://creativecommons.org/licences/by/4.0/legalcode
Vol. 8, No.2, February 2018, Pg. 452 - 474
http://hrmars.com/index.php/pages/detail/IJARBSS JOURNAL HOMEPAGE

International Journal of Academic Research in Business and Social Sciences
Vol. 8 , No.2, February 2018, E-ISSN: 2222-6990 © 2018 HRMARS
453
Impact of Service Quality, Corporate Image and Perceived Value on Brand Loyalty with Presence
and Absence of Customer Satisfaction: A Study of four Service Sectors of Pakistan
Sarfraz Ashraf1*, Rashid Ilyas2, Majid Imtiaz3, Sajjad Ahmad4 1MBA (Honors), Department of Business Administration, University of Sargodha Gujranwala
Campus Correspondence: [email protected]
2,3MBA (Honors), Department of Business Administration, University of Sargodha Gujranwala Campus
4Visting Lecturer, Department of Business Administration, University of Sargodha Gujranwala Campus
Abstract Customer satisfaction is one of the major objective of the organizations because satisfaction leads the customers to be loyal and this can be source of competitive edge for the organization. Therefore, this study is designed to investigate the mediating role of customer satisfaction between service quality and brand loyalty, corporate image and brand loyalty, perceived value and brand loyalty in the four distinct service sectors of Pakistan i.e. hospitals, educations, banks and hotels. The data were collected by using nonprobability sampling and snowball sampling from the students for determining educational sectors results and customers of other sectors to examine their results. The total 500 questionnaires distributed to respondents from which 440 (88%) were usable and able for testing. The results indicate that service quality, corporate image and perceived value are the key drivers in enhancing brand loyalty when customer satisfaction mediated in their relationship. The findings confirm the mediating role of customer satisfaction in the relationship of service quality and brand loyalty, corporate image and brand loyalty, perceived value and brand loyalty. Key Words: Corporate Image, Service Quality, Perceived Value, Customer Satisfaction, Brand Loyalty, Hotel, Education, Hospitals, Banks Introduction
In the highly competitive market, the most valuable intangible asset of a company is branding because brand can enable the consumers to understand the offered products and services of the such brand and it reduce the purchase risk decision of the customer (Kim et al., 2008). In today's
International Journal of Academic Research in Business and Social Sciences
Vol. 8 , No.2, February 2018, E-ISSN: 2222-6990 © 2018 HRMARS
454
highly competitive and complex environment, organizations are competing each other on base of their services. During 1980’s people considers getting services as luxuries. At this modern age, due to change in lifestyle, people consider the services as the necessities of life which is offered by different organization, that changes in lifestyle help services industry to grow worldwide. This study comprises the different sectors like hoteling, educational, hospitals and banking sectors. All the services sector needs highly loyal customers because their success depends on loyal customers. The basic purpose of today's businesses is to turn satisfied customers to loyal customers. Throughout the past era, monetarist facilities segment has been endured due to the changing situation of the market, increasing competition, little market growth and increased deregulation (Chaudhuri and Halbrook, 2002). Banking sector is highly trying to loyal their customer from satisfaction. Loyalty can be measure through customers account used over the time and by noting their continually backup. In today's marketing situations, banks attempt many strategies to remain customers. Banks introduced many new goods and amenities that assist the clients to remain loyal by means of the bank (Alam and Khokhar, 2006; Ashraf et al., 2017).
During the past decade, many hotel industry’s firms facing complications in aggregating their market stake due to increasing competition in universal market, leisurelier progress rate and slower inhabitants progress. A past survey showed that 1,480 new hotels has been opened in international market (Ford, 1998, p. 59). Many new industries are growing in Pakistan; hotel industry is also booming at fast rate. High quality of food, beverages, reception and services played a vital role in expansion of hotel industry in Pakistan. Due to this expansion, foreign investors willing want to invest in this industry. Services providers want to retain existing customer because they want long term relationship with the customers. When customers quit to buy services, the new one’s comes. However, it is highly expensive to locating new customers as of publicizing, preferment and auction cost (Reichheld, 1996). Trustworthy regulars are competitive edge for the hotel organizations as it is easy to serve them as compare non-loyal customers. Reichheld (1996) in his book “The Loyalty Effect” describes that the benefits of brand loyalty as: constant yield, reducing market rate, upsurge per-customer returns progress, lessening functioning rate, upsurge recommendations, upsurge worth premium and provides viable benefit to the firms.
From the past decade, customer satisfaction, service quality and loyalty are big construct as these are under study in education sector. In education sector, universities and colleges prominence on consultation prospects and desires of the customers. Scholars allegiance is one of the key goal of an enlightening institute because a trustworthy scholar will give the competitive edge to the institute in the arrangement of positive word of mouth (WOM). Offering and delivery of superior quality of services gives the supportable benefit in the extremely inexpensive international enlightening market (Kotler and Fox, 2002). In this framework, services quality and loyalty is accredited as significant portion in the success of educational institute (Donaldson and Runciman, 1995). In educational services organization, the concepts of student satisfaction, loyalty, institute image and reputations are widely used as standing apparatuses to encourage student options of advanced schooling organization (Milo et al., 1989; Weissman, 1990). These instruments are essential in emerging and upholding favorable allegiance with the regulars (Dick and Basu, 1994; Raj, 1985).
Healthcare industry face unique hurdles around the world. Healthcare has become one of the biggest service sector of Pakistan both in term of income and employment. In Pakistan

International Journal of Academic Research in Business and Social Sciences
Vol. 8 , No.2, February 2018, E-ISSN: 2222-6990 © 2018 HRMARS
455
healthcare sector has been divided into two categories –private and public, public sector owned and run by government while private owned and run by local authorities. Many new hospitals opening in Pakistan to provide excellence services to the people of Pakistan. The upsurge in the quantity of hospitals will upsurge the competitive environment (Kim et al., 2008).
Brand is an intangible asset of a company which is made by their products and services (Haigh, 2004). The main reason behind the success of a brand is how brand influence on the satisfaction level of a customer and how it impacts on customer’s buying decision, this lead them to retain loyal with the brand and they will endorse the brand to their household members and groups (Michael et al., 2005). Precious research had shown that if a brand continually offers the superior value of services which met the satisfaction level of the customer, will lead to high market performance which makes consistent highly important feature of a brand behavior (Schuler, 2002). Services organizations are continually finding the ways from which they can increase loyalty which is depends on long term relationship of customers and service providers. Buying services are also continuing reiteration buying corporate because it needs tall level of engrossment of the regulars (Hurley, 2004).
From the past decade, brand loyalty is using as a key variable and this construct is key indicator for the market success for many firms, working under the services industry (Yoo and Bai 2012). Previous research on brand loyalty, explained the key constructs such as service quality (e.g., Bloemer, de Ruyter, and Wetzels 1999; Hsu, Oh, and Assaf 2012; Nam, Ekinci, and Whyatt 2011), perceived value (e.g., Sirdeshmukh, Singh, and Sabol 2002; Ryu, Han, and Kim 2008; Petrick 2004), customer satisfaction (e.g., Back and Parks 2003; Li and Petrick 2008; Back and Lee 2009), and trust (e.g., Chaudhuri and Holbrook 2001; Han and Jeong 2013) as loyalty antecedents. Only few researchers (Ishaq et al., 2014; Hussain, 2016) take corporate image or service provider as independent variable to find out its relationship with brand loyalty. These researchers are limited to the single service sector for determining brand loyalty, in this perspective no one can answer the question, does the same results of one sector is applicable for another? To bridge this gap, this study initiates this step to determine brand loyalty by covering four service sectors of Pakistan in a single study. Thus, the main resolution of this investigation is to, firstly investigate the affiliation between corporate image, service quality, perceived value and brand loyalty. Secondly, to investigate the relation between corporate image, service quality, perceived value and brand loyalty via mediation of customer satisfaction. Thirdly, to examine the relationship between above mentioned variable in the different service sectors of Pakistan such as Education, Hospitals, hotels and banking sectors.
Literature Review and Conceptual Framework Service Quality and Brand Loyalty
The first conceptual and comprehensive characterization of brand loyalty was anticipated by Jacoby (1971). According to his opinion, brand loyalty: “The biased (non-random) behavioral response (purchase) expressed over time by some decision-making unit with respect to one or more alternative brands out of a set of brands and is a function of psychological processes”. Brand allegiance arises when regulars are more gratified from the goods or services of a brand and prefer it to over other brands (Park, Robertson, & Wu, 2004). On the other hand, customer gratification is the demonstrative reaction of a buyer toward the goods or services of a brand

International Journal of Academic Research in Business and Social Sciences
Vol. 8 , No.2, February 2018, E-ISSN: 2222-6990 © 2018 HRMARS
456
(Oliver, 1997). Furthermore (Oliver, 1997) stated that this emotional reaction can be positive or negative.
Service quality well-defined by Bitner and Hubbert’s (1994, p.77) as “The consumer’s overall impressions of the relative superiority of the organization and its services”. Customer satisfaction is the instant reaction of the customers toward the services of an organization, alternatively service quality is the shopper’s judgment that help to differentiate between predictable services and alleged services (Culiberg, 2010). Parasuraman et al. (1985) suggested that service quality is the transformation between expected services and offered services. If the obtainable services are greater than the expectations then it leads to customer gratification (Parasuraman, et al., 1985). If there is absence of correspondence between the customer gratification and the offered services then it leads to short term customer’s satisfaction while service quality build long term attitude of the customers toward the organization (Hoffman & Bateson, 2010).
If customers prefer a brand over others and continuously purchase its services, it means the customer has high level of satisfaction with the brand. So, the organizations must understand the things the help to satisfy and retain the customers. Hoisington and Naumann (2003) suggested that “customers use five major categories to value a company or organization’s performance: (tangible) product quality, service quality, quality of relationship between customer and supplier, image, and price perception. For a tangible product, quality might include features, usability, or compatibility. For a service offering, this would include the various dimensions of the service being provided (Hoisington & Naumann, 2003, p. 34).” Zeithaml et al. (1996) suggested that a customer will have strong relationship with the brand when that customer made positive valuation about the services of the brand and the relationship will be weak when that customer made negative valuation of the services. They argue that positive evaluation of the brand will lead to be loyal with the brand. Thus, if a customer satisfied from the offered services then that customers will be loyal with the brand, so we proposed that: H1: Brand loyalty is positively influenced by quality services Corporate Image and Brand Loyalty
Corporate image (CI) is a perception that consumers hold in their minds which is related to the organizations (Connor & Davidson, 1997). A corporate image varies in different situation and media coverage. CI is the observation of regulars toward the specific brand (Connor & Davidson, 1997). Generally, a considerable time and efforts required to organization to build the image in the people.
Johnson et al., (2001) considered CI as insolence which have greater impact on loyalty because of its practical mechanisms. Signaling theory provide a way to measure the relationship of corporate image and loyalty. According this theory view, organizational communication builds organizational reputation and capability in the society (Kim & Lee, 2010) that create indicators. Regulars practice these indicators to examine the superiority and worth of immaterial facilities which is offered by the organization. Kim and Lee (2010) reveals that CI as organizations observation which is hold by customers in their mind, because it enables the customers to perceive and evaluate the whole operations of the organization. Furthermore, they suggested that CI has a greater encouragement on allegiance. In this tactic, Nukpezah and Nyumuyo (2010) and Islam (2010) showed that CI is directly associated to different organizational attributes such

International Journal of Academic Research in Business and Social Sciences
Vol. 8 , No.2, February 2018, E-ISSN: 2222-6990 © 2018 HRMARS
457
as brand name, products or service category and the quality of its product or services which communicated with each customer. Furthermore, they concluded that corporate image has positive impact on loyalty as they gain evidence from different services sectors like telecommunication, education and retailing. CI is chief aspect that helps customers to evaluate organizations performance and its offered services, it has a greater inspiration on customer gratification (Wu, 2011), on brand loyalty (Davies & Chun, 2002; Nguyen & LeBlanc, 2001), and on reiteration patronage also (Andreassen & Lindestad, 1998; Raj, 1985). Thus, H2: Brand loyalty is positively influence by corporate image Perceived Value and Brand Loyalty
The construct of perceived value (PV) has been established by researcher and practitioners with considerable attention due to its ability of customer prediction, customer satisfaction, decision making and to gain competitive edge (Day, 2002; Holbrook, 1994; Woodruff, 1997). PV is the inclusive evaluation of efficacy of the services grounded on the, what is customary and what is assumed (Zeithaml, 1988). Customers perceive performance, stability, economy, presence, and protection with the service, and customers includes time and money in the total cost incurred (Day, 2002). Customer satisfaction will be high when customer compare input to output and cost to benefits fairly (Oliver & DeSarbo, 1988).
PV has demonstrated to be a problematic construct to outline and ration (Woodruff, 1997; Holbrook, 1994; Zeithaml, 1988). Generally well-defined, PV is the outcomes or welfares customers obtain in kin to entire outlays (which include the price remunerated plus other expenses related with the acquisition). Investigation indication reveals that customers who observe that they acknowledged “value for money” are additional gratified than regulars who do not observe they acknowledged “value for money” (Zeithaml, 1988). Customer worth is “the fundamental basis for all marketing activity” (Holbrook, 1994). The additional worth will give enthusiasm to the customers. In this sense, Sirdeshmukh, Singh, and Sabol (2002) reveals that the customers who gain value from the organizations will be more loyal with organization than those who does not gain value. Loyalty can me measure or investigate through purchaser gratification with the brand and purchaser gratification can measure through perceived customers value. Ishaq et al., (2014), study on the relationship of PV and brand loyalty and reveals that PV has optimistic and significant impression on brand loyalty. On the base above discussed literature, we hypothesize: H3: Brand loyalty is positively influenced by customer perceived value Mediation of Customer Satisfaction between Service Quality and Brand Loyalty
Service quality is fundamental element for the organizations, for those who are small in number and providing undifferentiated services to the same customers. Quality of the services is based on the abilities of the organization to continually meet the requirements and desires of the regulars (Parasuraman, Zeithaml, & Berry, 1988). When organization meet to the requirements of the regulars, the regulars more likely to be satisfied. For higher level of purchaser fulfillment, an organization must provide higher close of satisfaction as quality facility is antecedents for purchaser gratification (Cronin, Brady, & Hult, 2000). Most researcher reveals that there’s a relationship between quality services and customer satisfaction (e.g., Anderson & Sullivan, 1993; Cronin, et al., 2000; Fornell, Johnson, Anderson, Cha, & Bryant, 1996; Lee, Lee, &

International Journal of Academic Research in Business and Social Sciences
Vol. 8 , No.2, February 2018, E-ISSN: 2222-6990 © 2018 HRMARS
458
Yoo, 2000; Parasuraman, et al., 1985; Saravanan & Rao, 2007). Accordingly, the above literature clinched that quality provision has a direct influence on customer satisfaction.
Two general reason behind purchasing products or services from a specific brand are, customers have no alternatives or they have high level personal characteristics with this brand (Zins, 2001). A brand promise with their customers about providing products and services, if the brand provides products and services according to their promise and customer are satisfied then it will lead to brand loyalty or if regulars are not pleased then they drive not be faithful with the organization and flat they drive not to acquisition the goods and services again offered by this brand. Hofmeyr & Rice, (2000) shown that an organization must spend 5 times more or much as possible to get new customers than to retain existing customers. For the success of an organization, the most important things are not the new regulars but folks who made repurchase (Jacoby & Chestnut, 1978). Brand loyalty gives benefits to the organization which include profits, customers repurchase, customer’s increase volume of acquisitions and create the optimistic word-of-mouth for the brand and brand loyal customers also gives valuable suggestion to the organization (Reichheld, et al., 1990).
Ghafoor and Asad-ur-Rehman (2014) reveals that there is constructive affiliation amid customer satisfaction and brand loyalty. Furthermore, they suggested that the brand devotion can be produced by increasing customer fulfillment and by donation of high level of brand worth. Shopper gratification and dissatisfaction has great impression on brand loyalty (Anderson & Sullivan, 1993; Lim, Widdows, & Park, 2006; Zeithaml, Berry, & Parasuraman, 1996). Customers made repurchase only when they are satisfied, it not only leads to brand loyalty but also lessening the complaints of customers (Johnson, Gustafsson, Andressen, Lervik, & Cha, 2001). Thus, H4: Customer satisfaction is positively mediating in the relationship of service quality and brand loyalty Mediation of Customer Satisfaction between Corporate Image and Brand Loyalty
Customer satisfaction (CS) is a subjective construct. Therefore, many definitions have been described by researchers. Customer satisfaction is subjective circumstances in which offered product or services meet or exceed from the expectations of the customers (Engel, Blackwell, & Miniard, 1990, p. 47). Rendering to additional characterization, CS is the variance between previously buying expectation and later using expectations. (Aktepe, Baş, & Tolon, 2009, p. 11).
Kandampully and Hu (2007) suggested that CI is combination of two mechanisms; first is practical by way of the physical appearance that can be restrained and assessed straightforwardly. Second is sensitive by way of emotional state, insolences and views towards the association. These sensitive mechanisms are imports from incremental experience; the purchaser take with the route of period. If an organization has a positive and greater corporate image, the customers has high level of satisfaction from that organization. A positive image helps the customers to create positive perception about the organization and mesh out adverse ones (Andreassen & Lindestad, 1998), which primes to inclusive constructive assessment of the association (Gronroos, 1984b). The positive image of the organization is directly in influence the satisfaction of the customers and to retain them with the brand (Oyewole, Sankaran, & Choudhury, 2007). A study of Ene and Ozkaya (2014) used customer satisfaction as mediator amid CI and brand loyalty in the framework of merchandizing store and reveals that customer satisfaction is

International Journal of Academic Research in Business and Social Sciences
Vol. 8 , No.2, February 2018, E-ISSN: 2222-6990 © 2018 HRMARS
459
positively influenced on the relationship of corporate image and brand loyalty. Furthermore, they suggested that in order to gain competitive advantage and strength and successful brand loyalty, the organizations should build strong CI and to focus on CS. The other researcher used satisfaction as mediator amid CI and brand loyalty are: Mensah, Kilika (2014); Kunanusorn, Puttawong (2015); Ishaq (2012); Thomas, (2011). Thus, we can hypothesize: H5: Customer satisfaction is positively mediating between corporate image and brand loyalty Mediation of Customer Satisfaction between Perceived Value and brand Loyalty
Perceived value is the overall valuation of customers related to expected and offered services (Fornell et al., 1996, Zeithaml, 1988). CS is the customer’s behavior grounded on global practice and that can be regarded in two behaviors, “transaction-specific outcome or cumulative evaluation” (Wang et al., 2004). The relationship among PV, CS and loyalty has been discussed in the literature of amenity marketing. PV has direct impact on CS and it reveals how a satisfied customer react to the service provider (Anderson et al., 1994) and that gratification hang on worth (Ravald and GroÈnroos, 1996), attention has been paid on value of customer in evaluation of services (Lemmink et al., 1998). Primarily CS is based on amenity practice i.e. antecedent of service quality. CS, acquisitions regularity, acquisitions extent, and can positively go a long mode toward emerging brand loyalty can be increase by delivering value to customers (Rust, Lemon, & Zeithaml, 2004).
A study on Customer PV, CS and Loyalty by Yang and Peterson (2004) use CS as mediator amid PV and loyalty and reveals that CS has optimistic and weighty impact on the relationship of the perceived value and loyalty. Furthermore, they suggested that organizations that struggling for loyalty, should focus on the satisfaction level of the customers. On the hand, they describe that, brand loyalty, satisfaction and PV are significance, only when the customer’s level of gratification meets with their expectations or above average. The other researchers that use CS as mediator between PV and loyalty are: Yang and Peterson (2004); Ishaq (2012); Hussain (2016). Thus, on the base of above discussed works we projected the resulting hypothesis: H6: Customer satisfaction is positively mediating between perceived value and Brand loyalty

International Journal of Academic Research in Business and Social Sciences
Vol. 8 , No.2, February 2018, E-ISSN: 2222-6990 © 2018 HRMARS
460
Conceptual Framework
Methodology Design and Sample
This is a cross sectional study which is conducted on four service sectors of Pakistan (Gujranwala and Lahore) i.e. Educational, Hotels, Hospitals and Banking sectors. The data were collected using questionnaire as research instrument by using nonprobability sampling and through online google documents by using snowball sampling because we send our online questionnaire to some expert researcher to fill it out and they send it to their students and colleagues and they send it to other friends. During the period of 10 April 2017 to 20 April 2017, total 500 questionnaires from which 100 of each sector was distributed to respondent and 100 to online people and 460 people filled out the questionnaire from which 440 (88%) are usable and valid for analysis. The data of educational sector were collected from the young students of different universities, data of hotels were collected from the customers of different hotels by vising them, data of hospitals were collected from the patients of different hospitals of Gujranwala and Lahore and data of banking sector were collected from the customers of different banks. Furthermore, respondents profile shown in the following table:

International Journal of Academic Research in Business and Social Sciences
Vol. 8 , No.2, February 2018, E-ISSN: 2222-6990 © 2018 HRMARS
461
Table 1: Demographic Information
Demographic character Demographic Feature Frequency Percentage
Sector Hospitals Educations Banks Hotels Total
100 130 106 104 440
22.7% 29.5% 24.2% 23.6% 100%
Gender Male Female Total
211 229 440
48% 52% 100%
Age Under 18 18 to 25 26 to 35 Above 35 Total
2 389 35 14 440
0.5% 88.3% 8% 3.2% 100%
Education Intermediate Graduates Masters Above Masters Total
28 263 133 16 440
6.4% 59.8% 30.2% 3.6% 100%
Occupation Students Self-employed Worker Total
316 25 99 440
71.8% 5.7% 22.5% 100%
In the table, it shown that this study comprises 4 service sectors of Pakistan (Gujranwala and Lahore) i.e. hospital, education, bank and hotel sectors. The data were collected as 100, 130, 106, 104 from hospital, education, banks and hotel sector respectively. The sample consist of 48% male respondents and 52% female respondents. the 0.5% respondents are under 18 while majority of respondents 88.3% are in the age group of 18 to 25 years, 8% are from 26 to 35 and 3.2% are above 35 years of age. The education level of the respondents (6.4%, 58.9%, 30.2%, 3.6%) are intermediate, graduation, masters and above masters respectively. One the other hand, 71.8% respondents are students, 5.7% are self-employed while 22.5% are workers.
Measures All scales used in this investigation were measured by using 5-point Likert scale and ranged from 1 (strongly disagree) to 5 (strongly agree). Corporate image was measured by 3 items scale which is established by Souiden et al. (2006). Sample items includes: “This Institute is unique and innovative”. Three items were used to ration customer perceived value (Cronin et al., 2000; Tung, 2004). Sample items includes: “I feel I am getting good portable value-added services for a reasonable price”. For the measurement of service quality six items was used from (Pitt et all., 1995). Sample items includes: “This organization provides services at the time it promises.” Customer satisfaction was measured by 5 items from Oliver (1980) to capture service expectations. Sample items includes: “The choice to use this service supplier was wise.” Three

International Journal of Academic Research in Business and Social Sciences
Vol. 8 , No.2, February 2018, E-ISSN: 2222-6990 © 2018 HRMARS
462
items were used to ration loyalty from Zeithaml et al. (1996) aiming to evaluate loyalty. Sample items includes: “I will tell good things regarding this service provider”. Results
4.1 Correlation Analysis Table:2 Correlation Analysis
Variables Mean SD CI PV SQ CS BL
CI 3.83 .48 1 PV 3.77 .46 .44** 1 SQ 3.78 .39 .40** .35** 1 CS 3.42 .32 .33** .29* .20** 1 CL 3.81 .40 .39** .39** .32** .34** 1
**P<.01; two tailed; N= number of participants; SD= standard deviation; CI= Corporate Image; PV= Perceived Value; SQ= Service Quality; CS= Customer Satisfaction; BL= Brand Loyalty
The mean value of corporate image is 3.83 which is nearby to 4, it disclosed that most of
the respondents were agreed and the value of standard deviation is .48 which showed 48% variation in the responses of respondents. Furthermore, corporate image is positively and significantly correlated with perceived value, service quality, customer satisfaction and brand loyalty at (r=.44**, .40**, .33**, .39**) respectively. The mean of perceived value is 3.77 which is nearby to 4, it showed that bulk of the respondents were agreed and standard deviation of perceived value is .46 which showed 46% variation in the responses of respondents. Additionally, perceived value is positively and significantly correlated with service quality, customer satisfaction and brand loyalty at (r=.35**, .29**, .39**) respectively. The mean value of service quality is 3.78 it reveals that the bulk of the respondents were agreed and standard deviation of service quality is .39 which showed 39% variation in the responses. Furthermore, service quality is significantly and positively correlated (r=.20**, .32**) with customer satisfaction and brand loyalty respectively. The mean value of satisfaction is 3.42 and the standard deviation is .32 which showed 32% variation in the responses. In addition, customer satisfaction is certainly and suggestively correlated with brand loyalty at (r=.34**), on the other hands, mean rate of loyalty is 3.81 which is near to 4, it showed that the bulk of respondents were agreed and the value of standard deviation is .40 which showed the 40% variation in the responses.
Regression Analysis
Table:3 SQ and BL
Variables B SE B t Sig.
Constant 2.55 .17 14.43 .000 Service Quality .33 .05 .32 7.16 .000 R2=.105 F=51.27 P=.000
It is shown that brand loyalty as dependent variable and service quality as independent
variable. The findings reveal that service quality is positively and significantly linked with brand
International Journal of Academic Research in Business and Social Sciences
Vol. 8 , No.2, February 2018, E-ISSN: 2222-6990 © 2018 HRMARS
463
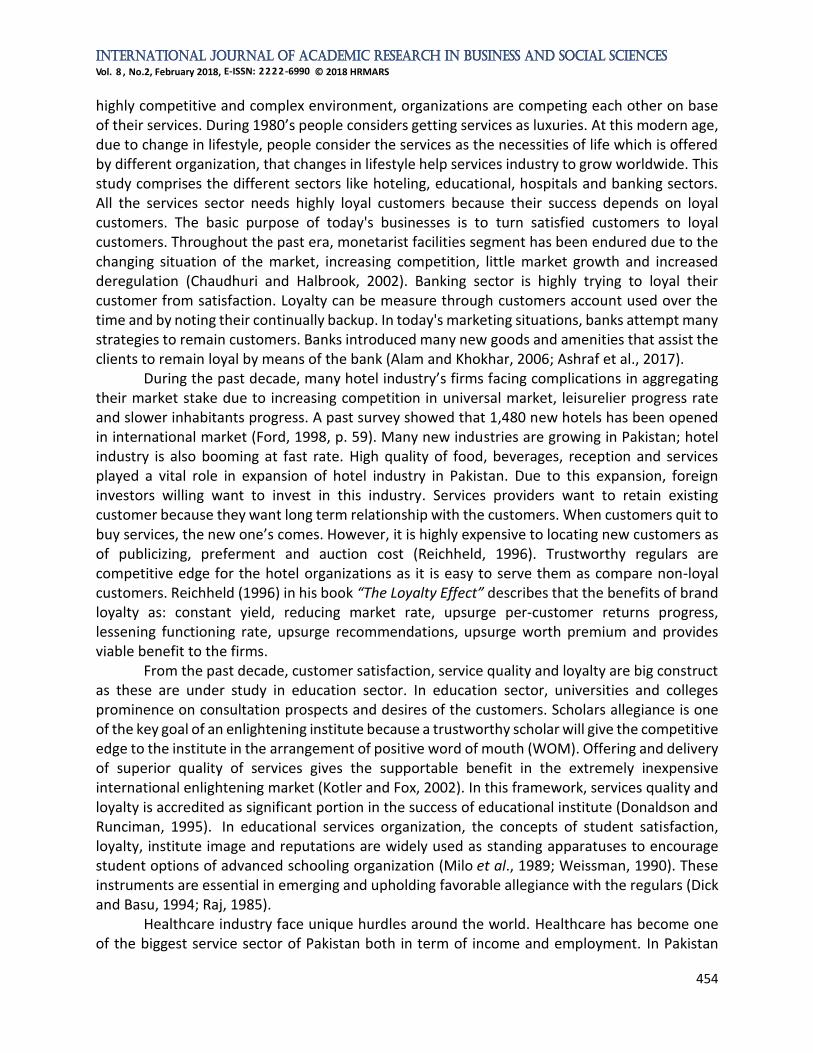
loyalty. Furthermore, R2=.105 indicated that the total variation of 10.5% in brand loyalty can be explained by service quality (predictor variable). In addition, F=51.27 and P=.000 portrayed that the archetypal is statistically momentous and service quality (predictor variable) cause of variation in brand loyalty. These results supported the H1 of this study which was designed as “Brand loyalty is positively influenced by quality services”.
Table:4 CI and BL
Variables B SE B t Sig.
Constant 2.54 .14 17.67 .000 Corporate
Image .33 .04 .39 8.93 .000
R2=.154 F=79.74 P=.000
It is shown that brand loyalty as dependent variable with corporate image as predictor (Independent variable). In the table, it is shown that corporate image is certainly and pointedly linked with brand loyalty. In addition, R2-=.154 shown that total variation of 15.4% in brand loyalty is due to corporate image (predictor variable). Furthermore, in the table, F=79.74 and P<.01 rendered that the model is statistically significant and corporate image (predictor variable) cause of variation in brand loyalty. These results supported the H2 of this study which was designed as “Brand loyalty is positively influence by corporate image”.
Table:5 PV and BL
Variables B SE B t Sig.
Constant 2.52 .15 17.44 .000 Perceived
Value .34 .04 .40 8.99 .000
R2=.156 F=80.82 P=.000
In the table, it is shown that brand loyalty as dependent variable and perceived value as independent variable or predictor. In addition, perceived value is positively and significantly linked with brand loyalty. Furthermore, R2=.156 indicated that total variation of 15.6% in the brand loyalty is cause of predictor variable. Moreover, F=80.82 and P<.01 indicated that the model is statistically significant predictor caused changes in brand loyalty. These findings supported that H3 of this study which was designed as “Brand loyalty is positively influenced by customer perceived value”.

International Journal of Academic Research in Business and Social Sciences
Vol. 8 , No.2, February 2018, E-ISSN: 2222-6990 © 2018 HRMARS
464
Mediation Analysis with Regression Mediation of customer satisfaction between service quality and brand loyalty
Table 6: Model Summary (SQ to CS)
R R-Sq F df1 df2 P
.2007 .4003 18.3913 1.0000 438.0000 .0000
P<.05 In the table, it is shown that the overall model is weighty. R square shows that the total variation of 40.03% in customer satisfaction has been explained by service quality.
Table 7: Model Summary (SQ & CS to BL)
R R-Sq F df1 df2 P
.4281 .1833 49.0412 2.0000 437.0000 .0000
P<.05 Table 12 describes the model as significant. Furthermore, the value of R square shown that the total variation of 18.33% in the relationship of service quality and brand loyalty has been explained by customer satisfaction.
Table 8: Model Summary (SQ to BL)
R R-Sq F df1 df2 P
.3237 .1048 51.2785 1.0000 438.0000 .0000
P<.05 The table shown that the inclusive archetypal is weighty. Moreover, the value of R square reveals the total variation of 10.48% in brand loyalty has been explained by service quality.
Table 9: Model (Path Analysis)
Paths coefficients SE t P LLCI ULCI
Path a .1649 .0384 4.2885 .0000 .0893 .2405 Path b .3583 .0553 6.4810 .0000 .2496 .4669 Path c .3331 .0465 7.1609 .0000 .2417 .4245 Path c’ .2740 .0454 6.0351 .0000 .1848 .3633
P<.05 In the table, it is shown that all the paths (a, b, c and c’) fulfills the requirements of partial mediation. The findings shown that service quality is completely and significantly associate with customer satisfaction path a) with (b=0.1649, t=4.2885, p<0.05), which shows path a is significant. In the same way, customer satisfaction is positively and significantly link up with brand loyalty (path b) at (b=0.3583, t=6.4810, p<0.05), which shows path b is also significant. By the explanation of direct and total effect in the table, it is shown that path c and c’ is also significant. In the affiliation of service quality and brand loyalty, significance exist at (b=0.3331, t=7.1609, p<0.05) while the value of coefficient shows that direct upshot of service quality on brand loyalty (path c). In the table, it is shown that the entire upshot of service quality on brand loyalty is also weighty at (b=0.2740, t=6.0351, p<0.05) while the mediation of customer satisfaction. The verdicts indicate that customer satisfaction is certainly and significantly mediate amid the relationship of service quality and brand loyalty.

International Journal of Academic Research in Business and Social Sciences
Vol. 8 , No.2, February 2018, E-ISSN: 2222-6990 © 2018 HRMARS
465
Table 10: Sobel Test
Value SE Z P
.0591 .0167 3.5472 .0004
For the verification of mediating upshot of customer satisfaction, Sobel test is used. The table shows that the customer satisfaction is completely and significantly mediate the relationship of service quality and brand loyalty with Z=3.5472 and P<0.05 which support our study hypothesis H5 which was formulated as “Customer satisfaction is positively mediating in the relationship of service quality and brand loyalty”.
4.3.1 Mediation of customer satisfaction between corporate image and brand loyalty Table 11: Model Summary (CI to CS)
R R-Sq F df1 df2 P
.3253 .1058 51.8393 1.0000 438.0000 .0000
P<.05 In the table, it is shown that the overall archetypal is weighty. R square shows that the total variation of 10.58% in customer satisfaction has been explained by corporate image.
Table 12: Model Summary (CI & CS to BL)
R R-Sq F df1 df2 P
.4519 .2042 56.0581 2.0000 437.0000 .0000
P<.05 Table 7 clearly describes the model as significance. R square shows that the total variation of 20.42% in the relationship of corporate image and brand loyalty has been explained by customer satisfaction.
Table 13: Model Summary (CI to BL)
R R-Sq F df1 df2 P
.3924 .1540 79.7267 1.0000 438.0000 .0000
P<.05 In the table, it is shown that the overall model is significance. Furthermore, R square shown that the total variation of 15.40% in brand loyalty has been explained by corporate image.
Table 14: Model (Path Analysis)
Paths coefficients SE t P LLCI ULCI
Path a .2198 .0305 7.2000 .0000 .1598 .2799 Path b .2967 .0565 5.2485 .0000 .1856 .4078 Path c .3322 .0372 8.9295 .0000 .2591 .4053 Path c’ .2670 .0382 6.9885 .0000 .1919 .3421
P<.05 In the table, it is shown that all the paths (a, b, c, and c’) fulfills all the requirements of partial mediation. The findings explained that the corporate image is certainly and meaningfully acquaintances with customer satisfaction (path a) with (b=.2198, t=7.2, p<0.05). It shows path a as significant. In the same way, customer satisfaction is also positively and significantly associate with brand loyalty (path b) with (b=0.2967, t=5.2485, p<0.05), which reveals that the path b is also significant. By the explanation of direct and total effect in the table, it shows that path c and c’ is also significant. Furthermore, it is shown that the optimistic and weighty affiliation exist in the

International Journal of Academic Research in Business and Social Sciences
Vol. 8 , No.2, February 2018, E-ISSN: 2222-6990 © 2018 HRMARS
466
relationship of corporate image and brand loyalty with (b=0.3322, t=8.9295, p<0.05) while the value of coefficient (b) reveals the straight upshot of corporate image on brand loyalty (path c). The total upshot of corporate image on brand loyalty shown as significant with (b=0.2670, t=6.9885, p<0.05) while the mediation of customer satisfaction. The verdicts shown that the customer satisfaction is certainly and significantly mediate in the relationship of corporate image and brand loyalty.
Table 15: Sobel Test
Value SE Z P
.0652 .0155 4.2148 .0000
The purpose of using Sobel test is to verify the mediation upshot of customer satisfaction. In the table, it is shown that the mediation of customer satisfaction is exist in the affiliation of corporate image and brand loyalty as Z=4.2148 and p<0.05 which support our study hypothesis H4 which was formulated as “Customer satisfaction is positively mediating between corporate image and brand loyalty”. Mediation of customer satisfaction between perceived value and brand loyalty
Table 16: Model Summary (PV to CS)
R R-Sq F df1 df2 P
.2936 .0862 41.3326 1.0000 438.0000 .0000
P<.05 In the table, it is shown that the overall archetypal is weighty. The worth of R square shows that the variation of 8.62% in the customer satisfaction has been explained by perceived value.
Table 17: Model Summary (PV & CS to BL)
R R-Sq F df1 df2 P
.4588 .2105 58.2469 2.0000 437.0000 .0000
P<.05 The table shown that the overall model as significant. The value of R square shows the variation of 21.05% in bond of perceived value and brand loyalty has been explained by customer satisfaction.
Table 18: Model Summary (PV to BL)
R R-Sq F df1 df2 P
.3947 .1558 80.8177 1.0000 438.0000 .0000
P<.05 In the table, it is shown that the overall archetypal is weighty. The worth of R square shown the variation of 15.58% in brand loyalty has been explained by perceived value.
Table 19: Model (Path Analysis)
Paths coefficients SE t P LLCI ULCI
Path a .2034 .0316 6.4290 .0000 .1412 .2655 Path b .3065 .0557 5.5022 .0000 .19970 .4160 Path c .3424 .0381 8.9899 .0000 .2675 .4172 Path c’ .2801 .0386 7.2604 .0000 .2042 .3559
P<.05

International Journal of Academic Research in Business and Social Sciences
Vol. 8 , No.2, February 2018, E-ISSN: 2222-6990 © 2018 HRMARS
467
In the table, it is shown that all the path (a, b, c, c’) fulfills all the conditions of partial mediation. The findings indicate that the perceived value is positively and significantly acquaintances with customer satisfaction (path a) at (b=0.2034, t=6.4290, p<0.05), which shows path a as significant. In the same way, customer satisfaction is positively and significantly link up with brand loyalty at (b=0.3065, t=5.5022, p<0.05) which shows path b is also significant. In the table is shows that by the explanation of direct and total effect, path c and c’ is also significant. The affiliation between perceived value and brand loyalty is significant at (b=0.3424, t=0.0381, p<0.05) and the coefficient’s value shows that direct upshot of perceived value on brand loyalty (path c). the table shown that, the total upshot of perceived value on brand loyalty is also weighty at (b=0.2801, t=7.2604, p<0,05) while the mediation of customer satisfaction (path c’). the findings exposed that customer satisfaction is absolutely and pointedly mediate the relation of perceived value and brand loyalty.
Table 20: Sobel Test
Value SE Z P
.0623 .0150 4.1514 .0000
The purpose of Sobel test is to verify the mediating upshot of customer satisfaction in the affiliation of perceived value and brand loyalty. The finding shown that customer satisfaction is positively and significantly mediate the relation of perceived value and brand loyalty at Z=4.1514 and P<0.05 which support our study hypothesis H6 which was formulated as “Customer satisfaction is positively mediating between perceived value and Brand loyalty”. Discussion
The determination of this investigation is to scrutinize the mediating effect of customer satisfaction (CS) between corporate image (CI) and brand loyalty (BL), service quality (SQ) and brand loyalty (BL), perceived value (PV) and brand loyalty (BL) in the four services contexts of Pakistan (Gujranwala and Lahore) i.e. hospital, education, bank and hotel sectors. The theoretical framework has been breakdown into three archetypes. The first archetypal attempt to scrutinize the power of SQ on BL via the mediation effect of CS. The second archetypal attempt to review the relationship of CI and BL through mediation of CS. The third and last archetypal attempt to examine the power of PV on BL which mediated by CS.
In first archetypal two hypotheses of this study (H1, H4) were tested. The findings shown that SQ has optimistic and weighty impression on BL as described in table 3 which proven our study hypothesis (H1). Past studies, Hussain (2016) and Lim et al., (2006) too prove significant impact of SQ on BL. To measure the mediation upshot of CS, four paths were described as path a, b, c and c’ as publicized in table 9. The analysis shown that SQ is positively and pointedly influenced by CS (path a), brand loyalty is significantly influenced by customer satisfaction (path b), BL is completely prejudiced by the direct of service quality (path c) and brand loyalty is positively and significantly influenced by the total effect of service quality (path c’). Ultimately, it means customer satisfaction is significantly mediated between service quality and brand loyalty which prove our study hypothesis (H4). Previous studies, Hussain (2016), Osman and Sentosa (2013) and Srivastava and Rai (2013) also prove that CS mediated in the bond of SQ and BL. First model indicates tow key construct that influenced brand loyalty; SQ and CS. As we discussed in the literature, CS has straight upshot on BL (e.g., Anderson & Sullivan, 1993; Lim, et al., 2006; Zeithaml, et al., 1996). When the customers are contented with delivered services this lead them

International Journal of Academic Research in Business and Social Sciences
Vol. 8 , No.2, February 2018, E-ISSN: 2222-6990 © 2018 HRMARS
468
to repurchase the services, this not only leads to increase the BL but also decrease the number of criticisms (Johnson, et al., 2001).
In second archetypal two hypotheses of study (H2, H5) were tested. The results shown that corporate image has optimistic and weighty power on BL as shown in table 4 which support our H2. Previous studies Hussain (2016), Ene and Özkaya (2014) also proves that CI has weighty power on BL. The mediation effect of CS measured through the four paths (path a, b, c and c’) as exposed in table 14. The results indicated corporate image is positively influenced by customer satisfaction (path a), brand loyalty is significantly influenced by customer satisfaction (path b), BL is certainly and significantly predisposed by the direct effect of CI (path c) and brand loyalty positively influenced by the total effect of corporate image (path c’). In conclusion, it means customer satisfaction positively and significantly mediated between corporate image and brand loyalty which prove our study hypothesis (H5). The past studies, Hussain (2016), Ene and Özkaya (2014) and Ishaq et al., (2014) also prove that customer satisfaction positively mediated between CI and BL.
The third archetypal measure the two hypotheses of this study (H3, H6). The findings shown that PV has significant and optimistic power on BL as it shown in the table 5. To measure the mediation upshot of CS between PV and BL, four paths were identified (path a, path b, path c, path c’). the results designate that CS has straight consequence on PV (path a), BL is absolutely prejudiced by customer satisfaction (path b), brand loyalty is positively and significantly prejudiced by the direct effect of PV (path c) and BL is positively and significantly affected by the total effect of perceived value (path c’). In conclusion, it means customer satisfaction positively mediated between perceived value and brand loyalty which prove our study hypothesis (H6). The past studies, Hussain (2016) and Ishaq et al., (2014) also prove the positive mediating upshot of CS amid PV and BL. In this study, we examine the direct relationship of SQ and BL, CI and BL and PV and BL. We also examine the relationships when customer satisfaction interferes between these affairs. Data were collected from the four service sectors of Pakistan (Gujranwala and Lahore) and data were analyzed by SPSS software to prove the relationship of these constructs. Our finding reveals that brand loyalty positively and significantly influenced by SQ, CI and PV. Furthermore, it also shown that CS associated between the relationships of SQ and BL, CI and BL, PV and BL. Significance Theoretical Significance
Hussain (2016) conducted study on the mediation effect of customer satisfaction between SQ, CI and PV in the setting of airline industry of UAE. For future researchers, he suggested to study on these variable in the other context of services industry. Ishaq et al., also conducted study on these variable for FMCG (fast moving consumer goods) in Pakistan and for future researcher, they suggested to conduct study on these variable in the other context especially in Pakistan. So, on the bases of these suggestions, we conduct this study on the four service sectors i.e. hospital, education, bank and hotel context of Pakistan (Gujranwala and Lahore).

International Journal of Academic Research in Business and Social Sciences
Vol. 8 , No.2, February 2018, E-ISSN: 2222-6990 © 2018 HRMARS
469
Practical Significance For manager’s implication, managers should focus on enhancing their quality of services
as it directly affects the perception of customers. Due to the advancement of internet, customers can directly transact with the company and this provide the opportunity to organization to attract new customers through this new communication channel. In the context of services, customers are focusing on the elements of quality services which are trustworthiness, awareness, assurance, solidity, and safety & statement, so, managers should focus on the antecedents of quality services. In services, organization’s service provider directly met and communicate with customers, this has the opportunity to convince the customers and this will lead to enhance the customer’s overall experience and this helps the organization in creation of positive words of mouth.
The impact of corporate image on brand loyalty will increase when customers are satisfied with delivered services. As the demographics of this study shown that majority of respondents (88.3%) are from the age group of 18 to 25, so services organization should sponsor local events like music, sports or charity organizations so this can create the positive perception in the mind of people.
When the customers are satisfied from delivered services, this satisfaction increase the power of PV on BL. PV is what customers think about worth of brand and that is the basic purpose of marketing. The customers of today’s age are aware from all brands and comparing them with each other to examine the value of offered services, so customers will buy the services when they think they perceive value with transaction. So, the managers should focus on delivering quality services to customer and enabling them to perceive value with offered services, it will lead to organization in brand creation of worth in market.
Limitations and Future Direction
The theoretic outline of this investigation has been proposed on the base of theoretical grounds, the results are limited to four service sectors of service industry and the sample used in study is 420. Therefore, the future researchers should increase the number of samples for more valid and authentic results. This study comprises the four service sectors i.e. hospitals, educations, banks and hotel sectors, for future research, the researchers should cover the other service sectors like transportation (Metro bus), airline and telecommunications in the context of Asia especially in Pakistan. The future researcher can also increase the number of variable for sake of better implication e.g. to test the mediating upshot of CS on BL for additional variable like customer complaints or relationship quality.
Conclusion
This investigation is designed to measure the mediating role of customer satisfaction (CS) in four distinct service sectors of Pakistan i.e. hospitals, education, banks and hotels with three distinct frameworks. The first framework measures the power of service quality (SQ) on brand loyalty (BL) while mediation of CS. The second framework investigate the power of corporate image (CI) on BL while mediation of CS. On the other hand, the third framework investigate the power of perceived value (PV) on BL when CS mediates between their relationship. The results of the study confirm the mediation upshot of CS amid the bond of SQ and BL, CI and BL, PV and BL.

International Journal of Academic Research in Business and Social Sciences
Vol. 8 , No.2, February 2018, E-ISSN: 2222-6990 © 2018 HRMARS
470
The first model indicates that CS is positively and significantly mediating, furthermore, when the customers are satisfied from the delivered services, it will increase the impact of SQ on BL. Similarly, CS is correspondingly mediated amid CI and BL, PV and BL; when customers are satisfied from the organization, the relationships of CI and BL, PV and loyalty will be solider. Henceforward, the fragment of CS in these four service sectors of Pakistan is exist. This investigation confirmed the fragment of CS in the four sectors of service industry. Thus, the managers of these sectors should focus on customer satisfaction as it is the reason of stronger relationships of SQ and BL, CI and BL, PV and BL; these constructs are found as the key drivers of enhancing brand loyalty. In short, this study proves the impact of service quality, corporate image and perceived value on brand loyalty and customer satisfaction mediate in their relationship. Furthermore, the results of this study indicates that the brand loyalty can be upgraded in customers of these four service sectors through quality services, values and image.
References Aktepe, C., Baş, M., & Tolon, M. (2009). Müşteri ilişkileri yönetimi. Ankara: Detay Yayıncılık Alam M, Khokhar R (2006). "Impact of Internet on Customer Loyalty in Swedish Banks". J. Econ.
Psychol., 16: 311-29. Anderson, E. W., & Sullivan, M. W. (1993). The antecedents and consequences of customer
satisfaction. Marketing Science, 12(Spring), 125-143. Andreassen, T. W., & Lindestad, B. (1998). Customer loyalty and complex services: The impact of
corporate image on quality, customer satisfaction and loyalty for customers with varying degrees of service expertise. International Journal of Service Industry Management, 9(1), 7-23.
Ashraf, S., Ilyas, R., Imtiaz, M., & Tahir, H. M. (2017). Impact of CSR on Customer Loyalty: Putting Customer Trust, Customer Identification, Customer Satisfaction and Customer Commitment into Equation-A study on the Banking Sector of Pakistan. Int. J. of Multidisciplinary and Current research, 5.
Back, K. J., and S. C. Parks. (2003). “A Brand Loyalty Model Involving Cognitive, Affective, and Conative Brand Loyalty and Customer Satisfaction.” Journal of Hospitality & Tourism Research, 27 (4): 419-35.
Back, K. J., and J. S. Lee. (2009). “Country Club Members’ Perceptions of Value, Image Congruence, and Switching Costs: An Exploratory Study of Country Club Members’ Loyalty.” Journal of Hospitality & Tourism Research, 33 (4): 528-46.
Bitner, M. J., & Hubbert, A. R. (1994). Encounter satisfaction versus overall satisfaction versus quality. Service quality: New directions in theory and practice, 34, 72-94.
Bloemer, J. M. M., K. de Ruyter, and M. Wetzels. (1999). “Linking Perceived Service Quality and Service Loyalty: A Multidimensional Perspective.” European Journal of Marketing, 33 (11/12): 1082-1106.
Chaudhuri, A., and M. B. Holbrook. (2001). “The Chain of Effects from Brand Trust and Brand Affect to Brand Performance: The Role of Brand Loyalty.” Journal of Marketing, 65 (2): 81-93.
Chaudhuri A, Holbrook MB (2002). "The Chain of Effects from Brand Trust and Brand Affect to Brand Performance: The Role of Brand Loyalty April." J. Mark. 65(2): 81-93.
International Journal of Academic Research in Business and Social Sciences
Vol. 8 , No.2, February 2018, E-ISSN: 2222-6990 © 2018 HRMARS
471
Connor, D., & Davidson, J. (1997). Marketing your consulting and professional services. New York: John Wiley and Sons
Cronin, J. J., Brady, J., Michael K., & Hult, G. T. M. (2000). Assessing the effects of quality, value, and customer satisfaction on consumer behavioral intentions in service environments. Journal of Retailing, 76(2), 193-218.
Culiberg, B. (2010). Identifying service quality dimensions as antecedents to customer satisfaction in retail banking. Economic and Business Review, 12(3), 151-166.
Davies, G., & Chun, R. (2002). Gaps between the internal and external perceptions of the corporate brand. Corporate Reputation Review, 5, 144-158.
Day, E. (2002). The role of value in consumer satisfaction. Journal of Consumer Satisfaction, Dissatisfaction and Complaining Behavior, 15, 22.
Dick, A, Basu, K, 1994, “Customer loyalty: toward an integrated conceptual framework”, Journal of the Academy of Marketing Science, 22, 2,00-133.
Donaldson, B. and Runciman, R. (1995), Service quality in further education; An insight into management perceptions of service quality and those of the actual service provider, Journal of Marketing Management, 11(1-3):243-256.
Engel, J. F., Blackwell, R. D., & Miniard, P. W. (1995). Consumer behavior (8th eds.). Fort Worth-Tokyo: The Dryden Press, -992 pp.
Ford, P. (1998), ``Slow down ahead'', Lodging, May, pp. 58-64. Fornell, C., Johnson, M. D., Anderson, E. W., Cha, J., & Bryant, B. E. (1996). The American customer
satisfaction index: Nature, purpose and findings. Journal of Marketing, 60, 7-18. Haigh, D. a. K., J. (2004). ‘‘how to define your brand and determine its value’’. Marketing
Management (13), 24-28. Han, H., and C. Jeong. (2013). “Multi-Dimensions of Patrons’ Emotional Experiences in Upscale
Restaurants and Their Role in Loyalty Formation: Emotion Scale Improvement.” International Journal of Hospitality Management, 32:59-70.
Hofmeyr, J., Rice, B. J. R., & Butch Rice, H. (2003). Commitment-led marketing: the key to brand profits is in the customer's mind. Juta and Company Ltd.
Hoffman, K. D., & Bateson, J. E. (2010). Services marketing: concepts, strategies, & cases. Cengage learning.
Hoisington, S. & Naumann, E. (2003). The loyalty elephant. Quality Progress, 36(2), 33-41. Holbrook, M. B. (1994). The nature of customer value: an axiology of services in the consumption
experience. Service quality: New directions in theory and practice, 21, 21-71. Hsu, C. H. C., H. Oh, and A. G. Assaf. (2012). “A Customer-Based Brand Equity Model for Upscale
Hotels.” Journal of Travel Research, 51 (1): 81-93. Hurley, T. (2004). “Managing Customer Retention in the Health and Fitness Industry: A Case of
Neglect.” Irish Marketing Review, Vol. 17, Iss. 1/2, pp.23-29. Islam, M. S. (2010). The analysis of customer loyalty in Bangladeshi mobile phone industry. World
Journal of Management, 2(2), 130-145. Jacoby, J. (1971). Model of multi-brand loyalty. Journal of advertising research, 11(3), 25-31. Jacoby, J., & Chestnut, R. W. (1978). Brand loyalty: Measurement and management. John Wiley
& Sons Incorporated.

International Journal of Academic Research in Business and Social Sciences
Vol. 8 , No.2, February 2018, E-ISSN: 2222-6990 © 2018 HRMARS
472
Johnson, M. D., Gustafsson, A., Andressen, T. W., Lervik, L., & Cha, J. (2001). The evolution and future of national customer satisfaction index models. Journal of Economic Psychology, 22(2), 217-245.
Kandampully, J.; and Hu, H.H., (2007),"Do hoteliers need to manage image to retain loyal customers?", International Journal of Contemporary Hospitality Management, Vol. 19, No. 6, pp. 435 – 443.
Kim, Y., & Lee, J. (2000). Relationship between corporate image and customer loyalty in mobile communications service markets, Africa Journal of Business Management, 4(18), 4035-4041
Kotler, P., & Fox, K. F. (1995). Strategic marketing for educational institutions. Prentice Hall. Lee, H., Lee, Y., & Yoo, D. (2000). Th e determinants of perceived service quality and its
relationship with satisfaction. Journal of Services Marketing, 14(3), 217-231. Kunanusorn, A., & Puttawong, D. (2015). The mediating effect of satisfaction on student loyalty
to higher education institution. European Scientific Journal, ESJ, 11(10). Lemmink, J., de Ruyter, K. and Wetzels, M. (1998), ``The role of value in the delivery process of
hospitality services'', Journal of Economic Psychology, Vol. 19, April, pp. 159-77. Li, X., and J. Petrick. (2008). “Examining the Antecedents of Brand Loyalty from an Investment
Model Perspective.” Journal of Travel Research, 47 (1): 25-34. Lim, H., Widdows, R., & Park, J. (2006). M-loyalty: winning strategies for mobile carriers. Journal
of Consumer Marketing, 23(4), 208-218. Little, A.B., and Little, D.W. (2009), "The home team approach to service quality: linking and
leveraging communication between human resources, operations and marketing", Journal of organizational culture, communication and conflict, Vol. 13 No. 2, pp.57-70.
Michael K. Brady and Brian L. Bourdeau, J. H. (2005). “the importance of brand cues in intangible service industries: An application to investment services”. Journal of Services Marketing, 401-410
Milo, K, Edson, K.C, McEuen, V, 1989, “The impact of negative publicity on institutional reputation and student college choic3”, college and university, 64, 3, 237-45.
Muhammad Ishtiaq Ishaq, 2011, “Perceived Value, Service quality, Corporate image and customer satisfaction: Empirical Assessment from Pakistan”, Serbian Journal of Management, 7, 1, 25-36
Muhammad Ishtiaq Ishaq, Dr, Mazhar H B, Dr, Asad A H, Rizwan Q and Nazia, 2014, “Role of Corporate image, Product quality and customer value in customer loyalty: Intervening effect of Customer Satisfaction, Journal of basic and applied science research, 4, 4, 89-97.
Nam, J., Y. Ekinci, and G. Whyatt. (2011). “Brand Equity, Brand Loyalty and Consumer Satisfaction.” Annals of Tourism Research, 38 (3): 1009-30.
Nguyen, N., & LeBlanc, G. (2001). Image and reputation of higher education institutions in students' retention decisions. The International Journal of Educational Management, 15(6/7), 303-311.
Nukpezah, D., & Nyumuyo, C. (2009). What Drives customer loyalty and Profitability? Analysis of Perspectives of retail customers in Ghana's Banking Industry.
Oliver, R.L. 1997, Satisfaction: A Behavior Perspective on Consumer, New York: McGraw Hill. Oliver, R. L., & DeSarbo, W. S. (1988). Response Determinants in Satisfaction Judgments. Journal
of Consumer Research, 14(March), 495-507.

International Journal of Academic Research in Business and Social Sciences
Vol. 8 , No.2, February 2018, E-ISSN: 2222-6990 © 2018 HRMARS
473
Oyewole, P., Sankaran, M., & Choudhury, P. (2007). Marketing Airline Services in Malaysia: A Consumer Satisfaction Orientation Approach. Innovative Marketing, 3(1), 56-70
Parasuraman, A., Zeithaml, V. A., & Berry, L. L. (1985). A conceptual model of service quality andits implication. Journal of Marketing, 49(Fall), 41-50.
Parasuraman, A., Zeithaml, V. A., & Berry, L. L. (1988). SERVQUAL: A multiple-item scale for measuring consumer perceptions of service quality. Journal of Retailing, 64(1), 12-40.
Park, J. W., Robertson, R., & Wu, C. L. (2004). The effect of airline service quality on passengers’ behavioral intentions: A Korean case study. Journal of Air Transport Management, 10(6), 435-439.
Paul Mensah Agyei and James M. Kilika, 2014, “Relationship between corporate image and customer loyalty in the Mobile Telecommunication Market in Kenya”, Management Studies, 2, 5, 299-308
Petrick, J. F. (2004). “The Roles of Quality, Value, and Satisfaction in Predicting Cruise Passengers’ Behavioral Intentions.” Journal of Travel Research, 42 (4): 397-407.
Pitt, Leyland F., C. Bruce Kavan and Richard T. Watson (1995), “Service quality: A Measurement of Information Systems Effectiveness”, MIS Quarterly, 19, 173-187
Rahim Hussain, 2016, “The mediating role of Customer Satisfaction: evidence from the airline industry”, Asia Pacific Journal of Marketing and Logistics, 28, 2.
Raj, S. P. (1985). Striking a balance between brand ‘popularity’ and brand ‘loyalty’. Journal of Marketing, 49(1), 53-59.
Raj, S.P, 1985, “Striking a balance between brand ‘popularity’ and brand loyalty”, Journal of marketing, 49, 1, 53-9.
Ravald, A. and GroÈnroos, C. (1996), ``The value concept and relationship marketing'', European Journal of Marketing, Vol. 30 No. 2, pp. 19-30.
Reichheld, F., Sasser, W., & Earl, J. r. (1990). Zero defections: quality comes to services. Harvard Business Review, 5, 105-111.
Rust, R. T., Lemon, K. N., & Zeithaml, V. A. (2004). Return on marketing: Using customer equity to focus marketing strategy. Journal of Marketing, 68(Jan), 109-127.
Ryu, K., H. Han, and T. H. Kim. (2008). “The Relationships among Overall Quick-Casual Restaurant Image, Perceived Value, Customer Satisfaction, and Behavioral Intentions.” International Journal of Hospitality Management, 27 (3): 459-69.
Saravanan, R., & Rao, K. S. P. (2007). Measurement of service quality from the customer’s perspective – An empirical study. Total Quality Management, 18(4), 435-449
Schuler, D. N. B. a. K. C. S. a. D. K. ((2002)). “the brand dependence scale: Measuring consumers’ use of brand name to differentiate among product alternatives”. Journal of Product and Brand Management, 11, 343-356.
Selda Ene and Betül Özkaya, 2014, “A Study on corporate image, customer satisfaction and brand loyalty in the context of retail store”, Asian Social Science, 10, 14.
Sirdeshmukh, D., J. Singh, and B. Sabol. (2002). “Consumer Trust, Value, and Loyalty in Relational Exchanges.” Journal of Marketing, 66 (1): 15-37.
Thomas, S. (2011). What drives student loyalty in universities: An empirical model from India. International Business Research, 4(2), 183.
Tung, L. L. (2004). Service quality and perceived value’s impact on satisfaction, intention and usage of short message service (SMS). Information Systems Frontiers, 6(4), 353–368.
International Journal of Academic Research in Business and Social Sciences
Vol. 8 , No.2, February 2018, E-ISSN: 2222-6990 © 2018 HRMARS
474
Weissman, J, 1990, “Institutional image assessment and modification in college and universities”, Journal of Higher Education Management, 6, 1, 65-75.
Woodruff, R. B. (1997). Customer value: The next source for competitive advantage. Journal of the Academy of Marketing Science, 25(2), 139-153.
Wu, C. C. (2011). The impact of hospital brand image on service quality, patient satisfaction and loyalty. African Journal of Business Management, 5(12), 4873-4882.
Yoo, M., and B. Bai. (2012). “Customer Loyalty Marketing Research: A Comparative Approach between Hospitality and Business Journals.” International Journal of Hospitality Management, 33:166-77.
Zeithaml, V. A. (1988). Consumer perceptions of price, quality and value: A means-end model and synthesis of evidence. Journal of Marketing, 52(July), 2-22.
Zeithaml, V. A., Berry, L. L., & Parasuraman, A. (1996). The behavioral consequences of service quality. Journal of Marketing, 60(2), 31-46.
Zins, A. (2001). Relative attitudes and commitment in customer loyalty models: some experiences in the commercial airline industry. International Journal of Service Industry, 12(3), 269-294.