impact of species-speciï¬c dispersal and regional
TRANSCRIPT
RESEARCH ARTICLE
Impact of species-specific dispersal and regionalstochasticity on estimates of population viabilityin stream metapopulations
Mark S. Poos • Donald A. Jackson
Received: 7 June 2011 / Accepted: 3 November 2011 / Published online: 13 November 2011
� Springer Science+Business Media B.V. 2011
Abstract Species dispersal is a central component of
metapopulation models. Spatially realistic metapopu-
lation models, such as stochastic patch-occupancy
models (SPOMs), quantify species dispersal using
estimates of colonization potential based on inter-
patch distance (distance decay model). In this study
we compare the parameterization of SPOMs with
dispersal and patch dynamics quantified directly from
empirical data. For this purpose we monitored two
metapopulations of an endangered minnow, redside
dace (Clinostomus elongatus), using mark-recapture
techniques across 43 patches, re-sampled across a
1 year period. More than 2,000 fish were marked with
visible implant elastomer tags coded for patch location
and dispersal and patch dynamics were monitored. We
found that species-specific dispersal and distance
decay models provided qualitatively similar rankings
of viable patches; however, there were differences of
several orders of magnitude in the estimated intrinsic
mean times to extinction, from 24 and 148 years to
362 and [100,000 years, depending on the popula-
tion. We also found that the rate of regional stochas-
icity had a dramatic impact for the estimate of species
viability, and in one case altered the trajectory of our
metapopulation from viable to non-viable. The diver-
gent estimates in time to extinction times were likely
due to a combination species-specific behavior, the
dendritic nature of stream metapopulations, and the
rate of regional stochasticity. We demonstrate the
importance of developing comparative analyses using
species- and patch-specific data when determining
quantitative estimates for mean time to extinction,
which in the case of redside dace, were highly
sensitive to different estimates of dispersal.
Keywords Metapopulations �Dispersal � Population
viability analysis � Stochastic patch-occupancy
models � Parameter estimates
Introduction
Species dispersal is a central component in the study of
spatially structured populations. At a landscape scale,
population viability strongly depends on individual
dispersal allowing re-colonisation of empty habitats or
patches (Hanski 1999). For this reason, species
Electronic supplementary material The online version ofthis article (doi:10.1007/s10980-011-9683-2) containssupplementary material, which is available to authorized users.
M. S. Poos (&) � D. A. Jackson
Department of Ecology and Evolutionary Biology,
University of Toronto, 25 Harbord Street, Toronto,
ON M5S 3G5, Canada
e-mail: [email protected];
Present Address:M. S. Poos
Great Lakes Laboratory for Fisheries and Aquatic
Sciences Fisheries and Oceans Canada, 867 Lakeshore
Road, Burlington, ON L7R 4A6, Canada
123
Landscape Ecol (2012) 27:405–416
DOI 10.1007/s10980-011-9683-2

dispersal is considered the ‘glue’ for maintaining local
populations within a network of suitable habitats
(Hansson 1991). The degree of dispersal has an impact
on local population dynamics, on gene flow and on
adaptation to local conditions. For example, low
dispersal can foster isolation and local adaptations
(Resetarits et al. 2005). Alternatively, high species
dispersal can have a stabilizing effect on metapopu-
lation dynamics (Hanski 1999).
Many species with spatially structured populations
are in decline, and population viability models provide
a statistical evaluation of species viability to inform
management decisions (Frank and Wissel 1998;
Akcakaya 2000). Metapopulation viability analyses
provide a spatially realistic evaluation of the local
population structure (Hanski 1999; March 2008). By
quantifying patch dynamics, metapopulation viability
analyses can be used to better understand the impor-
tance of ecological processes such as species specific
dispersal, patch quality and landscape influences
(Moilanen and Hanski 1998), and to inform conser-
vation management through evaluation of minimum
amount of habitat or population size needed to
maintain viability (Hanski 1999; Robert 2009).
Understanding how species-specific dispersal has
the potential to alter metapopulation viability can help
inform management decisions. One popular type of
metapopulation viability analysis are stochastic patch-
occupancy models (i.e. SPOMs), which have been
used extensively to model the viability of spatially
structured populations (Hanski 1999; Moilanen 1999).
SPOMs are comparable to other spatially realistic
models (Kindvall 2000; Ovaskainen and Hanski
2004), and have been used in studies of species with
conservation concern, such as capercaillie (Grimm
and Storch 2000), the American pika and Glanville
fritillary and silver spotted skipper butterflies (Hanski
1999). As SPOMs provide a simplification over
traditional population-viability analyses (Akcakaya
and Sjogren-Gulve 2000), they do not require demo-
graphic or stage data, but only occupancy, coloniza-
tion and extinction rates, which can be easily
estimated from empirical data (Hanski 1994; Hanski
1999; Moilanen 1999; Grimm et al. 2004; Moilanen
2004).
The influence of dispersal on metapopulation
viability is often analyzed using some approximation
of colonization potential (Verboom et al. 1993; Hanski
and Gilpin 1997; Frank and Wissel 2002; Heinz et al.
2005). The easiest approach to describe colonization
potential (i.e. patch accessibility) is as a function of
distance between a starting patch to a target patch and
the ability of species to disperse (Hanski 1994; Hanski
et al. 1996; Heinz et al. 2005). This relationship can be
quantified in several ways; however, most often this
estimation is done by assuming that colonization
potential declines exponentially with distance (i.e.
distance decay; Hanski 1994; Vos et al. 2001; Frank
and Wissel 2002). It is uncertain how well the
assumption of distance decay can model species-
specific dispersal (Heinz et al. 2005). Whether simple
formulae are adequate in describing species- and
patch-specific movement in metapopulation models
remains an open question (Heinz et al. 2005; Marsh
2008).
The objective of this study is to assess the impact of
species-specific dispersal on estimates of metapopu-
lation viability. For our assessment, we conducted a
detailed mark-recapture survey of metapopulation
dynamics of the endangered fish, redside dace
(Clinostomus elongatus), in the Greater Toronto Area,
Ontario, Canada. Redside dace are habitat specialists
preferring headwater pool habitats (COSEWIC 2007).
Prior to our study, there were no data available for
dispersal of redside dace; however, it was commonly
believed that due to their habitat preference that
movement of redside dace would be highly restricted
(COSEWIC 2007). Previous observations of move-
ments by Koster (1939) suggest redside dace disperse
to neighboring pools, and to nearby riffles for
spawning. Such observations are in agreement with
congener species such as the closely related rosyside
dace (C. funduloides), where dispersal was shown to
be limited to between 10–20 m (Hill and Grossman
1987).
Methods
We studied the metapopulation dynamics of redside
dace by monitoring dispersal of tagged individuals on
monthly intervals during a one-year period. For this
study, each location was sub-divided into two areas:
intensively monitored sites where individuals were
tagged and extended sites which were beyond those
areas, which were monitored for tagged fish (Fig. 1).
As meta-populations can be defined in a number of
ways (Hanski 1999), we define a metapopulation as an
406 Landscape Ecol (2012) 27:405–416
123

assemblage of local populations inhabiting spatially
distinct habitat patches (Moilanen and Hanski 1998).
Redside dace live primarily in clear, well-defined
pools (COSEWIC 2007); therefore each spatially
distinct pool segregated by a well-defined riffle (e.g.
a passable, but natural migratory barrier) was selected
as a habitat patch.
We studied metapopulation dynamic of redside
dace at two locations on the Rouge River, including
one location on Leslie Tributary, and the other
location on Berczy Creek (Fig. 1). We choose these
locations as they were previously shown to have
among the highest abundance of redside dace recently
sampled across its entire Canadian range (Reid et al.
2008; Poos et al. ‘‘In Press’’). Leslie Tributary was
sub-divided into 20, connected and distinct patches,
with 10 intensive sites and five extended sites on both
upstream and downstream ends. Similarly, Berczy
Tributary was sub-divided into 13 intensive sites with
five extended sites on each of the upstream and
downstream ends (Fig. 1). The additional three sites in
Berczy Creek were included to standardize sample
locations by river distance.
Sampling was conducted using multiple-pass
depletion surveys at each pool. Using a twenty-foot
bag seine (1/400 mesh) each site was surveyed until
depletion of redside dace, with a minimum of three
sampling events conducted at each site per time
period. At each pool, redside dace were implanted
with visual implant elastomer (VIE) tags color coded
for their location (Plates 1, 2). Elastomer tags were
chosen because they had good tag retention and
negligible effects on survival, growth and behavior
when used on other species (Walsh and Winkelman
2004). Tags were injected subcutaneously near the
anal fin on the ventral surface (Plates 1, 2). All redside
dace were held in well-oxygenated flow-through bins
for 2–4 h to monitor for potential physiological stress,
and then returned to the river at the captured location.
Both intensive and extended sites were re-sampled for
redside dace on monthly intervals except under
winter-ice conditions (November–March) and when
redside dace were spawning (June) so that we did not
disrupt this important life stage for an endangered
species. All redside dace sampled in a recapture event
were examined for the presence of a VIE tag. Redside
dace dispersal and metapopulation dynamics were
tracked and mark-recapture data were recorded. If
redside dace were re-captured at a new location, they
were subsequently tagged posterior to the existing tag,
with a new color code for the recapture location.
We compared the dispersal patterns, such as
average distance dispersed, and proportion of station-
ary tags, of our metapopulations using non-parametric
L6
L8L9
L10
L12L11L13
L17
L18L19
L20
L5
L3L2
L4
L1
L14
L7
L15
B1
B3
B4
B2B5
B6
B7
B8
B9
B10B11
B12B13B14
B15B16B17
B18 B19
B20B21
B23B22
L16
ON,Canada
NY,U.S.A.
(A) (A)Fig. 1 Study sites on
Rouge River, Ontario where
redside dace (Clinostomuselongatus) dispersal and
patch dynamics were
monitored. Study locations:
(A) Leslie Tributary, and
(B) Berczy Creek, were sub-
divided into extensive sites
(black), where redside dace
were tagged with a color-
coded visual implant
elastomer tag, and extended
sites (grey), which were
monitored for tag
movement. Bottom rightRouge River, Ontario is
shown relative to the Great
Lakes, and northeastern
United States
Landscape Ecol (2012) 27:405–416 407
123

Mann–Whitney U-tests and log-linear models (G-tests
with Yates continuity correction; Zar 1999) respec-
tively, in the R language v2.80 (R Development Team
2008).
Determining metapopulation viability
SPOMs use a time-continuous Markov-chain model
(Hanski 1999; Grimm et al. 2004). Each patch (i) is
assumed to be in one of two states, vacant (Xi = 0) or
occupied (Xi = 1). Changes in these states can occur
from a patch becoming vacant due to local extinction
(Xi: 1 ? 0) or correlated extinction (i.e. regional
stochasticity) from another patch (Xj, Xi: 1 ? 0).
Alternatively a vacant patch can become occupied (Xi:
0 ? 1) via colonization from another patch (j). The
state of the whole metapopulation (Xi, … Xn) is given
by a vector of states Xi of these individual patches. The
models were quantified as follows.
Colonization rate
We defined colonization between two patches i and j
(bij) using an incidence-function model (Hanski
1994): bij ¼ y �Mi � expð�dij=diÞ; where y is a param-
eter, and Mi is the number of emigrants from pool i.
We estimated the mean number of emigrants leaving a
pool using data from our tagging study. To account for
the potential uncertainty with missing emigrants
leaving a patch, we quantified the probability of
detection at each pool (PDi) of our surveys using
maximum likelihood from the n-pass depletion sur-
veys with the Bayesian modification (Carle and Strub
1978). These were coded in the R v2.80 (R Develop-
ment Team 2008) using the fisheries-assessment
package FAS (Ogle 2009). We quantified the total
number of emigrants leaving each patch (Mi) per year
as: Mi ¼Pðt1. . .tnÞmixð1þ ð1� PDiÞ; where mi is
the uncorrected number of emigrants. Similar to most
metapopulation models, we used a distance-based
dispersal kernel using a negative exponential decay
(hereafter distance decay), where exp � dij
d0
� �; and dij is
the distance from patch i to patch j and d0 is the mean
dispersal ability of redside dace. Distance decay
dispersal kernels have been used extensively in
metapopulation models and assume that patch acces-
sibility is dependent on distance (Hansson 1991;
Hanski et al. 1996; Moilanen 2004). Distance decay
kernels allow researchers to extrapolate relationships
in patch occupancy, often by using species life-history
characteristics, without the need of labor-intensive
field studies (Moilanen 2004; Heinz et al. 2005).
Unfortunately there are no good field estimates of
redside dace dispersal ability, and as such we had to
define di using empirical dispersal data. For example, we
used the asymptote of a non-linear (polynomial)
regression of mean distance of dispersal of our recap-
tured tags through time to identify potential dispersal
across our patches (Fig. 2). The fit of these non-linear
regressions were highly significant (Leslie Tributary;
r2 = 0.92, P \ 0.01, Berczy Creek; r2 = 0.88,
P \ 0.01) and we found that the average distance
dispersed (di) for a one-year period (one time step in
final SPOM model) was 210 m for redside dace in Leslie
Tributary and 150 m for Berczy Creek (Fig. 2). As we
had several consecutive surveys, it was possible to
estimate y from the number of transitions (i.e. an empty
patch becoming occupied and vice versa; Hanski 1999).
We used a GLM procedure which considered multiple
snapshots of our sampling events using a binomial
distribution and logistic-link function developed in the
R programming language v2.80 (R Development Team
2008) using the incidence function (Oksanen 2004). The
value of the y parameter for Leslie Tributary was 0.0816
and Berczy Creek was 0.0713. Finally, for dij, we
manually created a distance matrix using the river
distance between patches as measured using geographic
information systems.
Extinction rate
Extinction rates can be quantified in many ways
(Hanski 1999). The simplest form of determining
Fig. 2 Distance decay of redside dace dispersal through time.
Shown are mean distance dispersed (m) of recaptured visual
implant elastomer tags used to parameterize species specific
dispersal
408 Landscape Ecol (2012) 27:405–416
123

extinction rate (Ei) is using the area of the patch (Ai),
and given by Ei ¼ e Axi
� ��1, where e defines the
extinction probability of a patch of unit size, and
x defines the scaling of the extinction risk with patch
area (Hanski 1998; Moilanen 2004). This model
assumes that probability of extinction generally
depends on population size, which in turn is usually
given the amount of patch area. This relationship has
been demonstrated on both empirical and theoretical
grounds (Lande 1993; Foley 1994; Hanski 1994;
Hanski et al. 1996; Hanski 1999). Here we model
extinction rates using patch (i.e. pool) depth (d). We
measured patch depth by taking the average of 60
equidistant point measurements quantified using the
Ontario Stream Assessment Protocol (OMNR 2007).
We included patch depth because redside dace are
known to be pool-dwelling species (COSEWIC 2007),
and therefore depth may be more relevant to model
patch dynamics. Indeed, we found that redside dace
abundances were more correlated with patch depth
(r = 0.44, P = 0.0018) than patch area (r = 0.39,
P = 0.0048) or volume (r = 0.40, P = 0.0032; Poos
and Jackson ‘‘unpublished data’’), although we note
that the inclusion of patch depth rather than patch area
did not alter any of the results. We developed our
extinction rate by fitting an incidence function relating
species presence in our patches over time and depth.
For this modeling we used a GLM procedure which
considered multiple snapshots of our sampling events
using a binomial distribution and logistic-link function
developed in the R programming language v2.80
(R Development Team 2008) using the incidence
function (Oksanen 2004). The parameters of the
incidence function for Leslie Tributary and Berczy
Creek were: x = 0.4926, 0.5652; and e = 3.685,
4.187, respectively.
Incorporating dispersal directly
into the metapopulation model
Recent theoretical studies on the impact of species
movement have found that it can alter metapopulation
viability (Heinz et al. 2005; 2006; Revilla and
Wiegand 2008). As such, we extended the incidence
function models by incorporating species dispersal
directly into the metapopulation model using empir-
ical data of patch-specific movement. We used a
model developed by Frank and Wissel (1998; 2002),
which (in this case) is identical to the incidence
function model (outlined above) and allows the
incorporation of patch dynamics (Grimm et al. 2004;
Heinz et al. 2006). This model took into account three
processes; emigration of individuals from occupied
patches, dispersal to a target patch, and the establish-
ment of a new subpopulation on the target patch. The
rate of colonization, bij, was defined as
Mi
ni� rij � 0:5
Ij
0
�
where, Mi was the number of emigrants leaving the
occupied patch i per year (previously defined), ni was
the number of connections from patch i to other
patches, rij was the probability of an individual started
at patch i successfully dispersing to patch j, and Ij was
the number of immigrants needed to establish a new
subpopulation (Frank and Wissel 1998; 2002). For the
probability of dispersal between patches (rij), we
developed a patch-colonization matrix using our
empirical tagging results for each time period. As
our tags were color coded for patch location (at each
time period), we defined rij empirically as the ratio of
tags which started at patch i that dispersed to location j,
across all recaptured tags. In this instance, we did not
account for missing tags as we assumed no tag-related
behavioral response (i.e. fish that were tagged ade-
quately represented dispersal in general). Finally, to
quantify Ij we developed an incidence-function model
of probability that a patch persisted (across all time
periods) given the starting population size of each
patch at the start of our study. For this approach we
used the GLM function with binomial distribution and
logit link in the R programming language v2.80 (R
Development Team 2008). From this model we fitted
the equation for the relationships of establishment/
persistence at any patch given starting population size
(Appendix 1).
Regional stochasticity
Regional stochasticity refers to the level of correlated
extinctions caused by factors influencing a shared
geographic location, such as weather or disease
(Lande 1993; Foley 1994; Lande et al. 1988). Regional
stochasticity has the ability to impact metapopulation
viability by incorporating the influence of the fate of
proximal patches (Grimm and Wissel 2004). We
Landscape Ecol (2012) 27:405–416 409
123

considered the influence of regional stochasticity at
three levels, 0 (no influence of regional stochasticity),
0.1 (a moderate level of regional stochasticity) and 0.2
(more severe regional stochasticity). Although levels
of regional stochasticity are difficult to enumerate in
nature, literature values suggest that rates of catastro-
phes varies among vertebrates from 0 to 0.53 per
generation (mean 0.14/generation), with the vast
majority (i.e.[83%) representing at least a 50% die-
off in species abundances (Reed et al. 2003). Given
that the extent of redside dace remains highly
fragmented in a largely urbanized landscape (COSE-
WIC 2007), it is likely that our levels of regional
stochasticity (e.g. 0.1 and 0.2) are low to moderate
relative to the highly dynamic stream conditions. For
example, rates of small floods have increased by 302%
since urbanization in the Don River, a neighboring
stream (Poos et al. ‘‘In Press’’).
Comparing viability of metapopulations using
differences in dispersal estimates
The ultimate viability of patch (i) was defined using
the intrinsic mean time to extinction Tm = 1/k,
determined using the reciprocal value of the overall
extinction rate k calculated using a plot of -ln(1-
P0(t)), where P0 is the probability of extinction at a
given time (t) (Verboom et al. 1991; Grimm and
Wissel 2004). Intrinsic mean time to extinction has
been previously shown to be an adequate currency in
assessing the viability of metapopulations and can be
easily extracted from simulation data (Frank and
Wissel 1998; Grimm and Wissel 2004; Heinz et al.
2006). Transitions in metapopulations were simulated
10,000 times using ‘stochastic time steps’ (Frank and
Wissel 2002; Grimm et al. 2004) of transition
probabilities of extinction and colonization rates. For
this estimation we used manually created sub-routines
in the software program Meta-X (Frank and Wissel
2002; Grimm et al. 2004), a metapopulation program
flexible for incorporating behavior into metapopula-
tion-viability analysis (Heinz et al. 2006).
Results
In total, we tagged 2,141 redside dace and monitored
their movement across 43 patches during seven
recapture events in a one-year period from 2007 to
2008. Due to logistical issues, we were unable to
sample our stream systems during winter-ice condi-
tions (November–March) and due to ethical concerns
when redside dace were spawning in June given the
potential to disrupt spawning activities. Recapture
rates for redside dace—calculated as the proportion of
fish marked during the preceding marking period/s
that were recaptured—were generally high ([25%)
during our initial four monitoring events, ending in
October 2007. These numbers were greatly reduced by
the following spring, with recapture rates\10% likely
due to high over-winter mortality. In addition, our
capture efficiency—as determined by probability of
detection using our n-pass depletion surveys (Zippin
1958; Carle and Strub 1978)—was also very high for
both study systems: Leslie Tributary (mean 71%) and
Berczy Creek (mean 65.6%; Appendix 1).
Metapopulation dynamics
Metapopulation dynamics of redside dace was char-
acterized by: (1) large number of stationary individ-
uals, and (2) high level of localized, short distance
movements to adjacent pools. Across our eight
sampling events, 41% (Berczy Creek) and 31% (Leslie
Tributary) of individuals were recaptured at the same
location in as where they were tagged. The remaining
movement (88% for Berczy Creek, 61% for Leslie
Tributary) could be classified as localized dispersal,
occurring at \100 m, with 3.8% of individuals
dispersing beyond 300 m (1.5% Berczy Creek, and
8.5% Leslie Tributary). In all cases, dispersal was
higher in Leslie Tributary as compared with the
Berczy Creek. The difference in dispersal was not due
to more tags dispersing as there was no significant
difference in the proportion of stationary tags. More
likely, the increase in dispersal was due to larger
average dispersal per individual, as indicated by mean
and maximum dispersal through time (Fig. 2).
Metapopulation and patch viability
Metapopulation viability, as indicated by both prob-
ability of extinction through time and the intrinsic
mean time to extinction, were orders of magnitude
different depending on whether the patch-occupancy
model was parameterized using distance decay or
directly using observed colonization (Fig. 3; Table 1).
For example, when the patch-occupancy models were
410 Landscape Ecol (2012) 27:405–416
123
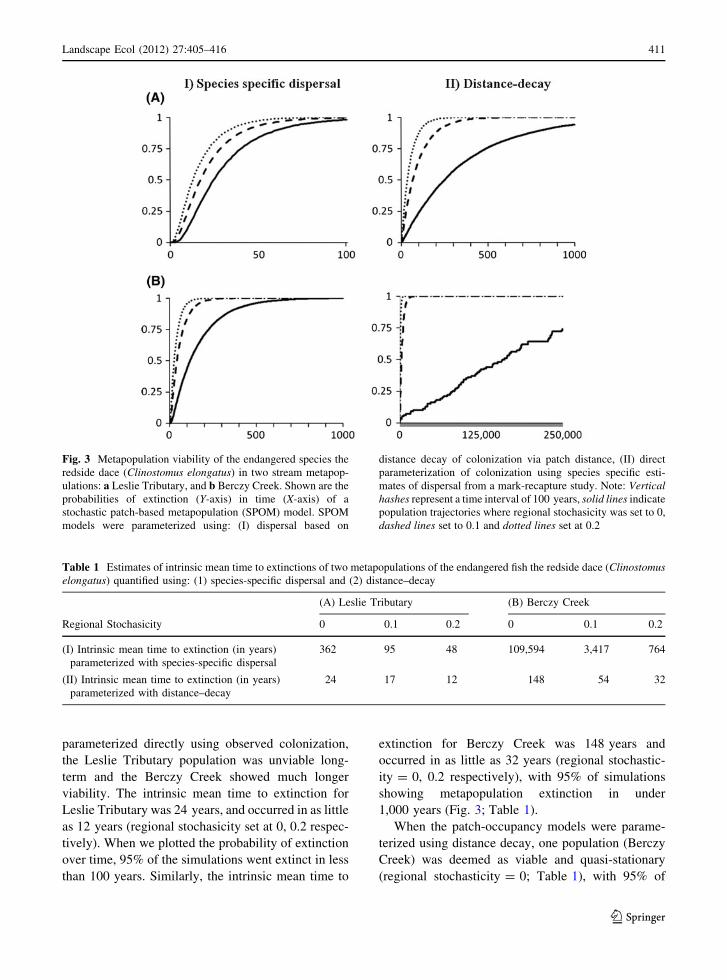
parameterized directly using observed colonization,
the Leslie Tributary population was unviable long-
term and the Berczy Creek showed much longer
viability. The intrinsic mean time to extinction for
Leslie Tributary was 24 years, and occurred in as little
as 12 years (regional stochasicity set at 0, 0.2 respec-
tively). When we plotted the probability of extinction
over time, 95% of the simulations went extinct in less
than 100 years. Similarly, the intrinsic mean time to
extinction for Berczy Creek was 148 years and
occurred in as little as 32 years (regional stochastic-
ity = 0, 0.2 respectively), with 95% of simulations
showing metapopulation extinction in under
1,000 years (Fig. 3; Table 1).
When the patch-occupancy models were parame-
terized using distance decay, one population (Berczy
Creek) was deemed as viable and quasi-stationary
(regional stochasticity = 0; Table 1), with 95% of
Fig. 3 Metapopulation viability of the endangered species the
redside dace (Clinostomus elongatus) in two stream metapop-
ulations: a Leslie Tributary, and b Berczy Creek. Shown are the
probabilities of extinction (Y-axis) in time (X-axis) of a
stochastic patch-based metapopulation (SPOM) model. SPOM
models were parameterized using: (I) dispersal based on
distance decay of colonization via patch distance, (II) direct
parameterization of colonization using species specific esti-
mates of dispersal from a mark-recapture study. Note: Verticalhashes represent a time interval of 100 years, solid lines indicate
population trajectories where regional stochasicity was set to 0,
dashed lines set to 0.1 and dotted lines set at 0.2
Table 1 Estimates of intrinsic mean time to extinctions of two metapopulations of the endangered fish the redside dace (Clinostomuselongatus) quantified using: (1) species-specific dispersal and (2) distance–decay
(A) Leslie Tributary (B) Berczy Creek
Regional Stochasicity 0 0.1 0.2 0 0.1 0.2
(I) Intrinsic mean time to extinction (in years)
parameterized with species-specific dispersal
362 95 48 109,594 3,417 764
(II) Intrinsic mean time to extinction (in years)
parameterized with distance–decay
24 17 12 148 54 32
Landscape Ecol (2012) 27:405–416 411
123

simulations showing viability beyond 250,000 years
(Fig. 3). The remaining population estimates varied
considerably in their viability, ranging in intrinsic
mean times to extinction from 48 to 348 years in
Leslie Tributary and from 764 to[109,000 in Berczy
Creek (regional stochasticity 0.2, 0, respectively).
Specific-patch viability mirrored overall metapopula-
tion viability, with all patches showing reduced
viability when parameterized directly from species
specific data (Fig. 4). In all cases (except L12) patch
viability was over-estimated with the distance decay
(Fig. 3). Mean patch viability was significantly higher
with the use of distance decay relative to species
specific data in all SPOMs for both Leslie Tributary
(mean patch viability using distance decay = 0.51 ±
0.10, mean patch viability using species specific
dispersal = 0.35 ± 0.08; Welch’s t-test; t = 26.85,
P value � 0.0001) and Berczy Creek (mean patch
viability using distance decay = 0.69 ± 0.09, mean
patch viability using species specific dispersal =
0.39 ± 0.08; Welch’s t-test; t = 11.204, P value �0.0001).
Interestingly, the rankings of patch viability did not
markedly differ based on the parameterization of the
SPOM. For example, SPOMs using both distance
decay and species specific dispersal identified the same
five most-viable patches per population (overall) as:
L6, L8, L10, L11, L9 and B7, B13, B6, B11, B18. One
notable difference in patch viability was that several
patches that were in close proximity to good-quality
patches had significantly lower viability when param-
eterized using species specific dispersal (Fig. 4).
Specifically, patches L9, L11, B6 and B9 had reduced
viabilities when parameterized using species specific
data relative to distance decay (mean patch viability
using distance decay = 0.57, 0.84, 0.86, 0.90, respec-
tively; mean patch viability using species specific
dispersal = 0.28, 0.46, 0.63, 0.17; Fig. 4).
Discussion
Metapopulation-viability models have a long history
of use (Hanski 1999) and provide advantages over
traditional population-viability analyses (PVAs). One
clear advantage of using stochastic patch-occupancy
metapopulation models (SPOMs) over traditional
PVAs (e.g. structured models, demographic models;
Akcakaya, Sjogren-Gulve 2000; Morris and Doak
2002) is that they require the parameterization of
fewer variables (Ovaskainen and Hanski 2004). This
reduction is especially advantageous for modeling
endangered species, where enumeration is compli-
cated by rarity and where greater uncertainty exists
(Akcakaya 2000). As incorporating species-specific or
demographic data into ecological studies can be
difficult, time consuming, or not economically possi-
ble; simplification is often needed. SPOMs allow for
simplification of metapopulations, as only patch
occupancy, colonization and extinction rates are
needed, even within a single snapshot (Moilanen
2004; Marsh 2008).
There is a tradeoff between simplification of PVAs
by using less parameters and with the added value and
information that those parameters may have. In this
study, we show that differences in species dispersal
patterns, a key component of metapopulation models
such as SPOMs, have the ability to dramatically
impact estimates of metapopulation viability. Species-
specific dispersal reduced estimates of viability of
redside dace metapopulations by several orders of
magnitude over estimates using distance–decay mod-
els. In one case, in Berczy Creek, the distance decay
model suggested that redside dace were viable, while
the same model estimated using species specific data
Fig. 4 Differences in patch viability using dispersal parame-
terized using distance decay (Y-axis) and species specific data
(X-axis) of the endangered species the redside dace (Clinosto-mus elongatus). Patches are shown from intensively monitored
sites from two stream metapopulations: A) Leslie Tributary (L6-
L15), and B) Berczy Creek (B6-B18). Shown are the mean
probabilities of persistence of a given patch across 10,000
simulations with 25% quantiles shown on the negative axes and
75% quantiles shown on positive axes. A 1:1 line is super-
imposed to demonstrate agreement between patch viabilities
412 Landscape Ecol (2012) 27:405–416
123
suggested that the populations were not viable
(regional stochasticity = 0; Fig. 3). These results
demonstrate the importance of dispersal in SPOMs,
as others have noted previously (Verboom et al. 1991;
Heinz et al. 2005; Schtickzelle et al. 2006). Perhaps
more importantly these results should emphasize
caution with the use of naive dispersal estimates, such
as distance decay models, which may not account for
species specific differences. These conclusions are in
agreement with others who suggest that better inte-
gration of species-specific behaviour is needed into the
analyses of metapopulations (Tischendorf 2001; Vos
et al. 2001; Heinz et al. 2005, 2006; Baguette and
vanDyck 2007; Marsh 2008).
Developing robust estimates of species specific
dispersal is important to allow for accurate metapop-
ulation viability models and to ensure appropriate
management action. Although in all cases our species-
specific estimates of dispersal (e.g. 150–210 m)
produced metapopulation projections moving towards
extinction, it appears our estimates of mean time to
extinction may, if anything, be conservative. Prior to
our study, little was known about the dispersal of
redside dace. Generally, it was accepted that as redside
dace were habitat specialists and dispersal would be
limited to adjacent pools, with slightly larger dispersal
towards riffles during spawning (Koster 1939; COSE-
WIC 2007). Therefore our estimates of dispersal of
redside dace are higher than previously shown, as well
as higher for many of its congeners (Hill and
Grossman 1987). For example, dispersal estimates
can be estimated using well known correlations with
body size allometry (sensu Minns 1995). Given
average adult (i.e. reproductive) length of redside
dace ranges between 48 (age 2? individuals) to 78 m
(McKee and Parker 1982); dispersal of redside dace
based on body size is estimated between 32–72 m
(Poos ‘‘unpublished data’’). Additionally, previous
estimates of a close conger the rosyside dace, suggest
dispersal limited to 10–20 m, with site fidelity close to
80% (Hill and Grossman 1987). These data suggest
that our species specific estimates of dispersal, if
anything were high, and that the estimated mean time
to extinction may actually be lower. Nonetheless, it
appears that the redside dace is a species moving
towards extinction and not—as the case in one
metapopulation viability model based on distance
decay—a species with high likelihood of long term
persistence.
There are many species specific behaviors which
may account for the divergent dispersal estimates
between species specific dispersal and the distance
decay model (Roitberg and Mangel 1997; Heinz et al.
2006; Baguette and vanDyck 2007). First, many small-
bodied fishes often school with a mixture of other
species to reduce predation pressure. Redside dace are
known to school with other more common minnow
species such blacknose dace (Rhinichthys atratulus),
creek chub (Semotilus atromaculatus), and common
shiner (Luxilus cornutus; COSEWIC 2007). Given
that densities of redside dace remain below more
common species, ecological theory suggests that the
advantage of this indirect trait mediated interaction is
to enhance prey coexistence and mutualism (Bolker
et al. 2003). Second, many fishes utilize reproductive
tactics that require trait mediated interactions that may
further alter rates of species specific dispersal. For
example, many fishes parasitize nests built by cong-
eners. This reproductive strategy has not only ener-
getic benefits but is also thought to help reduce
predation pressure of juveniles (Novinger and Coon
2000). Theoretical examples of simple communities
(e.g. one predator, two prey systems) suggest that
these types of indirect trait mediated interactions can
act as both a stabilizing and de-stabilizing pressures
for ecological communities (see Bolker et al. 2003 for
review). Therefore, dispersal of redside dace may be
due to a combination of predator avoidance and
reproductive strategy; which may act differently than
the distance decay model, or optimal foraging theory
suggest (Pierce and Ollason 1987).
Accounting for regional and stochastic processes
are important considerations for the management of
endangered species. In this study, regional stochastic-
ity had a strong influence on intrinsic mean time to
extinction. For example, when we altered the rate of
regional stochasticity, the intrinsic mean time to
extinction quickly decreased (Table 1). In cases where
populations were already considered to be unviable
(e.g. Leslie Tributary with 0 stochasicity), the impact
of regional stochasticity was small; in comparison to
when populations were viable or quasi-stationary (e.g.
Berczy Creek with 0 stochasticity), where it had an
enormous impact (Fig. 3). For example, in one case,
when regional stochasicity was ignored, Berczy Creek
was considered to be viable (Table 1). Altering rates
of regional stochasticity from 0 to 0.1 and 0.2 caused
the populations to quickly go to extinction (intrinsic
Landscape Ecol (2012) 27:405–416 413
123

mean time to extinction dropped from[109,000 to 54
and 32 years, respectively). Although the rates of
environmental stochasticity are difficult to enumerate,
previous attempts to quantify both the frequency and
severity of stochastic events were both within our low
and high we used here (Reed et al. 2003). Our results
suggest that regional stochastic factors (e.g. weather,
drought) which may alter patch dynamics, can have
undue influence on metapopulation viability (Lande
1993; Foley 1994; Robert 2009).
The dendritic nature of stream systems provides
unique characteristics from which to study metapop-
ulation dynamics. Unlike most terrestrial systems,
stream metapopulations act in a linear, stepping stone
fashion, where species must disperse through one
patch in order to reach another. This linear spatial
arrangement is advantageous for monitoring coloni-
zation and extinction in a metapopulation framework,
as we were able to monitor of all patches (i.e. pools)
and their connections; however, it may also hinder
long distance dispersal. Individuals who disperse must
decide between staying at a current habitat patch or
expend energy to move further upstream or down-
stream. In this study, we found that stream metapop-
ulations were best described by dispersal of short to
intermediate distances. We found that regardless of
time period, of the tags we recaptured, between 75 and
90% of tags were recaptured within 350 m of their
starting pool (Appendix 1). Although it is possible that
in some cases, patch colonization may be under-
estimated in our empirical model because of the
potential for long-distance dispersal, our monitoring
of patches beyond our study areas demonstrated that
this is likely not the case here. In addition, dendritic
stream networks can provide additional rescue poten-
tial not considered in terrestrial systems (Fagan 2002),
which may reduce the requirement for long distance
dispersal. For example, increased genetic variation
can occur due to the existence of additional isolation in
dendritic networks and downstream propagule rain of
novel alleles (Gotelli 1991; Morrissey and de Ker-
ckhove 2009). Although we rarely found asynchrony
in dispersal (i.e. Fall, Berczy Creek, G-test, P \ 0.05;
Fig. 2), recent theoretical studies suggest that genetic
variation may be enhanced in stream metapopulation
with even small levels of asynchrony (i.e. propagule
rain) or across short time periods (Morrissey and de
Kerckhove 2009). As such, one hypothesis regarding
the differences between our empirical dispersal
estimates and distance decay, may be due to the
behavior of individuals within a linear stream network.
Understanding how a linear spatial arrangement may
alter metapopulation dynamics remains an important
challenge for future research in landscape ecology.
It remains an open question on how best to treat
stream fishes in a metapopulation framework. Stream
fish do not likely fit classic Levin’s type metapopu-
lation models due to asyncrony in movement (Gotelli
and Taylor 1999; Morrissey and de Kerckhove 2009)
and/or linear spatial arrangement of stream networks.
In some cases, these may cause problems with in the
performance of metapopulation models (Gotelli and
Taylor 1999). However, recent advancements suggest
that metapopulation models, such as SPOMs, are
robust to the assumptions of a classic metapopulation
models, and that they can handle a range of spatially
structured populations: from classic metapopulations
to species found in fragmented landscapes with patchy
distributions (Ovaskainen and Hanski 2004). Our
study demonstrates that this may be true in a
qualitative sense only. For example, despite finding
large differences in the prediction of intrinsic mean
time to extinction (Table 1), we also found that
regardless of how the SPOMs were parameterized,
there were minimal qualitative differences between
the use of traditional metapopulation models (e.g.
using distance–decay) and those modeled with empir-
ical data collected from stream fish metapopulations
(Fig. 3). However, our results should cast doubt on
whether intrinsic mean times to extinction can be
reliably estimated in stream metapopulations. As
others empirical studies have noted, large temporal
variation in patch dynamics (i.e. colonization and
extinction rates) can lead to sensitivity in SPOMs
(Ovaskainen 2004; Heinz et al. 2005); and these in
turn can lead to drastic differences in the estimated
mean time to extinctions. As Revilla and Wiegand
(2008) suggest; it is likely that the best way to improve
conservation and management of stream metapopula-
tions, is through improved understanding in the
processes behind the variability shown between (and
within) patch dynamics, rather than attempt to see how
those may be used to estimate quantitative extinction
times.
Incorporating species-specific dispersal into meta-
population models may help inform management
decisions. In this study, we show that empirical
estimation of patch viability may be qualitatively
414 Landscape Ecol (2012) 27:405–416
123
similar when parameterizing SPOMs, but that esti-
mates of metapopulation viability can be altered by
orders of magnitude. By incorporating species- and
patch-specific data directly into metapopulation mod-
els, managers may be better at determining the relative
importance of spatial and temporal factors (McCoy
and Mushinsky 2007). Additionally, quantifying spe-
cies- and patch-specific dispersal, as done here, may
be expensive both in time and money, and superfluous
if they provide similar responses to distance–decay
dispersal kernels. Unfortunately, we demonstrate that
not to be the case as species-specific behavior may
provide alternative dispersal patterns. We also dem-
onstrate the potential impact of regional processes (i.e.
regional stochasticity); which can drastically reduce
estimates of mean times to extinction. Overall this
study demonstrates that care is needed in ensuring
that even simplified metapopulation models, such as
SPOMs, reflect biological data. Comparisons of how
species- and patch-specific data directly impact meta-
population models may be one way to help ensure
appropriate management actions for endangered spe-
cies (Dreschler et al. 2003; Grimm et al. 2004). Future
research on how to parameterize species and patch-
specific dispersal will only help aid in developing
robust tools for conservation management (Heinz et al.
2006; Baguette and vanDyck 2007; McCoy and
Mushinsky 2007).
Acknowledgments Funding was provided by NSERC Canada
and OGS Scholarships to M. S. P., an NSERC Discovery Grant
to D. A. J., and funding provided by Fisheries and Oceans (IRF
1410). All field work was conducted under an approved Animal
Care Protocol (# 20006805) from the University of Toronto
Animal Care Committee. Field work was conducted by a
dedicated group of volunteers from- the University of Toronto–
A. Drake, C. Harpur, B. Edwards, M. St. John, M. Neff, P.
Venturelli, M. Granados, J. Ruppert, S. Sharma, N. Puckett, C.
Hart, and S. Walker—and the Toronto Region Conservation
Authority–D. Lawrie, C. Tu, T. Parker, T. Rance, B. Paul, E.
Elton, B. Stephens, and L. DelGiudice; and volunteers from
Citizen Scientists. This work was improved by discussion with
Marie-Josee Fortin and two reviewers of earlier drafts of this
manuscript.
References
Akcakaya HR (2000) Viability analyses with habitat-based
metapopulation models. Popul Ecol 42(1):45–53
Akcakaya HR, Sjogren-Gulve P (2000) Population viability
analysis in conservation planning: an overview. Ecol
Bulletins 48:9–21
Baguette M, VanDyck H (2007) Landscape connectivity and
animal behavior: functional grain as a key determinant for
dispersal. Landscape Ecol 22(8):1117–1129
Bolker B, Holyoak M, Krivan V, Rowe L, Schmitz O (2003)
Connecting theoretical and empirical studies of trait-
mediated interactions. Ecology 84:1101–1114
Carle FL, Strub MR (1978) A new method for estimating pop-
ulation size from removal data. Biometrics 34:621–630
COSEWIC (2007) COSEWIC assessment and update status
report on the redside dace Clinostomus elongatus in Can-
ada. Committee on the Status of Endangered Wildlife in
Canada, Ottawa, pp 54
Dreschler M, Frank K, Hanski I, O’Hara RB, Wissel C (2003)
Ranking metapopulation extinction risk: from patterns in
data to conservation management decisions. Ecol Appl
13:990–998
Fagan WF (2002) Connectivity, fragmentation, and extinc-
tion risk in dendritic metapopulatoins. Ecology 83(12):
3243–3249
Foley P (1994) Predicting extinction times from environmental
stochasticity and carrying capacity. Conserv Biol 8(1):
124–137
Frank K, Wissel C (1998) Spatial aspects of metapopulation
survival: from model results to rules of thumb for land-
scape management. Landscape Ecol 13:363–379
Frank K, Wissel C (2002) A formula for the mean lifetime of
metapopulations in heterogeneous landscapes. Am Nat
159:530–552
Gotelli NJ (1991) Metapopulation models: the rescue effect, the
propagule rain, and the core-satelite hypothesis. Am Nat
138:768–776
Gotelli NJ, Taylor CM (1999) Testing metapopulation models
with stream-fish assemblages. Evol Ecol Res 1:835–845
Grimm V, Storch I (2000) Minimum viable population size of
capercaillie Terao urogallus: results from a stochastic
model. Wildl Biol 5:219–225
Grimm V, Wissel C (2004) The intrinsic mean time to extinc-
tion: a unifying approach to analysing persistence and
viability of populations. Oikos 105(3):501–511
Grimm V, Lorek H, Finke J, Koester F, Malachinski M, Son-
nenschein M, Moilanen A, Storch I, Singer A, Wissel C,
Frank, K (2004) META-X: generic software for meta-
population viability analysis. Biodivers Conserv 13:
165–188
Hanski I (1994) A practical model of metapopulation dynamics.
J Anim Ecol 63(1):151–162
Hanski I (1998) Connecting the parameters of local extinction
and metapopulation dynamics. Oikos 83(2):390–396
Hanski I (1999) Metapopulation ecology. Oxford University
Press, New York
Hanski I, Gilpin ME (1997) Metapopulation biology: ecology,
genetics, and evolution. Academic Press, San Diego
Hanski I, Moilanen A, Pakkala T, Kuussaari M (1996) The
quantitative incidence function model and persistence of an
endangered butterfly metapopulation. Conserv Biol 10(2):
578–590
Hansson L (1991) Dispersal and connectivity in metapopula-
tions. Biol J Linn Soc 42:89–103
Heinz SK, Conradt L, Wissel C, Frank K (2005) Dispersal in
fragmented landscapes: deriving a practical formula for
patch accessibility. Landscape Ecol 20:83–99
Landscape Ecol (2012) 27:405–416 415
123
Heinz SK, Wissel C, Frank K (2006) The viability of meta-
populations: individual dispersal behaviour matters.
Landscape Ecol 21:77–89
Hill J, Grossman GD (1987) Home range estimates for three
North American stream fishes. Copeia 1987(2):376–380
Kindvall O (2000) Comparative precision of three spatially
realistic simulation models of metapopulation dynamics.
Ecol Bulletins 48:101–110
Koster WJ (1939) Some phases in the life history and relation-
ships of the cyprinid Clinostomus elongatus (Kirtland).
Copeia 1939:201–208
Lande R (1993) Risks of population extinction from demo-
graphic and environmental stochasticity and random
catastrophes. Am Nat 142:911
Lande R, Engen S, Saether BE (1988) Extinction times in finite
metapopulation models with stochastic local dynamics.
Oikos 83(2):383–389
Marsh D (2008) Metapopulation viability analysis for amphib-
ians. Anim Conserv 11(6):463–465
McCoy EG, Mushinsky HR (2007) Estimates of minimum patch
size depend on the method of estimation and the condition
of habitat. Ecology 88(6):1401–1407
McKee PM, Parker BJ (1982) The distribution biology and status
of the fishes campostoma-anomalum clinostomus-elonga-
tus notropis-photogenis cyprinidae and fundulus-notatus
cyprinodontidae in Canada. Can J Zool 60(6):1347–1358
Minns CK (1995) Allometry of home range size in lake and river
fishes. Can J Fish Aquat Sci 52:1499–1508
Moilanen A (1999) Patch occupancy models of metapopulation
dynamics: efficient parameter estimation using implicit
statistical inference. Ecology 80(3):1031–1043
Moilanen A (2004) SPOMSIM: software for stochastic patch
occupancy models of metapopulation dynamics. Ecol
Model 179:533–550
Moilanen A, Hanski I (1998) Metapopulation dynamics: effects
of habitat quality and landscape structure. Ecology 79:
2503–2515
Morris WF, Doak DF (2002) Quantitative conservation biology:
theory and practice of population viability analysis. Sina-
uer Associates Inc., Sutherland
Morrissey MB, de Kerckhove DT (2009) The maintenance of
genetic variation due to asymmetric gene flow in dendritic
metapopulations. Am Nat 174:875–889
Novinger DC, Coon TG (2000) Behavior and physiology of the
redside dace, Clinostomus elongatus, a threatened species
in Michigan. Environ Biol Fish 57:315–326
Ogle DH (2009) Functions to support fish stock assessment text-
book (v.0.0-8). http://www.ncfaculty.net/dogle/. Accessed
12 Jan 2009
Oksanen J (2004) Incidence function model in R. http://cc.
oulu.fi/*jarioksa/opetus/openmeta/metafit.pdf. Accessed
12 Feb 2009
OMNR (2007) Stream assessment protocol for southern
Ontario. Ontario Ministry of Natural Resources, Picton,
Ontario
Ovaskainen O (2004) Habitat-specific movement parameters
estimated using mark-recapture data and a diffusion model.
Ecology 85:242–257
Ovaskainen O, Hanski I (2004) From individual behavior to
metapopulation dynamics: unifying the patchy population
and classic metapopulation models. Am Nat 164(3):364–377
Pierce GJ, Ollason JG (1987) Eight reasons why optimal for-
aging theory is a comlete waste of time. Oikos 49:111–118
Poos MS, Lawrie D, Tu C, Jackson DA Estimating local and
regional population sizes for an endangered minnow, red-
side dace (Clinostomus elongatus), in Canada. Aquatic
Conservation: Marine and Freshwater Ecosystems (in
press)
R Development Core Team (2008) A language and environment
for statistical computing. R Foundation for statistical
computing, Vienna, Austria. (ISBN: 3-900051-07-0)
Reed DH, O’Grady JJ, Ballou JD, Frankham R (2003) The
frequency and severity of catastrophic die-offs in verte-
brates. Anim Conserv 6:109–114
Reid SM, Jones NE, Yunker G (2008) Evaluation of single-pass
electrofishing and rapid habitat assessment for monitoring
redside dace. North Am J Fish Manag 28(1):50–56
Resetarits WJ, Binckley CA, Chalcraftet DR (2005) Habitat
selection, species interactions, and processes of community
assembly in complex landscapes: a metacommunity per-
spective. In: Holyoak M, Leibold MA, Holt RD (eds)
Metacommunities—spatial dynamics and ecological
communities. The University of Chicago Press, Chicago,
pp 374–398
Revilla E, Wiegand T (2008) Movement ecology special fea-
ture: individual movement behavior, matrix heterogeneity,
and the dynamics of spatially structured populations. Proc
Natl Acad Sci 105:19120–19125
Robert A (2009) The effects of spatially correlated perturbations
and habitat configuration on metapopulation persistence.
Oikos 118(10):1590–1600
Roitberg BD, Mangel M (1997) Individuals on the landscape:
behavior can mitigate landscape differences among habi-
tats. Oikos 80:234–240
Schtickzelle N, Mennechez G, Baguette M (2006) Dispersal
depression with habitat fragmentation in the bog fritillary
butterfly. Ecology 87:1057–1065
Tischendorf L (2001) Can landscape indices predict ecological
processes consistently? Landscape Ecol 16:235–254
Verboom J, Lankester K, Metz JAJ (1991) Linking local and
regional dynamics in stochastic metapopulation models.
Biol J Linn Soc 42:39–55
Verboom J, Metz JAJ, Meelis E (1993) Metapopulation models
for impact assessment of fragmentation. In: Vos CC, Op-
dam P (eds) Landscape ecology of a stressed environment.
Chapman and Hall, London, pp 172–192
Vos CC, Verboom J, Opdam PFM, ter Braak CJF (2001) Toward
ecologically scaled landscape indices. Am Nat 157:24–41
Walsh MG, Winkelman DL (2004) Anchor and visible implant
elastomer tag retention by hatchery rainbow trout stocked
into an Ozark stream. N Am J Aquaculture 24:1435–1439
Zar JH (1999) Biostatistical analysis. Prentice Hall, Upper
Saddle River
Zippin C (1958) The removal method of population estimation.
J Wildl Manag 22:82–90
416 Landscape Ecol (2012) 27:405–416
123