impact of surface and near-surface processes on ice ... · a. beck et al.: impact of surface and...
TRANSCRIPT

Atmos. Chem. Phys., 18, 8909–8927, 2018https://doi.org/10.5194/acp-18-8909-2018© Author(s) 2018. This work is distributed underthe Creative Commons Attribution 4.0 License.
Impact of surface and near-surface processes on ice crystalconcentrations measured at mountain-top research stationsAlexander Beck1, Jan Henneberger1, Jacob P. Fugal2, Robert O. David1, Larissa Lacher1, and Ulrike Lohmann1
1ETH Zurich, Institute for Atmospheric and Climate Science, Universitätstrasse 16, 8092 Zurich, Switzerland2Johannes Gutenberg-Universität Mainz, Institute for Atmospheric Physics, J.-J.-Becherweg 21, 55099 Mainz, Germany
Correspondence: Alexander Beck ([email protected]) and Jan Henneberger ([email protected])
Received: 4 July 2017 – Discussion started: 10 October 2017Revised: 13 May 2018 – Accepted: 11 June 2018 – Published: 27 June 2018
Abstract. In situ cloud observations at mountain-top re-search stations regularly measure ice crystal number con-centrations (ICNCs) orders of magnitudes higher than ex-pected from measurements of ice nucleating particle (INP)concentrations. Thus, several studies suggest that mountain-top in situ cloud microphysical measurements are influencedby surface processes, e.g., blowing snow, hoar frost or rimingon snow-covered trees, rocks and the snow surface. This lim-its the relevance of such measurements for the study of mi-crophysical properties and processes in free-floating clouds.
This study assesses the impact of surface processes onin situ cloud observations at the Sonnblick Observatory inthe Hohen Tauern region, Austria. Vertical profiles of ICNCsabove a snow-covered surface were observed up to a heightof 10 m. The ICNC decreases at least by a factor of 2 at 10 mif the ICNC at the surface is larger than 100 L−1. This de-crease can be up to 1 order of magnitude during in-cloudconditions and reached its maximum of more than 2 orders ofmagnitudes when the station was not in cloud. For one casestudy, the ICNC for regular and irregular ice crystals showeda similar relative decrease with height. This suggests that ei-ther surface processes produce both irregular and regular icecrystals or other effects modify the ICNCs near the surface.Therefore, two near-surface processes are proposed to enrichICNCs near the surface. Either sedimenting ice crystals arecaptured in a turbulent layer above the surface or the ICNC isenhanced in a convergence zone because the cloud is forcedover a mountain. These two processes would also have animpact on ICNCs measured at mountain-top stations if thesurrounding surface is not snow covered. Conclusively, thisstudy strongly suggests that ICNCs measured at mountain-
top stations are not representative of the properties of a cloudfurther away from the surface.
1 Introduction
Cloud microphysical properties (e.g., phase composition,cloud particle number concentrations and size distributions)next to dynamical processes are key parameters for thecloud’s lifetime, the cloud extent and the intensity of pre-cipitation they produce (Rotunno and Houze, 2007). In par-ticular, orographic precipitation plays a crucial role for theworld’s water resources, as the headwaters of many rivers arelocated in alpine regions (Roe, 2015). In the midlatitudes,mixed-phase clouds (MPCs) consisting of a mixture of icecrystals and supercooled liquid droplets produce 30 to 50 %of liquid precipitation (Mülmenstädt et al., 2015) due to therapid growth of ice crystals to precipitation size in the pres-ence of supercooled liquid droplets. This is due to a highersaturation vapor pressure over liquid water than over ice, andthus ice crystals grow at the expense of evaporating clouddroplets. This process was first described in the works ofBergeron (1935), Findeisen (1938) and Wegener (1911) andis referred to as the Wegener–Bergeron–Findeisen (WBF)process. As such, correctly representing the fraction of icein orographic MPCs is crucial for accurate weather and wa-ter resource predictions in alpine terrain.
In situ measurements are important to further improve ourunderstanding of the microphysical properties and funda-mental processes of orographic MPCs (Baumgardner et al.,2011) and are frequently conducted at mountain-top researchstations. Despite an improved understanding of the origin of
Published by Copernicus Publications on behalf of the European Geosciences Union.

8910 A. Beck et al.: Impact of surface and near-surface processes on ice crystal concentrations
ice crystals from nucleation (DeMott et al., 2010; Hoose andMöhler, 2012; Murray et al., 2012; Boose et al., 2016) andsecondary ice-multiplication processes (Field et al., 2017),the source of most of the ice crystals observed at mountain-top stations and their impact on the development of the cloudremains an enigma (Lohmann et al., 2016).
In situ observations with aircraft usually observe ICNCson the order of 1–10 L−1 (Gultepe et al., 2001), whereasat mountain-top research stations (e.g., Elk Mountain, USAor Jungfraujoch, Switzerland) or near the snow surface inthe Arctic ICNCs of several hundreds to thousands per literare frequently reported (Rogers and Vali, 1987; Lachlan-Cope et al., 2001; Lloyd et al., 2015), which exceeds thenumber of measured ice nuclei by several orders of mag-nitude (see Fig. 18). This discrepancy between ice nucleiand ICNC may be explained by so-called secondary ice-multiplication processes. A commonly accepted secondaryice-multiplication process to enhance ICNCs in free-floatingclouds is the rime-splintering or Hallett–Mossop process.This process describes the production of small splinters afterthe impact of cloud droplets on ice crystals and a subsequentburst of the cloud droplet during its freezing process. It is ac-tive only in a small temperature range of−3 to−8 ◦C and thepresence of small (<∼ 13 µm) and large (>∼ 25 µm) clouddroplets is required (Hallett and Mossop, 1974; Choulartonet al., 1980). Another secondary ice-multiplication process isthe fracturing of fragile ice crystals upon collision with othersolid cloud particles (Vardiman, 1978; Griggs and Choular-ton, 1986). Although this process has been studied in the laband is expected to occur at temperatures of ∼−15 ◦C, thereis little evidence from field measurements for this processto significantly contribute to the ICNC (e.g., Lloyd et al.,2014; Crosier et al., 2011; Crawford et al., 2012). Other pro-cesses that produce secondary ice crystals are associated withthe freezing of cloud droplets and the subsequent breakup orejection of small spicules (Lauber et al., 2018). In previousstudies, the described secondary ice-multiplication in free-floating clouds like fragmentation (Rangno and Hobbs, 2001)or the Hallett–Mossop process (Hallett and Mossop, 1974) isusually ruled out as the source of the observed ice crystalsdue to the absence of large ice crystals necessary for frag-mentation or the absence of large cloud droplets and the righttemperature range necessary for the Hallett–Mossop process.Instead, surface processes are proposed to produce such enor-mous ICNCs. Rogers and Vali (1987) suggested two possibleprocesses as a source of the observed ICNC: riming on trees,rocks and the snow surface or the lofting of snow particlesfrom the surface, i.e., blowing snow. Riming as a surface pro-cess is similar to the previously described rime-splinteringprocess in free-floating clouds. For this process to be active,cloud droplets need to be present near the surface, as is typ-ically the case with orographic mixed-phase clouds. Blow-ing snow, on the other hand, can also occur without a cloudpresent and can be frequently observed visually in winter atmountain ridges (Geerts et al., 2015). In addition, Lloyd et al.
(2015) suggested hoar frost as a wind-independent surfaceprocess causing ICNCs larger than 100 L−1 for which theydid not observe a wind speed dependency as expected forblowing snow. Hoar frost describes the formation of vapor-grown ice crystals on the crystalline snow surface, whichmay be detached due to mechanical fracture. Although dif-ferent studies are strife about the mechanisms to explain themeasured high ICNCs, they agree on a strong influence bysurface processes.
While the influence of surface processes on ICNCs ob-served at mountain-top stations has received more attentionin recent years (Lloyd et al., 2015), the impact of surface pro-cesses on the development of supercooled orographic clouds,e.g., a more rapid glaciation and enhanced precipitation, hasnot been studied extensively (Geerts et al., 2015). Whetherthe proposed surface processes have the potential to impactthe development of a cloud depends primarily on the pene-tration depth of the resuspended particle into a cloud, i.e., themaximum height above the surface to which the particles getlofted.
The height dependence of blowing snow has been stud-ied in the context of snow redistribution (“snow drift”) andreduced visibility due to resuspended ice crystals by ob-serving ice crystals up to several meters above a snow sur-face (Schmidt, 1982; Nishimura and Nemoto, 2005). It hasbeen reported that blowing snow occurs above a certainwind speed threshold. This threshold varies between 4 and13 ms−1 (Bromwich, 1988; Li and Pomeroy, 1997; Maheshet al., 2003; Déry and Yau, 1999) because the concentrationof blowing snow depends on snowpack properties (e.g., snowtype, density, wetness) in addition to atmospheric conditions(e.g., wind speed, temperature, humidity) (Vionnet et al.,2013). Nishimura and Nemoto (2005) observed resuspendedice crystals from the surface up to a height of 9.6 m and foundthat the ICNCs usually decreased to as low as 1–10 parti-cles per liter. Meanwhile, during a precipitation event, therelative importance of the small ice crystals (< 100 µm) de-creases from nearly 100 % at 1.1 m to below 20 % at 9.6 m.The rapid decrease in ICNC with height observed in thesestudies may limit the impact of blowing snow on orographicclouds. The applicability of these results to orographic cloudmay be restricted because most of these studies were con-ducted in dry air conditions under which ice crystals undergorapid sublimation (Yang and Yau, 2008), and lofting of icecrystals is more likely in orographic terrain because updraftsare higher than over flat surfaces.
Lloyd et al. (2015) suggested that vapor-grown ice crys-tals on the crystalline surface of the snow cover, i.e., hoarfrost, may be detached by mechanical fracturing due to tur-bulence, independent of wind speed. To our knowledge,only one modeling study exists that assesses the impact ofhoar frost on the development of a cloud. Farrington et al.(2015) increased the IN concentration and simulated sec-ondary ice processes in the WRF (Weather Research andForecasting) model to produce such high ICNCs measured
Atmos. Chem. Phys., 18, 8909–8927, 2018 www.atmos-chem-phys.net/18/8909/2018/

A. Beck et al.: Impact of surface and near-surface processes on ice crystal concentrations 8911
Figure 1. Sketch of the experimental setup and the surrounding structures (a) with their heights relative to the bottom of the measurementterrace. Aerial image of the Sonnblick Observatory (b, courtesy of Michael Staudinger, ZAMG) and a topographic map of the Hohen Tauernregion surrounding the Sonnblick Observatory (c, https://basemap.at/, last access: 24 September 2017).
Figure 2. Setup of the elevator with the holographic imagerHOLIMO mounted on the meteorological tower at the SBO (cour-tesy of Monika Burkert, ETH Zürich). The red lines and numbersindicate the five different heights at which the elevator was repeat-edly positioned to obtain vertical profiles of the ICNC. The refer-ence height of 0.0 m is the bottom of the measurement platform(green line).
at the Jungfraujoch by Lloyd et al. (2015). In addition, theyimplemented a flux of surface hoar crystals based on a frostflower aerosol flux. They concluded that an increased IN con-centration can better represent the high ICNCs observed atthe Jungfraujoch, but also removed the liquid water from themodel and prevented the existence of mixed-phase clouds.They also found that secondary ice processes are not suf-ficient to explain such high ICNCs at cold temperatures.However, they found that a flux of surface-based ice crys-tals, i.e., hoar frost, provided a good agreement with the IC-NCs measured by Lloyd et al. (2015). On the other hand,
surface-based ice crystals are not advected high into the at-mosphere and as such have a limited impact on orographicclouds. To verify their findings regarding the impact of a sur-face flux on orographic clouds, more measurements of icecrystal fluxes from the snow-covered surface are necessary(Farrington et al., 2015).
In contrast to these findings, several remote sensing(i.e., satellite, lidar and radar) studies measured ice crys-tals advected as high as 1 km above the surface that sug-gest an impact of surface-originated ice crystals on clouds(e.g., Rogers and Vali, 1987; Geerts et al., 2015). Satelliteobservations of blowing snow from MODIS and CALIOPover Antarctica (Palm et al., 2011) observed ice crystals upto 1 km above the surface with an average height of 120 mfor all observed blowing snow events. Similar observationsfrom lidar measurements exist from the South Pole with ob-served ice crystal heights of usually less than 400 m, withsome rare cases when a subvisible layer exceeded a heightof 1 km (Mahesh et al., 2003). However, the suspension ofclear-sky precipitation could not be ruled out as a source ofthe observed ice crystal layers. Radar measurements of icecrystals from an aircraft in the vicinity of the Medicine BowMountains (Vali et al., 2012) detected subvisible ground-layer snow clouds most of the time. Indeed, Geerts et al.(2015) presented evidence for ice crystals becoming loftedup to 250 m in the atmosphere by boundary layer separationbehind terrain crests and by hydraulic jumps. They proposedthat these ice crystals from the surface may lead to a rapidglaciation of supercooled orographic clouds and enhancedprecipitation. However, they also mentioned the limitationof radar and lidar measurements to separate the small icecrystals produced by surface processes from the larger fallingsnow particles and more abundant cloud droplets. They evenconcluded that “to explore BIP (blowing snow ice particles)lofting into orographic clouds, ice particle imaging devicesneed to be installed on a tall tower, or on a very steep moun-tain like the Jungfraujoch”.
In this study we assess the influence of surface processeson in situ cloud observations at mountain-top stations and thepotential impact on orographic mixed-phase clouds. Vertical
www.atmos-chem-phys.net/18/8909/2018/ Atmos. Chem. Phys., 18, 8909–8927, 2018

8912 A. Beck et al.: Impact of surface and near-surface processes on ice crystal concentrations
Figure 3. Examples of 2-D images taken by the holographic imager HOLIMO for the three subclassifications of ice crystal habits (irregular,regular and aggregates). The images are a collection recorded during the field campaign at different heights of the elevator.
profiles of the ICNC up to a height of 10 m above the surfacewere for the first time observed on a high-altitude mountainstation with the holographic imager HOLIMO (Beck et al.,2017). HOLIMO is capable of imaging ice crystals largerthan 25 µm and the shape of these ice crystals can be ana-lyzed.
2 Field measurements at the Sonnblick Observatory
2.1 Site description
This field campaign was conducted at the Sonnblick Obser-vatory (SBO) situated at the summit of Mt. Sonnblick at3106 m.a.s.l. (12◦57′ E, 47◦03′ N) in the Hohen Tauern Na-tional Park in the Austrian Alps. The SBO is a meteorologi-cal observatory operated all year by the ZAMG (Central In-stitute for Meteorology and Geodynamics). To the east andsouth, the SBO is surrounded by large glacier fields with amoderate slope, whereas to the northeast a steep wall of ap-proximately 800 m descends into the valley (Fig. 1b, c). Partof the SBO is a 15 m high tower used for meteorological mea-surements by the ZAMG. The data presented in this paperwere collected during a field campaign in February 2017.
2.2 Instrumentation
The properties of hydrometeors were observed with the holo-graphic imager HOLIMO, which is part of the HoloGondelplatform (Beck et al., 2017). HOLIMO was mounted on anelevator that was attached to the meteorological tower of theSBO (Fig. 2) to obtain vertical profiles of the hydrometeorproperties up to a height of 10 m above the surface. The el-evator was repeatedly positioned at five different heights asindicated in Fig. 2. To reduce the impacts of the tower onobserved microphysical properties, HOLIMO was mounted1.5 m from the east–northeast side of the tower (Fig. 1c).
A single vertical profile was observed within a time in-terval of 10–12 min by positioning the holographic imagerHOLIMO at individual heights for 2 min and recording holo-grams at 4 frames per second. This allowed for 8 L of air tobe sampled at each vertical position.
Coinciding meteorological measurements were made bythe ZAMG, which include 1 min averages of temperature,relative humidity and horizontal wind speed and direction atthe top of the meteorological tower. Snow cover depth wasmanually observed by the operators of the SBO everyday.Based on these measurements, the change in the snow coverwas calculated. This calculation includes all the changes inthe snow cover depth, e.g., snow drift, sublimation, meltingand fresh snow. Daily measurements of the total precipita-tion are available on the north and south side of the SBO. Aceilometer located in the valley north of the SBO measuredthe cloud base and cloud depth.
In addition, a 3-D sonic anemometer was mounted at thetop of the meteorological tower. However, the data are in-termittent as the heating of the anemometer was frequentlyinsufficient to prevent the riming of the measurement arms.
3 Results
The data presented were observed on 4 and 17 Febru-ary 2017. Figures 4 and 5 show an overview of the meteo-rological conditions on both days. The main difference is thewind direction, which was southwesterly on most of 4 Febru-ary and northerly on 17 February.
3.1 Case study on 4 February 2017
On 4 February a low-pressure system tracked eastwards fromthe Atlantic Ocean over northern France and reached west-ern Germany, where it slowly dissipated. Influenced by thislow-pressure system, the wind at the SBO predominantlycame from the west–southwest with wind speeds between 10and 25 ms−1 (Fig. 4b and c). By late afternoon at around19:00 UTC, the low-pressure system dissipated over westernGermany, the wind direction shifted to the north and windspeeds decreased to a minimum of 5 ms−1. After 19:00 UTCthe wind speed increased again to up to 15 ms−1. Due to rim-ing of the 3-D sonic anemometer, 1 min averages of windspeed and direction from the ZAMG measurements wereused. The temperature remained between −10 and −9 ◦Cuntil 19:00 UTC when the wind direction shifted to the north
Atmos. Chem. Phys., 18, 8909–8927, 2018 www.atmos-chem-phys.net/18/8909/2018/
A. Beck et al.: Impact of surface and near-surface processes on ice crystal concentrations 8913
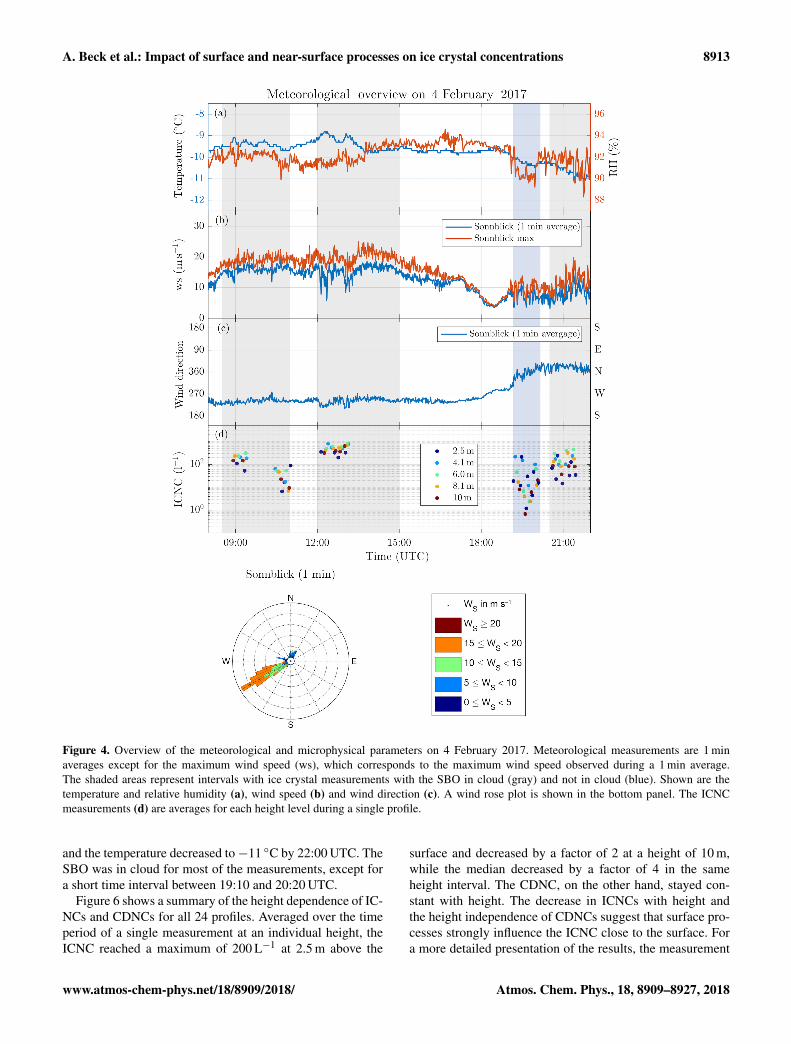
Figure 4. Overview of the meteorological and microphysical parameters on 4 February 2017. Meteorological measurements are 1 minaverages except for the maximum wind speed (ws), which corresponds to the maximum wind speed observed during a 1 min average.The shaded areas represent intervals with ice crystal measurements with the SBO in cloud (gray) and not in cloud (blue). Shown are thetemperature and relative humidity (a), wind speed (b) and wind direction (c). A wind rose plot is shown in the bottom panel. The ICNCmeasurements (d) are averages for each height level during a single profile.
and the temperature decreased to−11 ◦C by 22:00 UTC. TheSBO was in cloud for most of the measurements, except fora short time interval between 19:10 and 20:20 UTC.
Figure 6 shows a summary of the height dependence of IC-NCs and CDNCs for all 24 profiles. Averaged over the timeperiod of a single measurement at an individual height, theICNC reached a maximum of 200 L−1 at 2.5 m above the
surface and decreased by a factor of 2 at a height of 10 m,while the median decreased by a factor of 4 in the sameheight interval. The CDNC, on the other hand, stayed con-stant with height. The decrease in ICNCs with height andthe height independence of CDNCs suggest that surface pro-cesses strongly influence the ICNC close to the surface. Fora more detailed presentation of the results, the measurement
www.atmos-chem-phys.net/18/8909/2018/ Atmos. Chem. Phys., 18, 8909–8927, 2018

8914 A. Beck et al.: Impact of surface and near-surface processes on ice crystal concentrations
Figure 5. As Fig. 4, but for 17 February 2017. On this day temperature and wind measurements are available from the SBO and the 3-Dsonic anemometer. Shown are the temperature and relative humidity (a), wind direction (b), a comparison of the horizontal wind speed fromthe SBO and the 3-D sonic anemometer (c), and detailed wind speed from the 3-D sonic anemometer (d) and the ICNC (e).
period is divided into four time intervals representing dif-ferent meteorological conditions as indicated by the shadedareas in Fig. 4. The most important features of the profilesfor the different time intervals are summarized in Table 1.
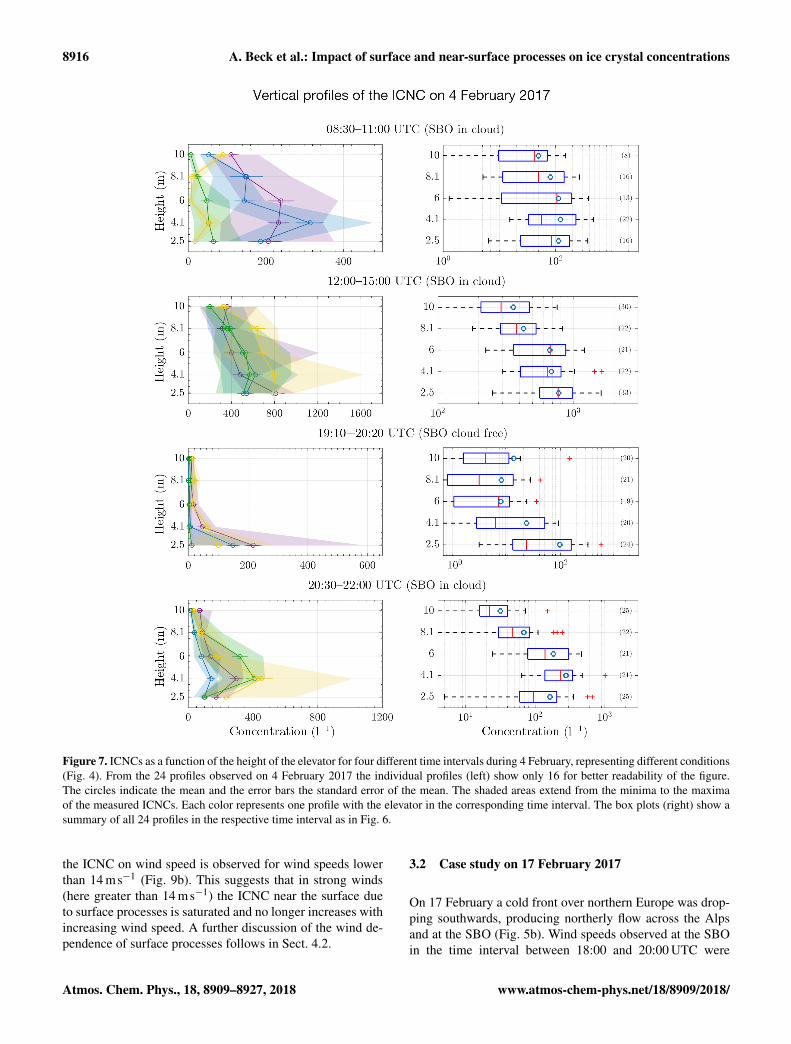
Between 19:10 and 20:10 UTC (Fig. 7, third row) therewere clear-sky conditions at the SBO. The ICNC reached amaximum instantaneous value of 600 L−1 in a single holo-gram at 2.5 m. The large shaded area represents the high vari-ability of the ICNC over the respective measurement period.The average ICNC of all clear-sky data in this time perioddecreases by a factor of 10 within 7.5 m, and more than 98 %
of the observed ice crystals had irregular shapes (Fig. 8b).Since there were clear-sky conditions in this time interval,the ice crystals had to originate from the surface.
In the morning between 08:30 and 11:00 UTC when theSBO was in cloud, the observed mean ICNCs (Fig. 7, firstrow) decreases by a factor of 2 between the height of 2.5 mand the top of the elevator. The ICNCs in this time pe-riod are much lower than between 12:00 and 15:00 UTC,although wind speeds were as high as 20 ms−1. A possiblereason is that the last snowfall was observed 3 days beforethe measurements. During this time, the loose ice crystals at
Atmos. Chem. Phys., 18, 8909–8927, 2018 www.atmos-chem-phys.net/18/8909/2018/

A. Beck et al.: Impact of surface and near-surface processes on ice crystal concentrations 8915
Figure 6. ICNC (a) and CDNC (b) as a function of the height of the elevator at the meteorological tower of the SBO. This plot is a summaryof the 24 profiles obtained on 4 February 2017. The data were averaged for each height over the entire time period. In brackets are the numberof measurements per height. For each box, the central line marks the median value of the measurement and the left and right edges of thebox represent the 25th and the 75th percentiles, respectively. The whiskers extend to the minima and maxima of the data; outliers are markedas red pluses. The mean values of the measurements are indicated as blue circles.
Table 1. Summary of important features of the ICNC profiles observed on 4 February (Fig. 7) and 17 February (Fig. 10) 2017. ICNCmaxrefers to the observed maximum of the mean ICNC over height. ICNC10 refers to the average ICNC at 10 m.
Time Height of Processesinterval ICNCmax ICNCmax ICNC10 involved(UTC) (m) (l−1) (l−1) from Fig. 16
4 February 2017
08:30–11:00 4.1 150 50 (a, c)12:00–15:00 2.5 800 250 (a, c)19:10–20:20 2.5 100 10 (a)20:30–22:00 4.1 300 30 (b, d)
17 February 2017
18:00–20:00 4.1–6 300 100 (b, d)
the surface were blown away and the snowpack was solidi-fied by temporal melting and refreezing. Consequently, fewerice crystals are expected to be resuspended from the surface(e.g., Vionnet et al., 2013).
The highest ICNCs were observed in the time period be-tween 12:00 and 15:00 UTC (Fig. 7, second row) when theSBO was in cloud. The ICNC reached its maximum at 2.5 mwith a mean value of 800 L−1 and decreased by a factor of2 within 7.5 m (Fig. 7b, second row). Between different pro-files ICNCs changed by a factor of up to 2; however, consis-tently for all profiles a decrease in ICNCs with height wasobserved.
Between 20:30 and 22:00 UTC (Fig. 7, last row), when theSBO was in cloud again, the maximum instantaneous ICNCis observed at a height of 4.1 m. In this time period the ICNC
decreased by a factor of 9 between 4.1 m and the top of thetower. The observation of a maximum in ICNCs at an ele-vated level of 4.1 m is not in agreement with the expectationsabout the height dependence of blowing snow and will befurther discussed in Sect. 4.1.1 and 4.1.2.
The correlation between wind speed and ICNCs for 1 mintime intervals is shown in Fig. 9. Instead of the averagewind speed, the maximum wind speed is used because gusts,i.e., the highest wind speed in a time interval, are most rel-evant for resuspending ice crystals from the surface. From08:30 to 15:00 UTC, when the wind direction was west–southwest, no correlation is observed between ICNC andwind speed for wind speeds higher than 14 ms−1 (Fig. 9a).However, between 19:10 and 22:30 UTC, when the wind di-rection was north, a much more pronounced dependency of
www.atmos-chem-phys.net/18/8909/2018/ Atmos. Chem. Phys., 18, 8909–8927, 2018
8916 A. Beck et al.: Impact of surface and near-surface processes on ice crystal concentrations
Figure 7. ICNCs as a function of the height of the elevator for four different time intervals during 4 February, representing different conditions(Fig. 4). From the 24 profiles observed on 4 February 2017 the individual profiles (left) show only 16 for better readability of the figure.The circles indicate the mean and the error bars the standard error of the mean. The shaded areas extend from the minima to the maximaof the measured ICNCs. Each color represents one profile with the elevator in the corresponding time interval. The box plots (right) show asummary of all 24 profiles in the respective time interval as in Fig. 6.
the ICNC on wind speed is observed for wind speeds lowerthan 14 ms−1 (Fig. 9b). This suggests that in strong winds(here greater than 14 ms−1) the ICNC near the surface dueto surface processes is saturated and no longer increases withincreasing wind speed. A further discussion of the wind de-pendence of surface processes follows in Sect. 4.2.
3.2 Case study on 17 February 2017
On 17 February a cold front over northern Europe was drop-ping southwards, producing northerly flow across the Alpsand at the SBO (Fig. 5b). Wind speeds observed at the SBOin the time interval between 18:00 and 20:00 UTC were
Atmos. Chem. Phys., 18, 8909–8927, 2018 www.atmos-chem-phys.net/18/8909/2018/

A. Beck et al.: Impact of surface and near-surface processes on ice crystal concentrations 8917
Figure 8. Vertical profile of the concentration (a) and the fraction (b) of individual ice crystal habits for the profiles between 19:10 and20:20 UTC on 4 February 2017. The concentration of regular crystals and aggregates is below 1 L−1 for all heights. For the fraction, theICNCs of individual habits were divided by the total ICNCs. The circles represent the mean and the error bars represent the standard errorof the mean.
Figure 9. As Fig. 6, but for ICNC as a function of the horizontal wind speed for the time periods between 08:30 and 15:00 UTC when thewind direction was from the west–southwest (a) and between 19:10 and 22:00 UTC when the wind direction was from the north (b). TheICNCs from HOLIMO are 1 min averages and the wind speeds from the SBO are the maxima in the respective 1 min intervals.
www.atmos-chem-phys.net/18/8909/2018/ Atmos. Chem. Phys., 18, 8909–8927, 2018

8918 A. Beck et al.: Impact of surface and near-surface processes on ice crystal concentrations
Figure 10. As Fig. 7, but for ICNC as a function of height observed on 17 February 2017.
Figure 11. As Fig. 9, but only for 17 February and four different wind speed measurements: (a) 1 min averages of the horizontal wind speedfrom the SBO, (b) maximum wind speed of the corresponding time interval in (a), (c) 1 s averages of the horizontal wind speed and (d) 1 saverage of the vertical wind speed from both 3-D sonic anemometers.
between 5 and 10 ms−1. During this period, the tempera-ture decreased by 1 K from −12.5 to −13.5 ◦C. The SBOwas in cloud starting at 13:00 UTC with varying visibilitybetween several meters up to several hundreds of meters.Some snowfall was observed in the afternoon between 13:00and 15:00 UTC.
For this day, wind data from the 3-D sonic anemometerwere available, which allow for a more detailed analysis ofthe correlation between the observed ICNCs and wind speed.However, only four vertical profiles were obtained due tohardware problems with the computer. The first profile wasmeasured in the morning at 12:00 UTC when the SBO was
Atmos. Chem. Phys., 18, 8909–8927, 2018 www.atmos-chem-phys.net/18/8909/2018/

A. Beck et al.: Impact of surface and near-surface processes on ice crystal concentrations 8919
Figure 12. Vertical profile of the concentration (a) and the fraction (b) of individual ice crystal habits for the profiles on 17 February 2017.For the fraction, the ICNCs of individual habits were divided by the total ICNC. The circles represent the mean and the error bars representthe standard error of the mean.
Figure 13. As Fig. 9, but only for 17 February 2017 for the ICNCs of different ice crystal habits as a function of the vertical wind speed.Aggregates are not shown because of their very low concentrations.
not in cloud and no ice crystals were observed. Three moreprofiles were taken in the evening starting at 18:00 UTC. Forthese profiles the ice crystals were manually classified intothree categories: regular, irregular and aggregates.
For the three profiles, the ICNC reached its maximum in-stantaneous value of several hundreds per liter at the heightlevel of 2.5 or 6 m (Fig. 10a). The minimum ICNC wasconsistently observed at the top of the elevator with valuesless than 150 L−1. As such, the ICNCs decreased by a fac-tor of 2 to 4 in the observed height interval (Fig. 10). Thehabits of the ice crystals are primarily irregular, which is in
agreement with ground-based observations at the Jungfrau-joch (Schlenczek et al., 2017) and with observations in free-floating clouds (e.g., Korolev et al., 1999, 2006; Wolf et al.,2018). In addition, the observed fraction of regular to irregu-lar ice crystals stays constant with height (Fig. 12b). This im-plies that either surface processes also produce a significantnumber of regular-shaped ice crystals or additional processesneed to be active to explain these results. A further discussionof these results follows in Sect. 4.1.
In contrast to the data from 4 February, no correlationbetween ICNCs and the horizontal wind speed is observed
www.atmos-chem-phys.net/18/8909/2018/ Atmos. Chem. Phys., 18, 8909–8927, 2018

8920 A. Beck et al.: Impact of surface and near-surface processes on ice crystal concentrations
Figure 14. Number size distribution of the irregular (a) and regular (b) ice crystals observed on 17 February 2017 as a function of height.The error bars represent the standard error of the mean. Aggregates are not shown because of their low concentrations.
Figure 15. Comparison of the height dependence of the ice watercontent for the time intervals between 12:00 and 15:00 UTC (redbox plots) and 19:10 and 20:20 UTC (blue box plots) using theblowing snow parameterization of Mellor and Fellers (1986). Thewind speed in the time interval between 12:00 and 15:00 UTC wasaround 20 ms−1 and between 19:10 and 20:20 around 10 ms−1.The gray shaded area indicates the calculated ice water content fromthe parameterization for wind speeds between 10 (blue line) and20 ms−1 (red line).
(Fig. 11). This holds true for the 1 min mean and maxi-mum wind speeds observed by the SBO and the 1 s aver-ages observed with the 3-D sonic anemometer. However, IC-NCs increased with vertical wind speed. The wind speeddependence of irregular and regular ICNCs is comparable,and both increase by a factor of 2 when the vertical windspeed increases from 0–2 to 4–6 ms−1 (Fig. 13). Whereas
the shape of the size distribution of the irregular ice crystalshardly varies with height, larger regular ice crystals are morestrongly reduced with height than smaller regular ice crystals(Fig. 14).
4 Discussion
4.1 Sources of enhanced ICNC observed atmountain-top research stations
To disentangle possible sources and mechanisms that en-hance the observed ICNCs at mountain-top research stations,the following discussion will be based on the observed heightprofile of the ICNC and the observed ice crystal shape.
In the context of snow redistribution, blowing snow hasbeen studied thoroughly. For blowing snow, two main layersare distinguished. In the saltation layer, with a typical thick-ness of 0.01–0.02 m, snow particles are lofted and follow bal-listic trajectories. Depending on the crystal size, the crystalsin the saltation layer either impact onto the snow surface orare transported by turbulent eddies into the suspension layer(e.g., Comola et al., 2017; Gordon et al., 2009), which canextend up to a height of several tens of meters above the sur-face. Nishimura and Nemoto (2005) and Mellor and Fellers(1986) observed the height dependence of blowing snow upto 10 m over a flat surface in the Arctic and in Antarctica andfound that particles reaching layers higher than 1 m abovethe surface are usually smaller than 100 µm, and the parti-cle concentration gradually decreases with height (Fig. 16a).Similar to blowing snow we expect such a height dependencefor any other surface process. As such, a gradual decrease inICNCs with height is expected for any surface process andno height dependence is expected for ice crystals producedin free-floating clouds.
Atmos. Chem. Phys., 18, 8909–8927, 2018 www.atmos-chem-phys.net/18/8909/2018/

A. Beck et al.: Impact of surface and near-surface processes on ice crystal concentrations 8921
Figure 16. Illustration of surface and near-surface processes that impact the measured ICNC at mountain-top research stations. Panels (a) and(b) illustrate the difference in the height dependence of blowing snow over a surface with a gentle and a convergence effect on the ICNC ofregular and irregular ice crystals if a cloud is forced over a mountain.
While ice crystals observed in free-floating clouds havemainly (> 80 %) irregular habits (e.g., Korolev et al., 1999,2006; Wolf et al., 2018), no studies have investigated the icecrystal shape produced by surface processes like hoar frost,blowing snow or riming on trees, rocks or the snow surface.We expect irregular shapes for resuspended ice crystals, i.e.,blowing snow, due to mechanical fracturing upon their im-pact on the surface or due to the successive melting and freez-ing of the ice crystals on the snow surface.
Ice crystals originating as hoar frost grow in regular shapeson the snow surface. Whether these vapor-grown ice crystalskeep their regular shape depends on the exact physical pro-cess through which they are detached from the surface. Whilesome ice crystals may keep their initial regular habit, forother ice crystals this regular habit may be destroyed whenthey are detached from the surface due to mechanical frac-turing as described by Lloyd et al. (2015). Similar to blowingsnow, the ICNC from hoar frost is likely to be increased nearthe surface because only smaller ice crystals are lofted higherup. In this layer ice crystals are likely to collide and fracture.On the one hand, this reduces the probability to observe reg-ular ice crystals from surface processes. On the other hand,if small regular and irregular ice crystals (µm) are produced,
they have the potential to grow into larger regular-shaped icecrystals being observed at the measurement location.
4.1.1 Impact of surface processes
During the clear-sky period on 4 February 2017 between19:10 and 20:20 UTC the observed ice crystals have predom-inantly irregular habits (Fig. 8). Since no cloud was presentat or above the SBO, the observed ice crystals have to origi-nate from the surface. As such, this observation confirms ourexpectations that surface processes mainly produce irregularice crystals.
The observed ICNCs on 4 February 2017 before20:30 UTC gradually decrease with height as expected forsurface processes, and this is consistent with observationsof blowing snow in the Arctic and Antarctica. The west–southwest wind during this time period (Fig. 4c) transportedthe ice crystals from an area with a gentle slope towards thestation. The gentle nature of the slope may explain why theheight dependence of the ICNC close to the surface is similarto observations of blowing snow over a flat terrain (Fig. 16a).Mellor and Fellers (1986) reported the height dependence ofice water content for different wind speeds up to a height of
www.atmos-chem-phys.net/18/8909/2018/ Atmos. Chem. Phys., 18, 8909–8927, 2018

8922 A. Beck et al.: Impact of surface and near-surface processes on ice crystal concentrations
Figure 17. Illustration of the challenges of observing the wind de-pendence of blowing snow (Sect. 4.2). The two squares representtwo air parcels with a duration 1t of 10–15 s, which is typical for agust. Parcel 2 represents a gust with a higher wind speed v2 than theaverage wind speed v1 in parcel 1. At the location of particle lofting(a) ice crystals are lofted due to the high turbulence in air parcel 2.On the way to the measurement location (b) some of the ice crys-tals were transported to the other air parcel, e.g., by sedimentationor turbulence. Also, the effect of different averaging times is illus-trated (b).
10 m. The observations between 12:00 and 15:00 UTC andbetween 19:10 and 20:20 UTC are compared to a parameter-ization by Mellor and Fellers (1986) for the ice water contentas a function of wind speed and height for blowing snow ob-served in the Arctic (Fig. 15). Although there is roughly anorder of magnitude difference between the IWC predictedby the parameterization and the observations, the decrease inIWC as a function of height is consistent. Thus, the heightdependence of the ICNC at the SBO is likely due to blowingsnow or a similar surface-based process.
The maximum in the ICNCs at an elevated level as ob-served on 4 February 2017 between 20:30 and 22:00 UTCand on 17 February 2017 cannot be explained by surfaceprocesses over a gentle slope. However, these observationscorrespond to periods when the wind direction was from thenorth (Fig. 4c). With the change in wind direction the lo-cation of the origin of the lofted ice crystals also changed.While the terrain to the west has a gentle slope, the terrain tothe north is characterized by a steep wall (Fig. 1). If the winddirection is north, a wind rotor may develop to the lee of theridge, where the elevator was located in north wind cases, andshadow the lower levels of the vertical profiles. This possiblyexplains the elevated maximum of ICNCs (Fig. 16b), as ob-served during north wind events (4 February between 20:30and 22:00 UTC; see Fig. 7).
Regardless, the majority of crystals produced by surfaceprocesses are expected to have irregular habits. As such, itis expected that the ratio of irregular to regular ice crys-tals decreases with height if the irregular crystals are solelyproduced through surface processes. This is in contrast toour observations on 17 February 2017, when the fraction of
irregular to regular crystals remained constant with height(Fig. 12b). Although the contribution of regular ice crystalsfrom surface processes like hoar frost and riming cannot becompletely excluded, we give an additional and/or alternativeexplanation for these observations in the following section.
4.1.2 Impact of near-surface processes
Two near-surface processes are proposed to potentially mod-ify ICNCs in the presence of a cloud in contact with a moun-tain. When a cloud is forced over a mountain and the cloudbase is below the mountain top, a convergence zone of en-riched ICNCs could develop if cloud particles below themountain top are entrained into the flow over the mountain(Fig. 16d). If irregular and regular ice crystals are well mixedwithin the cloud below the mountain top, they will maintaintheir respective fractions in such a convergence zone. Thefraction of irregular ice crystals on 17 February 2017 is alsoin good agreement with observations in free-floating cloudsin the Arctic (Korolev et al., 2003, 2006; Wolf et al., 2018).Thus, this near-surface process could explain the height in-dependent of irregular and regular ice crystals that was ob-served on 17 February 2017.
Additionally, sedimenting ice crystals originating in cloudmay remain lofted near the surface in a turbulent layer(Fig. 16c), similar to the lofting of ice crystals in the sus-pension layer of blowing snow. However, in this case thesedimenting particles may maintain their habits because theydo not reach the surface. Therefore, such an effect can enrichboth irregular and regular ice crystals near the surface, result-ing in the same gradual decrease in the ICNC, while keepingthe ratio of regular to irregular crystals constant.
The mechanisms illustrated in Fig. 16 cannot only be con-sidered separately, but can also occur in combination witheach other. For example, the observed decrease in the ICNCwith height during the first two time periods on 4 Febru-ary 2017 (Fig. 7) could be blowing snow over a moderateslope in the presence of a cloud at the SBO (Fig. 16a) and/oran enrichment by cloud ice crystals captured in a turbulentlayer near the surface (Fig. 16c). It is also important to notethat the proposed near-surface processes (Fig. 16c and d)could impact the observed ICNC at mountain-top researchstations even without a snow-covered surface.
4.2 Wind dependence of the observed ICNCs
Turbulent eddies near the surface are responsible for thelofting of snow particles into the suspension layer (seeSect. 4.1.1). Observations in the Arctic or Antarctica usu-ally use wind measurements close to the surface (< 3 m) toestimate these turbulent eddies using friction velocity. In thisstudy, only wind measurements on top of the meteorologicaltower at a height of 15 m are available. For 4 February 2017only the horizontal wind speed averaged over 1 min is avail-able from the 2-D sonic anemometer operated by the SBO.
Atmos. Chem. Phys., 18, 8909–8927, 2018 www.atmos-chem-phys.net/18/8909/2018/

A. Beck et al.: Impact of surface and near-surface processes on ice crystal concentrations 8923
Figure 18. Ice crystal number concentrations (ICNCs; orange andbrown) measured on the elevator at the SBO are compared to theICNCs (blue) and ice nucleating particle (INP) concentrations (red)measured at the High Altitude Research Station, Jungfraujoch (JFJ).The ICNCs at the JFJ were measured with HOLIMO II during thewinter 2012 and 2013 (Lohmann et al., 2016). Each box representsa cloud case. The INP concentrations were measured with the Hor-izontal Ice Nucleation Chamber (Lacher et al., 2017, and additionalmeasurements) at a relative humidity with respect to water (RHw)of 103–104 %. The three boxes on the left were taken during (fromthe left) Sahara dust events, summer seasons and winter seasons ata temperature of −31 ◦C, but shifted slightly to visualize them. Themeasurements at −25 ◦C were taken during a summer season. Theleft and right edges of each box represent the 25th and 75th per-centiles, the circle is the mean value and the small dots are outliers.
On 17 February 2017, 1 s averages are also available forhorizontal and vertical wind speed from our own 3-D sonicanemometer.
Similar to Lloyd et al. (2015), who observed a dependenceof the observed ICNCs on horizontal wind speed only fora small fraction of cloud events (27 % in 2013 and 13 %in 2014), we observed a dependence of ICNCs on horizon-tal wind speed on 4 February only when horizontal windspeeds were less than 14 ms−1. At higher wind speeds andon 17 February such a dependence was not observed. WhileLloyd et al. (2015) proposed blowing snow to explain obser-vations when a correlation was observed between ICNCs andhorizontal wind speed, they proposed hoar frost to explainobservations when no such correlation was present. However,in our opinion the orography in the proximity of the measure-ment site and the positioning of the different measurementinstruments (i.e., cloud probes and sonic anemometers) havean impact on the observable correlation between ICNC andwind speed. As such, it is much more difficult to distinguish
between blowing snow and hoar frost as the processes re-sponsible for enhanced ICNCs.
For example, the lack of dependence of ICNC on horizon-tal wind speed on 17 February may be explained by a processthat lofts ice crystals from a steep mountain slope to form amountain-induced ice crystal convergence zone near the sur-face on the leeward side of the mountain ridge (Fig. 13). Insuch a case, horizontal wind speed may not be a good pre-dictor for the presence of turbulent eddies near the surfacecapable of lofting ice crystals from the surface, but verticalwind speed may be a better indicator as was observed on17 February. Additionally, a dependence on horizontal windspeed may be lost due to the exact setup of the measurementinstruments at the measurement site (Fig. 17). In the follow-ing we discuss factors that possibly mask the wind depen-dence of the observed ICNCs.
Firstly, ice crystals are resuspended from the surface by lo-cal turbulence and captured in the same air parcel (Fig. 17b).For a certain time after their resuspension, the ice crystalsare transported in the same air parcel as the local turbulence.However, with time they can leave this air parcel, for exam-ple by sedimentation or through additional turbulence. If themeasurements are performed too far away from the placewhere the ice crystals were resuspended, either the turbu-lence responsible for the resuspension may have already dis-sipated or ice crystals may have already been transported toother air parcels (Fig. 17b). Both effects mask the correla-tion between the ICNC of resuspended ice crystals and theresponsible turbulence.
Secondly, at mountain-top research stations local turbu-lence is also created by nearby structures. Since it is difficultto observe all of the turbulence responsible for lofting icecrystals from the surface, wind measurements at a height of15 m above the surface are expected to be a good estimationof the strength of such turbulence.
Thirdly, the averaging time is crucial to observe the cor-relation between ICNCs and wind speed (Fig. 17b). If theaveraging time is too large, any correlation is averaged out.Meanwhile, if the averaging time is too short, any enrichedICNCs can also be measured at lower wind speeds due to alag between the turbulence responsible for lofting the crys-tals and the entrainment time required for the crystals to beestablished in the flow. In this study we average over 10–15 s,which is the expected timescale of gusts responsible for theresuspension of ice crystals.
Finally, the ICNC of resuspended particles not only de-pends on wind speed, but also on the age of the snow coverand atmospheric conditions, and a possible correlation maybe suppressed in a data set with different snowpack andatmospheric conditions. Between 19:00 and 20:30 UTC on4 February 2017 when no cloud was present at the SBO, adecrease in the ICNC was observed with time at a height of2.5 m although the wind speed remained constant at approx-imately 10 ms−1. A possible reason for the decrease in theICNC in this time period is that the very loose ice crystals on
www.atmos-chem-phys.net/18/8909/2018/ Atmos. Chem. Phys., 18, 8909–8927, 2018

8924 A. Beck et al.: Impact of surface and near-surface processes on ice crystal concentrations
top of the snow cover were gradually blown away, changingthe snowpack properties over time.
4.3 Origin of crystals measured at mountain-topstations
The origin of ice crystals observed at mountain-top researchstations is an open question because the ICNC exceeds themeasured ice nucleating particle (INP) concentration by sev-eral orders of magnitudes (Fig. 18). Thus, additional pro-cesses, i.e., ice-multiplication (Field et al., 2017) as well assurface and near-surface processes, have to contribute signif-icantly to the ICNC.
The contribution of ice crystals from the surface is onthe order of several hundreds of ice crystals per liter, whichis estimated from the measurements after 19:10 UTC on4 February 2017. Without cloud (19:10–20:20 UTC), sev-eral hundred ice crystals of blowing snow were observed(see Sect. 4.1.1 and Fig. 16a). With a cloud present (20:30–22:00 UTC), several hundred ice crystals were also observednear the surface and only several tens to 100 L−1 above8.1 m. Assuming that the upper ICNCs are representative forthe cloud, the contribution from the surface is similar.
An estimation of the impact of the proposed near-surfaceprocesses (Fig. 16) is difficult. The profiles observed on17 February that are possibly affected by such a near-surfaceprocess still have a decreasing tendency in the upper levels.Therefore, no information about the ICNC in cloud is avail-able (Fig. 10). However, the contribution of near-surface pro-cesses is at least on the order of 100–250 L−1. The ICNCsnear the surface at the SBO (2.5 m) are comparable with sim-ilar measurements at the Jungfraujoch (JFJ) at a height of2 m above the ground (Fig. 18) (Lloyd et al., 2015; Lohmannet al., 2016), which indicates a similar origin of the observedice crystals at both stations.
The contribution of surface and near-surface processesof several hundreds per liter can explain most of the gapbetween the measured INP concentration and the observedICNC (Fig. 18). However, even at a height of 10 m the ob-served ICNCs of several tens to 100 L−1 exceed the expectedINP concentration (Fig. 18). This discrepancy is either be-cause even at a height of 10 m the cloud is influenced fromthe surface or ice-multiplication processes contribute signifi-cantly.
4.4 Impact of the surface on ICNCs in clouds
To assess the impact of surface and near-surface processeson the properties and the development of a cloud, under-standing the height dependence of the resuspended ice crys-tals is crucial. If ice crystals are lofted only several metersoff the surface, clouds are expected to be influenced onlylocally (Farrington et al., 2015). As most vertical profilesdo not show constant ICNCs at the top of the tower, it islikely that resuspended ice crystals reach heights greater than
10 m where they can influence clouds. For example, between12:00 and 15:00 UTC (Fig. 7, second row) when wind speedsare greater than 20 ms−1, ICNCs gradually decreased withheight and were larger than 300 L−1 at the top of the tower.In this case it is likely that ice crystals from the surface werelofted higher into the cloud than 10 m. As such, due to thelimited vertical extent of the profiles, it is unclear whetherand to what extent clouds are influenced by ice crystals pro-duced by surface processes. Already a low concentration ofice crystals from the surface can have a significant impact oncloud properties, e.g., extent and lifetime. Therefore, a finalstatement on the impact on clouds is not possible.
5 Conclusions
This study assessed the impact of surface and near-surfaceprocesses on ICNCs measured at mountain-top stations andpossible implications on the atmospheric relevance of suchmeasurements. To achieve this, an elevator was attached tothe meteorological tower of the SBO and vertical profilesof the ICNC were observed with the holographic imagerHOLIMO on two days in February 2017. The main findingsare the following.
– ICNCs decrease with height. ICNCs near the ground areat least a factor of 2 larger than at a height of 10 m ifICNCs near the ground are larger than 100 L−1. The in-crease in ICNCs near the ground can be up to an or-der of magnitude during cloud events and even 2 ordersof magnitudes during cloud-free periods. Therefore, insitu measurements of ICNCs at mountain-top researchstations overestimate ICNCs.
– Some observations show a similar decrease in the ICNCof irregular and regular ice crystals with height. Thissuggests that either surface processes like hoar frost orenhanced rime splintering produce a significant numberof regular ice crystals or that alternative and/or addi-tional processes need to be active. In the presence of acloud, two near-surface processes are proposed as an al-ternative to enrich the ICNC of irregular and regular icecrystals near the surface. Either sedimenting ice crystalsare captured in turbulence near the surface or ice crys-tals are enriched in a convergence zone when a cloudis forced over a mountain. In both cases, the observedICNC at mountain-top research stations is not represen-tative of the cloud further away from the surface, evenwithout the presence of a snow-covered surface.
– On 4 February 2017 the observed ICNC shows a de-pendence on horizontal wind speed for wind speeds upto 14 ms−1. On 17 February a dependence of the ICNCon horizontal wind speed was not observed, but insteadon vertical wind speeds. Possibly, horizontal or verticalwind speeds measured 15 m above the surface are not
Atmos. Chem. Phys., 18, 8909–8927, 2018 www.atmos-chem-phys.net/18/8909/2018/

A. Beck et al.: Impact of surface and near-surface processes on ice crystal concentrations 8925
a good estimate for the turbulent eddies responsible forthe resuspension of blowing snow particles.
– The contribution of surface and near-surface processesto the observed ICNC at mountain-top research stationsis estimated to account for several hundred ice crystalsper liter. ICNCs in clouds without any contribution fromsurface and near-surface processes are estimated to beseveral tens per liter based on the observations between20:30 and 22:00 UTC on 4 February 2017. This is stillorders of magnitude higher than the measured INP con-centration (Fig. 18). As such, additional processes mustbe active, e.g., ice-multiplication processes, and con-tribute significantly to the ICNC in orographic clouds.
– The strong influence of surface and near-surface pro-cesses on the ICNC measured at mountain-top stationslimits the atmospheric relevance of such mountain-topcloud measurements. However, the data set obtained istoo small to make a clear statement regarding underwhich conditions in situ measurements at mountain-topresearch stations may represent the real properties of acloud in contact with the surface.
To better understand the processes that are responsiblefor enhanced ICNCs close to the surface and to further in-vestigate the processes proposed in this study, we suggesta more thorough field campaign with additional 3-D sonicanemometers. Ideally, one 3-D sonic anemometer should beplaced upwind of the ICNC measurement to observe the tur-bulent eddies that are responsible for the resuspension of icecrystals, one 3-D sonic anemometer should be placed on theelevator and one on the top of the tower. This may help tobetter understand the dependence of ICNC on wind and tofind the origin of the observed ice crystals. At best, threecloud-imaging probes would be part of such a campaign andwould be installed in parallel to the 3-D sonic anemome-ters. In addition, to get a better estimate of the impact of re-suspended particles on cloud properties, especially for highwind speeds, the vertical profiles have to be extended tolarger heights above the surface. Such a field campaign couldbe conducted using a tethered balloon system equipped withcloud-imaging probes, which can be lofted several hundredmeters into the atmosphere.
Data availability. The data and software are available from the au-thors upon request.
Competing interests. The authors declare that they have no conflictof interest.
Acknowledgements. The authors would like to thank HannesWydler, Olga Henneberg, Fabiola Ramelli and Monika Burkert
for their assistance during the field campaign and Eric Sulmonifor his help with classifying ice particles. We also thank the headof the Sonnblick Observatory, Elke Ludewig, for access to themeasurement site and the entire staff (Hermann Scheer, NorbertDaxbacher, Lug Rasser, Hias Daxbacher) for their hospitality andtheir excellent support and assistance during the field campaign.The meteorological measurements at the Sonnblick Observatorywere provided by the Zentralanstalt für Meteorologie und Geody-namik (ZAMG). This project was supported by ETH Zurich undergrant ETH-30 13-2.
Edited by: Ottmar MöhlerReviewed by: two anonymous referees
References
Baumgardner, D., Brenguier, J., Bucholtz, A., Coe, H., DeMott,P., Garrett, T., Gayet, J., Hermann, M., Heymsfield, A., Ko-rolev, A., Krämer, M., Petzold, A., Strapp, W., Pilewskie,P., Taylor, J., Twohy, C., Wendisch, M., Bachalo, W., andChuang, P.: Airborne instruments to measure atmosphericaerosol particles, clouds and radiation: A cooks tour of ma-ture and emerging technology, Atmos. Res., 102, 10–29,https://doi.org/10.1016/j.atmosres.2011.06.021, 2011.
Beck, A., Henneberger, J., Schöpfer, S., Fugal, J., and Lohmann,U.: HoloGondel: in situ cloud observations on a cable car in theSwiss Alps using a holographic imager, Atmos. Meas. Tech., 10,459–476, https://doi.org/10.5194/amt-10-459-2017, 2017.
Bergeron, T.: On the physics of clouds and precipitation, in: Pro-ces Verbaux de l’Association de Météorologie, Int. Union ofGeodesy and Geophys., 156–178, 1935.
Boose, Y., Welti, A., Atkinson, J., Ramelli, F., Danielczok, A.,Bingemer, H. G., Plötze, M., Sierau, B., Kanji, Z. A., andLohmann, U.: Heterogeneous ice nucleation on dust parti-cles sourced from nine deserts worldwide – Part 1: Im-mersion freezing, Atmos. Chem. Phys., 16, 15075–15095,https://doi.org/10.5194/acp-16-15075-2016, 2016.
Bromwich, D. H.: Snowfall in high southern latitudes, Rev. Geo-phys., 26, 149–168, https://doi.org/10.1029/RG026i001p00149,1988.
Choularton, T. W., Griggs, D. J., Humood, B. Y., and Latham,J.: Laboratory studies of riming, and its relation to icesplinter production, Q. J. Roy. Meteor. Soc., 106, 367–374,https://doi.org/10.1002/qj.49710644809, 1980.
Comola, F., Kok, J. F., Gaume, J., Paterna, E., and Lehning,M.: Fragmentation of wind-blown snow crystals, Geophys. Res.Lett., 44, 4195–4203, https://doi.org/10.1002/2017GL073039,2017GL073039, 2017.
Crawford, I., Bower, K. N., Choularton, T. W., Dearden, C., Crosier,J., Westbrook, C., Capes, G., Coe, H., Connolly, P. J., Dorsey,J. R., Gallagher, M. W., Williams, P., Trembath, J., Cui, Z.,and Blyth, A.: Ice formation and development in aged, win-tertime cumulus over the UK: observations and modelling, At-mos. Chem. Phys., 12, 4963–4985, https://doi.org/10.5194/acp-12-4963-2012, 2012.
Crosier, J., Bower, K. N., Choularton, T. W., Westbrook, C. D., Con-nolly, P. J., Cui, Z. Q., Crawford, I. P., Capes, G. L., Coe, H.,Dorsey, J. R., Williams, P. I., Illingworth, A. J., Gallagher, M. W.,
www.atmos-chem-phys.net/18/8909/2018/ Atmos. Chem. Phys., 18, 8909–8927, 2018

8926 A. Beck et al.: Impact of surface and near-surface processes on ice crystal concentrations
and Blyth, A. M.: Observations of ice multiplication in a weaklyconvective cell embedded in supercooled mid-level stratus, At-mos. Chem. Phys., 11, 257–273, https://doi.org/10.5194/acp-11-257-2011, 2011.
DeMott, P. J., Prenni, A. J., Liu, X., Kreidenweis, S. M., Petters,M. D., Twohy, C. H., Richardson, M. S., Eidhammer, T., andRogers, D. C.: Predicting global atmospheric ice nuclei distribu-tions and their impacts on climate, P. Natl. Acad. Sci. USA, 107,11217–11222, https://doi.org/10.1073/pnas.0910818107, 2010.
Déry, S. J. and Yau, M. K.: A climatology of adverse winter-typeweather events, J. Geophys. Res.-Atmos., 104, 16657–16672,https://doi.org/10.1029/1999JD900158, 1999.
Farrington, R. J., Connolly, P. J., Lloyd, G., Bower, K. N.,Flynn, M. J., Gallagher, M. W., Field, P. R., Dearden, C.,and Choularton, T. W.: Comparing model and measured icecrystal concentrations in orographic clouds during the IN-UPIAQ campaign, Atmos. Chem. Phys., 15, 25647–25694,https://doi.org/10.5194/acpd-15-25647-2015, 2015.
Field, P. R., Lawson, R. P., Brown, P. R. A., Lloyd, G., West-brook, C., Moisseev, D., Miltenberger, A., Nenes, A., Blyth, A.,Choularton, T., Connolly, P., Buehl, J., Crosier, J., Cui, Z., Dear-den, C., DeMott, P., Flossmann, A., Heymsfield, A., Huang, Y.,Kalesse, H., Kanji, Z. A., Korolev, A., Kirchgaessner, A., Lasher-Trapp, S., Leisner, T., McFarquhar, G., Phillips, V., Stith, J., andSullivan, S.: Secondary Ice Production: Current State of the Sci-ence and Recommendations for the Future, Meteor. Monogr.,58, 7.1–7.20, https://doi.org/10.1175/AMSMONOGRAPHS-D-16-0014.1, 2017.
Findeisen, W.: Kolloid-meteorologische Vorgänge bei Neider-schlagsbildung, Meteor. Z, 55, 121–133, 1938.
Geerts, B., Pokharel, B., and Kristovich, D. a. R.: Blowing Snowas a Natural Glaciogenic Cloud Seeding Mechanism, Mon.Weather Rev., 143, 5017–5033, https://doi.org/10.1175/MWR-D-15-0241.1, 2015.
Gordon, M., Savelyev, S., and Taylor, P. A.: Measurements of blow-ing snow, part II: Mass and number density profiles and saltationheight at Franklin Bay, NWT, Canada, Cold Reg. Sci. Technol.,55, 75–85, https://doi.org/10.1016/j.coldregions.2008.07.001,2009.
Griggs, D. J. and Choularton, T. W.: A laboratory study of sec-ondary ice particle production by the fragmentation of rime andvapour-grown ice crystals, Q. J. Roy. Meteor. Soc., 112, 149–163, https://doi.org/10.1002/qj.49711247109, 1986.
Gultepe, I., Isaac, G., and Cober, S.: Ice crystal number concentra-tion versus temperature for climate studies, Int. J. Climatol., 21,1281–1302, https://doi.org/10.1002/joc.642, 2001.
Hallett, J. and Mossop, S.: Production of secondary iceparticles during the riming process, Nature, 249, 26–28,https://doi.org/10.1038/249026a0, 1974.
Hoose, C. and Möhler, O.: Heterogeneous ice nucleationon atmospheric aerosols: a review of results from labo-ratory experiments, Atmos. Chem. Phys., 12, 9817–9854,https://doi.org/10.5194/acp-12-9817-2012, 2012.
Korolev, A. V., Isaac, G. A., and Hallett, J.: Ice particlehabits in Arctic clouds, Geophys. Res. Lett., 26, 1299–1302,https://doi.org/10.1029/1999GL900232, 1999.
Korolev, A., Isaac, G. A., and Hallett, J.: Ice particle habits instratiform clouds, Q. J. Roy. Meteor. Soc., 126, 2873–2902,https://doi.org/10.1002/qj.49712656913, 2006.
Korolev, A. V., Isaac, G. A., Cober, S. G., Strapp, J. W.,and Hallett, J.: Microphysical characterization of mixed-phase clouds, Q. J. Roy. Meteor. Soc., 129, 39–65,https://doi.org/10.1256/qj.01.204, 2003.
Lacher, L., Lohmann, U., Boose, Y., Zipori, A., Herrmann, E.,Bukowiecki, N., Steinbacher, M., and Kanji, Z. A.: The Hori-zontal Ice Nucleation Chamber (HINC): INP measurements atconditions relevant for mixed-phase clouds at the High AltitudeResearch Station Jungfraujoch, Atmos. Chem. Phys., 17, 15199–15224, https://doi.org/10.5194/acp-17-15199-2017, 2017.
Lachlan-Cope, T., Ladkin, R., Turner, J., and Davison, P.: Ob-servations of cloud and precipitation particles on the Av-ery Plateau, Antarctic Peninsula, Antarct. Sci., 13, 339–348,https://doi.org/10.1017/S0954102001000475, 2001.
Lauber, A., Kiselev, A., Pander, T., Handmann, P., and Leisner, T.:Secondary ice formation during freezing of levitated droplets, J.Atmos. Sci., accepted, 2018.
Li, L. and Pomeroy, J. W.: Estimates of Threshold WindSpeeds for Snow Transport Using Meteorological Data, J.App. Meteorol., 36, 205–213, https://doi.org/10.1175/1520-0450(1997)036<0205:EOTWSF>2.0.CO;2, 1997.
Lloyd, G., Dearden, C., Choularton, T. W., Crosier, J., and Bower,K. N.: Observations of the Origin and Distribution of Icein Cold, Warm, and Occluded Frontal Systems during theDIAMET Campaign, Mon. Weather Rev., 142, 4230–4255,https://doi.org/10.1175/MWR-D-13-00396.1, 2014.
Lloyd, G., Choularton, T. W., Bower, K. N., Gallagher, M. W.,Connolly, P. J., Flynn, M., Farrington, R., Crosier, J., Sch-lenczek, O., Fugal, J., and Henneberger, J.: The origins ofice crystals measured in mixed-phase clouds at the high-alpine site Jungfraujoch, Atmos. Chem. Phys., 15, 12953–12969,https://doi.org/10.5194/acp-15-12953-2015, 2015.
Lohmann, U., Henneberger, J., Henneberg, O., Fugal, J. P.,Bühl, J., and Kanji, Z. A.: Persistence of orographicmixed-phase clouds, Geophys. Res. Lett., 43, 10512–10519,https://doi.org/10.1002/2016GL071036, 2016GL071036, 2016.
Mahesh, A., Eager, R., Campbell, J. R., and Spinhirne, J. D.:Observations of blowing snow at the South Pole, J. Geophys.Res.-Atmos., 108, 4707, https://doi.org/10.1029/2002JD003327,2003.
Mellor, M. and Fellers, G.: Concentration and flux of wind-blownsnow, Special Report 86-11, U.S. Army Cold Regions Researchand Engineering Laboratory, Hanover, New Hampshire 03755-1290, 1986.
Mülmenstädt, J., Sourdeval, O., Delanoë, J., and Quaas, J.: Fre-quency of occurrence of rain from liquid-, mixed-, and ice-phaseclouds derived from A-Train satellite retrievals, Geophys. Res.Lett., 42, 6502–6509, https://doi.org/10.1002/2015GL064604,2015.
Murray, B. J., O’Sullivan, D., Atkinson, J. D., and Webb,M. E.: Ice nucleation by particles immersed in super-cooled cloud droplets, Chem. Soc. Rev., 41, 6519–6554,https://doi.org/10.1039/C2CS35200A, 2012.
Nishimura, K. and Nemoto, M.: Blowing snow at Mizuho sta-tion, Antarctica, Philos. T. Roy. Soc. A, 363, 1647–1662,https://doi.org/10.1098/rsta.2005.1599, 2005.
Palm, S. P., Yang, Y., Spinhirne, J. D., and Marshak, A.:Satellite remote sensing of blowing snow properties
Atmos. Chem. Phys., 18, 8909–8927, 2018 www.atmos-chem-phys.net/18/8909/2018/

A. Beck et al.: Impact of surface and near-surface processes on ice crystal concentrations 8927
over Antarctica, J. Geophys. Res.-Atmos., 116, d16123,https://doi.org/10.1029/2011JD015828, 2011.
Rangno, A. L. and Hobbs, P. V.: Ice particles in stratiform cloudsin the Arctic and possible mechanisms for the production of highice concentrations, J. Geophys. Res.-Atmos., 106, 15065–15075,https://doi.org/10.1029/2000JD900286, 2001.
Roe, G. H.: Orographic Precipitation,Annu. Rev. Earth Pl. Sc., 33, 645–671,https://doi.org/10.1146/annurev.earth.33.092203.122541, 2015.
Rogers, D. C. and Vali, G.: Ice Crystal Produc-tion by Mountain Surfaces, J. Clim. Appl. Mete-orol., 26, 1152–1168, https://doi.org/10.1175/1520-0450(1987)026<1152:ICPBMS>2.0.CO;2, 1987.
Rotunno, R. and Houze, R. A.: Lessons on orographic precipitationfrom the Mesoscale Alpine Programme, Q. J. Roy. Meteor. Soc.,133, 811–830, https://doi.org/10.1002/qj.67, 2007.
Schlenczek, O., Fugal, J. P., Lloyd, G., Bower, K. N., Choularton,T. W., Flynn, M., Crosier, J., and Borrmann, S.: Microphysi-cal Properties of Ice Crystal Precipitation and Surface-GeneratedIce Crystals in a High Alpine Environment in Switzerland, J.Appl. Meteorol., 56, 433–453, https://doi.org/10.1175/JAMC-D-16-0060.1, 2017.
Schmidt, R. A.: Vertical profiles of wind speed, snow concentration,and humidity in blowing snow, Bound.-Lay. Meteorol., 23, 223–246, https://doi.org/10.1007/BF00123299, 1982.
Vali, G., Leon, D., and Snider, J. R.: Ground-layer snowclouds, Q. J. Roy. Meteor. Soc., 138, 1507–1525,https://doi.org/10.1002/qj.1882, 2012.
Vardiman, L.: The Generation of Secondary Ice Parti-cles in Clouds by Crystal-Crystal Collision, J. At-mos. Sci., 35, 2168–2180, https://doi.org/10.1175/1520-0469(1978)035<2168:TGOSIP>2.0.CO;2, 1978.
Vionnet, V., Guyomarch, G., Bouvet, F. N., Martin, E., Du-rand, Y., Bellot, H., Bel, C., and Pugliese, P.: Occurrence ofblowing snow events at an alpine site over a 10-year period:Observations and modelling, Adv. Water Resour., 55, 53–63,https://doi.org/10.1016/j.advwatres.2012.05.004, 2013.
Wegener, A.: Thermodynamik der Atmosphäre, Barth, Leipzig,1911.
Wolf, V., Kuhn, T., Milz, M., Voelger, P., Krämer, M., and Rolf,C.: Ice particle properties of Arctic cirrus, Atmos. Chem. Phys.Discuss., https://doi.org/10.5194/acp-2018-386, in review, 2018.
Yang, J. and Yau, M. K.: A New Triple-Moment Blow-ing Snow Model, Bound.-Lay. Meteorol., 126, 137–155,https://doi.org/10.1007/s10546-007-9215-4, 2008.
www.atmos-chem-phys.net/18/8909/2018/ Atmos. Chem. Phys., 18, 8909–8927, 2018