impact of the hershey foods layoffs in nfectionary … · - 1 - impact of the hershey foods layoffs...
TRANSCRIPT

- 1 -
IImmppaacctt ooff tthhee HHeerrsshheeyy FFooooddss LLaayyooffffss iinn CCoonnffeeccttiioonnaarryy
MMaannuuffaaccttuurriinngg oonn DDaauupphhiinn CCoouunnttyy aanndd
SSuurrrroouunnddiinngg AArreeaass
CCeenntteerr ffoorr WWoorrkkffoorrccee IInnffoorrmmaattiioonn && AAnnaallyyssiiss
((CCWWIIAA))
MMaayy 22000077

This page left intentionally blank.
- 2 -

- 3 -
Executive Summary
This report outlines the overall employment and specific industries and occupations likely to be impacted by a layoff in the confectionary manufacturing industry. All data provided are estimates. (Note: Dauphin County was selected as the impact site, however, it is highly likely that the job and output loss will also affect bordering counties and beyond, including outside Pennsylvania. For example, it is not known where the specific supplier/customer companies to Hershey Foods are located.) CWIA based its impact analysis on layoff estimates announced by the Hershey Foods Corporation. Hershey Foods Corporation estimates 900 jobs will be eliminated at its three Derry Township plants in Dauphin County by 2010. By 2010, Dauphin county and surrounding areas can expect a loss of 900 jobs in the confectionary manufacturing industry, 1,050 jobs in the supplier/customer industries, and 450 jobs in the peripheral industries, for a total loss of approximately 2,400 jobs.
Across all industries, Dauphin County and the surrounding areas can expect a total output (sales) loss of approximately 570 million dollars between by 2010. Nearly 109 million dollars in employee compensation, or wages and benefits, will be lost. State and local government will lose over 18 million dollars in tax revenues from businesses and individuals. Other industries projected to lose at least 50 jobs as a result of the confectionary manufacturing layoff include wholesale trade; warehousing and storage; food service and drinking places; management of companies and enterprises; and truck transportation. Occupations expected to experience the most significant job losses (at least 100) include: material moving occupations; miscellaneous production workers; retail sales workers; food processing occupations; material recording, scheduling, dispatching, and distributing occupations; and motor vehicle operators. Occupations within Hershey Foods that are expected to experience the most significant job losses (at least 40) include packers and packagers, hand; food batch makers; packaging and filling machine operators; and maintenance and repair workers, general. Workers in these occupations already possess a range of knowledge, skills, and abilities that are applicable in related occupations and which can be enhanced by additional training to prepare them for work in other industries. Approximately 73 percent of Derry Township workers (from all industries) live in Dauphin and Lebanon counties. Another 16 percent commute from Lancaster, Cumberland, and York counties.

- 4 -
Data
The following tables in the appendices will provide the specific industries and occupations associated with a layoff in the confectionary manufacturing industry (NAICS 31132 and 31133). In addition, included is a reemployment assessment report for a typical Sugar & Confectionery Product Manufacturer (NAICS 3113) laying off 900 workers. Appendix A - Outlines the overall economic impact by a layoff in the confectionary manufacturing industry. Appendix B – Outlines industries most likely affected (job loss of 10 or more) by a layoff in the confectionary manufacturing industry. Appendix C – Outlines industries most likely affected (output loss of 1 million dollars or more) by a layoff in the confectionary manufacturing industry. Appendix D - Outlines all occupations in all industries most likely affected (job loss of 10 or more) by a layoff in the confectionary manufacturing industry. Appendix E - Lists the NAICS codes for each identified industry. Appendix F – Reemployment Assessment Report for a Sugar & Confectionary Product Manufacturer (NAICS 3113) laying off 900 workers.
• Attachment 1 – Pennsylvania Staffing Pattern of a Sugar & Confectionary Manufacturer • Attachment 2 – Reemployment Assessment for a Sugar & Confectionary Manufacturer • Attachment 3 – Related Occupations for "Fair to Difficult" Reemployment Prospects • Attachment 4 – Related Occupations for "Difficult" Reemployment Prospects • Attachment 5 – Job Openings, Annual Wages & Employing Industry Data for the Related Occupations • Attachment 6 – 2006 High Priority Occupations for South Central Workforce Investment Area • Attachment 7 - Average Wages for SOC Occupations within a Sugar & Confectionery Product Manufacturer
Appendix G – Labor shed analysis for Derry Township, Dauphin County, site of the Hershey Foods layoff, using Local Employment Dynamics (LED).
- 5 -
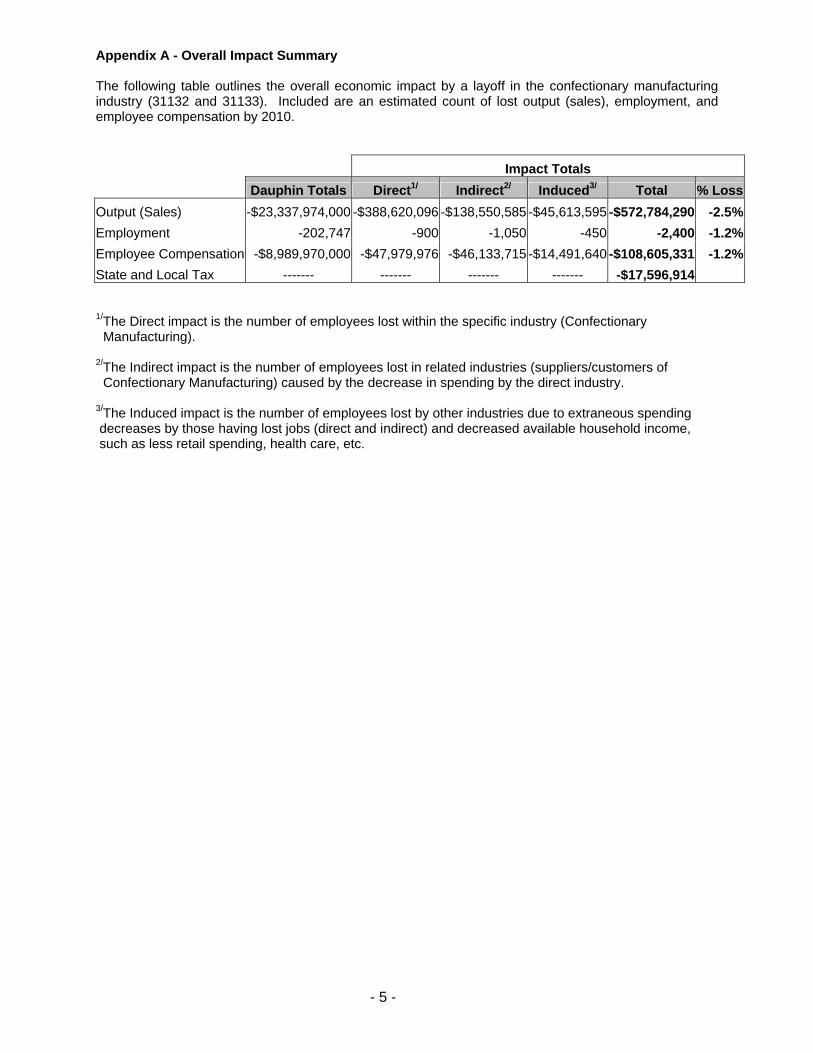
Appendix A - Overall Impact Summary The following table outlines the overall economic impact by a layoff in the confectionary manufacturing industry (31132 and 31133). Included are an estimated count of lost output (sales), employment, and employee compensation by 2010. Impact Totals Dauphin Totals Direct1/ Indirect2/ Induced3/ Total % LossOutput (Sales) -$23,337,974,000 -$388,620,096 -$138,550,585 -$45,613,595 -$572,784,290 -2.5%Employment -202,747 -900 -1,050 -450 -2,400 -1.2%Employee Compensation -$8,989,970,000 -$47,979,976 -$46,133,715 -$14,491,640 -$108,605,331 -1.2%State and Local Tax ------- ------- ------- ------- -$17,596,914 1/The Direct impact is the number of employees lost within the specific industry (Confectionary Manufacturing).
2/The Indirect impact is the number of employees lost in related industries (suppliers/customers of Confectionary Manufacturing) caused by the decrease in spending by the direct industry.
3/The Induced impact is the number of employees lost by other industries due to extraneous spending decreases by those having lost jobs (direct and indirect) and decreased available household income, such as less retail spending, health care, etc.

Appendix B - Industry Job Loss List The following table outlines all industries most likely affected (job loss of 10 or more) by a layoff in the confectionary manufacturing industry. Included are an estimated count of lost jobs by 2010 and the type of impact.
Industry Impact Type Employment Loss Confectionary Manufacturing Direct -900Wholesale trade Indirect -216Warehousing and storage Indirect -114Food services and drinking places Indirect and Induced -100Management of companies and enterprises Indirect -66Truck transportation Indirect -54Cattle ranching and farming Indirect -44Employment services Indirect -41General merchandise stores Indirect and Induced -36Food and beverage stores Indirect and Induced -33Real estate Indirect and Induced -31Advertising and related services Indirect -29Offices of physicians- dentists- and other health Induced -26Hospitals Induced -25Fluid milk manufacturing Indirect -24Automotive repair and maintenance Indirect and Induced -24Motor vehicle and parts dealers Indirect and Induced -23Monetary authorities and depository credit Indirect and Induced -21Clothing and clothing accessories stores Indirect and Induced -21Spectator sports Induced -18Nursing and residential care facilities Induced -17Services to buildings and dwellings Indirect and Induced -17Legal services Indirect and Induced -16Architectural and engineering services Indirect -16Miscellaneous store retailers Induced -16Radio and television broadcasting Indirect -16Civic- social- professional and similar organizations Indirect and Induced -15Building material and garden supply stores Indirect and Induced -15All other plastic products Indirect -14Nonstore retailers Indirect and Induced -14Management consulting services Indirect -13Commercial machinery repair and maintenance Indirect -13Social assistance- except child day care services Induced -13Health and personal care stores Indirect and Induced -13Hotels and motels- including casino hotels Indirect and Induced -12Gasoline stations Indirect and Induced -12Business support services Indirect -12Newspaper publishers Indirect -11
- 6 -

Industry Impact Type Employment Loss Couriers and messengers Indirect -11Insurance carriers Indirect and Induced -11Accounting and bookkeeping services Indirect -10Power generation and supply Indirect -10Other amusement, gambling, and recreation Induced -10Remaining Industries -245Total -2,400
- 7 -

Appendix C - Industry Output Loss List The following table outlines all industries most likely affected (output loss of 1 million or more) by a layoff in the confectionary manufacturing industry. Included are an estimate of lost output (sales) by 2010 and the type of impact.
Industry Impact Type Output Loss Confectionary Manufacturing Direct -$389,995,520Wholesale trade Indirect -$33,023,904Management of companies and enterprises Indirect -$15,039,955Fluid milk manufacturing Indirect -$13,220,010Warehousing and storage Indirect -$7,253,775Truck transportation Indirect -$7,238,605Owner-occupied dwellings Induced -$6,995,094Power generation and supply Indirect -$5,327,994Real estate Indirect and Induced -$4,716,506Food services and drinking places Indirect and Induced -$4,603,919Advertising and related services Indirect -$4,460,095Monetary authorities and depository credit Indirect and Induced -$4,188,326Hospitals Induced -$2,868,548Cattle ranching and farming Indirect -$2,604,167Radio and television broadcasting Indirect -$2,584,694All other plastic products Indirect -$2,493,100Insurance carriers Indirect and Induced -$2,481,420Telecommunications Indirect and Induced -$2,423,905Offices of physicians- dentists- and other health Induced -$2,279,742Motor vehicle and parts dealers Indirect and Induced -$2,202,062Legal services Indirect and Induced -$2,193,272Nonstore retailers Indirect and Induced -$2,005,636Automotive repair and maintenance Indirect and Induced -$1,947,781Food and beverage stores Indirect and Induced -$1,821,493General merchandise stores Indirect and Induced -$1,798,904All other miscellaneous professional and technical Indirect -$1,755,748Architectural and engineering services Indirect -$1,732,008Commercial machinery repair and maintenance Indirect -$1,612,138Management consulting services Indirect -$1,462,184Newspaper publishers Indirect -$1,411,690Natural gas distribution Indirect -$1,408,236Rail transportation Indirect -$1,388,427Building material and garden supply stores Indirect and Induced -$1,295,099Employment services Indirect -$1,169,498Clothing and clothing accessories stores Indirect and Induced -$1,132,659Remaining Industries -$32,648,176Total -$572,784,290
- 8 -
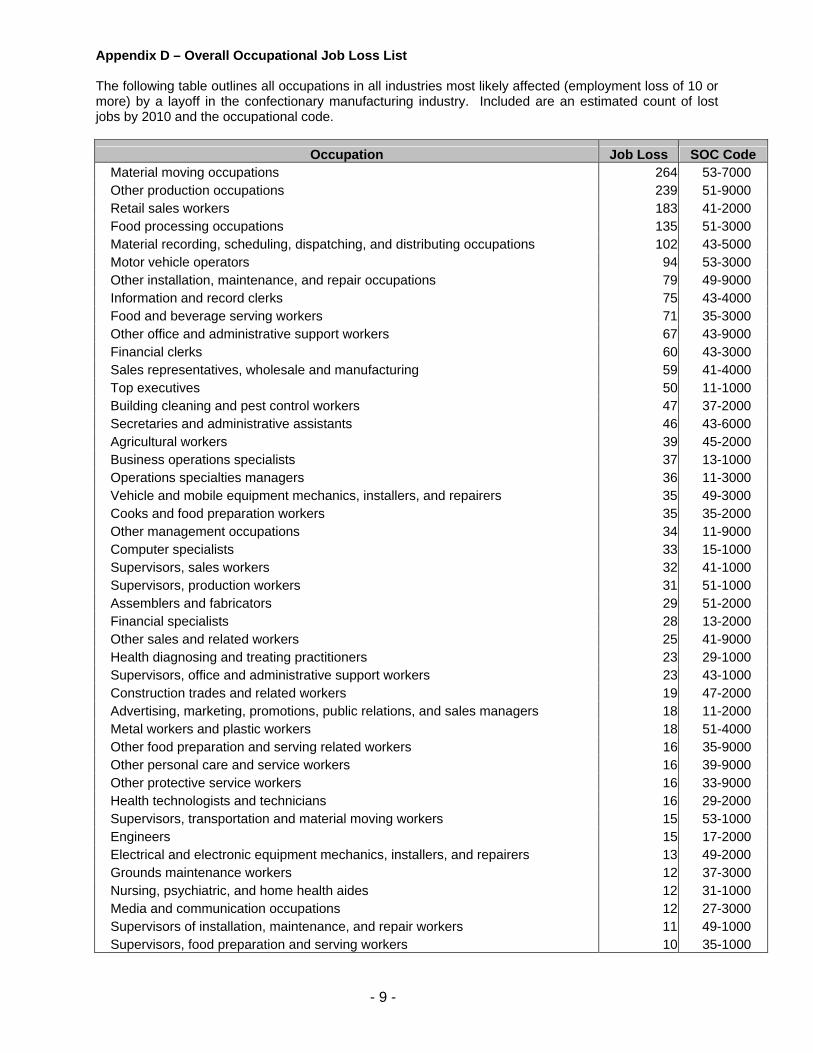
Appendix D – Overall Occupational Job Loss List The following table outlines all occupations in all industries most likely affected (employment loss of 10 or more) by a layoff in the confectionary manufacturing industry. Included are an estimated count of lost jobs by 2010 and the occupational code.
Occupation Job Loss SOC Code Material moving occupations 264 53-7000 Other production occupations 239 51-9000 Retail sales workers 183 41-2000 Food processing occupations 135 51-3000 Material recording, scheduling, dispatching, and distributing occupations 102 43-5000 Motor vehicle operators 94 53-3000 Other installation, maintenance, and repair occupations 79 49-9000 Information and record clerks 75 43-4000 Food and beverage serving workers 71 35-3000 Other office and administrative support workers 67 43-9000 Financial clerks 60 43-3000 Sales representatives, wholesale and manufacturing 59 41-4000 Top executives 50 11-1000 Building cleaning and pest control workers 47 37-2000 Secretaries and administrative assistants 46 43-6000 Agricultural workers 39 45-2000 Business operations specialists 37 13-1000 Operations specialties managers 36 11-3000 Vehicle and mobile equipment mechanics, installers, and repairers 35 49-3000 Cooks and food preparation workers 35 35-2000 Other management occupations 34 11-9000 Computer specialists 33 15-1000 Supervisors, sales workers 32 41-1000 Supervisors, production workers 31 51-1000 Assemblers and fabricators 29 51-2000 Financial specialists 28 13-2000 Other sales and related workers 25 41-9000 Health diagnosing and treating practitioners 23 29-1000 Supervisors, office and administrative support workers 23 43-1000 Construction trades and related workers 19 47-2000 Advertising, marketing, promotions, public relations, and sales managers 18 11-2000 Metal workers and plastic workers 18 51-4000 Other food preparation and serving related workers 16 35-9000 Other personal care and service workers 16 39-9000 Other protective service workers 16 33-9000 Health technologists and technicians 16 29-2000 Supervisors, transportation and material moving workers 15 53-1000 Engineers 15 17-2000 Electrical and electronic equipment mechanics, installers, and repairers 13 49-2000 Grounds maintenance workers 12 37-3000 Nursing, psychiatric, and home health aides 12 31-1000 Media and communication occupations 12 27-3000 Supervisors of installation, maintenance, and repair workers 11 49-1000 Supervisors, food preparation and serving workers 10 35-1000
- 9 -

Occupation Job Loss SOC Code Life, physical, and social science technicians 10 19-4000 Sales representatives, services 10 41-3000 Remaining Occupations 149 Total 2,400
- 10 -
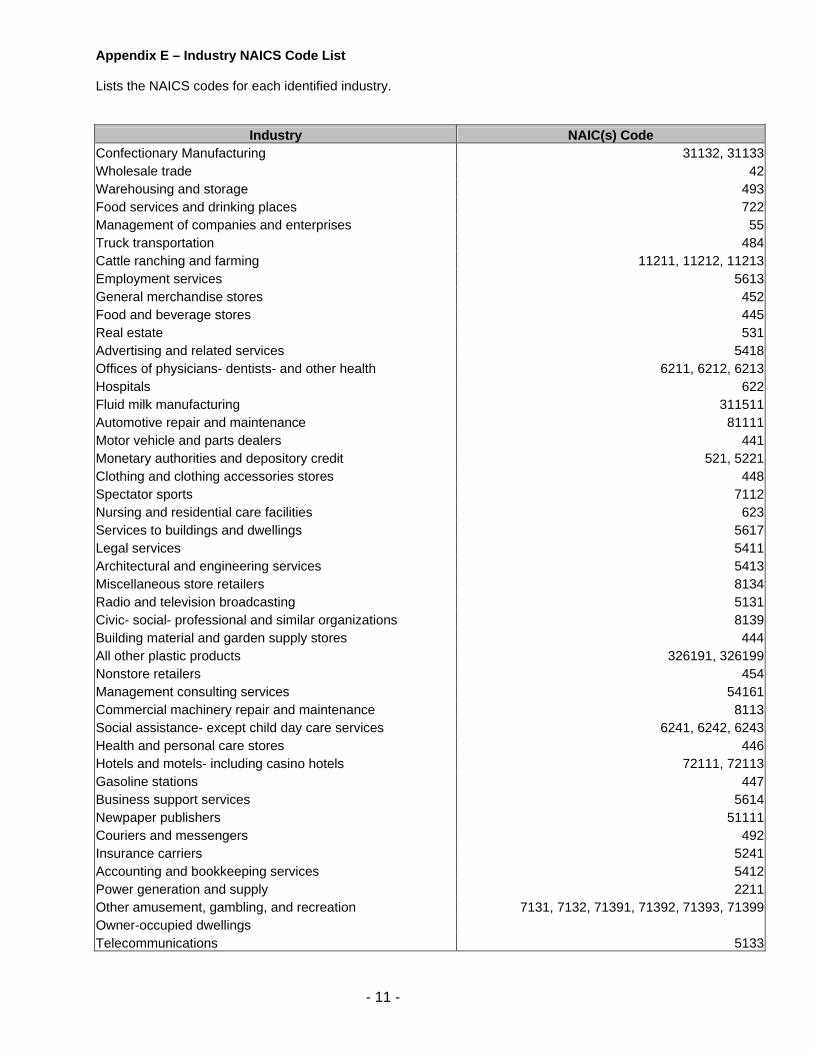
Appendix E – Industry NAICS Code List Lists the NAICS codes for each identified industry.
Industry NAIC(s) Code Confectionary Manufacturing 31132, 31133Wholesale trade 42Warehousing and storage 493Food services and drinking places 722Management of companies and enterprises 55Truck transportation 484Cattle ranching and farming 11211, 11212, 11213Employment services 5613General merchandise stores 452Food and beverage stores 445Real estate 531Advertising and related services 5418Offices of physicians- dentists- and other health 6211, 6212, 6213Hospitals 622Fluid milk manufacturing 311511Automotive repair and maintenance 81111Motor vehicle and parts dealers 441Monetary authorities and depository credit 521, 5221Clothing and clothing accessories stores 448Spectator sports 7112Nursing and residential care facilities 623Services to buildings and dwellings 5617Legal services 5411Architectural and engineering services 5413Miscellaneous store retailers 8134Radio and television broadcasting 5131Civic- social- professional and similar organizations 8139Building material and garden supply stores 444All other plastic products 326191, 326199Nonstore retailers 454Management consulting services 54161Commercial machinery repair and maintenance 8113Social assistance- except child day care services 6241, 6242, 6243Health and personal care stores 446Hotels and motels- including casino hotels 72111, 72113Gasoline stations 447Business support services 5614Newpaper publishers 51111Couriers and messengers 492Insurance carriers 5241Accounting and bookkeeping services 5412Power generation and supply 2211Other amusement, gambling, and recreation 7131, 7132, 71391, 71392, 71393, 71399Owner-occupied dwellings Telecommunications 5133
- 11 -

Industry NAIC(s) Code All other miscellaneous professional and technical 54191, 54193, 54199Natural gas distribution 2212Rail transportation 482
- 12 -

Appendix F – Reemployment Assessment Report for a Sugar & Confectionery Product Manufacturer (NAICS 3113) This reemployment assessment report is for a typical Sugar & Confectionery Product Manufacturer (NAICS 3113) employing 900 workers in Dauphin County. The geographical areas affected by these potential layoffs are the Harrisburg-Carlisle Metropolitan Statistical Area (MSA), which includes Cumberland, Dauphin and Perry counties; and the South Central Workforce Investment Area (WIA), which includes Adams, Cumberland, Dauphin, Franklin, Juniata, Lebanon, Perry and York counties. Attachment 1 provides an estimated workforce composition of a candy manufacturer with 900 employees, based on the industry-staffing pattern. Assuming a workforce of this makeup, 900 employees are affected, representing 94 detailed occupations. Another 7 persons fall into occupations that do not fall under a specific SOC code. These individuals are labeled as “all others” and not included in the following analysis. The prospects for reemployment in the 94 SOC-coded occupations have been classified into one of four categories (Attachment 2). This reemployment outlook assumes that the current companies in these areas remain and continue to hire workers at the same rates as they have historically.
• Seventy-eight occupations representing 393 employees, or 44 percent, are classified as “Good”
or “Fair” Reemployment Prospects. Workers in this category should find sufficient job openings within the Harrisburg-Carlisle MSA or South Central WIA.
• “Fair to Difficult” prospects exist for 10 occupations representing 23 percent of the layoffs. These
211 employees may have difficulty finding work in their current occupation within their immediate geographical area. However, prospects for reemployment improve if the dislocated employees are willing to relocate elsewhere in the state.
• The remaining 6 occupations represent 289 employees. Reemployment prospects for these
workers – primarily food production workers – are classified as “Difficult”. These dislocated employees can expect substantial difficulty finding reemployment in their current occupation within their current region and throughout the commonwealth.
• Fifty-six percent of affected employees work in the occupations that fall into the “Fair to Difficult”
or “Difficult” category. For these occupations, lists of jobs that require similar skills have been identified and are presented in Attachment 3 and 4. Additional information on these related occupations is included in Attachment 5.
• Attachment 6 is the 2006 High Priority Occupations listing for the South Central WIA. Workforce
and training program dollars in the commonwealth are targeted to these occupations.
• Average wage data for Harrisburg-Carlisle MSA, South Central WIA and the commonwealth are provided in Attachment 7 for the SOC occupations impacted by this possible layoff.
Some additional characteristics of Dauphin County were gathered from the March 2007 edition of the Pennsylvania Civilian Labor Force Packet. The most current version of this publication is available at www.paworkstats.state.pa.us.
• Dauphin County had a seasonally adjusted unemployment rate of 3.4 percent in March 2007, down from 3.6 in February 2007. Dauphin’s current rate is lower than both the state (3.8 percent) and the nation (4.4 percent).
• In March 2007, the labor force in Dauphin County totaled 136,400. This county accounts for
about 19 percent of the South Central WIA labor force that same month (724,100).
- 13 -

Attachment 1 – Pennsylvania Staffing Pattern of a Sugar & Confectionary Manufacturer
SOC Code Occupation Title
Percent of
Industry Estimated
Emp.
53-7064 Packers & Packagers, Hand 13.2 119 51-3092 Food Batchmakers 12.1 109 51-9111 Packaging & Filling Machine Operators 12.1 109 49-9042 Maintenance & Repair Workers, General 4.4 39 41-2031 Retail Salespersons 4.1 37 51-9198 Helpers--Production Workers 4.0 36 51-3091 Food & Tobacco Roasting, Baking & Drying Machine Oprs 3.3 30 51-9023 Mixing & Blending Machine Operators 3.3 30 37-2011 Janitors & Cleaners 2.6 24 49-9041 Industrial Machinery Mechanics 2.4 22 51-1011 Supervisors - Production & Operating Workers 2.1 19 51-9021 Crushing, Grinding & Polishing Machine Oprs 2.2 19 53-7051 Industrial Truck & Tractor Operators 2.1 19 51-3093 Food Cooking Machine Operators 2.0 18 51-3099 Food Processing Workers, Other 1.8 17 53-7062 Laborers & Freight, Stock & Material Movers, Hand 1.9 17 51-9061 Inspectors, Testers, Sorters, Samplers & Weighers 1.8 16 41-2011 Cashiers 1.4 12 43-9061 Office Clerks, General 1.3 11 51-2092 Team Assemblers 1.3 11 43-5071 Shipping, Receiving & Traffic Clerks 0.9 8 51-3011 Bakers 0.9 8 51-9041 Extruding, Forming, Pressing & Compacting Machine Oprs 0.8 8 11-1021 General & Operations Managers 0.8 7 43-3031 Bookkeeping, Accounting & Auditing Clerks 0.8 7 43-4051 Customer Service Representatives 0.8 7 ** All Other Occupations 1.0 7 41-4012 Sales Representatives 0.7 6 51-9193 Cooling & Freezing Equipment Operators 0.6 6 35-2021 Food Preparation Workers 0.6 5 53-3033 Truck Drivers, Light or Delivery Services 0.5 5 11-3051 Industrial Production Managers 0.4 4 35-3022 Counter Attendants: Cafeteria, Food Concession & Coffee Shop 0.5 4 43-6011 Executive Secretaries & Administrative Assistants 0.4 4 51-9012 Separating, Filtering, Precipitating & Still Machine Oprs 0.4 4 11-1011 Chief Executives 0.3 3 11-2022 Sales Managers 0.3 3 19-4011 Agricultural & Food Science Technicians 0.3 3 35-3031 Waiters & Waitresses 0.4 3 43-5061 Production, Planning & Expediting Clerks 0.3 3 43-5081 Stock Clerks & Order Fillers 0.3 3 51-9192 Cleaning, Washing & Metal Pickling Equipment Oprs 0.3 3 51-9199 Production Workers, Other 0.3 3
- 14 -

SOC Code Occupation Title
Percent of
Industry Estimated
Emp.
53-3032 Truck Drivers, Heavy & Tractor-Trailer 0.3 3 53-7011 Conveyor Operators & Tenders 0.3 3 53-7063 Machine Feeders & Offbearers 0.4 3 11-2021 Marketing Managers 0.2 2 11-3031 Financial Managers 0.3 2 13-2011 Accountants & Auditors 0.2 2 17-2112 Industrial Engineers 0.3 2 33-9032 Security Guards 0.3 2 35-9021 Dishwashers 0.3 2 41-1011 Supervisors - Retail Sales Workers 0.2 2 43-1011 Supervisors - Office & Administrative Support Workers 0.2 2 43-3051 Payroll & Timekeeping Clerks 0.2 2 43-4161 Human Resources Assistants 0.3 2 43-6014 Secretaries 0.2 2 49-1011 Supervisors - Mechanics, Installers & Repairers 0.2 2 49-9043 Maintenance Workers, Machinery 0.2 2 51-9195 Molders, Shapers & Casters, Ex. Metal & Plastic 0.2 2 11-3011 Administrative Services Managers 0.1 1 11-3021 Computer & Information Systems Managers 0.1 1 11-3041 Compensation & Benefits Manager 0.1 1 11-3061 Purchasing Managers 0.1 1 11-3071 Transportation, Storage & Distribution Managers 0.1 1 11-9199 Managers, Other 0.1 1 13-1022 Wholesale & Retail Buyers, Except Farm Products 0.1 1 13-1023 Purchasing Agents, Other 0.1 1 13-1199 Business Operations Specialists, Other 0.1 1 15-1041 Computer Support Specialists 0.2 1 15-1051 Computer Systems Analysts 0.2 1 15-1071 Network & Computer Systems Administrators 0.1 1 19-1012 Food Scientists & Technologists 0.1 1 19-4031 Chemical Technicians 0.1 1 35-1012 Supervisors - Food Preparation & Serving Workers 0.1 1 35-3021 Combined Food Preparation & Serving Workers 0.1 1 35-9031 Hosts & Hostesses: Restaurant, Lounge & Coffee Shop 0.1 1 35-9099 Food Preparation & Serving Related Workers, Other 0.1 1 37-1011 Supervisors - Housekeeping & Janitorial Workers 0.1 1 41-1012 Supervisors - Non-Retail Sales Workers 0.1 1 43-3021 Billing & Posting Clerks & Machine Operators 0.1 1 43-3061 Procurement Clerks 0.1 1 43-4151 Order Clerks 0.1 1 43-4171 Receptionists & Information Clerks 0.1 1 43-5111 Weighers, Measurers, Checkers & Samplers, Recordkeeping 0.1 1 43-9021 Data Entry Keyers 0.1 1 47-2111 Electricians 0.1 1 49-9021 Heating, A/C & Refrigeration Mechanics & Installers 0.1 1 51-9032 Cutting & Slicing Machine Operators 0.1 1 51-9121 Coating, Painting & Spraying Machine Oprs 0.1 1 51-9123 Painting, Coating & Decorating Workers 0.1 1
- 15 -

SOC Code Occupation Title
Percent of
Industry Estimated
Emp.
53-1021 Supervisors - Helpers & Laborers 0.1 1 53-1031 Supervisors - Transportation & Material-Moving Machine Oprs 0.1 1 53-7061 Cleaners of Vehicles & Equipment 0.1 1 53-7121 Tank Car, Truck & Ship Loaders 0.1 1 Total: 100 900
- 16 -
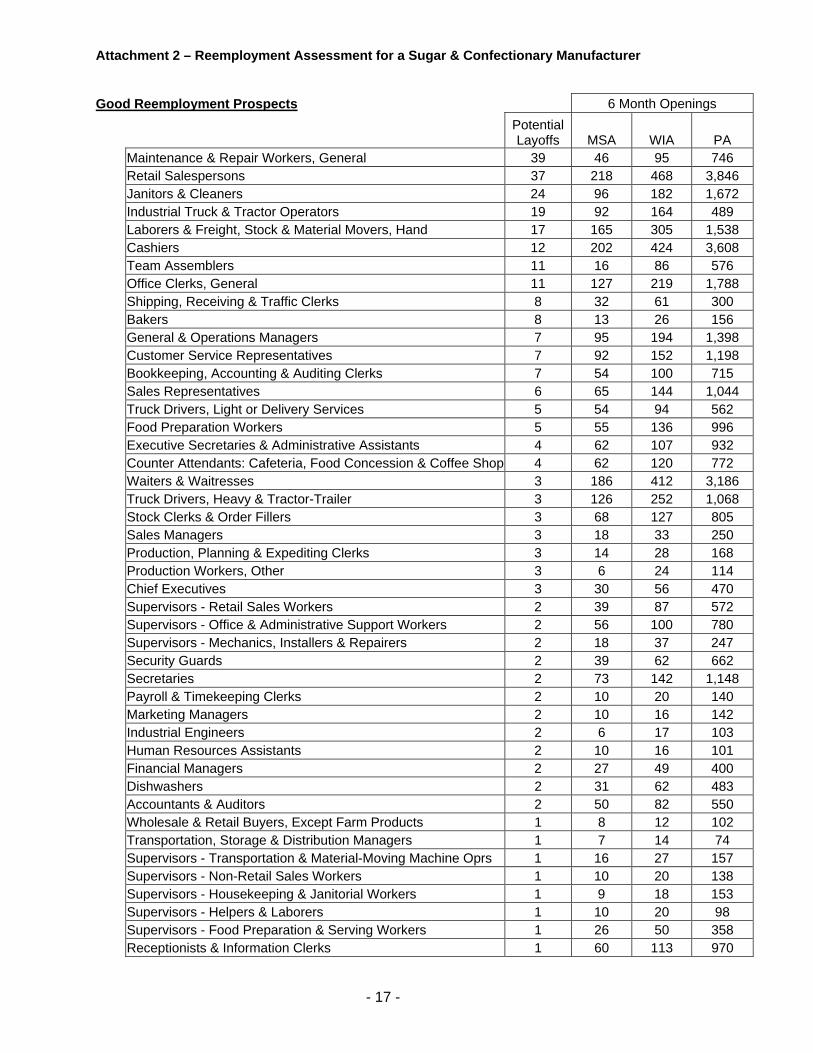
Attachment 2 – Reemployment Assessment for a Sugar & Confectionary Manufacturer Good Reemployment Prospects 6 Month Openings
Potential Layoffs MSA WIA PA
Maintenance & Repair Workers, General 39 46 95 746 Retail Salespersons 37 218 468 3,846 Janitors & Cleaners 24 96 182 1,672 Industrial Truck & Tractor Operators 19 92 164 489 Laborers & Freight, Stock & Material Movers, Hand 17 165 305 1,538 Cashiers 12 202 424 3,608 Team Assemblers 11 16 86 576 Office Clerks, General 11 127 219 1,788 Shipping, Receiving & Traffic Clerks 8 32 61 300 Bakers 8 13 26 156 General & Operations Managers 7 95 194 1,398 Customer Service Representatives 7 92 152 1,198 Bookkeeping, Accounting & Auditing Clerks 7 54 100 715 Sales Representatives 6 65 144 1,044 Truck Drivers, Light or Delivery Services 5 54 94 562 Food Preparation Workers 5 55 136 996 Executive Secretaries & Administrative Assistants 4 62 107 932 Counter Attendants: Cafeteria, Food Concession & Coffee Shop 4 62 120 772 Waiters & Waitresses 3 186 412 3,186 Truck Drivers, Heavy & Tractor-Trailer 3 126 252 1,068 Stock Clerks & Order Fillers 3 68 127 805 Sales Managers 3 18 33 250 Production, Planning & Expediting Clerks 3 14 28 168 Production Workers, Other 3 6 24 114 Chief Executives 3 30 56 470 Supervisors - Retail Sales Workers 2 39 87 572 Supervisors - Office & Administrative Support Workers 2 56 100 780 Supervisors - Mechanics, Installers & Repairers 2 18 37 247 Security Guards 2 39 62 662 Secretaries 2 73 142 1,148 Payroll & Timekeeping Clerks 2 10 20 140 Marketing Managers 2 10 16 142 Industrial Engineers 2 6 17 103 Human Resources Assistants 2 10 16 101 Financial Managers 2 27 49 400 Dishwashers 2 31 62 483 Accountants & Auditors 2 50 82 550 Wholesale & Retail Buyers, Except Farm Products 1 8 12 102 Transportation, Storage & Distribution Managers 1 7 14 74 Supervisors - Transportation & Material-Moving Machine Oprs 1 16 27 157 Supervisors - Non-Retail Sales Workers 1 10 20 138 Supervisors - Housekeeping & Janitorial Workers 1 9 18 153 Supervisors - Helpers & Laborers 1 10 20 98 Supervisors - Food Preparation & Serving Workers 1 26 50 358 Receptionists & Information Clerks 1 60 113 970
- 17 -

Good Reemployment Prospects (Cont.) 6 Month Openings
Potential Layoffs MSA WIA PA
Purchasing Managers 1 4 8 62 Purchasing Agents, Other 1 10 22 134 Procurement Clerks 1 2 6 24 Painting, Coating & Decorating Workers 1 4 6 15 Network & Computer Systems Administrators 1 18 24 200 Managers, Other 1 76 122 899 Hosts & Hostesses: Restaurant, Lounge & Coffee Shop 1 20 36 284 Heating, A/C & Refrigeration Mechanics & Installers 1 13 24 146 Food Preparation & Serving Related Workers, Other 1 12 18 156 Electricians 1 18 43 320 Data Entry Keyers 1 12 18 156 Cutting & Slicing Machine Operators 1 2 4 18 Computer Systems Analysts 1 48 62 305 Computer Support Specialists 1 24 34 293 Computer & Information Systems Managers 1 28 37 228 Compensation & Benefits Manager 1 6 14 100 Combined Food Preparation & Serving Workers 1 76 208 1,902 Coating, Painting & Spraying Machine Oprs 1 2 8 44 Cleaners of Vehicles & Equipment 1 12 28 220 Chemical Technicians 1 2 2 36 Business Operations Specialists, Other 1 67 102 670 Billing & Posting Clerks & Machine Operators 1 12 23 172 Administrative Services Managers 1 19 32 234 307 Fair Reemployment Prospects 6 Month Openings
Potential Layoffs MSA WIA PA
Conveyor Operators & Tenders 3 N/A 12 40 Food Scientists & Technologists 1 0 1 4 Helpers--Production Workers 36 14 59 313 Industrial Production Managers 4 2 10 80 Inspectors, Testers, Sorters, Samplers & Weighers 16 6 22 154 Machine Feeders & Offbearers 3 N/A 5 18 Maintenance Workers, Machinery 2 N/A 8 46 Order Clerks 1 0 6 N/A Supervisors - Production & Operating Workers 19 14 49 332 Weighers, Measurers, Checkers & Samplers, Recordkeeping 1 0 2 19 86 Fair to Difficult Reemployment Prospects 6 Month Openings
Potential Layoffs MSA WIA PA
Agricultural & Food Science Technicians 3 0 1 8 Cleaning, Washing & Metal Pickling Equipment Oprs 3 N/A N/A 10 Crushing, Grinding & Polishing Machine Oprs 19 2 8 38 Extruding, Forming, Pressing & Compacting Machine Oprs 8 N/A 3 28
- 18 -

Fair to Difficult Reemployment Prospects (Cont.) 6 Month Openings
Potential Layoffs MSA WIA PA
Industrial Machinery Mechanics 22 2 12 83 Mixing & Blending Machine Operators 30 2 8 64 Molders, Shapers & Casters, Ex. Metal & Plastic 2 1 1 14 Packers & Packagers, Hand 119 71 134 452 Separating, Filtering, Precipitating & Still Machine Oprs 4 0 1 28 Tank Car, Truck & Ship Loaders 1 N/A N/A 1 211 Difficult Reemployment Prospects 6 Month Openings
Potential Layoffs MSA WIA PA
Cooling & Freezing Equipment Operators 6 N/A N/A 2 Food & Tobacco Roasting, Baking & Drying Machine Oprs 30 0 2 15 Food Batchmakers 109 4 10 66 Food Cooking Machine Operators 18 0 2 8 Food Processing Workers, Other 17 N/A N/A N/A Packaging & Filling Machine Operators 109 1 8 98 289
- 19 -

Attachment 3 – Related Occupations for "Fair to Difficult" Reemployment Prospects
Agricultural & Food Science Technicians Animal Breeders Microbiologists Biochemists & Biophysicists Non-farm Animal Caretakers Chemical Technicians Soil & Plant Scientists Environmental Science & Protection Technicians Zoologists & Wildlife Biologists Environmental Scientists & Specialists
Cleaning, Washing & Metal Pickling Equipment Oprs
Molding & Casting Machine Oprs Printing Machine Oprs Plating & Coating Machine Oprs Welding, Soldering & Brazing Machine Oprs Prepress Technicians & Workers
Crushing, Grinding & Polishing Machine Oprs
Cementing & Gluing Machine Oprs Molding & Casting Machine Oprs Coating, Painting & Spraying Machine Oprs Multiple Machine Tool Oprs Coil Winders, Tapers & Finishers Welding, Soldering & Brazing Machine Oprs Cutting & Slicing Machine Oprs
Extruding, Forming, Pressing & Compacting Machine Oprs
Bindery Workers Machine Feeders & Offbearers Cementing & Gluing Machine Oprs Milling & Planing Machine Oprs Coating, Painting & Spraying Machine Oprs Multiple Machine Tool Oprs Coil Winders, Tapers & Finishers Paper Goods Machine Oprs Computer-Controlled Machine Tool Oprs Prepress Technicians & Workers Extruding & Drawing Machine Oprs Printing Machine Oprs Furnace, Kiln, Oven, Drier & Kettle Oprs Sheet Metal Workers Grinding, Polishing & Buffing Machine Oprs Welding, Soldering & Brazing Machine Oprs Lathe & Turning Machine Tool Oprs
Industrial Machinery Mechanics
Aircraft Mechanics & Service Technicians Farm Equipment Mechanics Automotive Service Technicians & Mechanics Helpers--Maintenance & Repair Workers
Earth Drillers Inspectors, Testers, Sorters, Samplers & Weighers
Engine & Other Machine Assemblers
Mixing & Blending Machine Oprs
Cementing & Gluing Machine Oprs Molding & Casting Machine Oprs Coating, Painting & Spraying Machine Oprs Multiple Machine Tool Oprs Coil Winders, Tapers & Finishers Welding, Soldering & Brazing Machine Oprs Cutting & Slicing Machine Oprs
- 20 -

Molders, Shapers & Casters, Ex. Metal & Plastic
Coating, Painting & Spraying Machine Oprs Pourers & Casters, Metal Cutters & Trimmers, Hand Prepress Technicians & Workers Etchers & Engravers Printing Machine Oprs Foundry Mold & Coremakers Tire Builders Jewelers & Precious Stone & Metal Workers Tool & Die Makers Molding & Casting Machine Oprs Welders, Cutters, Solderers & Brazers Plating & Coating Machine Oprs Welding, Soldering & Brazing Machine Oprs
Packers & Packagers, Hand Floor Layers Plating & Coating Machine Oprs Graders & Sorters, Agricultural Products Printing Machine Oprs
Separating, Filtering, Precipitating & Still Machine Oprs Conveyor Oprs & Tenders Gas Compressor & Gas Pumping Station Oprs Cutting, Punching & Press Machine Oprs Plating & Coating Machine Oprs Extruding & Forming Machine Oprs, Synthetic Printing Machine Oprs
Tank Car, Truck & Ship Loaders
Gas Compressor & Gas Pumping Station Oprs Petroleum Pump System Oprs & Gaugers Gas Plant Oprs Plating & Coating Machine Oprs Molding & Casting Machine Oprs Welders, Cutters, Solderers & Brazers
- 21 -

Attachment 4 – Related Occupations for "Difficult" Reemployment Prospects
Cooling & Freezing Equipment Operators Coil Winders, Tapers & Finishers Molding & Casting Machine Oprs Extruding & Forming Machine Oprs Printing Machine Operators Forging Machine Oprs Welding, Soldering & Brazing Machine Oprs Grinding, Polishing & Buffing Machine Oprs
Food & Tobacco Roasting, Baking & Drying Machine Oprs
Extruding & Forming Machine Oprs, Synthetic Prepress Technicians & Workers Grinding, Polishing & Buffing Machine Oprs Printing Machine Operators
Food Batchmakers
Bakers Photographic Process Workers Bindery Workers Prepress Technicians & Workers Graders & Sorters, Agricultural Products
Food Cooking Machine Operators
Bakers Mail Clerks & Mail Machine Oprs Bindery Workers Molding & Casting Machine Oprs Computer-Controlled Machine Tool Oprs Printing Machine Operators
Food Processing Workers, Other Data not available.
Packaging & Filling Machine Operators
Bindery Workers Cutting, Punching & Press Machine Oprs Coil Winders, Tapers & Finishers Molding & Casting Machine Oprs Conveyor Operators & Tenders Multiple Machine Tool Oprs Cutting & Slicing Machine Oprs Sewing Machine Operators
- 22 -
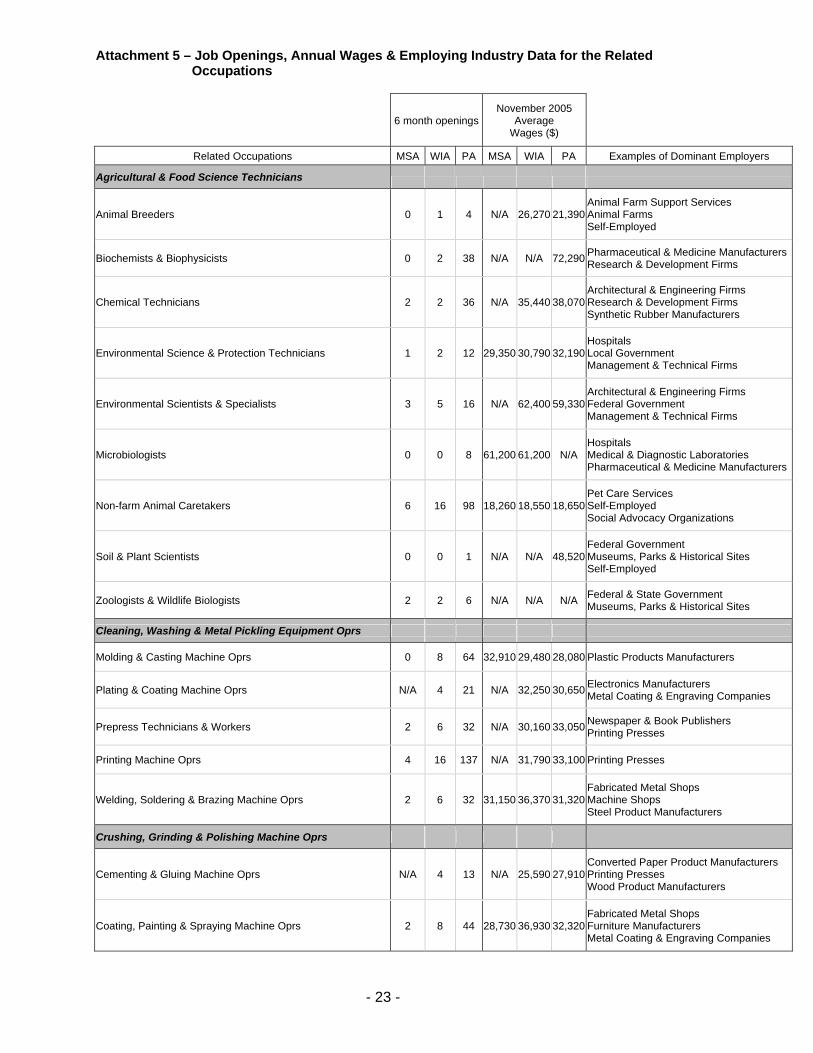
Attachment 5 – Job Openings, Annual Wages & Employing Industry Data for the Related Occupations
6 month openingsNovember 2005
Average Wages ($)
Related Occupations MSA WIA PA MSA WIA PA Examples of Dominant Employers
Agricultural & Food Science Technicians
Animal Breeders 0 1 4 N/A 26,270 21,390 Animal Farm Support Services Animal Farms Self-Employed
Biochemists & Biophysicists 0 2 38 N/A N/A 72,290 Pharmaceutical & Medicine ManufacturersResearch & Development Firms
Chemical Technicians 2 2 36 N/A 35,440 38,070 Architectural & Engineering Firms Research & Development Firms Synthetic Rubber Manufacturers
Environmental Science & Protection Technicians 1 2 12 29,350 30,790 32,190 Hospitals Local Government Management & Technical Firms
Environmental Scientists & Specialists 3 5 16 N/A 62,400 59,330 Architectural & Engineering Firms Federal Government Management & Technical Firms
Microbiologists 0 0 8 61,200 61,200 N/A Hospitals Medical & Diagnostic Laboratories Pharmaceutical & Medicine Manufacturers
Non-farm Animal Caretakers 6 16 98 18,260 18,550 18,650 Pet Care Services Self-Employed Social Advocacy Organizations
Soil & Plant Scientists 0 0 1 N/A N/A 48,520 Federal Government Museums, Parks & Historical Sites Self-Employed
Zoologists & Wildlife Biologists 2 2 6 N/A N/A N/A Federal & State Government Museums, Parks & Historical Sites
Cleaning, Washing & Metal Pickling Equipment Oprs
Molding & Casting Machine Oprs 0 8 64 32,910 29,480 28,080 Plastic Products Manufacturers
Plating & Coating Machine Oprs N/A 4 21 N/A 32,250 30,650 Electronics Manufacturers Metal Coating & Engraving Companies
Prepress Technicians & Workers 2 6 32 N/A 30,160 33,050 Newspaper & Book Publishers Printing Presses
Printing Machine Oprs 4 16 137 N/A 31,790 33,100 Printing Presses
Welding, Soldering & Brazing Machine Oprs 2 6 32 31,150 36,370 31,320 Fabricated Metal Shops Machine Shops Steel Product Manufacturers
Crushing, Grinding & Polishing Machine Oprs
Cementing & Gluing Machine Oprs N/A 4 13 N/A 25,590 27,910 Converted Paper Product Manufacturers Printing Presses Wood Product Manufacturers
Coating, Painting & Spraying Machine Oprs 2 8 44 28,730 36,930 32,320 Fabricated Metal Shops Furniture Manufacturers Metal Coating & Engraving Companies
- 23 -

Crushing, Grinding & Polishing Machine Oprs (Cont.)
Coil Winders, Tapers & Finishers 0 0 0 N/A 26,100 29,830 Electronics Manufacturers Motor Vehicle Parts Manufacturing Railroad Car Manufacturers
Cutting & Slicing Machine Oprs 2 4 18 N/A 27,790 29,550 Converted Paper Product Manufacturers Glass Products Manufacturers Printing Presses
Molding & Casting Machine Oprs 0 8 64 32,910 29,480 28,080 Plastic Products Manufacturers
Multiple Machine Tool Oprs N/A 5 38 33,490 31,900 31,120 Fabricated Metal Shops Machine Shops Plastic Products Manufacturers
Welding, Soldering & Brazing Machine Oprs 2 6 32 31,150 36,370 31,320 Fabricated Metal Shops Machine Shops Steel Product Manufacturers
Extruding, Forming, Pressing & Compacting Machine Oprs
Bindery Workers 2 6 32 25,720 30,700 29,480 Printing Presses
Cementing & Gluing Machine Oprs N/A 4 13 N/A 25,590 27,910 Converted Paper Product Manufacturers Printing Presses Wood Product Manufacturers
Coating, Painting & Spraying Machine Oprs 2 8 44 28,730 36,930 32,320 Fabricated Metal Shops Furniture Manufacturers Metal Coating & Engraving Companies
Coil Winders, Tapers & Finishers 0 0 0 N/A 26,100 29,830 Electronics Manufacturers Motor Vehicle Parts Manufacturing Railroad Car Manufacturers
Computer-Controlled Machine Tool Oprs N/A 6 56 30,830 31,520 31,960 Fabricated Metal Shops Machine Shops Plastic Products Manufacturers
Extruding & Drawing Machine Oprs N/A N/A 20 34,060 30,490 31,730 Plastic Products Manufacturers Steel Product Manufacturers
Furnace, Kiln, Oven, Drier & Kettle Oprs 1 1 12 30,000 29,530 31,400 Aluminum Manufacturers Clay Product & Refractory ManufacturersGlass Products Manufacturers
Grinding, Polishing & Buffing Machine Oprs 2 5 16 34,680 37,940 31,800 Fabricated Metal Shops Foundries Metalworking Machinery Manufacturers
Lathe & Turning Machine Tool Oprs 0 2 14 42,290 38,620 34,260 Fabricated Metal Shops Forgings & Stampings Manufacturers Machine Shops
Machine Feeders & Offbearers N/A 5 18 34,320 26,510 25,110 Iron & Steel Mills Plastic Products Manufacturers Printing Presses
Milling & Planing Machine Oprs N/A N/A 12 37,320 34,860 33,890 Fabricated Metal Shops Machine Shops Metalworking Machinery Manufacturers
Multiple Machine Tool Oprs N/A 5 38 33,490 31,900 31,120 Fabricated Metal Shops Machine Shops Plastic Products Manufacturers
Paper Goods Machine Oprs 1 5 32 29,740 25,980 30,690 Converted Paper Product Manufacturers
Prepress Technicians & Workers 2 6 32 N/A 30,160 33,050 Newspaper & Book Publishers Printing Presses
- 24 -

Extruding, Forming, Pressing & Compacting Machine Oprs (Cont.)
Printing Machine Oprs 4 16 137 N/A 31,790 33,100 Printing Presses
Sheet Metal Workers 10 19 111 40,900 40,680 43,730 Building Contractors Fabricated Metal Shops
Welding, Soldering & Brazing Machine Oprs 2 6 32 31,150 36,370 31,320 Fabricated Metal Shops Machine Shops Steel Product Manufacturers
Industrial Machinery Mechanics
Aircraft Mechanics & Service Technicians 5 6 30 44,790 45,160 46,840 Air Transportation Companies Air Transportation Support Services Federal Government
Automotive Service Technicians & Mechanics 32 86 626 34,220 32,690 32,470 Automobile Dealers Automotive Repair Shops Self-Employed
Earth Drillers 0 1 10 N/A 42,370 35,030 Mining Support Services Special Trade Contractors Utility Line Construction Firms
Engine & Other Machine Assemblers N/A N/A 16 N/A 36,070 31,730 Cutlery & Handtool Manufacturers Machinery Manufacturers
Farm Equipment Mechanics 0 4 18 N/A 31,330 30,210 Machinery & Supply Wholesalers
Helpers--Installation, Maintenance & Repair 8 20 164 26,920 25,990 23,490 Automotive Repair Shops Building Contractors
Inspectors, Testers, Sorters, Samplers & Weigh. 6 22 154 37,750 33,250 32,730 Architectural & Engineering Firms Glass Products Manufacturers Plastic Products Manufacturers
Mixing & Blending Machine Oprs
Cementing & Gluing Machine Oprs N/A 4 13 N/A 25,590 27,910 Converted Paper Product Manufacturers Printing Presses Wood Product Manufacturers
Coating, Painting & Spraying Machine Oprs 2 8 44 28,730 36,930 32,320 Fabricated Metal Shops Furniture Manufacturers Metal Coating & Engraving Companies
Coil Winders, Tapers & Finishers 0 0 0 N/A 26,100 29,830 Electronics Manufacturers Motor Vehicle Parts Manufacturing Railroad Car Manufacturers
Cutting & Slicing Machine Oprs 2 4 18 N/A 27,790 29,550 Converted Paper Product Manufacturers Glass Products Manufacturers Printing Presses
Molding & Casting Machine Oprs 0 8 64 32,910 29,480 28,080 Plastic Products Manufacturers
Multiple Machine Tool Oprs N/A 5 38 33,490 31,900 31,120 Fabricated Metal Shops Machine Shops Plastic Products Manufacturers
Welding, Soldering & Brazing Machine Oprs 2 6 32 31,150 36,370 31,320 Fabricated Metal Shops Machine Shops Steel Product Manufacturers
Molders, Shapers & Casters, Ex. Metal & Plastic (Cont.)
Coating, Painting & Spraying Machine Oprs 2 8 44 28,730 36,930 32,320 Fabricated Metal Shops Furniture Manufacturers Metal Coating & Engraving Companies
- 25 -

Molders, Shapers & Casters, Ex. Metal & Plastic
Cutters & Trimmers, Hand 0 1 12 N/A 24,920 22,040 Furniture Manufacturers Plastic Products Manufacturers Printing Presses
Etchers & Engravers 0 0 12 26,390 27,680 28,570 Metal Coating & Engraving Companies
Foundry Mold & Coremakers 0 2 13 N/A 25,360 27,370 Fabricated Metal Shops Foundries
Jewelers & Precious Stone & Metal Workers 0 1 10 N/A N/A N/A Jewelry Manufacturers Jewelry Stores Self-Employed
Molding & Casting Machine Oprs 0 8 64 32,910 29,480 28,080 Plastic Products Manufacturers
Plating & Coating Machine Oprs N/A 4 21 N/A 32,250 30,650 Electronics Manufacturers Metal Coating & Engraving Companies
Pourers & Casters, Metal N/A 2 8 N/A 36,990 30,330 Aluminum Manufacturers Foundries Iron & Steel Mills
Prepress Technicians & Workers 2 6 32 N/A 30,160 33,050 Newspaper & Book Publishers Printing Presses
Printing Machine Oprs 4 16 137 N/A 31,790 33,100 Printing Presses
Tire Builders N/A N/A N/A 24,460 24,650 26,110 Tire Manufacturers
Tool & Die Makers 2 8 46 40,140 39,410 39,490 Metalworking Machinery Manufacturers Tool & Die Shops
Welders, Cutters, Solderers & Brazers 12 43 237 34,140 34,460 33,160 Fabricated Metal Shops Machinery Manufacturers Motor Vehicle Manufacturers
Welding, Soldering & Brazing Machine Oprs 2 6 32 31,150 36,370 31,320 Fabricated Metal Shops Machine Shops Steel Product Manufacturers
Packers & Packagers, Hand
Floor Layers N/A 0 21 25,360 29,500 38,000 Building Contractors Home Furnishings Stores Self-Employed
Graders & Sorters, Agricultural Products 0 4 22 N/A 22,800 17,610 Animal & Crop Farms Grocery Wholesalers
Molders, Shapers & Casters 1 1 14 30,250 23,020 28,730 Clay Product & Refractory ManufacturersMagnetic & Optical Media Manufacturers Self-Employed
Plating & Coating Machine Oprs N/A 4 21 N/A 32,250 30,650 Electronics Manufacturers Metal Coating & Engraving Companies
Printing Machine Oprs 4 16 137 N/A 31,790 33,100 Printing Presses
Separating, Filtering, Precipitating & Still Machine Oprs
Conveyor Oprs & Tenders N/A 12 40 N/A 28,150 28,830 Courier Firms Mining Companies Newspaper & Book Publishers
Cutting, Punching & Press Machine Oprs N/A 3 3 30,520 30,860 28,200 Fabricated Metal Shops Plastic Products Manufacturers
- 26 -

Separating, Filtering, Precipitating & Still Machine Oprs Cont.)
Extruding & Forming Machine Oprs, Synthetic N/A 0 0 N/A N/A 30,280 Fabric Mills Paint & Adhesive Manufacturers Plastic Products Manufacturers
Gas Compressor & Gas Pumping Station Oprs N/A 0 0 N/A N/A 44,660 Local Government Pipeline Operators Utility Line Construction Firms
Plating & Coating Machine Oprs N/A 4 21 N/A 32,250 30,650 Electronics Manufacturers Metal Coating & Engraving Companies
Printing Machine Oprs 4 16 137 N/A 31,790 33,100 Printing Presses
Tank Car, Truck & Ship Loaders
Gas Compressor & Gas Pumping Station Oprs N/A 0 0 N/A N/A 44,660 Local Government Pipeline Operators Utility Line Construction Firms
Gas Plant Oprs N/A 0 2 N/A 51,670 46,530 Pipeline Operators
Molding & Casting Machine Oprs 0 8 64 32,910 29,480 28,080 Plastic Products Manufacturers
Petroleum Pump System Oprs & Gaugers 0 1 8 42,650 44,100 48,060 Petroleum & Coal Products Manufacturers
Plating & Coating Machine Oprs N/A 4 21 N/A 32,250 30,650 Electronics Manufacturers Metal Coating & Engraving Companies
Welders, Cutters, Solderers & Brazers 12 43 237 34,140 34,460 33,160 Fabricated Metal Shops Machinery Manufacturers Motor Vehicle Manufacturers
Cooling & Freezing Equipment Oprs
Coil Winders, Tapers & Finishers 0 0 0 N/A 26,100 29,830 Electronics Manufacturers Motor Vehicle Parts Manufacturing Railroad Car Manufacturers
Extruding & Forming Machine Oprs, Synthetic N/A 0 0 N/A N/A 30,280 Fabric Mills Paint & Adhesive Manufacturers Plastic Products Manufacturers
Forging Machine Oprs N/A 2 8 32,380 30,070 29,070 Forgings & Stampings Manufacturers Machine Shops Plastic Products Manufacturers
Grinding, Polishing & Buffing Machine Oprs 2 5 16 34,680 37,940 31,800 Fabricated Metal Shops Foundries Metalworking Machinery Manufacturers
Molding & Casting Machine Oprs 0 8 64 32,910 29,480 28,080 Plastic Products Manufacturers
Printing Machine Oprs 4 16 137 N/A 31,790 33,100 Printing Presses
Welding, Soldering & Brazing Machine Oprs 2 6 32 31,150 36,370 31,320 Fabricated Metal Shops Machine Shops Steel Product Manufacturers
Food & Tobacco Roasting, Baking & Drying Machine Oprs
Extruding & Forming Machine Oprs, Synthetic & Glass Fibers N/A 0 0 N/A N/A 30,280 Fabric Mills Paint & Adhesive Manufacturers Plastic Products Manufacturers
Grinding, Polishing & Buffing Machine Oprs 2 5 16 34,680 37,940 31,800 Fabricated Metal Shops Foundries Metalworking Machinery Manufacturers
- 27 -

Food & Tobacco Roasting, Baking & Drying Machine Oprs Cont.)
Prepress Technicians & Workers 2 6 32 N/A 30,160 33,050 Newspaper & Book Publishers Printing Presses
Printing Machine Oprs 4 16 137 N/A 31,790 33,100 Printing Presses
Food Batchmakers
Bakers 13 26 156 24,560 22,920 22,330 Bakery Product Manufacturers Grocery Stores Retail Bakeries
Bindery Workers 2 6 32 25,720 30,700 29,480 Printing Presses
Graders & Sorters, Agricultural Products 0 4 22 N/A 22,800 17,610 Animal & Crop Farms Grocery Wholesalers
Photographic Process Workers 0 1 2 N/A 22,550 22,530 Photofinishing Laboratories Printing Presses Professional & Technical Services
Prepress Technicians & Workers 2 6 32 N/A 30,160 33,050 Newspaper & Book Publishers Printing Presses
Food Cooking Machine Oprs
Bakers 13 26 156 24,560 22,920 22,330 Bakery Product Manufacturers Grocery Stores Retail Bakeries
Bindery Workers 2 6 32 25,720 30,700 29,480 Printing Presses
Computer-Controlled Machine Tool Oprs N/A 6 56 30,830 31,520 31,960 Fabricated Metal Shops Machine Shops Plastic Products Manufacturers
Mail Clerks & Mail Machine Oprs 0 0 16 21,840 21,720 22,970 Colleges & Universities Federal Government Personnel Agencies
Molding & Casting Machine Oprs 0 8 64 32,910 29,480 28,080 Plastic Products Manufacturers
Printing Machine Oprs 4 16 137 N/A 31,790 33,100 Printing Presses
Packaging & Filling Machine Oprs
Bindery Workers 2 6 32 25,720 30,700 29,480 Printing Presses
Coil Winders, Tapers & Finishers 0 0 0 N/A 26,100 29,830 Electronics Manufacturers Motor Vehicle Parts Manufacturing Railroad Car Manufacturers
Conveyor Oprs & Tenders N/A 12 40 N/A 28,150 28,830 Courier Firms Mining Companies Newspaper & Book Publishers
Cutting & Slicing Machine Oprs 2 4 18 N/A 27,790 29,550 Converted Paper Product Manufacturers Glass Products Manufacturers Printing Presses
Cutting, Punching & Press Machine Oprs N/A 3 3 30,520 30,860 28,200 Fabricated Metal Shops Plastic Products Manufacturers
Molding & Casting Machine Oprs 0 8 64 32,910 29,480 28,080 Plastic Products Manufacturers
Multiple Machine Tool Oprs N/A 5 38 33,490 31,900 31,120 Fabricated Metal Shops Machine Shops Plastic Products Manufacturers
- 28 -

Packaging & Filling Machine Oprs ( Cont.)
Sewing Machine Oprs 0 0 0 16,250 18,730 19,930 Apparel Manufacturers Textile Mills
- 29 -

Attachment 6 – 2006 High Priority Occupations for South Central Workforce Investment Area
SOC Code SOC Title Educational
AttainmentAnnual
Average Entry Level Exper. Level
Estimated 2002
Projected 2012
Percent Change
Annual Openings
11-1011 Chief Executives BD+ $134,850 $67,720 $168,410 3,200 3,750 17.2 11511-1021 General & Operations Managers BD+ $80,240 $41,320 $99,700 10,610 12,250 15.5 36411-2022 Sales Managers BD+ $83,210 $39,640 $104,990 1,830 2,300 25.7 8111-3011 Administrative Services Managers BD+ $64,650 $32,050 $80,950 1,920 2,180 13.5 6311-3031 Financial Managers BD+ $83,180 $49,760 $99,890 3,380 3,900 15.4 10111-3040 Human Resources Managers BD+ N/A N/A N/A 1,090 1,270 16.5 3611-9012 Farmers & Ranchers LT OJT N/A N/A N/A 5,620 5,710 1.6 15811-9021 Construction Managers BD $60,200 $43,890 $68,350 1,600 1,910 19.4 6011-9031 Education Administrators, Preschool & Child Care Center BD+ $45,770 $23,230 $57,050 200 240 20.0 911-9032 Education Administrators, Elementary & Secondary School BD+ $74,330 $55,730 $83,620 780 880 12.8 2911-9033 Education Administrators, Postsecondary BD+ $70,620 $40,090 $85,880 410 490 19.5 1811-9111 Medical & Health Services Managers BD+ $71,240 $44,340 $84,690 1,050 1,340 27.6 5011-9141 Property, Real Estate & Community Association Managers BD $52,500 $27,430 $65,040 510 660 29.4 2513-1023 Purchasing Agents BD $49,490 $31,340 $58,570 1,410 1,520 7.8 4613-1031 Claims Adjusters, Examiners & Investigators LT OJT $41,250 $25,540 $49,100 2,280 2,470 8.3 4713-1051 Cost Estimators BD $49,370 $33,390 $57,360 1,060 1,230 16.0 4130 13-1073 Training & Development Specialists BD $44,430 $28,900 $52,190 780 990 26.9 33
13-1111 Management Analysts BD+ $66,550 $40,940 $79,360 1,730 2,020 16.8 5313-2011 Accountants & Auditors BD $52,730 $34,450 $61,860 5,330 5,830 9.4 15113-2051 Financial Analysts BD $55,050 $35,620 $64,770 880 960 9.1 2113-2052 Personal Financial Advisors BD $70,630 $34,710 $88,580 850 1,240 45.9 5013-2072 Loan Officers BD $49,300 $30,630 $58,640 610 720 18.0 2115-1011 Computer & Information Scientists, Research PhD N/A N/A N/A 50 60 20.0 215-1021 Computer Programmers BD $59,510 $37,770 $70,390 2,570 2,740 6.6 7815-1031 Computer Software Engineers, Applications BD $84,530 $53,020 $100,280 640 890 39.1 3115-1032 Computer Software Engineers, Systems Software BD $66,310 $45,600 $76,660 400 560 40.0 2015-1041 Computer Support Specialists AD $37,120 $24,520 $43,430 2,310 2,710 17.3 6815-1051 Computer Systems Analysts BD $64,490 $48,740 $72,360 3,390 4,160 22.7 11515-1071 Network & Computer Systems Administrators BD $59,190 $39,660 $68,950 920 1,230 33.7 4115-1081 Network Systems & Data Communications Analysts BD $59,820 $39,870 $69,800 470 750 59.6 3415-2041 Statisticians MD $55,610 $37,600 $64,610 30 30 0.0 117-1021 Cartographers & Photogrammetrists BD $35,910 $26,950 $40,390 50 50 0.0 217-2031 Biomedical Engineers BD N/A N/A N/A 40 50 25.0 217-2081 Environmental Engineers BD $62,390 $33,490 $76,840 190 290 52.6 1317-2112 Industrial Engineers BD $61,500 $43,640 $70,430 900 960 6.7 2817-2161 Nuclear Engineers BD N/A N/A N/A 120 120 0.0 417-3011 Architectural & Civil Drafters PS VOC $37,640 $28,310 $42,300 740 790 6.8 2617-3013 Mechanical Drafters PS VOC $41,560 $30,310 $47,180 500 480 -4.0 12
Wages (2004) Employment

Attachment 6 – 2006 High Priority Occupations for South Central Workforce Investment Area
SOC Code SOC Title Educational
AttainmentAnnual
Average Entry Level Exper. Level
Estimated 2002
Projected 2012
Percent Change
Annual Openings
Wages (2004) Employment
17-3026 Industrial Engineering Technicians AD $46,140 $33,140 $52,640 280 290 3.6 719-1021 Biochemists & Biophysicists PhD N/A N/A N/A 60 80 33.3 419-1042 Medical Scientists PhD N/A N/A N/A 240 310 29.2 1119-2031 Chemists BD $54,090 $35,680 $63,300 200 210 5.0 819-2041 Environmental Scientists & Specialists BD $65,310 $43,280 $76,320 300 390 30.0 1419-4021 Biological Technicians AD $34,260 $23,670 $39,560 20 20 0.0 021-1011 Substance Abuse & Behavioral Disorder Counselors MD $35,920 $23,910 $41,930 160 200 25.0 821-1012 Educational, Vocational & School Counselors MD $43,900 $26,000 $52,860 1,380 1,460 5.8 4021-1014 Mental Health Counselors MD $30,360 $19,950 $35,560 530 600 13.2 1921-1022 Medical & Public Health Social Workers BD $36,320 $23,660 $42,640 470 610 29.8 2221-1023 Mental Health & Substance Abuse Social Workers MD $30,030 $19,440 $35,330 290 420 44.8 1821-1093 Social & Human Service Assistants MT OJT $25,760 $18,340 $29,470 1,110 1,700 53.2 7923-1011 Lawyers PROF $81,280 $44,960 $99,430 2,730 3,490 27.8 11123-2011 Paralegals & Legal Assistants AD $38,080 $27,870 $43,180 910 1,160 27.5 3225-1011 Business Teachers, Postsecondary PhD $60,440 $24,090 $78,610 360 470 30.6 1925-1021 Computer Science Teachers, Postsecondary PhD $60,920 $29,110 $76,820 200 260 30.0 1125-1022 Mathematical Science Teachers, Postsecondary PhD $64,020 $35,180 $78,440 230 290 26.1 1125-1032 Engineering Teachers, Postsecondary PhD $74,150 $34,510 $93,970 200 260 30.0 1131 25-1042 Biological Science Teachers, Postsecondary PhD $62,150 $27,680 $79,380 160 210 31.3 9
25-1052 Chemistry Teachers, Postsecondary PhD $61,870 $27,720 $78,950 100 130 30.0 525-1066 Psychology Teachers, Postsecondary PhD $56,720 $21,810 $74,170 130 170 30.8 725-1071 Health Specialties Teachers, Postsecondary PhD $59,780 $33,610 $72,870 290 410 41.4 1925-1072 Nursing Instructors & Teachers, Postsecondary MD N/A N/A N/A 170 210 23.5 825-1081 Education Teachers, Postsecondary PhD $48,040 $17,050 $63,530 210 280 33.3 1225-1124 Foreign Language & Literature Teachers, Postsecondary PhD $57,010 $33,170 $68,930 90 120 33.3 525-1194 Vocational Education Teachers, Postsecondary WK EXP $37,050 $26,980 $42,090 780 1,000 28.2 4025-2012 Kindergarten Teachers BD $41,690 $25,620 $49,730 500 600 20.0 1625-2022 Middle School Teachers BD $49,650 $34,940 $57,000 3,160 3,200 1.3 7425-2031 Secondary School Teachers BD $47,350 $33,070 $54,490 4,750 5,230 10.1 18225-2032 Vocational Education Teachers, Secondary School BD $48,890 $35,780 $55,450 290 300 3.4 925-2041 Special Education Teachers, Preschool, Kindergarten & Elementary BD $46,390 $33,120 $53,020 630 760 20.6 2825-2042 Special Education Teachers, Middle School BD $46,800 $34,260 $53,070 290 350 20.7 1325-2043 Special Education Teachers, Secondary School BD $49,320 $35,910 $56,030 560 670 19.6 2425-3011 ESL Teachers BD $34,440 $22,740 $40,290 340 410 20.6 1125-3021 Self-Enrichment Education Teachers WK EXP $32,250 $14,780 $40,980 660 940 42.4 3625-4021 Librarians MD $45,060 $27,370 $53,910 660 730 10.6 2325-4031 Library Technicians ST OJT $21,490 $12,200 $26,130 410 500 22.0 2425-9041 Teacher Assistants AD* $18,370 $13,370 $20,870 4,570 5,380 17.7 169

Attachment 6 – 2006 High Priority Occupations for South Central Workforce Investment Area
SOC Code SOC Title Educational
AttainmentAnnual
Average Entry Level Exper. Level
Estimated 2002
Projected 2012
Percent Change
Annual Openings
Wages (2004) Employment
27-1024 Graphic Designers BD $36,650 $23,380 $43,290 520 650 25.0 2027-3031 Consumer Information Specialists BD $52,530 $24,100 $66,750 560 700 25.0 2229-1051 Pharmacists PROF $82,530 $67,960 $89,810 1,010 1,300 28.7 4929-1111 Registered Nurses AD $52,270 $38,110 $59,350 11,030 13,110 18.9 43929-1122 Occupational Therapists BD $57,660 $41,270 $65,860 290 370 27.6 1229-1123 Physical Therapists MD $61,890 $43,930 $70,860 550 730 32.7 2329-1124 Radiation Therapists AD N/A N/A N/A 30 30 0.0 129-1126 Respiratory Therapists AD $44,060 $36,490 $47,840 430 520 20.9 2329-1131 Veterinarians, Large Animals PROF $75,810 $53,760 $86,830 230 290 26.1 1229-2011 Medical & Clinical Laboratory Technologists BD $49,520 $38,740 $54,910 510 530 3.9 1629-2012 Medical & Clinical Laboratory Technicians AD $31,680 $23,130 $35,950 950 1,050 10.5 3629-2021 Dental Hygienists AD $52,390 $43,690 $56,740 780 1,120 43.6 4129-2031 Cardiovascular Technologists & Technicians AD $38,690 $24,910 $45,580 150 190 26.7 729-2032 Diagnostic Medical Sonographers AD $47,870 $37,670 $52,970 190 200 5.3 529-2034 Radiologic Technologists & Technicians AD $43,310 $33,140 $48,400 970 1,130 16.5 3429-2041 Emergency Medical Technicians & Paramedics PS VOC $22,900 $16,350 $26,180 1,460 1,960 34.2 6729-2052 Pharmacy Technicians MT OJT $22,720 $16,880 $25,640 1,040 1,310 26.0 4132 29-2055 Surgical Technologists PS VOC $32,070 $24,920 $35,650 370 420 13.5 10
29-2056 Veterinary Technologists & Technicians AD $22,500 $17,250 $25,130 150 200 33.3 729-2061 Licensed Practical & Licensed Vocational Nurses PS VOC $34,960 $28,140 $38,370 4,200 4,970 18.3 16929-2071 Medical Records & Health Information Technicians AD $27,420 $19,890 $31,180 460 600 30.4 2131-1011 Home Health Aides ST OJT $18,510 $14,990 $20,270 1,790 2,770 54.7 12231-1012 Nursing Aides, Orderlies & Attendants ST OJT $22,970 $18,780 $25,070 7,740 9,370 21.1 26431-2011 Occupational Therapist Assistants AD $37,900 $27,770 $42,960 90 120 33.3 431-2021 Physical Therapist Assistants AD $32,590 $24,170 $36,790 200 270 35.0 1031-9091 Dental Assistants MT OJT $27,530 $21,980 $30,310 940 1,350 43.6 6731-9092 Medical Assistants MT OJT $24,400 $19,160 $27,010 1,660 2,650 59.6 13031-9094 Medical Transcriptionists PS VOC $27,110 $22,030 $29,660 890 1,090 22.5 3731-9096 Veterinary Assistants ST OJT $17,080 $12,320 $19,460 360 440 22.2 1531-9099 Phlebotmists N/A $24,240 $14,400 $29,170 1,340 1,680 25.4 5933-3051 Police & Sheriff's Patrol Officers LT OJT $49,590 $31,700 $58,540 1,940 2,440 25.8 10035-1012 Supervisors - Food Preparation & Serving Workers WK EXP $28,130 $18,400 $32,990 2,240 2,580 15.2 8739-9011 Child Care Workers ST OJT $18,330 $12,780 $21,100 3,560 4,420 24.2 18339-9021 Personal & Home Care Aides ST OJT $18,980 $14,600 $21,170 2,290 2,990 30.6 10741-3011 Advertising Sales Agents MT OJT $41,140 $21,350 $51,030 610 710 16.4 2241-3021 Insurance Sales Agents BD $50,040 $23,900 $63,110 2,230 2,520 13.0 8241-3031 Securities, Commodities & Financial Services Sales Agents BD $77,060 $29,890 $100,650 880 1,050 19.3 2741-3041 Travel Agents PS VOC $22,620 $15,730 $26,070 250 230 -8.0 7

Attachment 6 – 2006 High Priority Occupations for South Central Workforce Investment Area
SOC Code SOC Title Educational
AttainmentAnnual
Average Entry Level Exper. Level
Estimated 2002
Projected 2012
Percent Change
Annual Openings
Wages (2004) Employment
41-4011 Sales Representatives, Scientific & Technical MT OJT $55,010 $30,910 $67,060 1,480 1,720 16.2 6341-4012 Sales Representatives MT OJT $50,630 $26,310 $62,790 6,350 7,660 20.6 29841-9041 Telemarketers ST OJT $27,080 $15,700 $32,780 1,080 980 -9.3 843-1011 Supervisors - Office & Administrative Support Workers WK EXP $45,460 $27,530 $54,420 6,540 6,840 4.6 17043-3011 Bill & Account Collectors ST OJT $24,370 $18,230 $27,440 1,460 1,820 24.7 6443-3021 Billing & Posting Clerks & Machine Operators ST OJT $26,590 $19,740 $30,020 2,250 2,350 4.4 4843-3031 Bookkeeping, Accounting & Auditing Clerks MT OJT $28,930 $19,690 $33,550 7,860 7,920 0.8 15343-4051 Customer Service Representatives MT OJT $27,600 $18,680 $32,060 7,530 9,010 19.7 26043-4171 Receptionists & Information Clerks ST OJT $21,330 $15,550 $24,220 4,630 5,860 26.6 23743-5061 Production, Planning & Expediting Clerks ST OJT $36,940 $26,210 $42,300 1,800 1,950 8.3 5943-5071 Shipping, Receiving & Traffic Clerks ST OJT $27,150 $17,860 $31,800 4,600 4,540 -1.3 8843-6011 Executive Secretaries & Administrative Assistants MT OJT $34,320 $24,300 $39,330 5,910 6,310 6.8 15343-6012 Legal Secretaries PS VOC $31,310 $23,370 $35,290 1,310 1,570 19.8 5143-6013 Medical Secretaries PS VOC $25,920 $20,650 $28,560 1,640 1,840 12.2 5143-6014 Secretaries MT OJT $26,840 $17,890 $31,320 11,720 10,910 -6.9 17733 43-9031 Desktop Publishers PS VOC $35,970 $21,440 $43,240 290 360 24.1 14
43-9061 Office Clerks ST OJT $25,130 $16,580 $29,410 14,300 15,030 5.1 39045-2011 Agricultural Inspectors WK EXP $42,990 $33,420 $47,780 30 30 0.0 147-1011 Supervisors - Construction Trades & Extraction Workers WK EXP $48,990 $34,200 $56,390 2,500 2,870 14.8 8047-2021 Brickmasons & Blockmasons LT OJT $32,660 $18,110 $39,940 960 1,120 16.7 3047-2022 Stonemasons LT OJT N/A N/A N/A N/A N/A N/A N/A47-2031 Carpenters LT OJT $30,930 $21,970 $35,410 5,670 6,410 13 16647-2051 Cement Masons & Concrete Finishers LT OJT $32,490 $23,120 $37,180 350 430 22.9 1547-2061 Construction Laborers MT OJT $26,680 $17,880 $31,080 3,160 3,610 14.2 8747-2073 Operating Engineers MT OJT $36,700 $26,700 $41,690 2,040 2,230 9.3 7247-2111 Electricians LT OJT $43,570 $29,120 $50,800 2,960 3,400 14.9 10347-2141 Painters, Construction & Maintenance MT OJT $30,670 $21,750 $35,130 1,060 1,200 13.2 3047-2152 Plumbers, Pipefitters & Steamfitters LT OJT $41,810 $33,100 $46,160 1,900 2,110 11.1 6547-2211 Sheet Metal Workers MT OJT $41,480 $32,360 $46,040 910 1,070 17.6 3849-2097 Electronic Home Entertainment Equipment Installers & Repairers PS VOC $23,580 $15,370 $27,680 290 290 0.0 649-3021 Automotive Body & Related Repairers LT OJT $35,490 $23,300 $41,590 1,120 1,270 13.4 3849-3023 Automotive Service Technicians & Mechanics PS VOC $31,540 $20,570 $37,030 4,340 4,840 11.5 16549-3031 Bus, Truck & Diesel Mechanics PS VOC $34,520 $25,630 $38,970 2,270 2,600 14.5 9249-3052 Motorcycle Mechanics LT OJT $34,580 $22,110 $40,820 110 140 27.3 649-9021 Heating, A/C & Refrigeration Mechanics & Installers LT OJT $38,260 $26,920 $43,940 1,710 2,030 18.7 5549-9041 Industrial Machinery Mechanics LT OJT $38,700 $27,970 $44,070 1,250 1,270 1.6 2749-9042 Maintenance & Repair Workers, General LT OJT $31,730 $21,370 $36,920 6,270 7,050 12.4 19849-9043 Maintenance Workers, Machinery LT OJT $35,540 $25,660 $40,490 640 650 1.6 15

Attachment 6 – 2006 High Priority Occupations for South Central Workforce Investment Area
SOC Code SOC Title Educational
AttainmentAnnual
Average Entry Level Exper. Level
Estimated 2002
Projected 2012
Percent Change
Annual Openings
Wages (2004) Employment
49-9051 Electrical Power-Line Installers & Repairers LT OJT $52,380 $39,360 $58,900 250 250 0.0 849-9052 Telecommunications Line Installers & Repairers LT OJT $39,130 $19,710 $48,840 580 670 15.5 2551-1011 Supervisors - Production & Operating Workers WK EXP $48,190 $33,120 $55,730 4,290 4,490 4.7 11051-2092 Team Assemblers MT OJT $28,030 $18,090 $32,990 5,590 5,220 -6.6 11751-3021 Butchers & Meat Cutters LT OJT $27,650 $19,750 $31,600 740 700 -5.4 1451-3092 Food Batchmakers ST OJT $31,730 $20,040 $37,570 1,230 1,150 -6.5 2251-4011 Computer-Controlled Machine Tool Operators, Metal & Plastic LT OJT $30,640 $22,560 $34,680 790 810 2.5 1551-4012 Numerical Tool & Process Control Programmers LT OJT $42,480 $29,960 $48,750 110 120 9.1 351-4041 Machinists LT OJT $34,480 $26,190 $38,620 1,890 2,010 6.3 5651-4072 Molding & Casting Machine Oprs, Metal & Plastic MT OJT $29,440 $20,370 $33,970 1,200 1,240 3.3 3451-4121 Welders, Cutters, Solderers & Brazers PS VOC $34,340 $26,410 $38,300 2,510 2,670 6.4 8751-5021 Job Printers LT OJT $31,760 $21,880 $36,700 440 470 6.8 1351-5022 Prepress Technicians & Workers LT OJT $30,780 $23,940 $34,200 820 690 -15.9 1551-5023 Printing Machine Operators MT OJT $31,190 $22,030 $35,760 1,320 1,310 -0.8 3051-7011 Cabinetmakers & Bench Carpenters LT OJT $31,370 $20,680 $36,720 750 830 10.7 2751-7021 Furniture Finishers LT OJT $23,120 $19,770 $24,800 260 280 7.7 734 51-7042 Woodworking Machine Oprs/Tenders MT OJT $23,150 $17,320 $26,060 600 650 8.3 21
51-9011 Chemical Equipment Operators & Tenders MT OJT $33,840 $24,970 $38,270 180 180 0.0 651-9061 Inspectors, Testers, Sorters, Samplers & Weighers MT OJT $32,220 $20,740 $37,960 2,960 2,860 -3.4 5751-9081 Dental Laboratory Technicians LT OJT $33,370 $19,820 $40,150 320 370 15.6 1251-9082 Medical Appliance Technicians LT OJT N/A N/A N/A 20 20 0.0 051-9111 Packaging & Filling Machine Operators/Tenders ST OJT $26,730 $18,550 $30,820 2,840 2,810 -1.1 5451-9196 Paper Goods Machine Oprs/Tenders MT OJT $25,350 $16,720 $29,660 720 650 -9.7 1053-1031 Supervisors - Trans. & Material-Moving Machine/Vehicle Oprs WK EXP $48,560 $30,190 $57,750 1,110 1,280 15.3 4353-3032 Truck Drivers, Heavy & Tractor-Trailer MT OJT $38,770 $26,310 $45,000 14,110 17,210 22.0 54053-3033 Truck Drivers, Light or Delivery Services ST OJT $25,260 $15,260 $30,270 6,270 7,370 17.5 16853-7051 Industrial Truck & Tractor Operators ST OJT $28,490 $21,790 $31,840 6,630 7,910 19.3 25453-7062 Laborers & Freight, Stock & Material Movers ST OJT $25,290 $16,680 $29,590 13,300 13,640 2.6 469

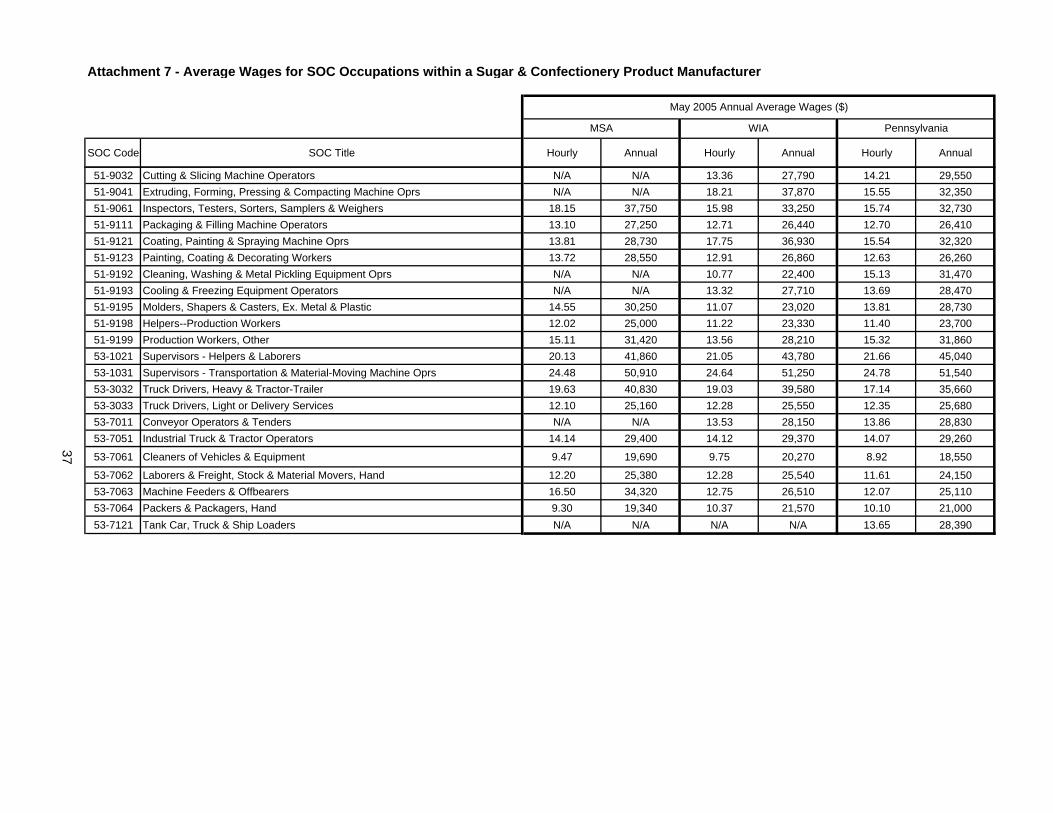
Attachment 7 - Average Wages for SOC Occupations within a Sugar & Confectionery Product Manufacturer
SOC Code SOC Title Hourly Annual Hourly Annual Hourly Annual
11-1011 Chief Executives 60.54 125,930 62.13 129,230 65.02 135,24011-1021 General & Operations Managers 42.52 88,450 41.35 86,000 45.03 93,67011-2021 Marketing Managers 42.00 87,360 41.43 86,170 45.28 94,18011-2022 Sales Managers 43.61 90,700 40.94 85,160 43.73 90,95011-3011 Administrative Services Managers 31.28 65,060 31.33 65,160 32.48 67,56011-3021 Computer & Information Systems Managers 39.98 83,160 39.61 82,400 47.33 98,45011-3031 Financial Managers 40.66 84,570 41.02 85,330 45.43 94,49011-3041 Compensation & Benefits Manager 33.22 69,100 33.97 70,650 33.40 69,48011-3051 Industrial Production Managers 41.51 86,340 39.60 82,370 41.37 86,04011-3061 Purchasing Managers 38.07 79,190 37.55 78,100 36.72 76,38011-3071 Transportation, Storage & Distribution Managers 37.52 78,040 35.94 74,760 36.32 75,55011-9199 Managers, Other N/A N/A N/A N/A 36.59 76,11013-1022 Wholesale & Retail Buyers, Except Farm Products 24.50 50,970 24.59 51,160 24.21 50,35013-1023 Purchasing Agents, Other 25.70 53,450 24.70 51,380 25.35 52,73013-1199 Business Operations Specialists, Other 28.48 59,240 28.41 59,100 30.47 63,38035 13-2011 Accountants & Auditors 25.27 52,560 25.76 53,580 28.57 59,430
15-1041 Computer Support Specialists 16.99 35,340 17.54 36,480 19.50 40,55015-1051 Computer Systems Analysts 31.59 65,700 31.75 66,040 31.90 66,36015-1071 Network & Computer Systems Administrators 29.42 61,200 28.49 59,250 29.83 62,05017-2112 Industrial Engineers 30.78 64,020 30.06 62,530 33.13 68,92019-1012 Food Scientists & Technologists N/A N/A 29.78 61,950 27.70 57,62019-4011 Agricultural & Food Science Technicians N/A N/A 17.15 35,670 20.25 42,12019-4031 Chemical Technicians N/A N/A 17.04 35,440 18.30 38,07033-9032 Security Guards 10.44 21,720 10.47 21,790 10.14 21,09035-1012 Supervisors - Food Preparation & Serving Workers 13.93 28,970 14.14 29,410 14.65 30,48035-2021 Food Preparation Workers 8.33 17,330 8.11 16,870 8.34 17,34035-3021 Combined Food Preparation & Serving Workers 7.59 15,780 7.48 15,570 7.46 15,52035-3022 Counter Attendants: Cafeteria, Food Concession & Coffee Shop 8.29 17,250 7.69 15,990 7.24 15,05035-3031 Waiters & Waitresses 6.80 14,140 6.86 14,280 7.25 15,09035-9021 Dishwashers 7.19 14,940 7.04 14,640 7.16 14,90035-9031 Hosts & Hostesses: Restaurant, Lounge & Coffee Shop 7.95 16,530 7.76 16,140 8.15 16,94035-9099 Food Preparation & Serving Related Workers, Other N/A N/A 7.88 16,380 9.05 18,82037-1011 Supervisors - Housekeeping & Janitorial Workers 14.96 31,110 15.31 31,840 16.93 35,21037-2011 Janitors & Cleaners 10.01 20,810 9.98 20,770 10.20 21,22041-1011 Supervisors - Retail Sales Workers 17.60 36,610 17.76 36,940 18.75 39,00041-1012 Supervisors - Non-Retail Sales Workers 43.17 89,790 40.04 83,290 38.08 79,210
May 2005 Annual Average Wages ($)
WIAMSA Pennsylvania

Attachment 7 - Average Wages for SOC Occupations within a Sugar & Confectionery Product Manufacturer
SOC Code SOC Title Hourly Annual Hourly Annual Hourly Annual
May 2005 Annual Average Wages ($)
WIAMSA Pennsylvania
41-2011 Cashiers 9.05 18,830 8.14 16,940 7.71 16,04041-2031 Retail Salespersons 10.06 20,930 10.32 21,460 10.58 22,00041-4012 Sales Representatives N/A N/A 29.97 62,340 27.00 56,16043-1011 Supervisors - Office & Administrative Support Workers 23.60 49,080 22.08 45,920 22.46 46,71043-3021 Billing & Posting Clerks & Machine Operators 12.94 26,920 12.70 26,410 13.26 27,57043-3031 Bookkeeping, Accounting & Auditing Clerks 14.24 29,610 13.53 28,140 14.08 29,28043-3051 Payroll & Timekeeping Clerks 15.90 33,070 14.58 30,330 14.80 30,78043-3061 Procurement Clerks 17.05 35,450 17.95 37,350 16.33 33,97043-4051 Customer Service Representatives 13.57 28,230 13.50 28,080 13.47 28,03043-4151 Order Clerks 11.62 24,170 11.62 24,160 12.88 26,79043-4161 Human Resources Assistants 17.01 35,390 16.26 33,810 16.13 33,55043-4171 Receptionists & Information Clerks 10.67 22,200 10.46 21,760 10.67 22,19043-5061 Production, Planning & Expediting Clerks 18.11 37,670 18.34 38,140 17.52 36,45043-5071 Shipping, Receiving & Traffic Clerks 13.39 27,850 13.23 27,520 13.21 27,48043-5081 Stock Clerks & Order Fillers 11.90 24,750 11.19 23,270 10.34 21,50043-5111 Weighers, Measurers, Checkers & Samplers, Recordkeeping 14.56 30,290 13.49 28,050 14.82 30,83043-6011 Executive Secretaries & Administrative Assistants 17.08 35,530 16.46 34,230 17.21 35,79036 43-6014 Secretaries 14.01 29,130 13.17 27,390 13.03 27,100
43-9021 Data Entry Keyers 10.73 22,320 10.85 22,560 11.64 24,22043-9061 Office Clerks, General 12.67 26,360 12.23 25,430 11.79 24,51047-2111 Electricians 20.24 42,100 19.78 41,140 24.29 50,52049-1011 Supervisors - Mechanics, Installers & Repairers 28.54 59,360 27.19 56,560 26.39 54,89049-9021 Heating, A/C & Refrigeration Mechanics & Installers 19.15 39,830 18.90 39,300 19.15 39,83049-9041 Industrial Machinery Mechanics 19.05 39,620 19.42 40,400 18.99 39,50049-9042 Maintenance & Repair Workers, General 14.88 30,950 15.46 32,170 15.50 32,24049-9043 Maintenance Workers, Machinery 17.96 37,350 17.43 36,250 16.76 34,86051-1011 Supervisors - Production & Operating Workers 24.96 51,920 23.98 49,870 24.53 51,02051-2092 Team Assemblers 11.18 23,260 13.72 28,550 12.35 25,68051-3011 Bakers 11.81 24,560 11.02 22,920 10.74 22,33051-3091 Food & Tobacco Roasting, Baking & Drying Machine Oprs 14.69 30,550 14.08 29,290 13.00 27,03051-3092 Food Batchmakers N/A N/A 15.35 31,930 13.07 27,19051-3093 Food Cooking Machine Operators N/A N/A 12.60 26,200 11.55 24,02051-3099 Food Processing Workers, Other N/A N/A N/A N/A N/A N/A51-9012 Separating, Filtering, Precipitating & Still Machine Oprs N/A N/A 16.90 35,140 17.64 36,69051-9021 Crushing, Grinding & Polishing Machine Oprs 17.04 35,430 16.40 34,100 15.37 31,98051-9023 Mixing & Blending Machine Operators N/A N/A 15.28 31,790 15.23 31,690
Attachment 7 - Average Wages for SOC Occupations within a Sugar & Confectionery Product Manufacturer
SOC Code SOC Title Hourly Annual Hourly Annual Hourly Annual
May 2005 Annual Average Wages ($)
WIAMSA Pennsylvania
51-9032 Cutting & Slicing Machine Operators N/A N/A 13.36 27,790 14.21 29,55051-9041 Extruding, Forming, Pressing & Compacting Machine Oprs N/A N/A 18.21 37,870 15.55 32,35051-9061 Inspectors, Testers, Sorters, Samplers & Weighers 18.15 37,750 15.98 33,250 15.74 32,73051-9111 Packaging & Filling Machine Operators 13.10 27,250 12.71 26,440 12.70 26,41051-9121 Coating, Painting & Spraying Machine Oprs 13.81 28,730 17.75 36,930 15.54 32,32051-9123 Painting, Coating & Decorating Workers 13.72 28,550 12.91 26,860 12.63 26,26051-9192 Cleaning, Washing & Metal Pickling Equipment Oprs N/A N/A 10.77 22,400 15.13 31,47051-9193 Cooling & Freezing Equipment Operators N/A N/A 13.32 27,710 13.69 28,47051-9195 Molders, Shapers & Casters, Ex. Metal & Plastic 14.55 30,250 11.07 23,020 13.81 28,73051-9198 Helpers--Production Workers 12.02 25,000 11.22 23,330 11.40 23,70051-9199 Production Workers, Other 15.11 31,420 13.56 28,210 15.32 31,86053-1021 Supervisors - Helpers & Laborers 20.13 41,860 21.05 43,780 21.66 45,04053-1031 Supervisors - Transportation & Material-Moving Machine Oprs 24.48 50,910 24.64 51,250 24.78 51,54053-3032 Truck Drivers, Heavy & Tractor-Trailer 19.63 40,830 19.03 39,580 17.14 35,66053-3033 Truck Drivers, Light or Delivery Services 12.10 25,160 12.28 25,550 12.35 25,68053-7011 Conveyor Operators & Tenders N/A N/A 13.53 28,150 13.86 28,83053-7051 Industrial Truck & Tractor Operators 14.14 29,400 14.12 29,370 14.07 29,26037 53-7061 Cleaners of Vehicles & Equipment 9.47 19,690 9.75 20,270 8.92 18,550
53-7062 Laborers & Freight, Stock & Material Movers, Hand 12.20 25,380 12.28 25,540 11.61 24,15053-7063 Machine Feeders & Offbearers 16.50 34,320 12.75 26,510 12.07 25,11053-7064 Packers & Packagers, Hand 9.30 19,340 10.37 21,570 10.10 21,00053-7121 Tank Car, Truck & Ship Loaders N/A N/A N/A N/A 13.65 28,390
- 38 -
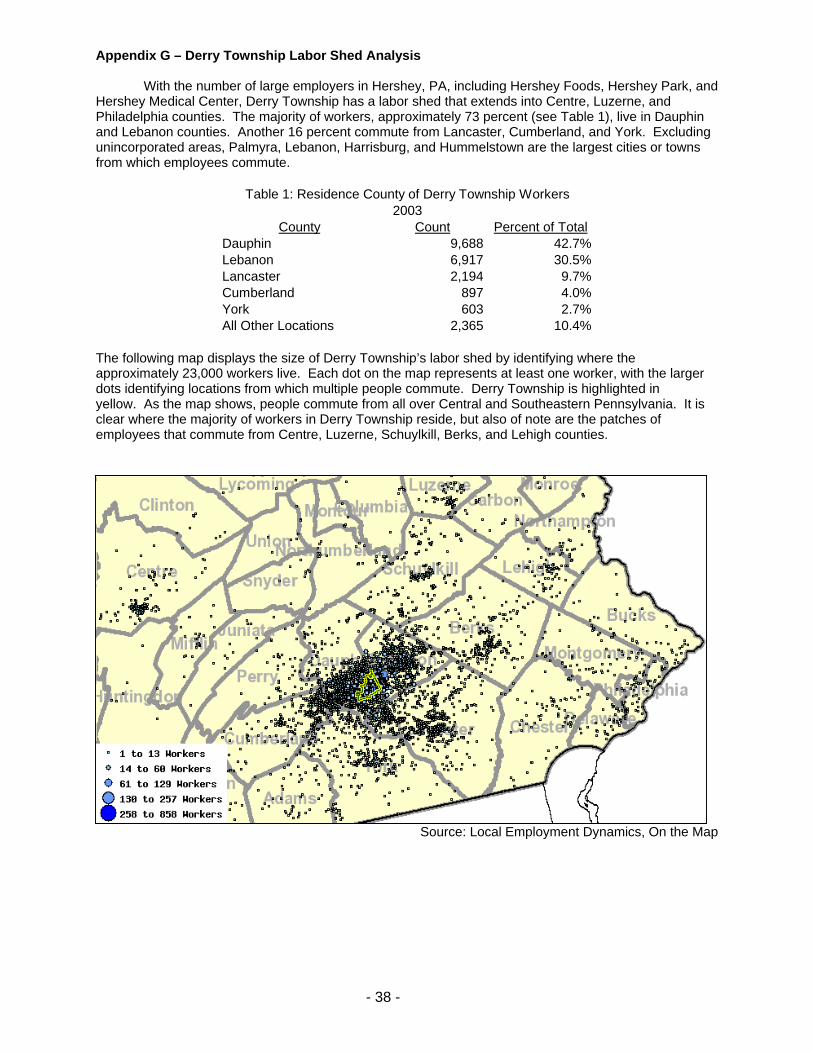
Appendix G – Derry Township Labor Shed Analysis
With the number of large employers in Hershey, PA, including Hershey Foods, Hershey Park, and Hershey Medical Center, Derry Township has a labor shed that extends into Centre, Luzerne, and Philadelphia counties. The majority of workers, approximately 73 percent (see Table 1), live in Dauphin and Lebanon counties. Another 16 percent commute from Lancaster, Cumberland, and York. Excluding unincorporated areas, Palmyra, Lebanon, Harrisburg, and Hummelstown are the largest cities or towns from which employees commute.
The following map displays the size of Derry Township’s labor shed by identifying where the approximately 23,000 workers live. Each dot on the map represents at least one worker, with the larger dots identifying locations from which multiple people commute. Derry Township is highlighted in yellow. As the map shows, people commute from all over Central and Southeastern Pennsylvania. It is clear where the majority of workers in Derry Township reside, but also of note are the patches of employees that commute from Centre, Luzerne, Schuylkill, Berks, and Lehigh counties.
Source: Local Employment Dynamics, On the Map
County Count Percent of TotalDauphin 9,688 42.7%Lebanon 6,917 30.5%Lancaster 2,194 9.7%Cumberland 897 4.0%York 603 2.7%All Other Locations 2,365 10.4%
Table 1: Residence County of Derry Township Workers2003

The map below provides an additional look at the labor shed for Derry Township by replacing the individual locations with a density graphic, displaying the number of workers per square mile. This display shows additional small areas of commuters coming from Perry, Chester, and Adams counties and in and around the Philadelphia region.
Source: Local Employment Dynamics, On the Map
Derry Township Employment Characteristics Industry:
• Only the Health Care & Social Assistance industry sector employed more workers than Manufacturing in 2003.
• With tourist attractions such as Hershey Park, it is not surprising that Arts, Entertainment, and Recreation is the third largest industry, followed by Accommodation and Food Services.
Age:
• Over 75 percent of workers are over 30 years of age. • Workers 55 and older made up 14 percent of the workforce in 2003, up 1 percentage point from
2002. Earnings:
• Nearly 30 percent of workers earn $1,200 or less per month. • From 2002 to 2003, the number of workers earning more than $3,400 per month increased by
over 1,600 workers. (See the following pages for additional details)
- 39 -

Report Title: Selection Area Profile - Characteristics of Employed Workers
Area Employment by Category 2003 2002
Count Share Count Share
Total Employers 478 479
* All Jobs 23,901 100.0% 23,327 100.0%
* All Jobs (Private Sector Only) 22,664 94.8% 21,794 93.4%
* All Primary Jobs (Worker’s highest paying job) 22,155 92.7% 21,460 92.0%
* All Primary Jobs (Private Sector Only) 21,021 88.0% 20,065 86.0%
Baseline Count of Jobs 2003 2002
Count Share Count Share
All Jobs (Private Sector Only) 22,664 100.0% 21,794 100.0%
Jobs by Worker Age 2003 2002
Count Share Count Share
* Age 30 or younger 5,582 24.6% 5,568 25.5%
* Age 31 to 54 13,917 61.4% 13,394 61.5%
* Age 55 or older 3,165 14.0% 2,832 13.0%
Jobs by Earnings Paid 2003 2002
Count Share Count Share
* $1,200 per month or less 6,661 29.4% 6,725 30.9%
* $1,201 to $3,400 per month 8,940 39.4% 9,663 44.3%
* More then $3,400 per month 7,063 31.2% 5,406 24.8%
Jobs by Industry Type (2-digit NAICS) 2003 2002
Count Share Count Share
* Agriculture, Forestry, Fishing and Hunting 0 0.0% 0 0.0%
* Mining 32 0.1% 30 0.1%
* Utilities 0 0.0% 0 0.0%
* Construction 116 0.5% 125 0.6%
* Manufacturing 4,263 18.8% 4,265 19.6%
* Wholesale Trade 77 0.3% 74 0.3%
* Retail Trade 1,151 5.1% 1,115 5.1%
* Transportation and Warehousing 6 0.0% 4 0.0%
* Information 275 1.2% 272 1.2%
40

* Finance and Insurance 230 1.0% 198 0.9%
* Real Estate and Rental and Leasing 57 0.3% 76 0.3%
* Professional, Scientific, and Technical Services 242 1.1% 219 1.0%
* Management of Companies and Enterprises 1,977 8.7% 2,041 9.4%
* Administration & Support, Waste Management and Remediation 339 1.5% 335 1.5%
* Educational Services 1,748 7.7% 1,371 6.3%
* Health Care and Social Assistance 6,479 28.6% 6,185 28.4%
* Arts, Entertainment, and Recreation 3,181 14.0% 2,890 13.3%
* Accommodation and Food Services 2,034 9.0% 2,121 9.7%
* Other Services (excluding Public Administration) 457 2.0% 473 2.2%
* Public Administration 0 0.0% 0 0.0%
41