impact of the indiana choice scholarship program
TRANSCRIPT

Impact of the IndianaChoice Scholarship Program:Achievement Effects forStudents in UpperElementary and MiddleSchool*
R. Joseph WaddingtonMark Berends
Abstract
This paper examines the impact of the Indiana Choice Scholarship Program on stu-dent achievement for low-income students in upper elementary and middle school whoused a voucher to transfer from public to private schools during the first four yearsof the program. We analyzed student-level longitudinal data from public and privateschools taking the same statewide standardized assessment. Overall, voucher studentsexperienced an average achievement loss of 0.15 SDs in mathematics during their firstyear of attending a private school compared with matched students who remained ina public school. This loss persisted regardless of the length of time spent in a privateschool. In English/Language Arts, we did not observe statistically meaningful effects.Although school vouchers aim to provide greater educational opportunities for stu-dents, the goal of improving the academic performance of low-income students whouse a voucher to move to a private school has not yet been realized in Indiana. C© 2018by the Association for Public Policy Analysis and Management.
INTRODUCTION
Educational reform efforts have often failed to deliver (Berends, Bodilly, & Kirby,2002; Zimmer, Henry, & Kho, 2017). For instance, over the last decade, the federalgovernment invested $7 billion in School Improvement Grants (SIG)—the largestfederal investment to date—to improve performance in struggling schools (Kahlen-berg, 2017). These grants were aimed at the lowest performing schools and gavethem four options from which to choose: (1) transform the school by bringing ina new principal; (2) turn the school around by firing a majority of the teachersand the principal; (3) restart the school by turning over its management to char-ter schools; or (4) close the school and enroll students in higher achieving districtschools. The result? Research has shown this investment did not have a significantimpact on improving student outcomes: “Overall, across all grades, we found thatimplementing any SIG-funded model had no significant impacts on math or read-ing test scores, high school graduation, or college enrollment” (Dragoset et al., 2017,p. 3).
Current federal leadership has turned from the SIG approach to school choicepolicies and programs aimed at improving low-performing schools. These programsinclude charter schools, interdistrict choice programs, and private school vouchers
*Author order was determined randomly. Each contributed equally to this paper.
Journal of Policy Analysis and Management, Vol. 37, No. 4, 783–808 (2018)C© 2018 by the Association for Public Policy Analysis and ManagementPublished by Wiley Periodicals, Inc. View this article online at wileyonlinelibrary.com/journal/pamDOI:10.1002/pam.22086

784 / Impact of the Indiana Choice Scholarship Program
or tax credit programs. School vouchers, or scholarships, are provided to qualifyingfamilies so they can send their children to the schools of their choice, whetherpublic or private, religious or nonreligious. If voucher programs were succeeding,we would expect that participating students are experiencing new opportunitiesto learn, increasing their achievement growth, and closing achievement gaps (e.g.,socioeconomic and racial/ethnic). In this paper, we assess those expectations byexamining the impact of Indiana’s Choice Scholarship Program (ICSP)—the largestsingle statewide voucher program in the United States—on low-income students’math and English/Language Arts (ELA) achievement. Despite the program’s largesize, little is known about its effects on Indiana schools and students.
This study aims to address this gap in a context where vouchers have not beenrandomly assigned to families in Indiana. Instead, our analysis uses a rich set oflongitudinal, student-level records for public and private school students in grades3 through 8. We used a variety of estimation strategies to examine the program’simpact on low-income students receiving a voucher and switching from a publicto a private school during the first four years of the voucher program (2011/2012through 2014/2015). This group of voucher students aligns with the initial eligibilityrequirements and intent of the Indiana voucher program. Our research questionsare as follows:
� What is the yearly impact of receiving a voucher and switching to a privateschool on low-income students’ math and ELA achievement compared to peersremaining in public schools?
� What are the differences in yearly voucher impacts across various subgroups ofstudents (i.e., by sex, race/ethnicity, English proficiency, or special educationstatus) or private schools (i.e., Catholic vs. Other Religious, or urban locale)?
Overall, we found no consistent evidence that vouchers promote increased aca-demic achievement among low-income recipients. In contrast, students who use avoucher to attend private schools experienced a modest average achievement lossin mathematics and no effects in ELA. The achievement loss in mathematics isgreatest for students in the first two years after receiving a voucher and persiststhrough four years. Our findings in both subjects are consistent across most studentsubgroups.
Our research contributes to the existing school voucher literature in three dis-tinct ways. First, Indiana’s statewide school voucher program is the nation’s mostexpansive in terms of enrollment and in providing scholarships to both low- andmodest-income families.1 Second, our study is one of only a handful that findsmodest and statistically significant negative effects of school vouchers on studentmath achievement. Third, we examined the effects of a voucher program that oper-ates within a different context from other programs, whereby many private schoolswere participating in statewide testing prior to the implementation of the voucherprogram. Finally, unlike other statewide studies that cover a shorter time frame(Abdulkadiroglu, Pathak, & Walters, 2018; Figlio & Karbownik, 2016; Mills & Wolf,2017), we examined the impact for students who have received a voucher to attendprivate schools up to four years.
In what follows, we provide a brief background on the Indiana voucher programand the evidence about the effects of vouchers on student achievement based onprior rigorous research. We go on to describe the data and our approach to analyzingthe effects of the first four years of the statewide program. We conclude with theresults and a discussion of their implications.
1 The State of Ohio has more students enrolled in voucher programs across the state. However, thesestudents are spread across five different programs, each with their own eligibility criteria and focus.
Journal of Policy Analysis and Management DOI: 10.1002/pamPublished on behalf of the Association for Public Policy Analysis and Management

Impact of the Indiana Choice Scholarship Program / 785
THE INDIANA CHOICE SCHOLARSHIP PROGRAM
Currently, 15 states have voucher programs, and 181,175 students are using themto attend private schools (EdChoice, 2018). In Indiana, which has the largest sin-gle program, 35,458 students received a voucher during the 2017/2018 school yearand 318 private schools participated (76 percent of private sector schools statewide)(Indiana Department of Education, 2018). Authorized in 2011, the ICSP providesstate payments to qualifying Indiana families to help offset tuition at participat-ing schools. When the program began, students qualified for vouchers based ontheir prior enrollment in a public school and their family’s total household income.Starting in 2013/2014, the state removed the cap on the number of eligible Indianastudents who can receive a scholarship. It also expanded the criteria for eligibilityto include kindergarten students, siblings of voucher students, special educationstudents, and those located in the attendance zones of failing public schools.
Although researchers have studied the effects of various school voucher programsand policies over the past two decades (for reviews, see Austin & Berends, 2018;Epple, Romano, & Urquiola, 2017; Figlio, 2009; Shakeel, Anderson, & Wolf, 2016;Zimmer & Bettinger, 2015), the Indiana voucher program is unique.2 Unlike otherprograms, the ICSP is aimed at both low- and modest-income families (IndianaDepartment of Education, 2018). Families with the lowest income may obtain vouch-ers for up to 90 percent of tuition (average 2017/2018 voucher value in grades 1through 8 of about $4,800) at a participating private school if their annual incomeis equal to or less than 100 percent of the amount to qualify for reduced-price lunch,which is inclusive of free lunch eligibility (together referred to as “FRPL”), under theNational School Lunch Program (Indiana Department of Education, 2018).3 For afour-person household, that income threshold was $44,955. Moderate-income fam-ilies may obtain 50 percent vouchers (average 2017/2018 voucher value in grades 1through 8 of about $2,900) if their annual income is equal to or less than 150 per-cent of the amount to qualify for FRPL; for a four-person household, that incomethreshold was $67,433 (Indiana Department of Education, 2018).
VOUCHER RESEARCH ON STUDENT ACHIEVEMENT OUTCOMES
Voucher programs are typically aimed at low-income families to offer educa-tional opportunities they may not otherwise access: schools that better meet theirchildren’s academic needs. Proponents claim that, as more schools compete forstudents, all schools will become more effective in encouraging positive studentoutcomes, especially for low-income students (Chubb & Moe, 1990). Friedman(1955, 1962) was one of the first to use this market theory, arguing that the cost ofK-12 education should be covered by the government but parents should be able tochoose the schools their children attend, whether public or private. Toward this end,Friedman promoted giving parents government vouchers as a way to accomplish asystem of education that was publicly financed but delivered privately and publicly.
Critics, however, raise questions about the empirical validity of the market theory’skey assumptions about parents as consumers (demand-side), schools (supply-side),
2 With the new Trump administration and discussions about turning Title I money into vouchers and thepossibility of bundling state and federal education funds, states like Indiana may be poised to significantlyexpand their voucher programs (Berends, 2018). Thus, understanding the effects of Indiana’s studentvoucher use informs state and national education policy at a critical time.3 The amount of a voucher in Indiana is determined based on the lesser of the private school’s tuitionand fees (at which the student must first be accepted before receiving a voucher) and the state per-pupilsubsidy granted to the public school district (corporation) in which the student resides. In 2017/2018, netvoucher payments from the Indiana Department of Education to private schools totaled $154 million.
Journal of Policy Analysis and Management DOI: 10.1002/pamPublished on behalf of the Association for Public Policy Analysis and Management
786 / Impact of the Indiana Choice Scholarship Program
and the products that a market in education would generate (Austin & Berends,2018; Finnegan, 2007; Henig, 1995; Hess, 2002; Levin, 1998). They emphasize thatpublic schools support the “common school” model that promotes civic and demo-cratic values among its students. In this light, critics argue, vouchers may increasealready existing inequalities by skimming off the best students, decrease support ofpublic schools due to falling enrollments in an era of fiscal challenges, and under-mine our democracy.4 Moreover, students who transfer with vouchers may experi-ence achievement losses because student mobility is often associated with negativeschool outcomes, independent of the quality of the school (Grigg, 2012; Schwartz,Stiefel, & Cordes, 2017).
With the global expansion in the number of voucher programs, research address-ing the effects of these programs has increased as well (Berends, 2018). Evidencecan be drawn from both publicly and privately funded voucher programs in theUnited States and from international research (Epple, Romano, & Urquiola, 2017;Figlio, 2009; Shakeel, Anderson, & Wolf, 2016; Zimmer & Bettinger, 2015).
A number of voucher studies examining impacts on student achievement out-comes have focused on specific cities: Milwaukee (Greene, Peterson, & Du, 1998,1999; Rouse, 1998; Witte, 2000; Witte et al., 2014), Charlotte (Cowen, 2008; Greene,2001), Cleveland (Metcalf et al., 2002), Dayton (Howell & Peterson, 2006), New YorkCity (Barnard et al., 2003; Jin, Barnard, & Rubin, 2010; Krueger & Zhu, 2004), andWashington, DC (Howell & Peterson, 2006; Wolf et al., 2010, 2011, 2013; Wolf &McShane, 2013). Generally, the experimental and quasi-experimental research inthese cities shows either modest positive effects on student test scores for certainsubgroups of students and for certain years of program participation, or no effectsat all (Austin & Berends, 2018; Epple, Romano, & Urquiola, 2017; Figlio, 2009;Zimmer & Bettinger, 2015).5
More recent statewide studies on the impact of voucher programs in Louisiana andOhio have shown negative effects on student achievement. Abdulkadiroglu, Pathak,and Walters (2018) examined the Louisiana Scholarship Program, analyzing databetween 2008 (the first year of the program) and 2012. Following students whowon and lost a lottery to receive a scholarship, the authors found significant andlarge negative effects for students who participated in the first year of the voucherprogram, with declines of 16 percentile points in math and 14 percentile pointsin reading. The effects were consistent across income groups, geographic areas,and private school characteristics (higher and lower proportion of white students,enrollment, achievement scores, and whether the private school was Catholic).
Mills and Wolf (2017) investigated the Louisiana program through its second year,reporting substantial negative effects in both math and reading in year one, but lessnegative effects in year two. Only the effects for mathematics were statisticallysignificant after year two. In mathematics in year two, they found that studentswho won the voucher lottery and transferred to a public school scored 0.34 of aSD below those students who lost the voucher lottery. “The magnitude of thesenegative estimates,” the researchers wrote, “is unprecedented in the literature ofrandom-assignment evaluations of school voucher programs” (p. 2).
4 During the first two years of the voucher program, public school districts (corporations) experienceda reduction in their state funding based on the number of students who left the district after receivinga voucher to attend a private school. Beginning in the 2013/2014 school year, the state began restoringthese per-pupil subsidies back to public school districts to make up for state funding lost due to districtstudents participating in the voucher program.5 The exception to these overall findings is a recent study in Washington, DC on the DC OpportunityScholarship Program that found negative effects in mathematics after the first and second years of theprogram (Dynarski et al., 2017, 2018). The findings in DC are consistent with those of the statewidevoucher programs.
Journal of Policy Analysis and Management DOI: 10.1002/pamPublished on behalf of the Association for Public Policy Analysis and Management

Impact of the Indiana Choice Scholarship Program / 787
These findings are consistent with what Figlio and Karbownik (2016) found intheir evaluation of the Ohio EdChoice Scholarship Program. The researchers usedpropensity score-matching to estimate the program’s effects because the programdid not rely on a lottery to provide scholarships. Analyzing student-level data be-tween 2007 and 2010, with several estimation specifications, they found significantnegative effects on both reading and mathematics scores: about −0.40 to −0.20 SDsin reading and −0.60 to −0.45 SDs in mathematics.
In our study of the ICSP, we also found negative effects in mathematics for stu-dents who transfer from public to private schools with a voucher. However, ourresearch differs from evaluations of the Louisiana and Ohio statewide voucher pro-grams in a number of ways. Unlike Louisiana and Ohio, students in Indiana’s publicand private schools have all taken the same state tests for a number of years. Thus,our findings come from a state context where annual testing in grades 3 through 8is common across the board, particularly in a broad sample of over 300 voucher-participating private schools. In the year prior to the voucher program (2010/2011),the average private school has achievement 0.1 to 0.2 SDs above the state mean inboth math and ELA. While average private school achievement varies, many higherperforming private schools participate in Indiana’s voucher program than in otherstates.6 In addition to broader income eligibility in Indiana, students from all pub-lic schools are eligible as opposed to just those enrolled in the lowest performingschools as in Ohio. While students in low- or modest-income families may be eligi-ble to receive a voucher, we focused on the lowest-income students for estimationpurposes and better comparisons of our findings with other contexts.
DATA AND MEASURES
Data Description
We used six years (2009/2010 school year through 2014/2015) of longitudinal,student-level demographic and test score records for this study, obtained througha data-sharing agreement with the Indiana Department of Education (IDOE). Therecords contain information about students attending public (traditional, charter,and magnet) and private schools (including voucher and non-voucher students)that participated in the Indiana Statewide Testing for Educational Progress Plus(ISTEP+) program. The ISTEP+ is aligned to the Indiana Academic Standards andserves as the main accountability-linked assessment for Indiana students in grades3 through 8. Testing has taken place each spring since 2009 in mathematics andELA (Indiana Department of Education, 2011).7
Indiana is unique because many private schools participate in the ISTEP+ pro-gram and other state reporting (304 schools statewide as of 2015). Participation inISTEP+ testing is a requirement of all private schools participating in the voucherprogram.8 However, nearly all K-8 Catholic schools and over 80 other religious andnonreligious K-8 private schools, participated in statewide testing as part of theiraccreditation process for several years prior to the start of the voucher program.Additional private schools began taking the ISTEP+ after starting participation in
6 Most elite, nonsectarian private schools do not participate in the voucher program.7 The ISTEP+ is vertically equated across grades and consists of multiple-choice, constructed-response,and extended-response items scored using item response theory methods. Reliability coefficients rangefrom 0.88 to 0.94 in ELA and 0.88 to 0.95 in math (Indiana Department of Education, 2011).8 The Indiana Department of Education holds voucher program-participating private schools account-able through their performance on the ISTEP+ assessment by restricting their ability to enroll studentsreceiving vouchers should the school have two consecutive years of poor testing performance.
Journal of Policy Analysis and Management DOI: 10.1002/pamPublished on behalf of the Association for Public Policy Analysis and Management

788 / Impact of the Indiana Choice Scholarship Program
the voucher program. All students in private schools, including enrolling studentswith vouchers, take the test, regardless of whether an individual student received avoucher.
The robust annual participation in statewide testing and other reporting by privateschools offers several advantages. First, we can make apples-to-apples achievementcomparisons between voucher private and non-voucher public school students. Sec-ond, the number of participating schools and the testing of non-voucher privateschool students allow us to better describe the academic composition of the privateschool sector in Indiana. Third, because each student’s testing records are longitu-dinally linked, we can observe changes in an individual student’s achievement overtime, regardless of the sector in which they are enrolled.
Measures
The primary outcomes of interest are students’ annual ISTEP+ test scores in mathe-matics and ELA. These are the two subjects tested annually during grades 3 through8. We standardized each of the scaled test scores relative to the mean and SD of stu-dents statewide within each subject, grade, and year of testing.9 The standardizedmeasures allow us to draw comparisons, in SD units relative to the state average ofall test takers.
We used several student demographic and background characteristics reportedin the IDOE data, including indicators of each student’s gender, race/ethnicity,10
FRPL status, English Language Learner status (ELL), special education status, andgrade level. We created an indicator for grade retention from the previous year. Wealso observed whether a student received a voucher in each year. This allowed us toconstruct an annual indicator of voucher receipt and a measure of the total numberof years a student received a voucher.
Along with voucher recipient status, we also observed the student’s school ofrecord within each year. The school records contain each school’s National Centerfor Education Statistics (NCES) unique identification number. Using the NCESID, we linked the schools to the Common Core of Data (CCD) and the PrivateSchool Universe Survey (PSS) to augment the available school-level data.11 Weused these data to create binary indicators of the school type (e.g., public, charter,magnet, Catholic, or other private) and private school locale (urban, suburban, ortown/rural). We manually entered this information for schools with missing data.
ANALYTICAL SAMPLE AND ESTIMATION STRATEGY
Our main research question pertains to the academic achievement of voucher stu-dents who attend private schools. In an ideal experimental setting, voucher-eligiblestudents attending public schools would be randomly assigned an offer to receive avoucher. We could then estimate unbiased intent-to-treat effects of being offered a
9 Although the ISTEP+ is vertically equated, we did not use scaled scores for our outcome as thevariation in scales differs between grade levels. This introduces additional measurement error; however,we adjusted for differences between years and across tests by controlling for grade and year fixed effectsin all models.10 We re-coded the race/ethnicity variable into four categories: White, Black/African American, Latino/a,and Other Race/Ethnicity, due to the small number of voucher students identifying as either Asian/PacificIslander, American Indian/Alaskan Native, or multiracial.11 The CCD contains annual demographic and background information for the universe of public schools.Similarly, the biennial PSS contains similar information for private schools. We applied CCD data to allpublic schools for each corresponding year. Similarly, we applied PSS data from the most recent prioryear to all private schools.
Journal of Policy Analysis and Management DOI: 10.1002/pamPublished on behalf of the Association for Public Policy Analysis and Management
Impact of the Indiana Choice Scholarship Program / 789
voucher on student achievement by comparing the achievement gains of studentsoffered and not offered a voucher. We would then also be able to use this assign-ment as an instrument in a two-stage least-squares approach for actual voucher useand attendance in a private school. Here, we could obtain the treatment-on-the-treated effects of private school attendance on student achievement. Many voucherprograms (e.g., Milwaukee, New York City, Washington, DC, Louisiana) either ran-domly assigned vouchers or held voucher lotteries, enabling researchers to estimatecausal effects.12
In Indiana, vouchers were not randomly assigned to students through the ICSP,making it challenging to assess the causal effects of receiving a voucher and attend-ing a private school on student outcomes. Individual private schools participatingin the voucher program are not required to hold lotteries to determine enrollment,except for oversubscribed schools. Most private schools had an excess supply ofavailable seats over the period of our study, and we found no private schools thatimplemented enrollment lotteries.13 We did observe any student who received avoucher and attended a private school in grades 3 through 8.14
Without a random-assignment of vouchers or a natural experiment such as alottery, any assessment of the effects of Indiana’s voucher program is subject toselection bias. Choosing to apply for and receiving a voucher depends on the ac-tive choices of parents and their children. These choices typically depend on studentbackground, parental preferences, motivation, and available opportunities in publicor other choice (e.g., charter, magnet) schools. For example, if students with highaptitude or motivation apply for and receive a voucher, then the performance ofvoucher students might appear better than non-voucher students because of poten-tially unobserved background differences between students. Thus, we cannot simplycompare the achievement of voucher and non-voucher students.
Given the availability of longitudinal data and the eligibility criteria of the ICSP,we took several steps to mitigate selection bias. First, we will describe the processof creating a comparable sample of students who receive a voucher and attend aprivate school and students who do not receive a voucher and remained enrolled in apublic school. Then, we will describe multiple strategies used to estimate the effectsof the voucher program on student achievement. For both the sample constructionand estimation strategies, we drew upon important lessons from recent literaturethat uses nonexperimental approaches to replicate the experimental estimates ofschool choice evaluations (Anderson & Wolf, 2017; Bifulco, 2012; Fortson et al.,2014) and the implementation of those lessons in the nonexperimental evaluationof charter schools (Angrist, Pathak, & Walters, 2013; Dobbie & Fryer, 2013, 2017).
We implemented several data restrictions prior to sample construction (seeAppendix A).15 These restrictions included requiring each student to have at leastthree years of test scores, including two years before receiving a voucher (a pre-baseline and baseline year). After these restrictions, we have a sample of 11,756voucher students and 556,919 public school students.
12 Recent evaluations of charter schools (e.g., Abdulkadiroglu et al., 2011; Angrist et al., 2012; Clarket al., 2015; Dobbie & Fryer, 2013) also used a similar approach in instances where charter schools holdenrollment lotteries.13 We contacted each of the five Catholic dioceses in the state, the Indiana Non-Public Education As-sociation, and the Indiana Department of Education to confirm this in the first years of the voucherprogram.14 We observed very few voucher “decliners,” or students who applied for a voucher but did not receiveone. From principal and parent interviews, families only applied for vouchers if they knew they met theeligibility criteria.15 All appendices are available at the end of this article as it appears in JPAM online. Go to the publisher’swebsite and use the search engine to locate the article at http://onlinelibrary.wiley.com.
Journal of Policy Analysis and Management DOI: 10.1002/pamPublished on behalf of the Association for Public Policy Analysis and Management

790 / Impact of the Indiana Choice Scholarship Program
Voucher Student Sample
A student must meet several eligibility criteria to qualify for a voucher in Indiana.One criterion from the initial implementation of the policy was that a student hadto be enrolled in a public school (either traditional public, charter, or magnet) forat least one year immediately prior to receiving a voucher. In our cleaned data,4,384 students moved from a public to a private school for the first time afterreceiving a voucher.16 Of the students who were once enrolled in a private schoolwithout a voucher, 209 left for one year to attend a public school, and returnedto a private school after receiving a voucher.17 The other 7,163 students receiveda voucher for the first time while previously enrolled in a private school, largelya result of expanded voucher eligibility criteria beginning in the 2013/2014 schoolyear.18
Our focus solely on the voucher students moving from a public to a private schoolfor the first time yields several advantages for our analysis. First, this movement istypical of other voucher programs, and most evaluations compare voucher and pub-lic school students. With longitudinal records of public school students, we can drawcomparisons of voucher students switching to private schools with students remain-ing in public schools and not receiving a voucher. Second, previous enrollment in apublic school allowed us to establish a baseline level of student achievement beforereceiving a voucher and attending a private school for the first time observed in ourdata. We could have established a baseline prior to receiving a voucher for studentspreviously enrolled in a private school; however, these students have prior privateschool experience that may have influenced the impacts of receiving a voucherand attending a private school in a different manner than first-time private schoolenrollees. We display comparisons of all voucher and non-voucher private schoolstudents in Appendix Table A1.19 We found that voucher students initially enrolledin private schools are much higher achieving and less diverse along demographicand academic dimensions.
The second eligibility criterion for all voucher students is based on family income.The voucher income thresholds based on household size directly correspond tothe thresholds for reduced-price lunch (RPL) eligibility, which is inclusive of freelunch eligibility (Indiana Department of Education, 2018). Students in families ator below the income threshold for RPL eligibility are eligible for a “90 percent” or“full” voucher for tuition at a private school. Students in families at or below 150percent of the income threshold for RPL eligibility are eligible for a “50 percent” or“half” voucher.
Because of the direct correspondence with RPL eligibility, we focused on the3,883 voucher students switching from public to private schools that either receiveda “full” voucher or received FRPL in the two years prior to receiving a voucher.We refer to this group of voucher students as “low-income.”20 We found non-low-income voucher students have much higher achievement before receiving a voucherand are less diverse along demographic and academic dimensions (see Appendix
16 Some of these students eventually exit a private school after receiving a voucher and return to a publicschool. We included both students who remained in a private school and those who returned to a publicschool in our analysis.17 We believe these 209 students and their families made these decisions to become eligible for a voucher.18 Of these students, 649 later attended public school while 6,514 were always enrolled in a privateschool.19 All appendices are available at the end of this article as it appears in JPAM online. Go to the publisher’swebsite and use the search engine to locate the article at http://onlinelibrary.wiley.com.20 As income fluctuates, we wanted to account for indications that a family is low-income in either theyear before receiving a voucher (baseline year) or the year after. We used a similar procedure for publicschool students.
Journal of Policy Analysis and Management DOI: 10.1002/pamPublished on behalf of the Association for Public Policy Analysis and Management

Impact of the Indiana Choice Scholarship Program / 791
Table A1). Because we specifically focused on the lowest income voucher studentswho transitioned from a public to a private school, our analysis represents only apartial effect of the voucher program on student achievement. Thus, effects maydiffer for all other voucher students.
Public School Comparison Student Sample
As our voucher student sample consists of students leaving public schools to attendprivate schools, not all Indiana public schools are represented. One key takeawayfrom the quasi-experimental study design literature and the application of within-study comparisons in educational research (see Bifulco, 2012; Cook, Shadish, &Wong, 2008) is that treatment and comparison groups should be drawn from thesame geographic location (i.e., the same school). So, we constrained our comparisonsample to include only public school students of the same race/ethnicity and sexin the same grade, year, and public school as a student who receives a voucherand attends a private school the following year.21 This process also establishes abaseline year from which we can draw comparisons between voucher and publicschool students over time. We refer to the exact match between voucher and publicstudents by race-sex-year-grade-school as a “matching cell.”
The exact matching approach on several observable dimensions helps to mitigateselection bias in terms of who does and does not receive a voucher. By matchingstudents by grade, year, and school, we compare voucher and public school studentsin the same schooling context beginning at baseline. The exact matching based ona student’s race and sex further accounts for variation in the selection process. Forexample, if students of a certain race/ethnicity were more or less likely to participatein the voucher program, we are now comparing them to their same-race peers whoshould share the same likelihood of selection into the program.
This is the same approach used by researchers in the nonexperimental evaluationof charter schools in Massachusetts, New York City, and Texas (see Angrist, Pathak,& Walters, 2013; Dobbie & Fryer, 2013, 2017). These researchers compared esti-mates using the nonexperimental approach with their own experimental estimateson the same sample of students and found similar results in terms of the effectof attending a charter school on student achievement or attainment outcomes. Ifdifferences existed, these researchers noted that the nonexperimental approach col-lectively tends to bias the effects slightly toward zero.
The exact matching approach shares important features with propensity score-matching (Rosenbaum & Rubin, 1983). Both approaches rely on the matching ofstudents based on a limited set of observable characteristics of students that maybe associated with the selection process. While the exact matching process is moreprecise than matching on propensity scores, the number of matching variables mustbe limited when using exact matching in order to construct a sufficiently poweredsample of treatment and comparison students. We believe that race, sex, and sharinga baseline year, grade, and school are a reasonable set of criteria to mitigate selectionbias, and there is an empirical basis for using these characteristics. Yet, as withpropensity score-matching, we are adjusting for only observable differences betweenvoucher and non-voucher students. Our estimates of the voucher program’s effectsremain subject to bias based on any unobservable characteristics that may driveselection into the program. We further detail these concerns when describing ourapproach to the estimation of voucher program effects.
21 Some public school students have peers who leave to attend a private school with a voucher acrossseveral grades and years. To avoid replicating individual students in our sample, we randomly chosewhich of a given public school student’s years serves as the baseline year.
Journal of Policy Analysis and Management DOI: 10.1002/pamPublished on behalf of the Association for Public Policy Analysis and Management
792 / Impact of the Indiana Choice Scholarship Program
After constructing the matching cells, we further constrained our comparisonsample to include only public school students who may be eligible to receive afull voucher. As we previously described, “full” voucher eligibility corresponds di-rectly to the income threshold for RPL eligibility. Therefore, we constrained thepublic-school comparison group to students who also received FRPL in the base-line or first post-baseline year. By constraining our sample, we can draw morerelevant comparisons between low-income voucher students and non-voucher, low-income public school students who would also be considered “eligible” to receive afull voucher. In effect, this mitigates the unobserved influence that family incomemay have on selecting to attend a private school. We compared all non-low-incomepublic school students to their voucher-eligible public school peers in AppendixTable A2.22
To finalize our analytical sample, we only included low-income voucher studentswho have a low-income public school peer of the same sex, race, and baselineschool, grade, and year. Similarly, we only included public school students whohave a voucher peer who shares the same characteristics as above at baseline. Foreach student, we have achievement data from at least three years in at least onesubject: pre-baseline, baseline, and at least one year post-baseline.
Our analytical sample includes 34,587 low-income public school students whoare in the same school, grade, and year at baseline as 3,363 students of the samesex and race/ethnicity who received a voucher and attended a private school inthe subsequent year. Given data constraints, we matched 87 percent of all low-income voucher students who switch from a public to a private school to at leastone public school peer at baseline. We compared the matched versus unmatchedvoucher students in Appendix Table A1 and public school students in AppendixTable A2.
Student Descriptive Characteristics
Before moving to our approach to estimation, we describe our analytical sample anddisplay the results in Table 1. More than half of the voucher students in our sampleare racial or ethnic minorities, with a slightly lower proportion of black students(0.238) and higher proportion of Latino/a students (0.226) relative to their low-income public school peers (0.252 proportion of black students and 0.168 of Latino/astudents). The proportion of voucher students classified as ELLs is 0.123 and asspecial education students is 0.079 at baseline. In the voucher sample, ELL studentsare overrepresented and special education students underrepresented compared tothe public school peer sample. Over half of the low-income voucher and publicschool students are attending urban public schools at baseline.
In terms of academic achievement, low-income voucher students are lower achiev-ing compared to the state average by nearly one-fourth of an SD in both mathand ELA. However, voucher students are higher achieving than their low-incomepublic school peers by about a tenth of an SD in both subjects. The low av-erage achievement and diversity of low-income voucher students previously at-tending public schools suggests that private schools are not “cream-skimming”the highest achieving students from public schools per se, but there is slightpositive selection when comparing to voucher-eligible peers remaining in publicschools.
In Table 1 we provided a comparison between low-income voucher and publicschool students. However, we can also compare low-income voucher students and all
22 All appendices are available at the end of this article as it appears in JPAM online. Go to the publisher’swebsite and use the search engine to locate the article at http://onlinelibrary.wiley.com.
Journal of Policy Analysis and Management DOI: 10.1002/pamPublished on behalf of the Association for Public Policy Analysis and Management

Impact of the Indiana Choice Scholarship Program / 793
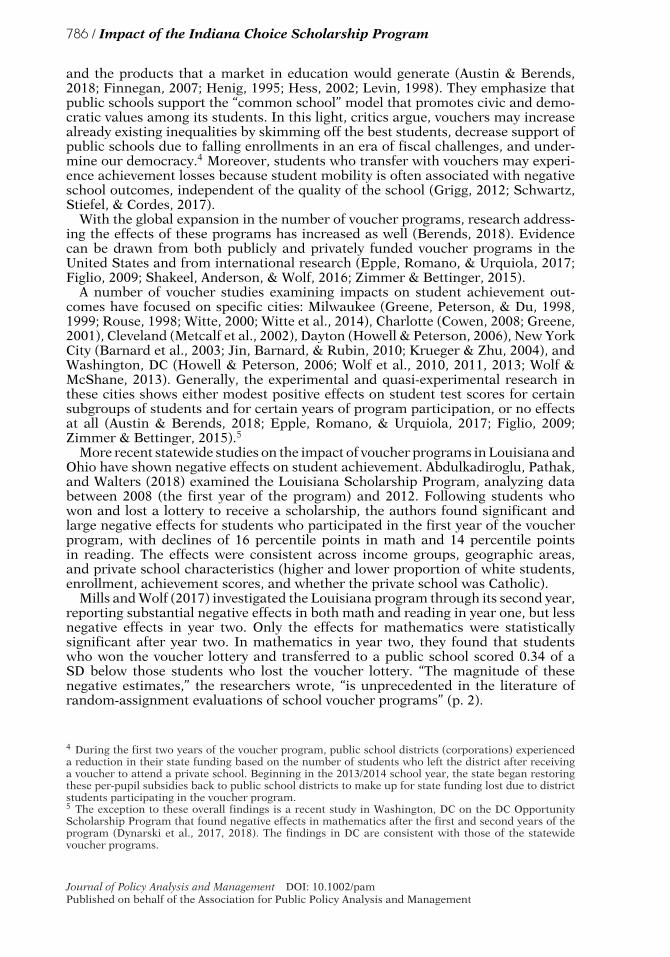
Table 1. Descriptive comparison of matched analytical sample of low-income voucher andpublic school students in Indiana.
Voucher Public
Students 3,363 34,587Schools 265 871
Baseline measuresFemale 0.526 0.527Black 0.238 0.252Latino/a 0.226 0.168Other race/ethnicity 0.076 0.027English Language Learner 0.123 0.093Special education 0.079 0.114Retained 0.008 0.008Attended charter 0.109 0.065Attended magnet 0.027 0.020Attended suburban school 0.230 0.243Attended town/rural school 0.212 0.246Mean math score −0.244 −0.335Mean ELA score −0.220 −0.333Mean math gain −0.023 −0.055Mean ELA gain −0.010 −0.046
First-Year post-baseline measuresAttended Catholic school 0.538 –Attended other private school 0.462 –First-Year exit rate 0.163 –Mean math score −0.380 −0.330Mean ELA score −0.213 −0.313Mean math gain −0.135 0.005Mean ELA gain 0.004 0.019
Notes: Table displays voucher and public school (traditional public, charter, or magnet) students with atleast three years of test scores in either math or ELA (pre-baseline, baseline, first-year post-baseline) andmatched within the same race-sex-year-grade-public school matching cell at baseline. Number of publicschools reported at baseline and voucher private schools in first-year post-baseline. ISTEP+ Math andELA scores measured in SD units, relative to the Indiana statewide mean and SD within each grade andyear.Source: Authors’ calculations.
other private school students for added context (see Appendix Table A1).23 Besidesincome differences, low-income voucher students switching from public to privateschools are much more likely to be a racial or ethnic minority or ELL. This group ofvoucher students is also substantially lower achieving than their private school peers.Thus, low-income voucher students are moving into environments substantiallybehind their peers in terms of academic achievement (by up to more than a halfSD), resulting in this group of voucher students experiencing a markedly differentschooling context than previously.
Estimation Strategy
Although we have specifically matched low-income voucher and public school stu-dents who are more closely aligned than a broader sample of voucher and public
23 All appendices are available at the end of this article as it appears in JPAM online. Go to the publisher’swebsite and use the search engine to locate the article at http://onlinelibrary.wiley.com.
Journal of Policy Analysis and Management DOI: 10.1002/pamPublished on behalf of the Association for Public Policy Analysis and Management
794 / Impact of the Indiana Choice Scholarship Program
school students, we still found a number of meaningful differences between the twogroups at baseline. Voucher students are higher achieving than their matched publicschool peers at baseline. This observable difference, among others, suggests that thetwo groups of students may also differ on unobservable dimensions that influenceselection into the voucher program as well as subsequent achievement outcomes. Ifwe did not account for these baseline differences, our results would be subject toselection bias. Below, we describe our estimation approach that helps to enhancethe internal validity of our estimates of the Indiana voucher program’s impact onstudent achievement.
Our preferred model is an ordinary least squares (OLS) regression model withseveral covariates. We estimated this model for each individual year posttreatment,resulting in a total of four individual models to estimate the voucher program effectson student achievement in the first, second, third, and fourth year after receivinga voucher. We also estimated different effects for each subject (math and ELA) asthe outcome in separate models, though the structure of the equation remained thesame. We display the model for the first-year estimates in equation (1) below.
Yicgt = α + βVouchericgt + πYicgt−1 + ωYicgt−2 + δXicgt−1 + θg + τc + υicgt (1)
Here, the achievement level (Y) for each student (i) in matching cell (c), grade(g), and post-baseline year (t) is a function of receiving a voucher and attending aprivate school (Vouchericgt) as well as a host of other covariates.
In this model, we controlled for a vector of student baseline academic charac-teristics (Xicgt−1) including baseline classification as an ELL or special educationstudent. Grade fixed effects (θg) account for systematic differences in exams acrossgrade levels. Matching cell fixed effects (τc) account for unobserved differences be-tween the race-sex-year-grade-school matching cells at baseline. Effectively, thesealso account for systematic differences in exams across years as students withineach cell take exams always within the same calendar year posttreatment. The termυicgt represents school cluster-robust standard errors to account for serial correla-tion among students within the same baseline public school cohort (same grade andyear).
We also included in our preferred model two measures of a student’s priorachievement in the same subject as the outcome, one at baseline (Yicgt−1) and onepre-baseline (Yicgt−2). Because lagged achievement scores are endogenous in thepost-baseline years, these controls remain as the baseline and pre-baseline achieve-ment measures for our estimates in the second, third, and fourth years post-baseline.In Appendix B, we detailed three alternative model specifications regarding the in-clusion of a student’s prior achievement in addition to a host of other robustnesschecks of our main results.24 In the first, we controlled for only baseline achieve-ment. In the second, we controlled for the first-, second-, and third-order polyno-mials of a student’s baseline and pre-baseline achievement. In the third, we alsocontrolled for the first-order baseline and pre-baseline measures of a student’s priorachievement in the off-subject (e.g., we also control for prior ELA achievement whenmath is the outcome and vice versa).
After accounting for these pretreatment achievement differences between voucherand public school students, we describe the estimates of the voucher program im-pacts as the value-added achievement gains (or losses) from baseline. Thus, wedefine our main estimate (β) as the difference in the achievement gain (or loss)from baseline in a given post-baseline year between low-income voucher and pub-lic school students who share the same race/ethnicity and sex and are from the
24 All appendices are available at the end of this article as it appears in JPAM online. Go to the publisher’swebsite and use the search engine to locate the article at http://onlinelibrary.wiley.com.
Journal of Policy Analysis and Management DOI: 10.1002/pamPublished on behalf of the Association for Public Policy Analysis and Management

Impact of the Indiana Choice Scholarship Program / 795
same baseline public school cohort. This estimate will be minimally biased if wehave accounted for all covariates that could explain differences between the twogroups.
By incorporating both baseline and pre-baseline achievement, we mitigate con-cerns regarding differing pretreatment trends between voucher and public students.This pretreatment phenomenon, known in the job-training literature as “Ashenfel-ter’s Dip” (Ashenfelter, 1978), suggests that a substantial drop in student perfor-mance may be a signal to parents to have their child change schools. If this were thecase, some students may be more likely to receive a voucher and attend a privateschool than others, yielding biased estimates. We believe that by accounting forpretreatment achievement in our models, we have effectively negated concerns withpretreatment trend differences between voucher students and their matched publicschool peers. However, because we estimated separate models for each post-baselineyear, we could not incorporate a standard event study set of estimates derived fromthe same model to demonstrate parallel pretreatment trends between voucher andpublic students.
To further assuage these concerns, we estimated a set of two additional mod-els, one with baseline achievement as the outcome and another with pre-baselineachievement as the outcome. These models contained the voucher indicator as wellas the baseline student characteristics, matching cell fixed effects, grade fixed ef-fects (for the pre-baseline model only, as these are collinear in the baseline modelwith the matching cells) and cluster-robust standard errors. The estimate on thevoucher indicator shows the baseline and pre-baseline achievement level differ-ences between voucher and public students within each matching cell. Although wefound statistically significant differences in achievement levels between matchedvoucher and public students, the difference is a consistent 0.09 to 0.11 SD betweenthe pre-baseline and baseline years (see Table 2 of our results). This suggests a par-allel pretreatment achievement trend between the two groups. In addition to thisinvestigation of pretreatment trends, we also conducted a series of other robust-ness checks for our preferred model estimates, all described in Appendix B and theresults displayed in Appendix Tables B1 and B2.25
Regarding the external validity of our findings, because of how we defined oursample, all our estimates of the voucher program effect on achievement rely on low-income students who use a voucher to switch from public to private schools. Thislimits the generalizability of our findings because we did not estimate voucher effectsfor those who are always enrolled in private schools.26 Voucher students switchingfrom public to private schools are different in terms of baseline characteristics fromvoucher students always enrolled in private schools (see Appendix Table A1).27 Ourapproach also requires at least three successive years of test score data, whichexcludes many students from the analysis.28 Thus, most of our estimates of voucherprogram impacts are constrained to students in grades 5 to 8.
25 All appendices are available at the end of this article as it appears in JPAM online. Go to the publisher’swebsite and use the search engine to locate the article at http://onlinelibrary.wiley.com.26 We did not estimate voucher effects for students always enrolled in private schools because we did notwant to make strong assumptions about prior achievement or geographic matching without a comparisonschool context.27 All appendices are available at the end of this article as it appears in JPAM online. Go to the publisher’swebsite and use the search engine to locate the article at http://onlinelibrary.wiley.com.28 We could estimate models by only controlling for baseline achievement and not including pre-baselineachievement. This would require only a minimum of two years of observations for each student. As thisis a nonexperimental evaluation, we valued enhanced internal validity over broader external validity.We had enough power to detect effects, particularly through three-years posttreatment. We also usedthe three years of observations data minimum to help identify low-income voucher students and omitvoucher students making multiple switches.
Journal of Policy Analysis and Management DOI: 10.1002/pamPublished on behalf of the Association for Public Policy Analysis and Management

796 / Impact of the Indiana Choice Scholarship Program
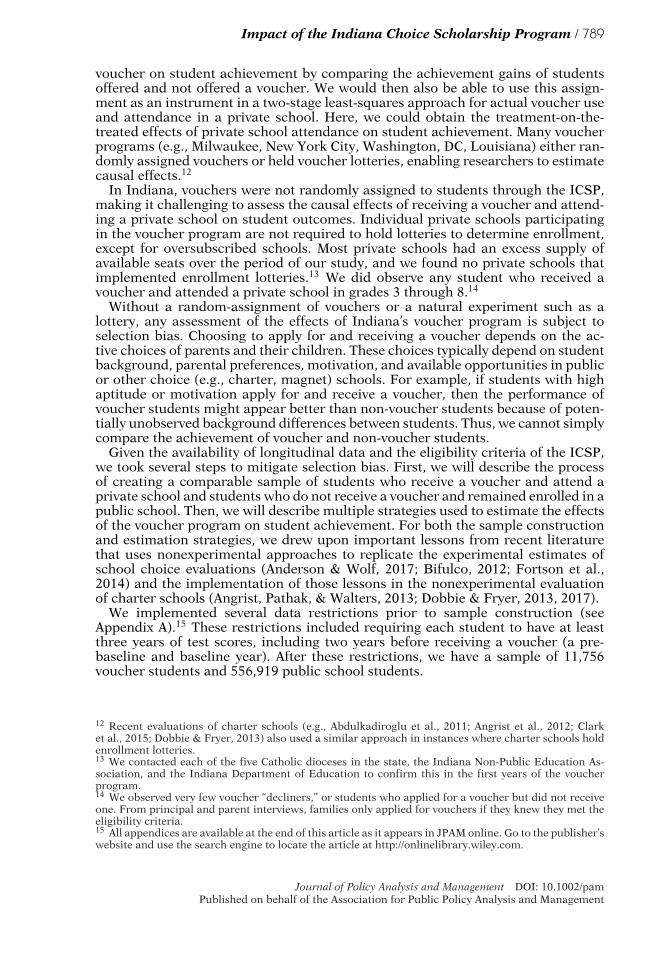
Table 2. Annual effects of Indiana voucher program on student achievement.
A. Math achievement
Pre-Baseline Baseline
Firstyear withvoucher
Secondyear withvoucher
Thirdyear withvoucher
Fourthyear withvoucher
All voucher 0.088*** 0.106*** −0.146*** −0.172*** −0.168*** −0.173**
[Voucher students = 3,350] (0.016) (0.016) (0.011) (0.015) (0.024) (0.059)Baseline covariates Y Y Y Y Y YBaseline and pre-baseline
achievementN N Y Y Y Y
Grade fixed effects Y N Y Y Y YMatching cell fixed effects Y Y Y Y Y YN all students 37,601 37,601 37,601 21,354 9,156 1,757Overall r2 0.010 0.039 0.494 0.566 0.540 0.504One total year with voucher 0.076*** 0.069*** −0.135***
[Voucher students = 1,497] (0.023) (0.022) (0.017)Two total years with voucher 0.097*** 0.126*** −0.158*** −0.156***
[Voucher students = 1,076] (0.029) (0.029) (0.019) (0.019)Three total years with voucher 0.117*** 0.139** −0.145*** −0.181*** −0.147***
[Voucher students = 602] (0.036) (0.035) (0.025) (0.025) (0.026)Four total years with voucher 0.004 0.167*** −0.245*** −0.219*** −0.246*** −0.173**
[Voucher students = 175] (0.073) (0.081) (0.046) (0.048) (0.057) (0.059)
B. ELA achievement
Pre-Baseline Baseline
Firstyear withvoucher
Secondyear withvoucher
Thirdyear withvoucher
Fourthyear withvoucher
All voucher 0.097*** 0.111*** −0.002 −0.038** 0.013 0.062[Voucher students = 3,348] (0.015) (0.016) (0.011) (0.015) (0.023) (0.053)Baseline covariates Y Y Y Y Y YBaseline and pre-baseline
achievementN N Y Y Y Y
Grade fixed effects Y N Y Y Y YMatching cell fixed effects Y Y Y Y Y YN all students 37,264 37,264 37,264 21,459 9,280 1,995Overall r2 0.021 0.086 0.498 0.537 0.552 0.490One total year with voucher 0.069** 0.086*** 0.009[Voucher students = 1,494] (0.022) (0.022) (0.016)Two total years with voucher 0.117*** 0.124*** −0.005 −0.018[Voucher students = 1,077] (0.026) (0.027) (0.018) (0.019)Three total years with voucher 0.131*** 0.162*** −0.056* −0.032* 0.021[Voucher students = 602] (0.033) (0.035) (0.025) (0.024) (0.026)Four total years with voucher 0.022 0.077 −0.010 −0.153*** −0.009 0.061[Voucher students = 175] (0.073) (0.078) (0.042) (0.046) (0.045) (0.052)
Notes: *P � 0.050; **P � 0.010; ***P � 0.001. ISTEP+ Math and ELA achievement measured in SD units,relative to the Indiana state mean and SD within each grade and year. Number of voucher students inbrackets. Robust standard errors clustered by baseline cohort (year-grade-school) are in parentheses.Source: Authors’ calculations.
Journal of Policy Analysis and Management DOI: 10.1002/pamPublished on behalf of the Association for Public Policy Analysis and Management

Impact of the Indiana Choice Scholarship Program / 797
RESULTS
Main Effects of Receiving a Voucher and Attending a Private School
We begin by describing the estimated yearly effects in the first four years of theIndiana voucher program for low-income voucher students switching from a publicto a private school. In Table 2, we display the results for mathematics and ELA. Thefirst two columns provide the pre-baseline (i.e., year before baseline) and baselinetest score estimates in columns 1 and 2, respectively. In mathematics, studentswho switch from public to private schools with a voucher had an estimated score of0.106 SD (P � 0.001) at baseline and 0.088 SD (P � 0.001) at pre-baseline above theirmatched peers remaining in public schools. In ELA, the estimates were 0.111 SD(P � 0.001) at baseline and 0.097 SD (P � 0.001) at pre-baseline. In both mathematicsand ELA, these baseline and pre-baseline estimates reveal that students who switchfrom public to private schools with a voucher scored slightly higher while enrolledin a public school compared with their public school peers. The pre-baseline andbaseline estimates were roughly the same, providing little evidence of divergentpretreatment trends; rather, there was a consistent levels difference in test scoresbetween matched voucher and public students.
The estimates for the impact by year after receiving a voucher and switching froma public to a private school appear in the third through sixth columns of resultsin Table 2. In the first year, voucher students scored an average of −0.146 SD(P � 0.001) below their matched public school peers in mathematics. This averageloss increased to −0.172 SD (P � 0.001) in the second year and then remainedconsistent at −0.168 SD (P � 0.001) in the third year, and then −0.173 (P � 0.010)in the fourth year after receiving a voucher and attending a private school.
The lower part of the mathematics panel of Table 2 shows separate estimates byeach cohort of students based on the total number of years observed receiving avoucher. The yearly estimates above have a changing sample, whereas the cohortanalysis keeps a consistent sample. To produce these findings, we constrained oursample to include only voucher and public school students who have one, two, three,or four total years of posttreatment data within each cell.
For students who were observed using vouchers for all four years, their mathe-matics achievement was 0.167 SD (P � 0.001) higher at baseline compared withtheir peers who remained in public schools. This difference was larger than whatwe found for all voucher students in the first row of Table 2. The cohort of studentsusing vouchers for four total years scored −0.245 SD (P � 0.001) lower than theirmatched public school peers in year one. By year four, the negative effect shrunkto −0.173 SD (P � 0.010). An important caveat for these estimates is that we onlyobserved a small number of students who receive a voucher and attend a privateschool for a total of four years (175 total students). For all other cohorts, we did notobserve any meaningful differences with the overall first-, second-, and third-yearestimates.
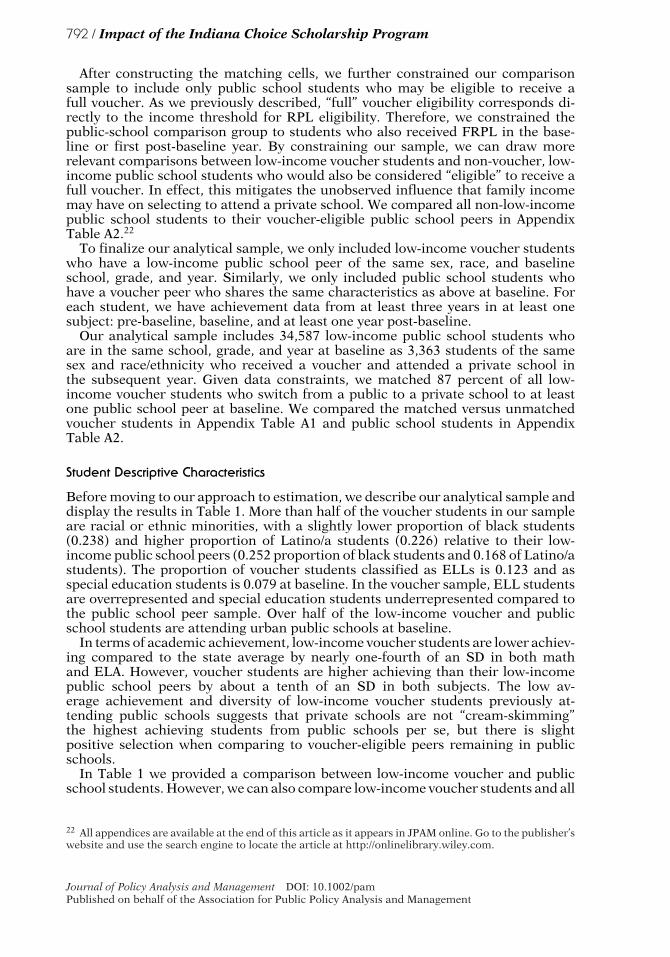
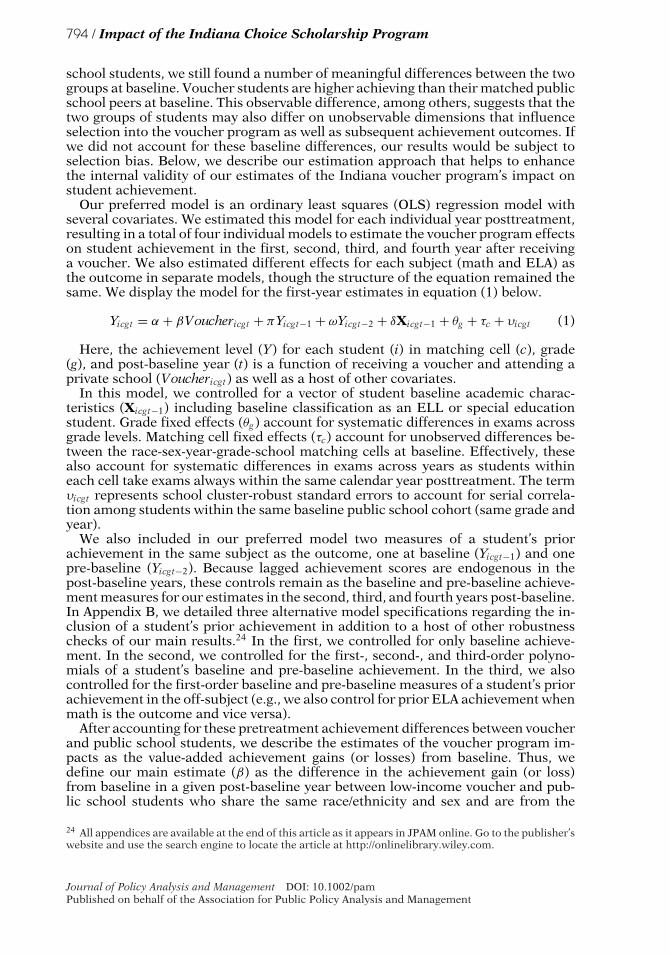
In ELA (Table 2), most of the value-added estimates for voucher students were notstatistically significant, indicating that there were no differences in ELA achieve-ment gains from baseline when comparing voucher students with their matchedpublic school peers. The one exception was the estimate for students in the sec-ond year revealing that voucher students scored −0.038 SD (P � 0.010) below theirpublic school peers. Although statistically significant, the estimate was quite smalland disappears immediately in the third year. The second-year achievement loss inELA was even larger (−0.153 SD, P � 0.001) for the cohort of students receiving avoucher for all four years; however, the loss also immediately dissipated. In additionto the estimates in Table 2, we display our main yearly effects in Figures 1 and 2.
Journal of Policy Analysis and Management DOI: 10.1002/pamPublished on behalf of the Association for Public Policy Analysis and Management

798 / Impact of the Indiana Choice Scholarship Program
Source: Authors’ calculations.
Figure 1. Mean Math Achievement Gain from Baseline for Indiana VoucherStudents.
Source: Authors’ calculations.
Figure 2. Mean ELA Achievement Gain from Baseline for Indiana VoucherStudents.
Journal of Policy Analysis and Management DOI: 10.1002/pamPublished on behalf of the Association for Public Policy Analysis and Management
Impact of the Indiana Choice Scholarship Program / 799
Robustness Checks
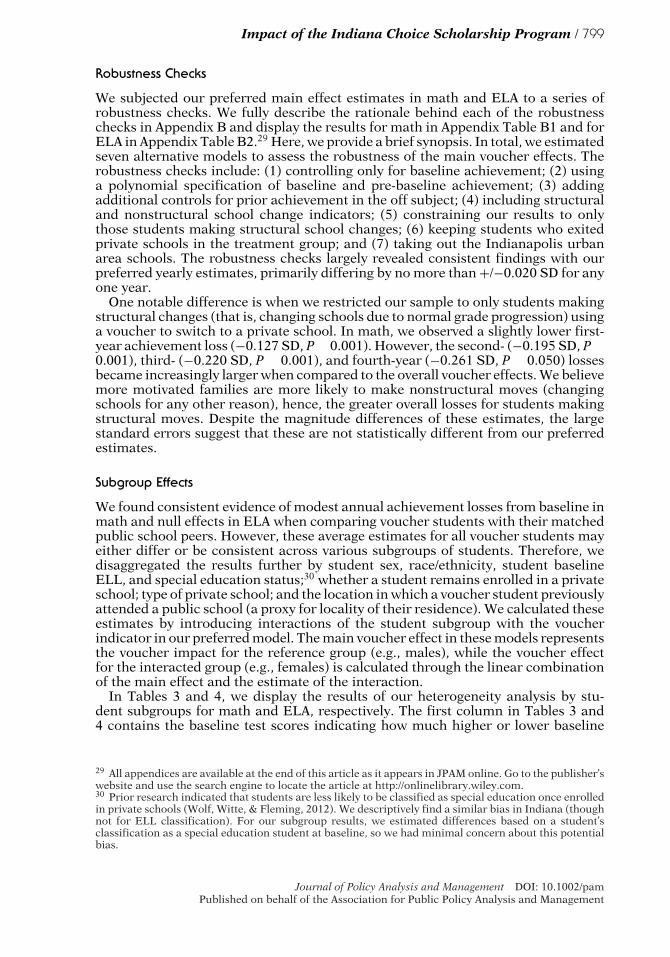
We subjected our preferred main effect estimates in math and ELA to a series ofrobustness checks. We fully describe the rationale behind each of the robustnesschecks in Appendix B and display the results for math in Appendix Table B1 and forELA in Appendix Table B2.29 Here, we provide a brief synopsis. In total, we estimatedseven alternative models to assess the robustness of the main voucher effects. Therobustness checks include: (1) controlling only for baseline achievement; (2) usinga polynomial specification of baseline and pre-baseline achievement; (3) addingadditional controls for prior achievement in the off subject; (4) including structuraland nonstructural school change indicators; (5) constraining our results to onlythose students making structural school changes; (6) keeping students who exitedprivate schools in the treatment group; and (7) taking out the Indianapolis urbanarea schools. The robustness checks largely revealed consistent findings with ourpreferred yearly estimates, primarily differing by no more than +/−0.020 SD for anyone year.
One notable difference is when we restricted our sample to only students makingstructural changes (that is, changing schools due to normal grade progression) usinga voucher to switch to a private school. In math, we observed a slightly lower first-year achievement loss (−0.127 SD, P � 0.001). However, the second- (−0.195 SD, P �0.001), third- (−0.220 SD, P � 0.001), and fourth-year (−0.261 SD, P � 0.050) lossesbecame increasingly larger when compared to the overall voucher effects. We believemore motivated families are more likely to make nonstructural moves (changingschools for any other reason), hence, the greater overall losses for students makingstructural moves. Despite the magnitude differences of these estimates, the largestandard errors suggest that these are not statistically different from our preferredestimates.
Subgroup Effects
We found consistent evidence of modest annual achievement losses from baseline inmath and null effects in ELA when comparing voucher students with their matchedpublic school peers. However, these average estimates for all voucher students mayeither differ or be consistent across various subgroups of students. Therefore, wedisaggregated the results further by student sex, race/ethnicity, student baselineELL, and special education status;30 whether a student remains enrolled in a privateschool; type of private school; and the location in which a voucher student previouslyattended a public school (a proxy for locality of their residence). We calculated theseestimates by introducing interactions of the student subgroup with the voucherindicator in our preferred model. The main voucher effect in these models representsthe voucher impact for the reference group (e.g., males), while the voucher effectfor the interacted group (e.g., females) is calculated through the linear combinationof the main effect and the estimate of the interaction.
In Tables 3 and 4, we display the results of our heterogeneity analysis by stu-dent subgroups for math and ELA, respectively. The first column in Tables 3 and4 contains the baseline test scores indicating how much higher or lower baseline
29 All appendices are available at the end of this article as it appears in JPAM online. Go to the publisher’swebsite and use the search engine to locate the article at http://onlinelibrary.wiley.com.30 Prior research indicated that students are less likely to be classified as special education once enrolledin private schools (Wolf, Witte, & Fleming, 2012). We descriptively find a similar bias in Indiana (thoughnot for ELL classification). For our subgroup results, we estimated differences based on a student’sclassification as a special education student at baseline, so we had minimal concern about this potentialbias.
Journal of Policy Analysis and Management DOI: 10.1002/pamPublished on behalf of the Association for Public Policy Analysis and Management
800 / Impact of the Indiana Choice Scholarship Program
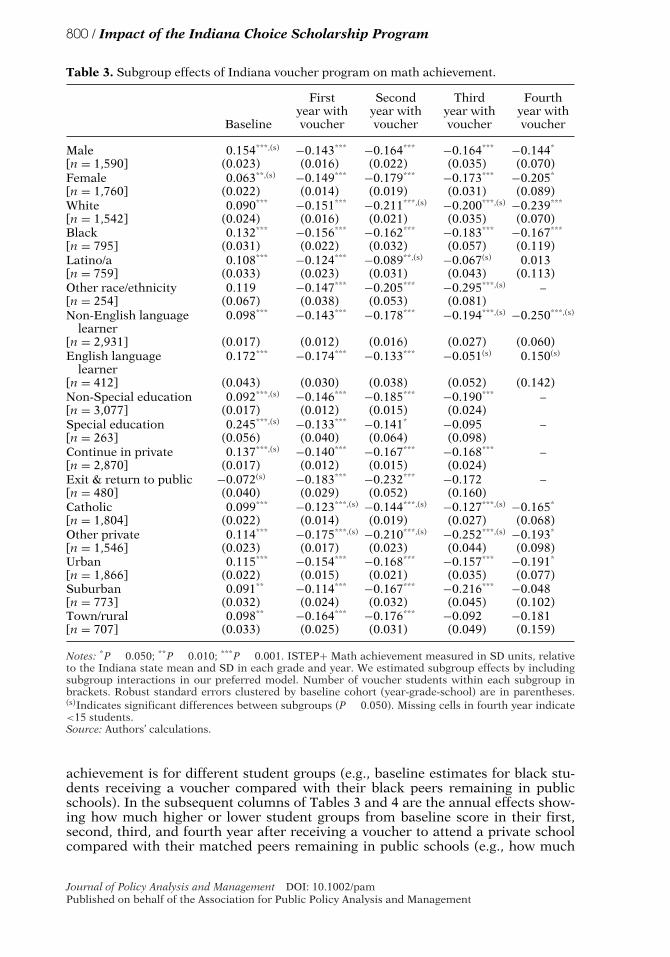
Table 3. Subgroup effects of Indiana voucher program on math achievement.
Baseline
Firstyear withvoucher
Secondyear withvoucher
Thirdyear withvoucher
Fourthyear withvoucher
Male 0.154***,(s) −0.143*** −0.164*** −0.164*** −0.144*
[n = 1,590] (0.023) (0.016) (0.022) (0.035) (0.070)Female 0.063**,(s) −0.149*** −0.179*** −0.173*** −0.205*
[n = 1,760] (0.022) (0.014) (0.019) (0.031) (0.089)White 0.090*** −0.151*** −0.211***,(s) −0.200***,(s) −0.239***
[n = 1,542] (0.024) (0.016) (0.021) (0.035) (0.070)Black 0.132*** −0.156*** −0.162*** −0.183*** −0.167***
[n = 795] (0.031) (0.022) (0.032) (0.057) (0.119)Latino/a 0.108*** −0.124*** −0.089**,(s) −0.067(s) 0.013[n = 759] (0.033) (0.023) (0.031) (0.043) (0.113)Other race/ethnicity 0.119 −0.147*** −0.205*** −0.295***,(s) –[n = 254] (0.067) (0.038) (0.053) (0.081)Non-English language
learner0.098*** −0.143*** −0.178*** −0.194***,(s) −0.250***,(s)
[n = 2,931] (0.017) (0.012) (0.016) (0.027) (0.060)English language
learner0.172*** −0.174*** −0.133*** −0.051(s) 0.150(s)
[n = 412] (0.043) (0.030) (0.038) (0.052) (0.142)Non-Special education 0.092***,(s) −0.146*** −0.185*** −0.190*** –[n = 3,077] (0.017) (0.012) (0.015) (0.024)Special education 0.245***,(s) −0.133*** −0.141* −0.095 –[n = 263] (0.056) (0.040) (0.064) (0.098)Continue in private 0.137***,(s) −0.140*** −0.167*** −0.168*** –[n = 2,870] (0.017) (0.012) (0.015) (0.024)Exit & return to public −0.072(s) −0.183*** −0.232*** −0.172 –[n = 480] (0.040) (0.029) (0.052) (0.160)Catholic 0.099*** −0.123***,(s) −0.144***,(s) −0.127***,(s) −0.165*
[n = 1,804] (0.022) (0.014) (0.019) (0.027) (0.068)Other private 0.114*** −0.175***,(s) −0.210***,(s) −0.252***,(s) −0.193*
[n = 1,546] (0.023) (0.017) (0.023) (0.044) (0.098)Urban 0.115*** −0.154*** −0.168*** −0.157*** −0.191*
[n = 1,866] (0.022) (0.015) (0.021) (0.035) (0.077)Suburban 0.091** −0.114*** −0.167*** −0.216*** −0.048[n = 773] (0.032) (0.024) (0.032) (0.045) (0.102)Town/rural 0.098** −0.164*** −0.176*** −0.092 −0.181[n = 707] (0.033) (0.025) (0.031) (0.049) (0.159)
Notes: *P � 0.050; **P � 0.010; ***P � 0.001. ISTEP+ Math achievement measured in SD units, relativeto the Indiana state mean and SD in each grade and year. We estimated subgroup effects by includingsubgroup interactions in our preferred model. Number of voucher students within each subgroup inbrackets. Robust standard errors clustered by baseline cohort (year-grade-school) are in parentheses.(s)Indicates significant differences between subgroups (P � 0.050). Missing cells in fourth year indicate<15 students.Source: Authors’ calculations.
achievement is for different student groups (e.g., baseline estimates for black stu-dents receiving a voucher compared with their black peers remaining in publicschools). In the subsequent columns of Tables 3 and 4 are the annual effects show-ing how much higher or lower student groups from baseline score in their first,second, third, and fourth year after receiving a voucher to attend a private schoolcompared with their matched peers remaining in public schools (e.g., how much
Journal of Policy Analysis and Management DOI: 10.1002/pamPublished on behalf of the Association for Public Policy Analysis and Management

Impact of the Indiana Choice Scholarship Program / 801
Table 4. Subgroup effects of Indiana voucher program on ELA achievement.
Baseline
Firstyear withvoucher
Secondyear withvoucher
Thirdyear withvoucher
Fourthyearwith
voucher
Male 0.169***,(s) 0.013 −0.020 0.000 0.096[n = 1,585] (0.023) (0.015) (0.022) (0.033) (0.076)Female 0.060**,(s) −0.017 −0.053** 0.025 0.025[n = 1,763] (0.022) (0.014) (0.019) (0.031) (0.060)White 0.112*** −0.031*,(s) −0.083***,(s) −0.034(s) 0.009[n = 1,538] (0.025) (0.016) (0.022) (0.033) (0.050)Black 0.152***,(s) 0.051*,(s) 0.006(s) 0.054 0.096[n = 796] (0.030) (0.021) (0.030) (0.050) (0.098)Latino/a 0.065*,(s) 0.006 0.011(s) 0.074(s) 0.137[n = 760] (0.030) (0.021) (0.028) (0.041) (0.121)Other race/ethnicity 0.106 −0.019 −0.034 −0.030 –[n = 254] (0.062) (0.041) (0.058) (0.084)Non-English language learner 0.118*** −0.003 −0.047** −0.011(s) 0.038[n = 2,929] (0.017) (0.011) (0.016) (0.024) (0.047)English language learner 0.053 −0.011 0.020 0.125*,(s) 0.167[n = 412] (0.036) (0.029) (0.039) (0.056) (0.151)Non-Special education 0.088***,(s) −0.003 −0.045** 0.009 –[n = 3,080] (0.016) (0.011) (0.015) (0.023)Special education 0.337***,(s) −0.013 0.047* 0.035 –[n = 258] (0.058) (0.039) (0.052) (0.092)Continue in private 0.138***,(s) 0.000 −0.031* 0.020(s) –[n = 2,870] (0.017) (0.012) (0.015) (0.022)Exit & return to public −0.048(s) −0.017 −0.121** −0.194(s) –[n = 478] (0.042) (0.026) (0.045) (0.105)Catholic 0.101*** 0.036**,(s) 0.010(s) 0.056*,(s) 0.039[n = 1,804] (0.021) (0.014) (0.018) (0.025) (0.061)Other private 0.123*** −0.049***,(s)−0.104***,(s) −0.074(s) 0.115[n = 1,544] (0.024) (0.016) (0.023) (0.042) (0.097)Urban 0.118*** 0.001 −0.023 0.027 0.028[n = 1,863] (0.021) (0.015) (0.021) (0.033) (0.080)Suburban 0.098* 0.011 −0.025 0.002 0.157[n = 772] (0.032) (0.021) (0.027) (0.036) (0.089)Town/rural 0.106** −0.021 −0.089** 0.013 0.044[n = 709] (0.034) (0.023) (0.032) (0.055) (0.072)
Notes: *P � 0.050; **P � 0.010; ***P � 0.001. ISTEP+ Math achievement measured in SD units, relativeto the Indiana state mean and SD in each grade and year. We estimated subgroup effects by includingsubgroup interactions in our preferred model. Number of voucher students within each subgroup inbrackets. Robust standard errors clustered by baseline cohort (year-grade-school) are in parentheses.(s)Indicates significant differences between subgroups (P � 0.050). Missing cells in fourth year indicate<15 students.Source: Authors’ calculations.
higher or lower black students scored from baseline through one, two, three, andfour years after receiving a voucher compared with their black peers who stayedin public schools). The estimates in Tables 3 and 4 are marked with an “(s)” ifthe differences in the value-added effects were significantly different, for exam-ple, between male and female voucher students, between black and white voucherstudents, or other subgroups of voucher students. Looking across student sub-groups, the results were generally consistent with our overall findings. The losses
Journal of Policy Analysis and Management DOI: 10.1002/pamPublished on behalf of the Association for Public Policy Analysis and Management
802 / Impact of the Indiana Choice Scholarship Program
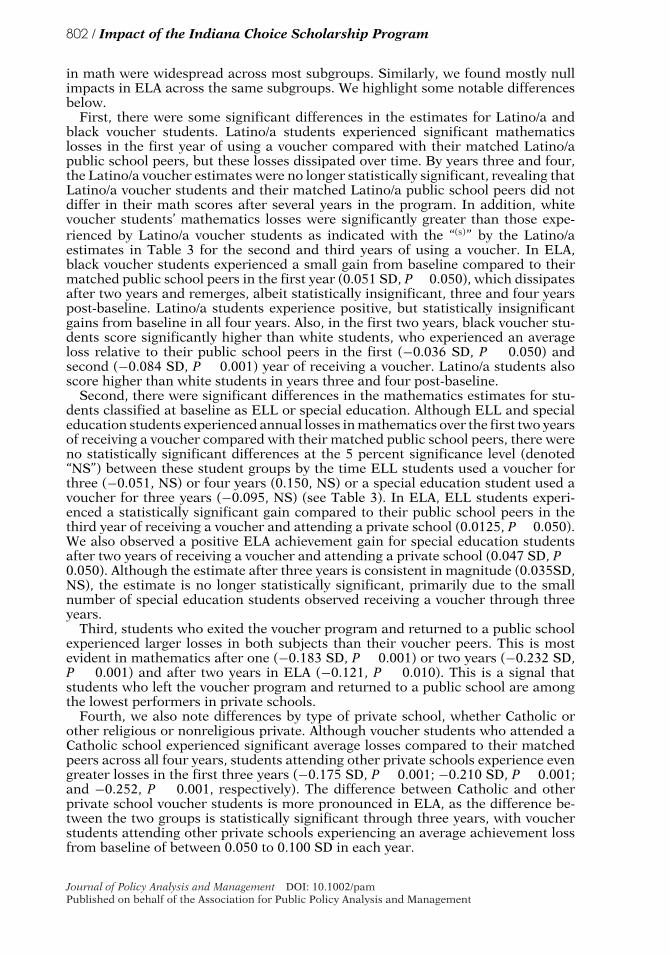
in math were widespread across most subgroups. Similarly, we found mostly nullimpacts in ELA across the same subgroups. We highlight some notable differencesbelow.
First, there were some significant differences in the estimates for Latino/a andblack voucher students. Latino/a students experienced significant mathematicslosses in the first year of using a voucher compared with their matched Latino/apublic school peers, but these losses dissipated over time. By years three and four,the Latino/a voucher estimates were no longer statistically significant, revealing thatLatino/a voucher students and their matched Latino/a public school peers did notdiffer in their math scores after several years in the program. In addition, whitevoucher students’ mathematics losses were significantly greater than those expe-rienced by Latino/a voucher students as indicated with the “(s)” by the Latino/aestimates in Table 3 for the second and third years of using a voucher. In ELA,black voucher students experienced a small gain from baseline compared to theirmatched public school peers in the first year (0.051 SD, P � 0.050), which dissipatesafter two years and remerges, albeit statistically insignificant, three and four yearspost-baseline. Latino/a students experience positive, but statistically insignificantgains from baseline in all four years. Also, in the first two years, black voucher stu-dents score significantly higher than white students, who experienced an averageloss relative to their public school peers in the first (−0.036 SD, P � 0.050) andsecond (−0.084 SD, P � 0.001) year of receiving a voucher. Latino/a students alsoscore higher than white students in years three and four post-baseline.
Second, there were significant differences in the mathematics estimates for stu-dents classified at baseline as ELL or special education. Although ELL and specialeducation students experienced annual losses in mathematics over the first two yearsof receiving a voucher compared with their matched public school peers, there wereno statistically significant differences at the 5 percent significance level (denoted“NS”) between these student groups by the time ELL students used a voucher forthree (−0.051, NS) or four years (0.150, NS) or a special education student used avoucher for three years (−0.095, NS) (see Table 3). In ELA, ELL students experi-enced a statistically significant gain compared to their public school peers in thethird year of receiving a voucher and attending a private school (0.0125, P � 0.050).We also observed a positive ELA achievement gain for special education studentsafter two years of receiving a voucher and attending a private school (0.047 SD, P �0.050). Although the estimate after three years is consistent in magnitude (0.035SD,NS), the estimate is no longer statistically significant, primarily due to the smallnumber of special education students observed receiving a voucher through threeyears.
Third, students who exited the voucher program and returned to a public schoolexperienced larger losses in both subjects than their voucher peers. This is mostevident in mathematics after one (−0.183 SD, P � 0.001) or two years (−0.232 SD,P � 0.001) and after two years in ELA (−0.121, P � 0.010). This is a signal thatstudents who left the voucher program and returned to a public school are amongthe lowest performers in private schools.
Fourth, we also note differences by type of private school, whether Catholic orother religious or nonreligious private. Although voucher students who attended aCatholic school experienced significant average losses compared to their matchedpeers across all four years, students attending other private schools experience evengreater losses in the first three years (−0.175 SD, P � 0.001; −0.210 SD, P � 0.001;and −0.252, P � 0.001, respectively). The difference between Catholic and otherprivate school voucher students is more pronounced in ELA, as the difference be-tween the two groups is statistically significant through three years, with voucherstudents attending other private schools experiencing an average achievement lossfrom baseline of between 0.050 to 0.100 SD in each year.
Journal of Policy Analysis and Management DOI: 10.1002/pamPublished on behalf of the Association for Public Policy Analysis and Management

Impact of the Indiana Choice Scholarship Program / 803
DISCUSSION
Although vouchers in Indiana are not randomly assigned, this study was able tomake use of state administrative longitudinal student records to investigate theimpacts of the Indiana voucher program on student achievement. Public and privateschool students in Indiana, including all students receiving a voucher, have takenthe same assessment for several years, even prior to the implementation of thevoucher program. This feature is a significant benefit to researchers, allowing forapples-to-apples comparisons of student achievement outcomes and the ability tocapture longitudinal impacts.
Generally, we found that low-income voucher students in Indiana experiencedsimilar average achievement in ELA after attending a private school as did theirmatched peers who remained in public schools. In math, voucher students expe-rienced a substantial average achievement loss after attending a private school incomparison with their public school peers. The losses in math primarily accumulateduring the first two years of attending a private school and persist. We found theseoverall results are consistent across several robustness checks and between moststudent subgroups. We also found no evidence of different pretreatment trends be-tween voucher and public students; the validity of our estimates hinges on this keyassumption being satisfied.
This study is one of a small, but growing number of studies to estimate such lossesin math achievement for students who use a voucher to attend a private school.Our findings align with recent research on the Louisiana Scholarship Program (seeAbdulkadiroglu, Pathak, & Walters, 2018; Mills & Wolf, 2017) the Ohio EdChoiceScholarship Program (Figlio & Karbownik, 2016), and the DC Opportunity Scholar-ship Program (Dynarski et al., 2017, 2018). We found a smaller average overall lossin math; however, we similarly found that the largest losses in math achievementoccur during the first two years of receiving a voucher and attending private school.We also found that these losses persist through four years of receiving a voucherand attending a private school, notably different from prior studies.
We also did not find statistical evidence that voucher students experience animprovement in their average achievement after baseline the longer they are enrolledin a private school. One might expect that students and their private schools wouldadjust to better meet the educational needs of voucher students. Collectively, thisdoes not appear to be the case. However, there may be notable differences amongprivate schools that is worthy of additional research to examine whether someprivate schools help students adjust to a greater degree than others. Incorporatingadditional years of testing data, which will also include new students, will help toreduce the noise in the third- and fourth-year estimates. Additional informationfrom teachers and principals also will help to shed more light on these trends—andpossible explanations for them—as the program continues to grow.
We did find some differential effects by some student subgroups. In math, Latino/astudents, by the third year of using a voucher, do not score differently from theirmatched public school Latino/a peers. White students experience consistent lossesacross all years post-baseline in mathematics and the first two years in ELA. Theresults in math are also similar across several other subgroups of students, exceptfor students classified as ELLs or special education at baseline. The consistencyof findings across most student subgroups raises questions about the mechanismsthat may explain these negative effects in mathematics, such as the mathematicscurriculum, instruction, or teacher quality in private schools not being as robust asis found in public schools.
In investigating how voucher effects may differ across types of private schools, wefound negative effects in mathematics for both Catholic and other private schools aswell as even greater negative effects for other private schools in both math and ELA
Journal of Policy Analysis and Management DOI: 10.1002/pamPublished on behalf of the Association for Public Policy Analysis and Management

804 / Impact of the Indiana Choice Scholarship Program
achievement. These mathematics findings for Catholic and other private schoolsmirror those we found in previous work on student transfers from public to Catholicand other private schools in Indianapolis (see Berends & Waddington, 2018). Thisis a relevant comparison as it takes place in the same state, includes a handful of thesame students, and the mechanism of switching from public to private schools is thesame. Further research should explore the possible variability of impacts betweenCatholic and other private schools as school-average effects in both subjects arehighly variable between schools. Some schools were more racially and ethnicallydiverse prior to the implementation of the voucher program, and therefore may havebeen better equipped to educate a demographically (and perhaps, academically)diverse group of students.
Our research has its limitations. Although our use of exact matching is a strongmethodological approach to examine impacts with longitudinal data and is basedon prior within-study comparisons, it has drawbacks as described earlier in thispaper. We only drew generalizations about students using vouchers to switch frompublic to private schools. Our modeling strategy aligns well with the original intentof the voucher program—to increase access to private schools for low-income publicschool families—to estimate the program’s effects. However, after the law changedprior to the 2013/2014 school year, which no longer required voucher students tomove from a public to private school, over half of all students participating in thevoucher program in 2014/2015 never attended an Indiana public school (IndianaDepartment of Education, 2018). For these students, we would find it challengingto establish an equivalent baseline and assess meaningful voucher effects. We alsofound it challenging to estimate effects for non-low-income voucher recipients (e.g.,those receiving a “half” voucher) as we did not have a fine-grained measure ofincome to identify comparable public students who would be eligible.
Second, Indiana does not have a common assessment system in the pre-K throughsecond grade levels in public and private schools. Because we used third, fourth, orfifth grade as a baseline for most students, our research focuses on voucher programeffects in the upper elementary and middle school grades. In 2014/2015, nearly50 percent of the students receiving vouchers statewide were in the K-4 grade levels(Indiana Department of Education, 2018), meaning that current ISTEP+ testingdoes not capture a significant number of students receiving vouchers. As a result,we may never know whether the ICSP had a significant impact (positive or negative)on students in earlier grade levels.
Voucher programs are designed to provide new learning opportunities, for whichachievement gains should serve as a proxy for any program’s success for studentsand schools. Our results do not provide robust support that the ICSP has been suc-cessful to date at improving student achievement for low-income students whouse a voucher to switch from a public to a private school. Although academicachievement outcomes are important for researchers, policymakers, and practi-tioners to consider, parents make schooling decisions for their children based ona multitude of factors, including academics, location, safety, and religion. There-fore, researchers need to examine outcomes beyond test scores (e.g., educationalattainment, engagement, social and emotional learning, character, civic participa-tion, and other nonacademic outcomes). Additional data on these other studentoutcomes need to be collected and analyzed to provide a more complete picture. Inan era of expanding school choice, policymakers must draw from recent findingsabout statewide voucher programs that there is more to learn about the impacts oflarge-scale parental choice programs on American families.
R. JOSEPH WADDINGTON is an Assistant Professor in the Department of EducationalPolicy Studies and Evaluation at the University of Kentucky, 131 Taylor EducationBuilding, Lexington, KY 40506 (e-mail: [email protected]).
Journal of Policy Analysis and Management DOI: 10.1002/pamPublished on behalf of the Association for Public Policy Analysis and Management

Impact of the Indiana Choice Scholarship Program / 805
MARK BERENDS is a Professor of Sociology at the University of Notre Dame, 4110AJenkins Nanovic Halls, Notre Dame, IN 46556 (e-mail: [email protected]).
ACKNOWLEDGMENTS
This paper was supported by Notre Dame’s Center for Research on Educational Opportunity(CREO), Institute of Educational Initiatives, the Spencer Foundation, and the Walton FamilyFoundation. We are grateful to the Indiana Department of Education for providing accessto the state administrative records and for supporting independent analyses. We are alsograteful for the substantial feedback we have received from numerous colleagues over severalversions of this paper, including David Agrawal, Bob Bifulco, Jo Blacketor, Ken Couch,Josh Cowen, John Elcesser, Joe Ferrare, Phil Gleason, Joshua Goodman, Doug Harris, BrianJacob, Helen “Sunny” Ladd, Hank Levin, Maddy Mavrogordato, Macke Raymond, Amy EllenSchwartz, James Shuls, Erdal Tekin, Genia Toma, Patrick Wolf, Ron Zimmer, and threeanonymous reviewers. All opinions expressed in this paper represent those of the authorsand not necessarily the institutions with which they are affiliated. All errors in this paper aresolely the responsibility of the authors. For more information, please visit the CREO websiteat http://creo.nd.edu/people/faculty/mark-berends.
REFERENCES
Abdulkadiroglu, A., Angrist, J. D., Dynarski, S. M., Kane, T. J., & Pathak, P. A. (2011). Ac-countability and flexibility in public schools: Evidence from Boston’s charters and pilots.The Quarterly Journal of Economics, 126, 699–748.
Abdulkadiroglu, A., Pathak, P. A., & Walters, C. R. (2018). Free to choose: Can school choicereduce student achievement? American Economic Journal: Applied Economics, 10, 175–206.
Anderson, K. P., & Wolf, P. J. (2017). Evaluating school vouchers: Evidence from a within-study comparison. EDRE Working Paper No. 2017-10. Department of Education Reform,University of Arkansas, Fayetteville, AR.
Angrist, J. D., Dynarski, S., Kane, T. J., Pathak, P. A., & Walters, C. R. (2012). Studentachievement in charter schools: Who benefits from KIPP? Journal of Policy Analysis andManagement, 31, 837–860.
Angrist, J. D., Pathak, P. A., & Walters, C. R. (2013). Explaining charter school effectiveness.American Economic Journal: Applied Economics, 5, 1–27.
Ashenfelter, O. (1978). Estimating the effect of training programs on earnings. The Reviewof Economics and Statistics, 60, 47–57.
Austin, M. J., & Berends, M. (2018). School choice and learning opportunities. In G. Schneider(Ed.), Handbook of the sociology of education in the 21st century (pp. 221–225). New York,NY: Springer.
Barnard, J., Frangakis, C., Hill, J., & Rubin, D. (2003). Principal stratification approach tobroken randomized experiments: A case study of school choice vouchers in New York City.Journal of the American Statistical Association, 98, 299–323.
Berends, M. (2018). The continuing evolution of school choice in America. In R. Papa & S.Armfield (Eds.), Handbook of education policy (pp. 97–118). Hoboken, NJ: Wiley-Blackwell.
Berends, M., Bodilly, S., & Kirby, S. N. (2002). Facing the challenges of whole-school reform:New American Schools after a decade. Santa Monica, CA: RAND.
Berends, M., & Waddington, R. J. (2018). School choice in Indianapolis: Effects of charter,magnet, private, and traditional public schools. Education Finance and Policy, 13, 227–255.
Bifulco, R. (2012). Can nonexperimental estimates replicate estimates based on randomassignment in evaluations of school choice? A within-study comparison. Journal of PolicyAnalysis and Management, 31, 729–751.
Chubb, J. E., & Moe, T. M. (1990). Politics, markets and American schools. Washington, DC:Brookings Institution Press.
Journal of Policy Analysis and Management DOI: 10.1002/pamPublished on behalf of the Association for Public Policy Analysis and Management

806 / Impact of the Indiana Choice Scholarship Program
Clark, M. A., Gleason, P. M., Tuttle, C. C., & Silverberg, M. K. (2015). Do charter schoolsimprove student achievement? Educational Evaluation and Policy Analysis, 37, 419–436.
Cook, T., Shadish, W., & Wong, V. (2008). Three conditions under which experiments andobservational studies produce comparable causal estimates: New findings from within-study comparisons. Journal of Policy Analysis and Management, 27, 724–750.
Cowen, J. (2008) School choice as a latent variable: Estimating the complier average causaleffect of vouchers in Charlotte. Policy Studies Journal, 36, 301–315.
Dobbie W., & Fryer, R. G. (2013). Getting beneath the veil of effective schools: Evidence fromNew York City. American Economic Journal: Applied Economics, 5, 28–60.
Dobbie W., & Fryer, R. G. (2017). Charter schools and labor market outcomes. NBER Work-ing Paper No. 22502. National Bureau of Economic Research, Cambridge, MA. Updatedversion. Retrieved April 23, 2018, from https://sites.google.com/site/willdobbie/.
Dragoset, L., Thomas, J., Herrmann, M., Deke, J., James-Burdumy, S., Graczewski, C., . . .Giffin, J. (2017). School Improvement Grants: Implementation and effectiveness. NCEE Re-port 2017–4013. Washington, DC: National Center for Education Evaluation and RegionalAssistance, Institute of Education Sciences, U.S. Department of Education.
Dynarski, M., Rui, N., Webber, A., Gutmann, B., & Bachman, M. (2017). Evaluationof the DC Opportunity Scholarship Program: Impacts after one year. NCEE Report2017–4022. Washington, DC: National Center for Education Evaluation and RegionalAssistance, Institute of Education Sciences, U.S. Department of Education.
Dynarski, M., Rui, N., Webber, A., Gutmann, B., & Bachman, M. (2018). Evaluation of the DCOpportunity Scholarship Program: Impacts after two years after students applied. NCEEReport 2018–4010. Washington, DC: National Center for Education Evaluation and Re-gional Assistance, Institute of Education Sciences, U.S. Department of Education.
EdChoice. (2018). School choice in America. Indianapolis, IN: Author. Retrieved November22, 2017, from https://www.edchoice.org/school-choice/school-choice-in-america/.
Epple, D., Romano, R. E., & Urquiola, M. (2017). School vouchers: A survey of the economicsliterature. Journal of Economic Literature, 55, 441–492.
Figlio, D. N. (2009). Voucher outcomes. In M. Berends, M. G. Springer, D. Ballou, & H. J.Walberg (Eds.), Handbook of research on school choice (pp. 321–337). New York, NY:Routledge.
Figlio, D. N., & Karbownik, K. (2016). Evaluation of Ohio’s EdChoice Scholarship Program.Columbus, OH: Fordham Institute.
Finnegan, K. S. (2007). Charter school autonomy: The mismatch between theory and practice.Educational Policy, 21, 503–526.
Fortson, K., Gleason, P., Kopa, E., & Verbitsky-Savitz, N. (2014). Horseshoes, hand grenades,and treatment effects? Reassessing whether nonexperimental estimators are biased. Eco-nomics of Education Review, 44, 100–113.
Friedman, M. (1955). The role of government in education. In R. A. Solo (Ed.), Economicsand the public interest (pp. 123–144). New Brunswick, NJ: Rutgers University Press.
Friedman, M. (1962). Capitalism and freedom. Chicago, IL: Chicago University Press.
Greene, J. P. (2001). Vouchers in Charlotte: Vouchers and the test-score gap. Education Next,1, 55–60.
Greene, J. P., Peterson, P. E., & Du, J. (1998). School choice in Milwaukee: A randomizedexperiment. In P. Peterson & B. Hassell (Eds.), Learning from school choice (pp. 335–356).Washington, DC: Brookings Institution Press.
Greene, J. P., Peterson, P. E., & Du, J. (1999). Effectiveness of school choice: The Milwaukeevoucher experiment. Education and Urban Society, 31, 190–213.
Grigg, J. (2012). School enrollment changes and student achievement growth: A case studyin educational disruption and continuity. Sociology of Education, 85, 388–404.
Henig, J. R. (1995). Rethinking school choice: Limits of the market metaphor. Princeton, NJ:Princeton University Press.
Journal of Policy Analysis and Management DOI: 10.1002/pamPublished on behalf of the Association for Public Policy Analysis and Management
Impact of the Indiana Choice Scholarship Program / 807
Hess, F. M. (2002). Revolution at the margins: The impact of competition on urban schoolsystems. Washington, DC: Brookings Institution Press.
Howell, W. G., & Peterson, P. E. (2006). The education gap: Vouchers and urban schools.Washington, DC: Brookings Institution Press.
Indiana Department of Education. (2011). 2011–2012 ISTEP+ program manual: Policies andprocedures for Indiana’s assessment system. Indianapolis, IN: Author.
Indiana Department of Education. (2018). Choice scholarship program annual report: Par-ticipation and payment data. Indianapolis, IN: Author (Office of School Finance).
Jin, H., Barnard, J., & Rubin, D. B. (2010). A modified general location model for non-compliance with missing data: Revisiting the New York City School Choice ScholarshipProgram using principal stratification. Journal of Educational and Behavioral Statistics,35, 154–173.
Kahlenberg, R. D. (2017, January 31). Can vouchers save failing schools? The At-lantic. Retrieved November 22, 2017, from https://www.theatlantic.com/education/archive/2017/01/can-vouchers-save-failing-schools/515061/.
Koedel, C., Mihaly, K., & Rockoff, J. E. (2015). Value-added modeling: A review. Economicsof Education Review, 47, 180–195.
Krueger, A. B., & Zhu, P. (2004). Another look at the New York City school voucher experi-ment. American Behavioral Scientist, 47, 658–698.
Levin, H. M. (1998). Educational vouchers: Effectiveness, choice, and costs. Journal of PolicyAnalysis and Management, 17, 373–392.
Metcalf, K. K., West, S. D., Legan, N., Paul, K., & Boone, W. J. (2002). Evaluation of theCleveland Scholarship and Tutoring Program, 1998–2001. Summary report and technicalreport. Bloomington, IN: Indiana Center for Evaluation.
Mills, J. N., & Wolf, P. J. (2017). Vouchers in the Bayou: The effects of the Louisiana Schol-arship Program on student achievement after 2 years. Educational Evaluation and PolicyAnalysis, 39, 464–484.
Robins, J., Hernan, M., & Brumback, B. (2000). Marginal structural models and causal infer-ence in epidemiology. Epidemiology, 11, 550–560.
Rosenbaum, P. R., & Rubin, D. B. (1983). The central role of the propensity score in obser-vational studies for causal effects. Biometrika, 70, 41–55.
Rouse, C. E. (1998). Private school vouchers and student achievement: An evaluation of theMilwaukee Parental Choice Program. Quarterly Journal of Economics, 113, 553–602.
Schwartz, A. E., Stiefel, L., & Cordes, S. A. (2017). Moving matters: The causal effect ofmoving schools on student performance. Education Finance and Policy, 12, 419–446.
Shakeel, M. D., Anderson, K. P., & Wolf, P. J. (2016). The participant effects of private schoolvouchers across the globe: A meta-analytic and systematic review. EDRE Working PaperNo. 2016-07. Department of Education Reform, University of Arkansas, Fayetteville, AR.
Sobel, M. E. (2012). Does marriage boost men’s wages? Identification of treatment effectsfrom fixed effects regression models for longitudinal data. Journal of the American Statis-tical Association, 107, 521–529.
Witte, J. F. (2000). The market approach to education: An analysis of America’s first voucherprogram. Princeton, NJ: Princeton University Press.
Witte, J. F., Wolf, P. J., Cowen, J. M., Carlson, D., & Fleming, D. J. (2014). High stakes choice:Achievement and accountability in the nation’s oldest urban voucher program. EducationalEvaluation and Policy Analysis, 36, 437–456.
Wolf, P. J., Gutmann, B., Puma, M., Kisida, B., Rizzo, L., Eissa, N., & Carr, M. (2010).Evaluation of the DC Opportunity Scholarship Program: Final Report. NCEE Report 2010–4018. Washington, DC: National Center for Education Evaluation and Regional Assistance,Institute of Education Sciences, U.S. Department of Education.
Wolf, P. J., Kisida, B., Gutmann, B., Puma, J., Eissa, N., & Rizzo, L. (2013). School vouchersand student outcomes: Experimental evidence from Washington, DC. Journal of PolicyAnalysis and Management, 32, 246–270.
Journal of Policy Analysis and Management DOI: 10.1002/pamPublished on behalf of the Association for Public Policy Analysis and Management

808 / Impact of the Indiana Choice Scholarship Program
Wolf, P. J., Kisida, B., Gutmann, B., Puma, J., Rizzo, L., & Eissa, N. (2011). School vouchersin the nation’s capital. In M. Berends, M. Cannata, & E. B. Goldring (Eds.), School choiceand school improvement (pp. 17–33). Boston, MA: Harvard Education Press.
Wolf, P. J., & McShane, M. (2013). Is the juice worth the squeeze? A benefit/cost analysis ofthe District of Columbia Opportunity Scholarship Program. Education Finance and Policy,8, 75–99.
Wolf, P. J., Witte, J. F., & Fleming, D. J. (2012). Special Education and the Milwaukee ParentalChoice Program. SCDP Milwaukee Evaluation Report #35. Fayetteville, AR: School ChoiceDemonstration Project, Department of Education Reform, University of Arkansas.
Zimmer, R., & Bettinger, E. P. (2015). Beyond the rhetoric: Surveying the evidence on vouch-ers and tax credits. In H. F. Ladd & M. E. Goertz (Eds.), Handbook of research in educationfinance and policy (pp. 444–467). New York, NY: Routledge.
Zimmer, R., Henry, G. T., & Kho, A. (2017). The effects of turnaround in Tennessee’s achieve-ment school district and innovation zones. Educational Evaluation and Policy Analysis, 39,670–696.
Journal of Policy Analysis and Management DOI: 10.1002/pamPublished on behalf of the Association for Public Policy Analysis and Management
Impact of the Indiana Choice Scholarship Program
Appendix A
Description of Data Restrictions for Analysis
In the process of creating our analytical sample, we made several decisions thatpared down the sample of voucher and public school comparison students. Wedescribe these decisions below and include the number of voucher students removedin parentheses. We have no evidence that public school comparison students weredifferentially excluded because of these decisions.
Between the 2011/2012 and 2014/2015 school years, there were a total of 19,120unique students who received vouchers statewide in grades 3 through 8. We firstremoved any students whom we observed with multiple observations within a givenyear or who transferred schools within the same year (29). We do not have informa-tion from IDOE that allows us to tell which school these students attended first or inwhich one they were tested. Next, we removed all voucher students (3,101) who hadonly one total year of testing data. These are mostly 3rd-grade students receiving avoucher in 2014/2015. We also removed all students (3,371; mostly fourth gradersin 2014/2015) with only two years of test data as our models include controls for apre-baseline and baseline year. We removed all students (850) who are missing bothmath and ELA test scores in any given year as they have a gap in their achievementtrajectories. Last, we removed all students who at some point attended alternativepublic schools throughout the state (13).
Based on these decisions, we have 11,756 unique voucher students for whomwe have at least three consecutive years of test scores in our data. Similarly, wehave 556,919 unique students attending an Indiana public school (traditional pub-lic, charter, or magnet) with at least three consecutive years of test scores in ourdata, never received a voucher, and remain enrolled in a public school through theduration of our available data. We provide descriptives for all voucher and publicschool students not part of our analytic sample in Tables A1 and A2. We includeother relevant dimensions of the voucher student analytic sample in Table A3.
Journal of Policy Analysis and Management DOI: 10.1002/pamPublished on behalf of the Association for Public Policy Analysis and Management

Impact of the Indiana Choice Scholarship Program
Tab
leA
1.C
omp
aris
onof
allv
ouch
eran
dn
on-v
ouch
erp
riva
tesc
hoo
lstu
den
ts.
Non
-Vou
cher
Vou
cher
stu
den
tsst
ud
ents
Pu
bli
c→P
riva
teM
atch
edlo
w-i
nco
me
Pu
bli
c→P
riva
teU
nm
atch
edlo
w-i
nco
me
Pu
bli
c→P
riva
teN
on-L
owin
com
e
Pri
vate
→P
ub
lic
→P
riva
teP
riva
te→
Pu
bli
cA
lway
sp
riva
teC
ath
olic
Oth
erp
riva
te
Stu
den
ts3,
363
520
501
209
649
6,51
431
,482
12,6
09
Bas
elin
eye
arA
llye
ars
All
year
sF
emal
e0.
526
0.52
10.
470
0.55
90.
516
0.50
80.
495
0.50
5B
lack
0.23
80.
181
0.10
60.
119
0.24
90.
102
0.02
90.
053
Lat
ino/
a0.
226
0.30
10.
068
0.15
00.
162
0.15
60.
066
0.02
5O
ther
race
/eth
nic
ity
0.07
60.
175
0.07
20.
119
0.11
40.
078
0.06
40.
061
Rec
eive
dF
RP
L0.
951
0.85
00.
000
0.57
10.
852
0.63
30.
140
0.15
7E
LL
0.12
30.
134
0.01
40.
027
0.15
30.
147
0.04
90.
026
Sp
ecia
led
uca
tion
0.07
90.
083
0.08
40.
036
0.17
80.
127
0.08
70.
079
Ret
ain
ed0.
008
0.03
50.
004
0.00
00.
068
0.03
40.
012
0.01
8M
ean
mat
hsc
ore
−0.2
44−0
.252
0.11
4–
––
––
Mea
nE
LA
scor
e−0
.220
−0.2
460.
200
––
––
–
All
year
sw
ith
vou
cher
All
year
sM
ean
mat
hsc
ore
−0.3
73−0
.394
−0.0
73−0
.249
−0.6
04−0
.146
0.38
70.
230
Mea
nE
LA
scor
e−0
.205
−0.2
410.
147
0.00
8−0
.416
0.01
20.
500
0.36
4
Not
es:T
able
dis
pla
ysvo
uch
eran
dp
riva
tesc
hoo
lstu
den
tsw
ith
atle
astt
hre
eye
ars
ofte
stsc
ores
.Pro
por
tion
sof
stu
den
tsre
por
ted
for
dem
ogra
ph
icch
arac
teri
stic
s.M
ean
IST
EP+
Mat
han
dE
LA
scor
esm
easu
red
inS
Du
nit
s,re
lati
veto
the
Ind
ian
ast
ate
mea
nan
dS
Dw
ith
inea
chgr
ade
and
year
.For
vou
cher
stu
den
tsm
ovin
gfr
omp
ub
lic
top
riva
tesc
hoo
ls(t
he
firs
tth
ree
colu
mn
s),
dem
ogra
ph
ican
dac
hie
vem
ent
char
acte
rist
ics
rep
orte
din
bas
elin
eye
aras
wel
las
ach
ieve
men
tin
all
year
sre
ceiv
ing
avo
uch
er.F
oral
loth
ervo
uch
erst
ud
ents
and
non
-vou
cher
pri
vate
sch
ools
tud
ents
,dem
ogra
ph
ican
dac
hie
vem
ent
char
acte
rist
ics
rep
orte
dac
ross
ally
ears
(e.g
.,ev
erre
ceiv
edF
RP
L,e
ver
clas
sifi
edas
EL
L,a
ggre
gate
ach
ieve
men
t).
Sou
rce:
Au
thor
s’ca
lcu
lati
ons.
Journal of Policy Analysis and Management DOI: 10.1002/pamPublished on behalf of the Association for Public Policy Analysis and Management

Impact of the Indiana Choice Scholarship Program
Table A2. Comparison of all public school students.
Matchedlow-income
public
Unmatchedlow-income
public
Non-Low-Income
public inmatching cell
Outside ofmatching cell
public
Students 34,587 22,961 41,099 458,272
Baseline year All yearsFemale 0.527 0.509 0.505 0.493Black 0.252 0.281 0.057 0.098Latino/a 0.168 0.141 0.022 0.088Other race/
ethnicity0.027 0.030 0.026 0.084
Received FRPL 0.922 0.930 0.000 0.550ELL 0.114 0.085 0.019 0.073Special education 0.008 0.125 0.129 0.160Retained 0.065 0.020 0.007 0.021Attended charter 0.065 0.113 0.035 0.033Attended magnet 0.020 0.054 0.023 0.024Mean math score −0.335 −0.332 0.358 –Mean ELA score −0.333 −0.325 0.362 –
All yearsMean math score −0.310 −0.326 0.371 0.052Mean ELA score −0.307 −0.323 0.344 0.039
Notes: Table displays public school students with at least three years of test scores and who have neverreceived a voucher or attended a private school. Proportions of students reported for demographiccharacteristics. Mean ISTEP+ Math and ELA scores measured in SD units, relative to the Indianastate mean and SD within each grade and year. For public students within a matching cell (the first threecolumns), demographic and achievement characteristics reported in baseline year as well as achievementacross all years of available data. For unmatched public school students, demographic and achievementcharacteristics reported across all years (e.g., ever received FRPL, ever classified as ELL, aggregateachievement).Source: Authors’ calculations.
Journal of Policy Analysis and Management DOI: 10.1002/pamPublished on behalf of the Association for Public Policy Analysis and Management
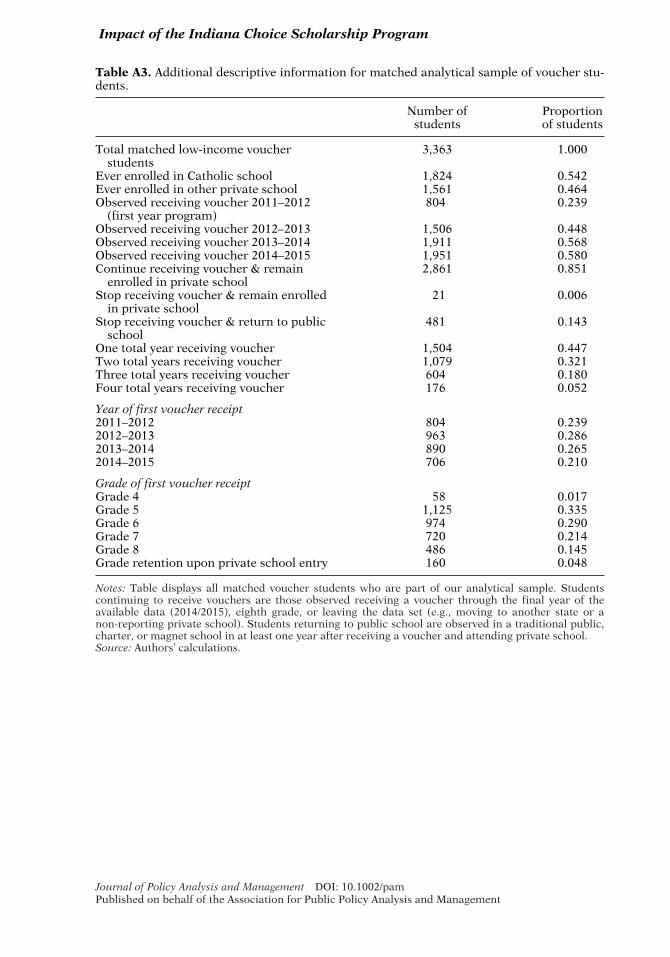
Impact of the Indiana Choice Scholarship Program
Table A3. Additional descriptive information for matched analytical sample of voucher stu-dents.
Number ofstudents
Proportionof students
Total matched low-income voucherstudents
3,363 1.000
Ever enrolled in Catholic school 1,824 0.542Ever enrolled in other private school 1,561 0.464Observed receiving voucher 2011–2012
(first year program)804 0.239
Observed receiving voucher 2012–2013 1,506 0.448Observed receiving voucher 2013–2014 1,911 0.568Observed receiving voucher 2014–2015 1,951 0.580Continue receiving voucher & remain
enrolled in private school2,861 0.851
Stop receiving voucher & remain enrolledin private school
21 0.006
Stop receiving voucher & return to publicschool
481 0.143
One total year receiving voucher 1,504 0.447Two total years receiving voucher 1,079 0.321Three total years receiving voucher 604 0.180Four total years receiving voucher 176 0.052
Year of first voucher receipt2011–2012 804 0.2392012–2013 963 0.2862013–2014 890 0.2652014–2015 706 0.210
Grade of first voucher receiptGrade 4 58 0.017Grade 5 1,125 0.335Grade 6 974 0.290Grade 7 720 0.214Grade 8 486 0.145Grade retention upon private school entry 160 0.048
Notes: Table displays all matched voucher students who are part of our analytical sample. Studentscontinuing to receive vouchers are those observed receiving a voucher through the final year of theavailable data (2014/2015), eighth grade, or leaving the data set (e.g., moving to another state or anon-reporting private school). Students returning to public school are observed in a traditional public,charter, or magnet school in at least one year after receiving a voucher and attending private school.Source: Authors’ calculations.
Journal of Policy Analysis and Management DOI: 10.1002/pamPublished on behalf of the Association for Public Policy Analysis and Management
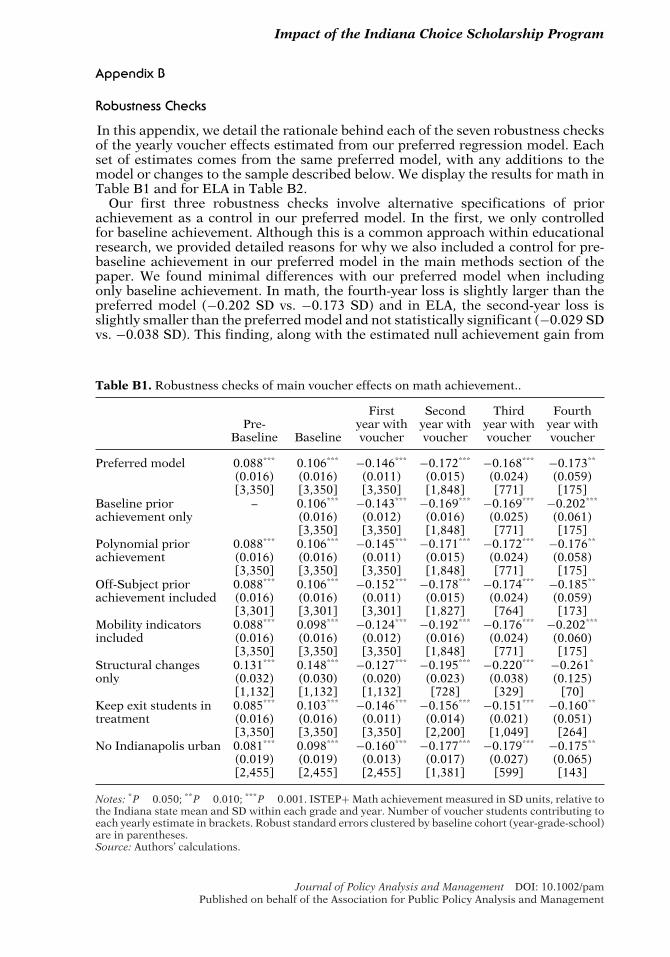
Impact of the Indiana Choice Scholarship Program
Appendix B
Robustness Checks
In this appendix, we detail the rationale behind each of the seven robustness checksof the yearly voucher effects estimated from our preferred regression model. Eachset of estimates comes from the same preferred model, with any additions to themodel or changes to the sample described below. We display the results for math inTable B1 and for ELA in Table B2.
Our first three robustness checks involve alternative specifications of priorachievement as a control in our preferred model. In the first, we only controlledfor baseline achievement. Although this is a common approach within educationalresearch, we provided detailed reasons for why we also included a control for pre-baseline achievement in our preferred model in the main methods section of thepaper. We found minimal differences with our preferred model when includingonly baseline achievement. In math, the fourth-year loss is slightly larger than thepreferred model (−0.202 SD vs. −0.173 SD) and in ELA, the second-year loss isslightly smaller than the preferred model and not statistically significant (−0.029 SDvs. −0.038 SD). This finding, along with the estimated null achievement gain from
Table B1. Robustness checks of main voucher effects on math achievement..
Pre-Baseline Baseline
Firstyear withvoucher
Secondyear withvoucher
Thirdyear withvoucher
Fourthyear withvoucher
Preferred model 0.088*** 0.106*** −0.146*** −0.172*** −0.168*** −0.173**
(0.016) (0.016) (0.011) (0.015) (0.024) (0.059)[3,350] [3,350] [3,350] [1,848] [771] [175]
Baseline priorachievement only
– 0.106*** −0.143*** −0.169*** −0.169*** −0.202***
(0.016) (0.012) (0.016) (0.025) (0.061)[3,350] [3,350] [1,848] [771] [175]
Polynomial priorachievement
0.088*** 0.106*** −0.145*** −0.171*** −0.172*** −0.176**
(0.016) (0.016) (0.011) (0.015) (0.024) (0.058)[3,350] [3,350] [3,350] [1,848] [771] [175]
Off-Subject priorachievement included
0.088*** 0.106*** −0.152*** −0.178*** −0.174*** −0.185**
(0.016) (0.016) (0.011) (0.015) (0.024) (0.059)[3,301] [3,301] [3,301] [1,827] [764] [173]
Mobility indicatorsincluded
0.088*** 0.098*** −0.124*** −0.192*** −0.176*** −0.202***
(0.016) (0.016) (0.012) (0.016) (0.024) (0.060)[3,350] [3,350] [3,350] [1,848] [771] [175]
Structural changesonly
0.131*** 0.148*** −0.127*** −0.195*** −0.220*** −0.261*
(0.032) (0.030) (0.020) (0.023) (0.038) (0.125)[1,132] [1,132] [1,132] [728] [329] [70]
Keep exit students intreatment
0.085*** 0.103*** −0.146*** −0.156*** −0.151*** −0.160**
(0.016) (0.016) (0.011) (0.014) (0.021) (0.051)[3,350] [3,350] [3,350] [2,200] [1,049] [264]
No Indianapolis urban 0.081*** 0.098*** −0.160*** −0.177*** −0.179*** −0.175**
(0.019) (0.019) (0.013) (0.017) (0.027) (0.065)[2,455] [2,455] [2,455] [1,381] [599] [143]
Notes: *P � 0.050; **P � 0.010; ***P � 0.001. ISTEP+ Math achievement measured in SD units, relative tothe Indiana state mean and SD within each grade and year. Number of voucher students contributing toeach yearly estimate in brackets. Robust standard errors clustered by baseline cohort (year-grade-school)are in parentheses.Source: Authors’ calculations.
Journal of Policy Analysis and Management DOI: 10.1002/pamPublished on behalf of the Association for Public Policy Analysis and Management

Impact of the Indiana Choice Scholarship Program
Table B2. Robustness checks of main voucher effects on ELA achievement.
Pre-Baseline Baseline
Firstyear withvoucher
Secondyear withvoucher
Thirdyear withvoucher
Fourthyear withvoucher
Preferred model 0.097*** 0.111*** −0.002 −0.038** 0.013 0.062(0.015) (0.016) (0.011) (0.015) (0.023) (0.053)[3,348] [3,348] [3,348] [1,843] [777] [176]
Baseline priorachievement only
– 0.111*** 0.004 −0.029 0.018 0.062(0.016) (0.011) (0.016) (0.024) (0.053)[3,348] [3,348] [1,843] [777] [176]
Polynomial priorachievement
0.097*** 0.111*** −0.002 −0.038** −0.013 0.048(0.015) (0.016) (0.011) (0.014) (0.022) (0.049)[3,348] [3,348] [3,348] [1,843] [777] [176]
Off-Subject priorachievement included
0.097*** 0.111*** −0.008 −0.047*** 0.004 0.037(0.015) (0.016) (0.011) (0.014) (0.022) (0.049)[3,300] [3,300] [3,300] [1,823] [770] [174]
Mobility indicatorsincluded
0.097*** 0.104*** 0.016 −0.043** −0.004 0.038(0.015) (0.016) (0.012) (0.015) (0.023) (0.052)[3,348] [3,348] [3,348] [1,843] [777] [176]
Structural changesonly
0.167*** 0.189*** 0.010 −0.010 0.008 0.098(0.027) (0.027) (0.019) (0.023) (0.034) (0.093)[1,134] [1,134] [1,134] [727] [331] [70]
Keep exit student intreatment
0.091*** 0.102*** −0.003 −0.030*** −0.002 0.051(0.015) (0.016) (0.011) (0.014) (0.021) (0.041)[3,348] [3,348] [3,348] [2,195] [1,056] [266]
No Indianapolis urban 0.093*** 0.112*** −0.018 −0.060*** −0.003 0.059(0.018) (0.019) (0.013) (0.017) (0.026) (0.054)[2,455] [2,455] [2,455] [1,376] [606] [144]
Notes: *P � 0.050; **P � 0.010; ***P � 0.001. ISTEP+ ELA achievement measured in SD units, relative tothe Indiana state mean and SD within each grade and year. Number of voucher students contributing toeach yearly estimate in brackets. Robust standard errors clustered by baseline cohort (year-grade-school)are in parentheses.Source: Authors’ calculations.
baseline in years one, three, and four, is why we described our overall findings inELA as not statistically meaningful.
In the second robustness check involving an alternative specification of priorachievement, we included polynomials of baseline and pre-baseline achievement.The polynomial for each includes a first-, second-, and third-order term. This flexiblespecification reflects a similar approach used by Dobbie and Fryer (2017). We didnot find any meaningful differences in the voucher effects when compared to ourpreferred model.
The third robustness check involved including baseline and pre-baseline achieve-ment scores (and their third-order polynomials) in the off subject (e.g., pretreatmentmath achievement for ELA models and vice versa) as additional controls. This deci-sion was influenced by the growing value-added modeling literature (for review, seeKoedel, Mihaly, & Rockoff, 2015). Again, we found no meaningful differences withour preferred model.
Moving away from alternative specifications of prior achievement, we includedtwo mobility indicators to distinguish students (voucher or public) who changedschools from the previous year in our next robustness check. The first indicateswhether a student made a structural move due to normal grade progression. Thesecond indicates whether a student made a nonstructural move (switching schools
Journal of Policy Analysis and Management DOI: 10.1002/pamPublished on behalf of the Association for Public Policy Analysis and Management

Impact of the Indiana Choice Scholarship Program
for any other reason we did not observe). Both variables indicate a switch only in theschool year immediately after the switch took place (t), even though the switch takesplace between years t and t−1. There is a negative association between mobility andstudent achievement (see Schwartz, Stiefel, & Cordes, 2017), so these indicatorsmay explain away part of the first-year voucher effect as all voucher students in ouranalysis made a transition to a private school in the first year. In math, we found afirst-year achievement loss of 0.022 SD less after controlling for mobility. Yet, theloss in later years remained roughly the same or larger in magnitude. We found nomeaningful differences in the ELA results.
In our next robustness check, we constrained our sample to only include voucherstudents making a structural move to a private school and their matched publicschool peers. Families with higher motivation or other resources may be morelikely to make nonstructural moves, which may correlate with higher achievementoutcomes for voucher students. Voucher students making structural moves haveeven higher baseline achievement in both subjects than their matched peers. Whilethe first-year achievement loss in math is slightly lower, the second-, third-, andfourth-year losses became increasingly larger compared to the overall voucher ef-fects. The lower achievement of voucher students initially making a structural movesuggests our hypothesis may be valid, though unsurprising with a program designedto encourage mobility. In ELA, we did not find any meaningful differences, exceptfor the second-year loss, which is not statistically significant for voucher studentsmaking structural moves to private schools.
In the next robustness check, we kept students who exit private schools or thesmall number of students who have stopped receiving a voucher yet remained inprivate schools as part of the treatment condition. Several unobserved reasons (time-varying confounding) may have influenced a student’s decision to switch back to apublic school or to stop receiving a voucher. This approach stems from the workby Robins, Hernan, and Brumback (2000) and Sobel (2012). Largely, we found nomeaningful differences compared to our preferred model. However, we note that thesecond- and third-year losses in math and second-year loss in ELA are approximately0.010 to 0.020 SD smaller than the preferred model, suggesting that exiting voucherstudents marginally improve their achievement after returning to a public school.
The final robustness check stems from our own prior work. We previously foundthat students attending Catholic and other private schools in Indianapolis, of whomat least half are voucher students, experienced annual achievement losses in math(Berends & Waddington, 2018). To ensure these students were not driving results,we removed all students in the Indianapolis urban area from the analysis. Weobserved similar findings in both subjects as our preferred model, suggesting thatthe voucher student loss in math achievement was statewide and even slightly largerin magnitude (by 0.010 to 0.020 SD) outside of Marion County.
Journal of Policy Analysis and Management DOI: 10.1002/pamPublished on behalf of the Association for Public Policy Analysis and Management