impact of the pollution of river burhi gandak on …
TRANSCRIPT
Rec. zoo!. Surv. India: 100 (Part 3-4) : 85-100, 2002
IMPACT OF THE POLLUTION OF RIVER BURHI GANDAK ON PLANKTON AND MAICOFAUNA AT MEHSI, NORTH BIHAR
CAUSED BY SUGAR MILLS AND MOTHER OF PEARL BUTTON INDUSTRIES
SHAMA BEGAM AND R. A. KHAN*
P. G. Department of Zoology, T. M Bhagalpur University, Bhagalpur-812 007
INTRODUCTION
River Burhi Gandak, constitutes an important freshwater resource of North Bihar passing
through several districts like Champaran, Muzaffarpur, Darbhanga and Begusarai and is a part of
the major riverine system of the region-the Kosi-Gandak Because of the availability of bivalve
shells in huge quantities in the river, several important mother of pearl button and lime cottage
industrial centres have developed alongside the river. Besides the belt has several sugar mills.
These industries discharge their untreated effluents and wastes directly into the river. With the
result, certain stretches of the river got polluted.
Although some reports are available on the pollution of main river Ganga and some other
tributaries like Daha in North Bihar, particularly by Sugar and distillery wastes (David and Ray,
1966, Sahay e/ al., 1994), practically no information is available on the pollution and its impact
on the biota in the tributaries of Gandak -Kosi river system. An earlier report (Datta Munshi and
Datta Munshi, 1991) on the ecology of the rivers of this system gives only a general idea of their
physiography With this in mind, the present studies were undertaken to assess the impact of
pollution on the diversity and density of plankton and molluscan fauna of this river near polluted
sites in Mehsi block of East Champaran district. Mehsi Township (Fig 1) is an important centre
for the mother of pearl button and lime industries. Besides, there are three sugar mills also located
in the area. These discharge their wastes into the river causing pollution of the river in the vicinity
of the township.
DESCRIPTION OF THE STUDY AREA
The impact of the pollution on the biota of the river was studied by fixing following stations/
sites as shown schematically in Fig. 1 .
• Zoological Survey of india. Kolka/a-700 020.

86 RECORDS OF THE ZOOLOGICAL SURVEY OF INDIA
STUDY SPOTS at
Burhi gandak
NORTH BIHAR
I EAST CHAMPARAN I SITE I (up stream)
BUTTON INDUSTORY EFF.
SUGAR FACTORY EFF.
SITE II
. . " ,. , , ~~' ., ~~ ...
SITE IV
' . . .. . " ,
" " " ---< ~ "'. ~~ --.
SITE V
-• -' .. . . . . . . ..
Fig. 1. Study spots at Burhi gandak, North Bihar.
... .
BEGAM & KHAN : Impact of the pollution of river Burhi Gandak on plankton ... Industries 87
Site I. above outfall. This site was fixed nearly 1 km above Mehsi Town where no industrial
effluents were discharged. This has been considered as standard unpolluted site.
Site II. Outfall. The station was situated near Mehsi Town ship where the solid and liquid
wastes are discharged into the river.
Site III. Approximately 500 m below the outfall. This site was situated nearly 500 m from
the Mehsi Town
Site IV. Approximately 1.5 km below the outfall.
Site V. Approximately 2 km below the outfall
MA TERIAL AND METHODS
Surface water samples for physico-chemical analysis were collected from atleast ~hree places
at each site. The analysis of temperature, pH, dissolved oxygen and hardness were done in the
field itself and samples for B.O.D., C.O.D., Silicate and Ca++ were brought to the laboratory.
Standard Methods (A.P.H.A., 1991) were followed for the analysis. Only those parameters which
showed significant impact are included here.
Phytoplankton samples were collected by filtering 1-2 lit of water through Whatman filter
paper No.4 and preserved in Lugol's solution. Zooplankton samples were collected with the help
of plankton net made of bolting nylon No. 20 (mesh size 0.075 mm). For relative composition and
qualitative studies samples were collected randomly from several places by throwing and towing
the net from the shore. The filtered zooplankton were preserved in 4% formalin. The quantitative
molluscan fauna for the determination of density were collected with the help of a wooden
quadrate net ( area 0.25 sqm, height of the frame 3"), attached with a bag of fine meshed mosquito
net cloth. For bottom fauna, the quadrate was placed on the bottom of littoral zone and all shells
live and dead alongwith the mud Is and upto the depth of 2" was collected. There after the quadrate
was pulled up slowly collecting all the macrophytes falling with the quadrate. For qualitative
studies, thorough search of the bottom of littoral zones and macrophytes were done and specimens
were collected. Dead shells were discarded and live ones preserved in 60/0 formalin.
Although studies were carried out for all the seasons, summer (March-June) monsoOTr (':July
October) and winter (November-February), the data collected during winter and summer are
anlysed and presented. Due to heavy rains and flooding of the river during monsoon months,
location of the stations were disturbed and sampling was also difficult. Further due to considerable
dilution the impact was also not visible.

88 RECORDS OF THE ZOOLOGICAL SURVEY OF INDIA
RESULTS
1. Physico-chemical properties of water
The physico-chemical condition around outfall at different sites during winter and summer are
shown in Table 1. There was a sudden alteration in almost all parameters studied except water
temperature at Site-II, (outfall) as compared to Site-I (above outfall). The conditions started
improving soon after outfall. The most important effect was on the pH, which dropped considerably
near the outfall in both seasons. During summer, the dissolved oxygen concentration dropped
from 7.2 mg/I at site-I to 2.4 mg/I at Site-2. Although recovery started immediately from site-III
onwards, its rate was comparatively slower. While the recovery in respect of B.O.D. was
comparatively faster, C.O.D. decreased gradually. The recovery of hardness was very slow and
even at Site-V, the values were much higher than those of Site-I. Silicate and Ca++ also
showed the initial increase that was followed by considerable recovery at sites-III and IV and
the values returned to normal at Site-V Almost similar trends were noticed during winter
season.
Table 1. Physico-chemical conditions of river water at different sites around outfall.
WINTER SUMMER
Paramters Site-I Site-II Site-III Site-IV Site-V Site-I Site-II Site-III Site-IV Site-V
II III IV V II III IV V
Water
Temperature °C 23.2 23.4 22.8 22.7 23.3 31.5 31.9 31.8 31.6 32
pH 5.8 5 5.5 5.7 5.9 6 5.2 5.8 5.9 6.1
Dissolved oxygen
mg/I 8.4 2.8 3.6 6.5 8.4 7.3 2.4 3.2 3.9 8.2
B. O. D. mg/I 10 105 63 49 25 328 446 413 392 327
C. O. D. mg/I 250 1102 593 301 228 1709 2430 2329 2190 1805
Total hardness
mg/I 102 239 231 209 117 104 328 309 283 178
Silicate (mg/I) 12 16.5 15.8 14.6 12.7 12.2 34.3 27 21.9 12.8
Ca++ mg/I 37.5 59.6 51.2 37.2 38 17.5 24 22.5 21.6 18

BEGAM & KHAN: Impact of the pollution of river Burhi Gandak on plankton ... Industries 89
2. Plankton
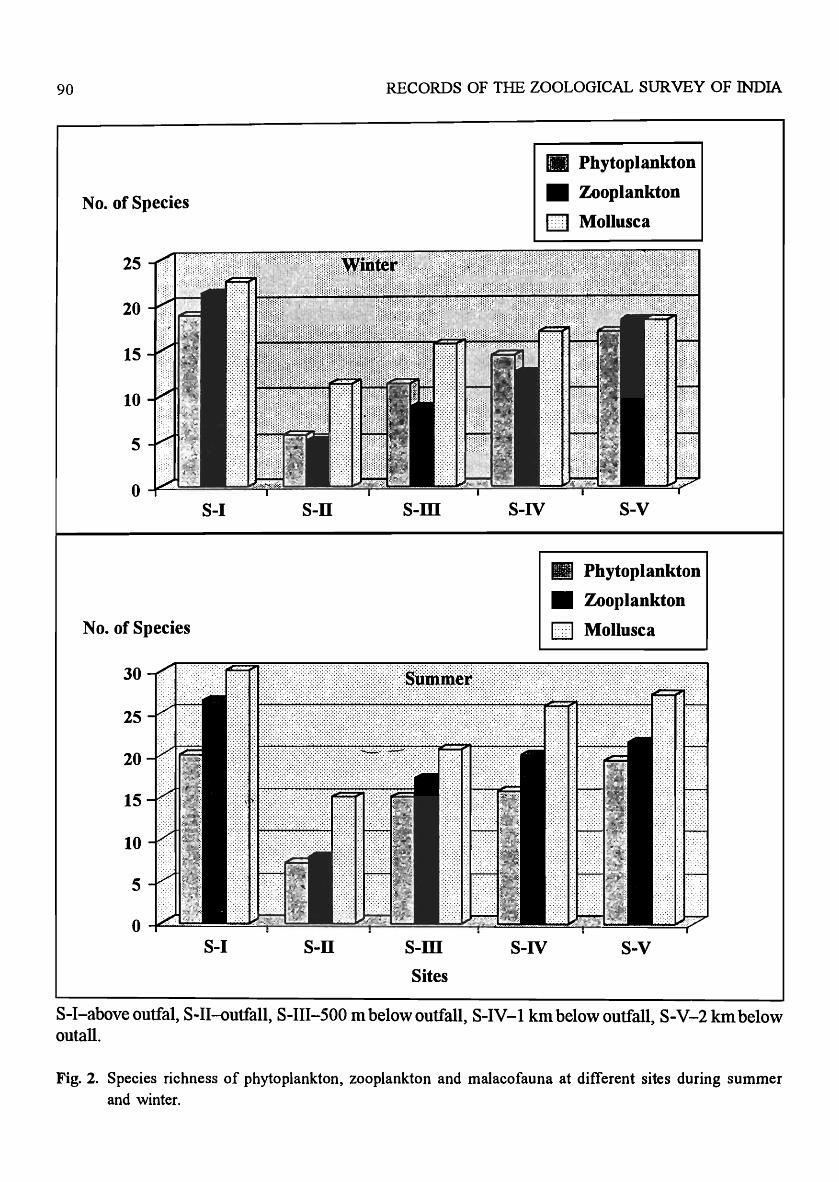
Impact on species richness and abundance of both phyto and zooplankton was severe near the
outfall. The number of phytoplankton taxa during summer dropped from 20 to 8 between
Sites-I and II (Table 2, Fig. 2) revealing a reduction of 60% (Table 3). Similarly number of species
of zooplankton also decreased from 26 above the outfall to 9 at the outfall, exhibiting a reduction
of 65% (Fig. 2). However recovery in both cases was rapid as station 3 harboured 15 and 17
species ofphyto and zooplankton showing an improvement of75.0 and 65.33 percent respectively.
The decrease and increase in the numerical density of both phytoplankton and zooplankton
at different sites was almost similar to the species richness (Table 2, Fig 3) However, the rate of
reduction between Sites-I and II was of slightly lesser magnitude than the species richness.
In case of phytoplankton the reduction between Sites I and II was about 52% but the
recovery between sites II and III was rapid (87.12%). Similarly the reduction in zooplankton
density between Sites-I and II was of the order of 63.550/0 and recovery between Sites I and III
was 77.02% (Table 3). The conditions returned to almost normal at site-V, both for phytoplankton
and zooplankton. Not much variation in the pattern was observed during winter season.
Table 2. Species richness and density of phytoplankton, zooplankton and malacofauna at different sites.
WINTER SUMMER
Site-I Site-II Site-III Site-IV Site-V Site-I Site-II Site-III Site-IV Site-V
above outfall 500m Ikm 2km above outfall 500 m Ikm 2km
outfall below below below outfall below below below
outfall outfall outfall outfall outfall outfall
No. of Phyto-
plankton species 19 6 12 14 17 20 8 15 16 19
Density of Phyto-
plankton (noll) 3648 1382 2402 2554 3179 4015 1925 3489 5667 3894
No. of Zooplan-
kton species 21 5 8 12 19 26 9 17 20 22
Density of Zoo-
plankton (noll) 229 66 189 207 219 557 203 429 468 499
No. of Molluscan
species 22 12 16 17 19 30 15 21 26 27
Density of Mollu-
sca (no/sqm) 538 177 485 487 491 616 413 529 541 558
90
No. of Species
25
20
15
10
5
o -F----==
S-I
No. of Species
30
25
20
15
10
5
O~-=
S-I
S-ll
S-ll
RECORDS OF THE ZOOLOGICAL SURVEY OF INDIA
S-ill
S-ill
Sites
S-IV
III Phytoplankton
III Zooplankton
D Mollusca
S-v
l1li Phytoplankton
II Zooplankton
o Mollusca
S-IV S-v
S-I-above outfal, S-II-outfall, S-III-500 m below outfall, S-IV-I km below outfall, S-V-2 km below outall.
Fig. 2. Species richness of phytoplankton, zooplankton and malacofauna at different sites during summer and winter.

BEGAM & KHAN: Impact of the pollution of river Burhi Gandak on plankton ... Industries 91
Table 3. Percentage of reduction (between sites I and II) and recovery (between sites I and III) of biotic components around outfall.
WINTER SUMMER
Site-I Site-II Percent Site-IV Percent Site-I Site-II Percent Site-IV Percent
PARAMETGERS above outfall reduc- 500m reco- above outfall reduc- 500m reco-
outfall tion below very outfall tion below very
outfall outfall
Species Richness
Phytoplankton 19 6 68.42 12 63.15 20 8 60 15 75
Zooplankton 21 5 76.2 8 57.14 26 9 65.3 17 65.3
Gastropoda 10 7 30 9 90 15 9 40 10 66.66
Bivalvia 12 5 58.33 7 58.33 15 6 60 11 73.33
Total Mollusca 22 12 44.5 16 72.72 30 15 50 21 73.33
Density
Phytoplankton 3648 1382 62.1 2404 63.15 4015 1925 52.05 3489 87.12
Zooplankton 229 66 71.12 189 82.53 557 203 63.55 429 77.02
Gastropoda 250 120 52 265 106 280 201 28.21 255 91.07
Bivalvia 288 57 80.2 220 76.39 336 112 66.66 274 81.55
Total Mollusca 538 177 67.1 485 90.14 661 313 52.64 529 80.03
3. Mollusca
Species richness : Detailed studies were carried on the impact of pollution on the diversity,
density and composition of molluscan fauna. A total of 31 species was recorded from the unpolluted
Site-I, which included 16 species of gastropods and 15 species of bivalves (Table 4). The number
reduced drastically at site-II, near the outfall where only half of the number of species was present
as compared to unpolluted Site-I during summer. However, 21 species were recorded from site
III and 28 from site-IV showing quick recovery (Table 2, Fig 2). This was also evident from the
analysis of the reduction and recovery rates (Table 3). The reduction in species richness between
Sites I and II was 52%. The recovery was very quick as nearly 80% of the species reappeared at
Site-3. During winter also only 12 species were at site-II as compared to 22 at site-I exhibiting
a reduction of 44.5%. The immediate recovery (72.72%) was significant.

92 RECORDS OF THE ZOOLOGICAL SURVEY OF INDIA
Table 4. Species richness and density of gastropods and bivalves at different sites.
WINTER SUMMER
Site-I Site-II Site-III Site-IV Site-V Site-I Site-II Site-III Site-IV Site-V
above outfall 500 m Ikrn 2krn above outfall 500m Ikm 2km
outfall below below below outfall below below below
outfaH outfall outfall outfall outfall outfall
No of Gastro-
pod species 10 7 9 9 10 15 9 II 14 14
Number of
bivalve species 12 5 7 8 9 15 6 10 12 13
Density of gastro-
pods (no/sqm) 250 120 265 250 230 280 230 255 260 235
Density of
bivalves (no/sqrn) 288 57 220 237 261 336 183 274 281 323
Abundance : The total molluscan density at site-I during summer was 616/sqm, which was
reduced to 413/sqm at the outfall site-II. Like species diversity the recovery in case of density was
also quick and the mean density at site-III was 529/sqm. (Table 2, Fig. 3). This resulted in the
reduction of 52.64% between sites-I and II and recovery of 80% at site-III (Table 3). During
winter the reduction between sites II and I and recovery between Sites II and III were 67.10 and
90. ]4% respectively showing comparatively lesser impact during the season.
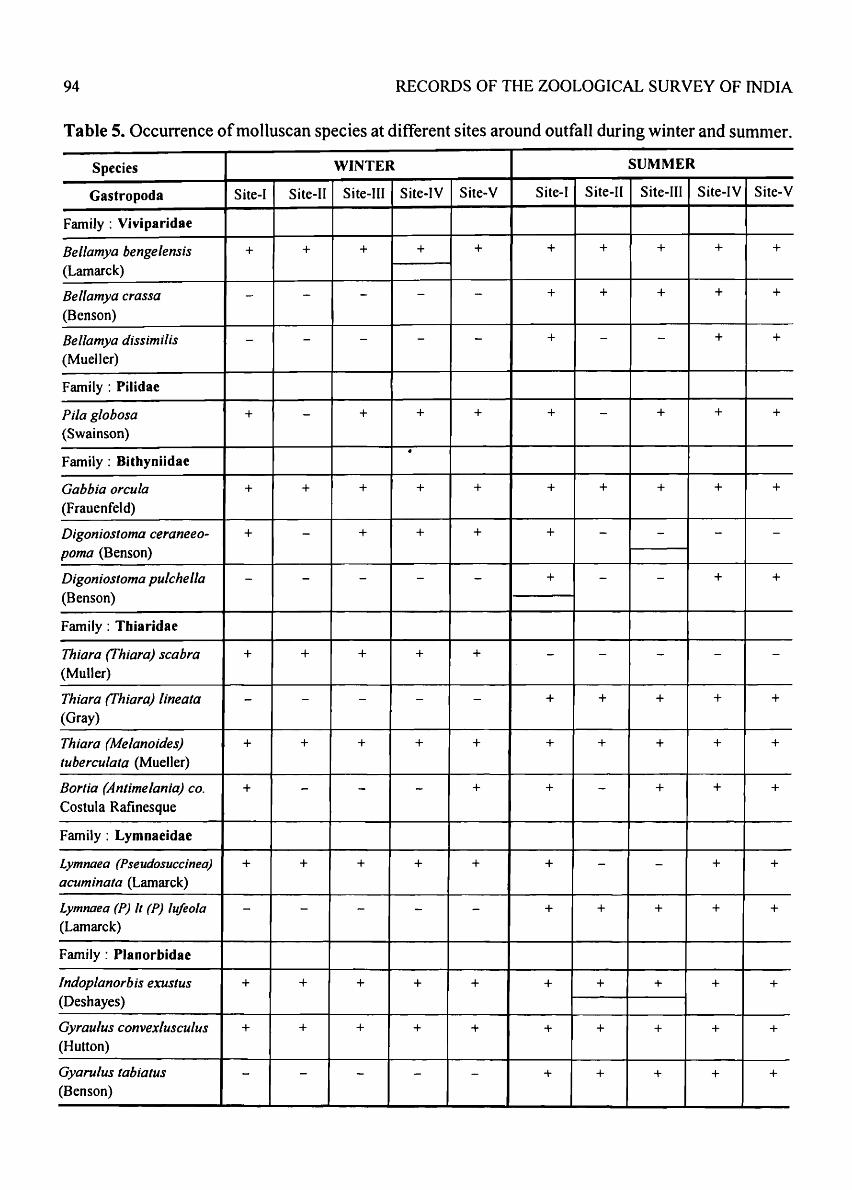
Composition: Table 5 and Fig. 3 show the relative impact of pollution on the species richness
and density of the two major molluscan groups viz. gastropods and bivalves. It is abundantly clear
that bivalves were much more affected than gastropods. During summer at unpolluted site-I, there
were 30 species of mollusca, 15 of gastropods and IS of bivalve. At the outfall, Site-II, only 6
species of bivalves were present as compared to 9 of gastropods. This resulted in a decrease of
only 28.21 % in case of gastropods between sites-I and II but the reduction in case of bivalves was
of the magnitude of 66.66%. The recovery between sites-I and III was also slower in case of
bivalves (Table 3) than gastropods.
DISCUSSION
From the results, it is quite clea .... · that the river Burhi Gandak near Mehsi was polluted as
evident from generally altered conditions of both physicochemical and biological characteristics
of the water around the outfall region. The lower value of pH near the outfall was probably due

BEGAM & KHAN : Impact of the pollution of river Burhi Gandak on plankton ... Industries
Density
600
500
400
300
200
100
0
S-I
Density
700
600
500
400
300
200
100
0 S-I
S-II
S-II
S-ID
S-ID
Sites
II Phytoplankton Nollxll0
II Zooplankton Noll
D Mollusca No/sqm
S-IV S-v
lID Phytoplankton N ollxll 0
II Zooplankton Noll
D Mollusca No/sqm
S-IV S-v
93
S-I-above outfal, S-II-outfall, S-III-500 TIl below outfall, S-IV-l km below outfall, S-V-2 km below outall.
Fig. 3. Density of phytoplankton, zooplankton and malacofauna at different sites during summer and monsoon.
94 RECORDS OF THE ZOOLOGICAL SURVEY OF INDIA
Table 5. Occurrence of molluscan species at different sites around outfall during winter and summer.
Species WINTER SUMMER
Gastropoda Site-I Site-II Site-III Site-IV Site-V Site-I Site-II Site-III Site-IV Site-V
Family: Viviparidae
Bel/amya benge lens is + + + + + + + + + +
(Lamarck)
Bellamya crassa - - - - - + + + + +
(Benson)
Bellamya dissimilis - - - - - + - - + + (Mueller)
Family: Pilidae
Pi/a glohosa + - + + + + - + + + (Swainson) . Family : Bithyniidae
Gahhia orcula + + + + + + + + + + (Frauenfeld)
Digoniostoma ceraneeo- + - + + + + - - - -poma (Benson)
Digoniostoma pulchella - - - - - + - - + + (Benson)
Family: Thiaridae
Thiara (fhiara) scahra + + + + + - - - - -(Muller)
Thiara (fhiara) lineata - - - - - + + + + + (Gray)
Thiara (Melanoides) + + + + + + + + + + luberculata (Mueller)
Bortia (Anlimelania) co. + - - - + + - + + + Costula Rafinesque
Family: Lymnaeidae
Lymnaea (Pseudosuccinea) + + + + + + - - + + acuminata (Lamarck)
Lymnaea (P) II (P) lufeola - - - - - + + + + + (Lamarck)
Family: Planorbidae
Indoplanorbis exuslus + + + + + + + + + + (Deshayes)
Gyraulus convexlusculus + + + + + + + + + + (Hutton)
Gyarulus labialus - - - - - + + + + + (Benson)
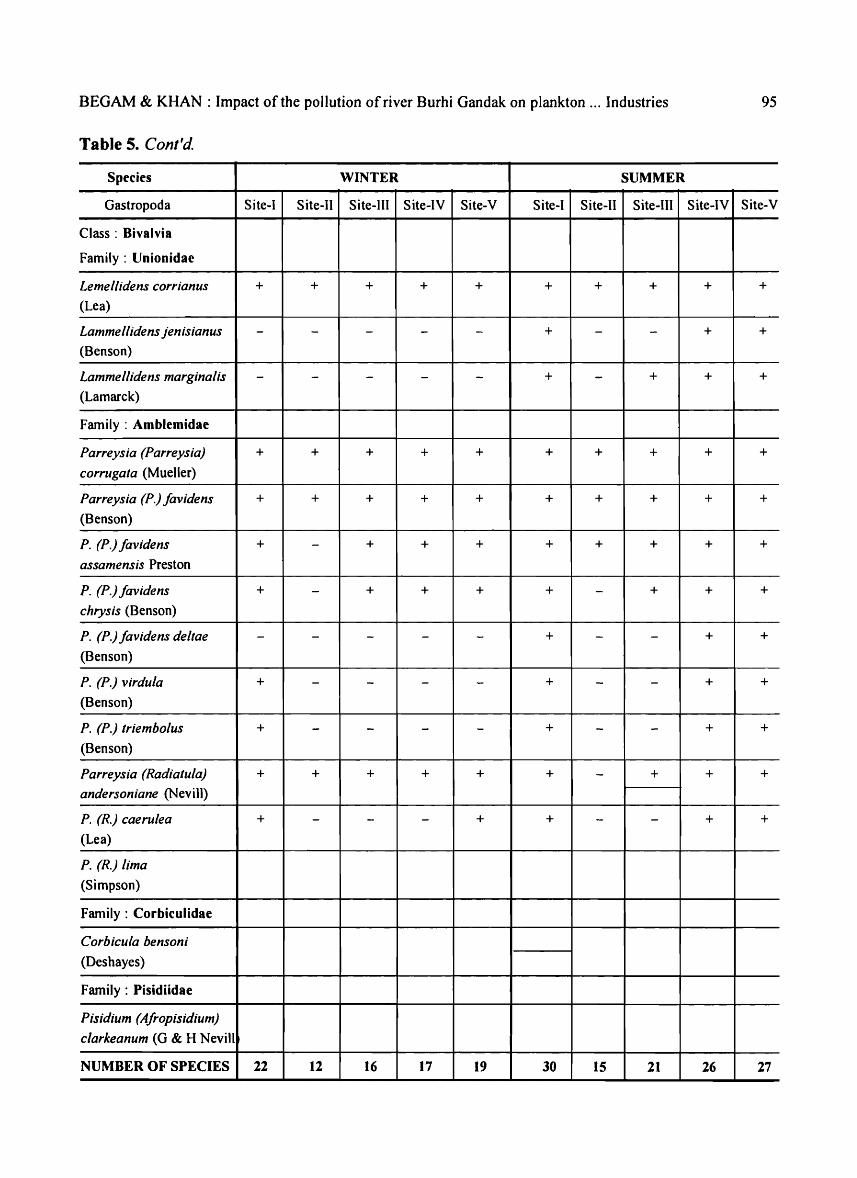
BEGAM & KHAN : Impact of the pollution of river Burhi Gandak on plankton ... Industries 95
Table 5. Cont'd.
Species WINTER SUMMER
Gastropoda Site-I Site-II Site-III Site-IV Site-V Site-I Site-II Site-III Site-IV Site-V
Class : Bivalvia
Family: Unionidae
Lemellidens corrianus + + + + + + + + + +
(Lea)
Lammellidens jenisianus - - - - - + - - + + (Benson)
Lammellidens marginalis - - - - - + - + + + (Lamarck)
Family: Amblemidae
Parreysia (Parreysia) + + + + + + + + + + corrugata (Mueller)
Parreysia (P.) favidens + + + + + + + + + + (Benson)
P. (P.) favidens + - + + + + + + + + assamensis Preston
P. (P.) favidens + - + + + + - + + + chrysis (Benson)
P. (P.) favidens de/tae - - - - - + - - + + (Benson)
P. (P.) virdula + - - - - + - - + + (Benson)
P. (P.) triembolus + - - - - + - - + + (Benson)
Parreysia (Radiatula) + + + + + + - + + + andersoniane (Nevill)
P. (R.) caerulea + - - - + + - - + + (Lea)
P. (R.) lima
(Simpson)
Family: Corbiculidae
Corbicula bensoni
(Deshayes)
Family : Pisidiidae
Pisidium (Afropisidium)
c1arkeanum (G & H Nevill
NUMBER OF SPECIES 22 12 16 17 19 30 15 21 26 27

96
No. of s)lecies
S-I S-II
No. of species
RECORDS OF THE ZOOLOGICAL SURVEY OF INDIA
Winter
S-ill S-IV
Summer
III Gastropods
• Bivalves
S-v
III Gastropods
II Bivalves
16 -1~lillllrnm~m 14
12
10
8
6
4
2
o S-I S-II S-ill S-IV S-v
Sites
S-I-above outfal, S-II-outfall, S-III-500 m below outfall, S-IV-l knl below outfall, S-V-2 km below outall.
Fig. 4. Relative species richness of gastropods and bivalves at different sites during summer and winter.

BEGAM & KHAN : Impact of the pollution of river Burhi Gandak on plankton ... Industries
Density (no/sqm)
Winter
III Gastropods
II Bivalves
300 ......r,;",al,::;i,>~iIII~IIII.11I1I1I1I 250
200
150
100
50
o
Density (no/sqm)
350
300
250
200
150
100
50
o
S-I
S-I
S-II S-ID
Summer
S-ll S-ID
Sites
S-IV
S-IV
S-v
III Gastropods
II Bivalves
S-v
97
S-I-above outfal, S-II-outfall, S-III-500 m below outfall, S-IV-I 1m1 below outfall, S-V-2 km below outall.
Fig. 5. Density (no/sqrn) of gastrodods and bivalves at different sites summer and winter.

98 RECORDS OF THE ZOOLOGICAL SURVEY OF INDIA
to acidic nature of the organic wastes. The organic nature of some of the pollutants was also
visible from increased load of B.O.D and rapid decrease in dissolved oxygen contents at the
outfall. At the same time sudden increase in C.O.D, hardness, silicates and Ca++ at the outfall
region also indicate the inorganic nature of some pollutants. Although no detailed studies on the
nature of effluents from different discharge sources were made, it can be assumed that the effluents
discharged by sugar mills were of highly organic nature. The increase in hardness, silicate and
Ca++ was probably due to the mother of pearl button and lime manufacturing activities. The
analysis further revealed that the impact of pollution was restricted only to a short distance near
the outfall and conditions started improving rapidly from Site-III onwards. The impact of pollution
on physico-chemical nature of water was almost invisible at site-V, nearly 2 km downstream.
Even during summer months when dilution ratio was low due to comparatively reduced flow of
water, the impact on the physicochemical quality of the water was not severe at site-V This
revealed a limited nature of the physico-chemical impact of pollution on the river. It is well known
that the impact of pollution on running waters is mostly governed by the nature and amount of
pollutants added and inflow of freshwater from upstream. At Mehsi, the flow of the river was
moderate which brought sufficient amount of water needed for dilution. Further the nature of
wastewater generated by neither the sugar mills nor by button industries were toxic and therefore
their impact was also not severe. Generally in case of organic pollution created by food! beverage
industries the recovery is rapid because of quick decomposition of organic matter. Similarly
coarse sized suspended inorganic particles also settle quickly.
As compared to the physico-chemical nature of water, the impact of pollution was much severe
on the biota. Although conditions improved significantly at Site V, neither the species richness nor
numerical abundance of different groups, excepting the sudden abundance of phytoplankton at
Site-3 during summer returned to their original numbers recorded from unpolluted upstream Site
I, showing that the recovery was still underway. The sudden increase of the phytoplankton at Site
IV was probably due to increased availability of nutrients liberated by the decomposition of huge
quantity of organic matter as observed by Khan (1995) in case of the discharge from a paper and
pulp mill in the Hugly river. The slower recovery of biota as compared to physico-chemical nature
of water pointed out towards the long lasting impact of pollution on living material. This confirms
the viewpoints expressed by a number of workers (Cook, 1976) that the physico-chemical parameters
of water indicate the impact of pollution as long as pollutants remain in the particular area. Once
flushed, these parameters do not indicate the deterioration of the quality in the past. Contrary to
this, the biota once affected, take a long time to recover and return to their normal biological
activities.
Among the three groups of biota studied, phytoplankton, zooplankton and malacofauna, only
the last groups was either sessile or very slow moving and could not escape from the impact of
changing condition of environment quickly by moving elsewhere. Due to this reason, benthic/

BEGAM & KHAN: Impact of the pollution of river Burhi Gandak on plankton ... Industries 99
macrophytes associated sessile or slow moving animals have been considered as most reliable
indicator of the impact of pollution. (Wilhms, 1970, Chandler, 1970, Cook, 1976).
Among the two molluscan groups, the bivalves appeared to be considerably more sensitive to
pollution than gastropods. The reduction in both species number and density of bivalves at outfall
was much higher than gastropods. While several species of gastropods like Bellamya bengalensis,
Gabbia orcula, Thiara tuberculata, lndoplanorbis exxustus and Gyraulus convexiusculus were
remained almost unaffected near the outfall, none of the bivalve species were comfortable at this
site and a few species which occurred, had their densities greatly reduced.
SUMMARY
The present studies were undertaken to assess the impact of pollution on the physico-chemical
nature of water and diversity and density of phytoplankton, zooplankton and molluscan fauna of
river Burhi Gandak near polluted sites in Mehsi block of East Champaran district. Mehsi Township
(Fig 1) is an important centre for the mother of pearl button and lime industries. Besides, there
are three sugar mills also located in the area which discharge their wastes into the river causing
pollution in the vicinity of the outfall. The impact of the pollution was studied by fixing 5 sites
(sites I-V), starting from nearly one km above the outfall to nearly 2 km below the outfall.
There was a sudden alteration in almost all the physico-chemical parameters studied near the
outfall but conditions started improving soon after and the recovery was nearly complete within
a short distance of 2 km. Impact on species richness and abundance of both phytoplankton and
zooplankton was severe near the outfall. Species richness near the outfall (as compared to site
above the outfall) decreased by 60% and 65% in case of phytoplankton and zooplankton respectively.
However recovery in both cases was rapid as the site-III (500 m below the outfall) showed
improvement of 75.0 % and 65.33 % for phyto and zooplankton respectively. The pattern of
reduction and recovery for their densities was almost similar to that of species richness.
Although similar pattern of impact was noticed on the diversity and density of molluscan
fauna, the recovery was comparatively slower and neither species richness nor density recovered
completely at site V, which indicated the greater impact of pollution on these organisms. Bivalves
were found to be more affected than gastropods.
ACKNOWLEDGEMENT
The authors are thankful to the Head department of Zoology, University of Bhagalpur and the
Director Zoological Survey of India for kindly providing necessary facilities. The senior author
is also thankful to Prof. J. S. Datta Munshi for valuable guidance and suggestions.

]00 RECORDS OF THE ZOOLOGICAL SURVEY OF INDIA
REFERENCES
A. P. H. A. 1991. Standard Method/or the Examination o/Water and Wastewaters. 15th Edition
American Public Health Association, Washington D.C.
Chandler, A. 1970. A biological approach to water quality management. Water quality management
Wat. Pollut. Control, 4 : 414-422.
Cook, S. E. K. 1976. Quest for an index of community structure sensitive to water pollution.
Environ. Pollut. 11 : 269-281.
Datta Munshi, J. S. and J. Datta Munshi 1991. Physiography of the Kosi river basin and formation
of wetlands in North Bihar. A unique freshwater system. J. Frewshwaster Bioi., 5 : 203-
208.
David, A. P. Roy 1966. Studies on the pollution of river Daha (North Bihar) by Sugar and
distillery wastes. Indian J. Environ. Hlth, 8 : 6-35.
Khan, R. A. 1995. The pollution problem of Hugly estuarine system. In Hugly Matla Estuary,
West Bengal. Zool. Surv. India. Estuarine Ecosystem Series, Part 2 : 497-542.
Sahay. S.S., Sanjib Kumar and Sheo Kumar 1994. Effect of distillery effluent on aboitic and biotic
Factors. J. Freshwater Bioi. 6 : 317321.
Wilhms, 1. L. 1972. Graphic and Mathematical analysis of biotic communities in polluted streams
Rev. Ent., 17 : 223-252.