impact of tod
TRANSCRIPT


Impact of TOD and Smart Growth Incentives on Development in Phoenix
United States Environmental Protection Agency

MEMORANDUM
Date: March 17, 2009
To: Kevin Nelson, EPA Teresa Brice, LISC Susan Culp, Sonoran Institute
From: Strategic Economics
Subject: Impact of TOD and Smart Growth Incentives on Development in Phoenix
Introduction
With the recent opening of the Metro light rail system and plans for future expansion, it is important to consider how this new transit impacts development opportunities and property values near new transit stations. This memorandum is designed to offers insight about the feasibility of transit-oriented development (TOD), as well as the potential positive impact of tools that can be used to support TOD in the metropolitan area. The results are intended to assist policymakers, property owners and developers as they consider ways to promote TOD in neighborhoods along the light rail within the context of the legal restrictions imposed by Proposition 207. In certain cases, simply rezoning properties for uses that are more transit supportive could diminish property values. Thus, communities in the Phoenix area will need to draw upon a wide array of tools that encourage TOD and positively impact both property values and development potential.
Following this introduction, this memo includes:
• A discussion of the different scales of TOD and the residential building types that might be developed near new and planned light rail;
• A discussion of the possible benefits of a variety of policy tools to promote TOD that are being considered in the Phoenix metropolitan area that may help to enhance property values and development potential.
• The results of a financial analysis that looks specifically at how transit and TOD-supportive policies and plans can improve the feasibility of a range of building types.
The financial analysis focuses on the potential for new development along the 19th Avenue segment of the northwest extension or in the Apache Boulevard/Main Street corridor in Phoenix, however the findings are applicable in a general way to other neighborhoods near transit. The financial feasibility analysis builds on detailed work conducted by Economic and Planning Systems, including an analysis of development feasibility in station areas in Mesa and Tempe (May 2007), and an analysis of development feasibility at stations along the future Northwest LRT Extension (March 2008).
2 9 9 1 S H A T T U C K A V E N U E # 2 0 3 | B E R K E L E Y , C A L I F O R N I A 9 4 7 0 5 | P : 5 1 0 . 6 4 7 . 5 2 9 1 | F : 5 1 0 . 6 4 7 . 5 2 9 5 | S T R A T E G I C E C O N O M I C S . C O M

Scales of Transit-Oriented Development (TOD)
Transit-oriented development (TOD) is typically defined as higher-density development within walking distance of a transit station that contains a mix of uses such as housing, jobs, shops, restaurants and entertainment. While the term is often used to describe individual new development projects, it can also refer more broadly to a mix of uses in a station area, usually defined as the area within a half mile of a transit station (within an easy walking distance). The goals of TOD are to:
• Increase “location efficiency” so people have the option to walk, bike and take transit rather than using an auto;
• Boost transit ridership and minimize traffic;
• Provide a rich mix of housing, shopping and transportation choices;
• Generate revenue for the public and private sectors and provide value for both new and existing residents; and
• Create a sense of place
TOD is frequently associated with high-density mixed-use development; however this kind of project is unlikely to occur at every transit station along a transit corridor. Successful TOD exists at a variety of scales, ranging from relatively low-density residential neighborhoods that offer access to jobs via transit to higher-density downtowns with a mix of residential, employment, retail and entertainment uses. Figure 1 illustrates this range of TOD places, and shows the relationship between residential density, regional connectivity and transit frequency.
FIGURE 1: A TOD TYPOLOGY
TOD Type Land Use Mix Typical Housing Density Regional Connectivity Frequencies
Urban Downtown
Urban Neighborhood
Suburban Neighborhood
Suburban Center
Neighborhood Transit Zone
Office Center
Urban Entertainment
Multifamily Housing
Retail
Residential Retail Class B Commercial
Primary Office Center
Urban Entertainment
Multifamily Housing
Retail
Residential
Neighborhood Retail
Local Office
Residential
Neighborhood Retail
> 60 units per acre
> 7 units per acre
>12 units per acre
> 20 units per acre
> 50 units per acre
High
Hub of Radial System
Medium Access to downtown, subregional circulation
Low
Access to a Center
High Access to downtown Subregional hub
Medium Access to suburban centers
25‐30 minutes
Demand responsive
< 10 minutes
20 minutes peak 30 minutes off‐peak
10 minutes peak 20 minutes off‐peak
10 minutes peak 10‐15 minutes off‐peak
Source: Center for Transit Oriented Development.
-2

The Phoenix metro area is already experiencing new development that suggests a shift to more transit-supportive neighborhoods. A significant amount of new residential development has occurred in areas around the light rail line, much in advance of it. New luxury apartment and condominium projects in the downtown range from 3 to 4 story mixed-use buildings to high rise projects. The area near Arizona State University has also been the focus for new housing, including student apartments and urban loft style condominiums. While the real estate market is currently suffering, it is reasonable to expect that this type of development will continue once the market recovers.
The financial analysis focuses on potential development in the 19th Avenue and Apache Boulevard/Main Street corridors, where current development patterns do not fit easily into a single category of transit-oriented places, and where little new residential development has occurred recently. Most of the existing residential development in these neighborhoods is relatively low-density, and closer to the kind of development described in the categories “neighborhood transit zone” or “suburban neighborhood”. However, the frequency of transit service and direct access to regional centers suggests that parts of these neighborhoods could transform over time to include the kind of moderate-density development that is typically found in the “urban neighborhood” category. This category consists of neighborhoods that are well-connected to regional centers for entertainment, shopping and employment. Typical residential building types range from townhomes to five or six story residential or mixed-use buildings.
Residential Building Types and Development Feasibility
Based on the typology above, it seems likely that parts of the two corridors are likely to experience some increase in density, as transit makes the area a more appealing place for residential development. Most of the recent residential development outside of downtown Phoenix and Central Tempe is relatively low density, consisting of single family homes, townhomes and low-rise multifamily development. These building types have relatively low construction costs because they can be built using Type V or Type III (wood frame) construction. Wood frame construction is generally possible up to five stories, above which it is necessary to move to concrete or steel frame construction. These building types are generally more expensive to construct, and are less common outside of high-value urban centers.
Another factor that has a major impact on building costs is parking. In many lower-density residential projects, parking can be provided in carports or in a surface lot, which is relatively inexpensive for a developer. For buildings that are four or more stories, it is usually necessary to provide a parking structure. This can consist of either a podium (an above-grade or sub-grade garage beneath the residential units), as a separate structure, or as an internal garaged “wrapped” with residential and retail development. Because the cost to build structured parking spaces can be very high (usually at least $20,000 per space), it can have a major impact on project feasibility. As a result, residential or mixed-use projects with structured parking must be able to achieve considerably higher price points on a per square foot basis than lower density projects. On the flip side, however, these larger development projects also have the potential to generate much higher project revenues, due to the increased number of units.
The financial analysis later in this memo focuses on a range of building types that are possible using wood frame construction and a variety of parking options, ranging from surface or carport parking to parking structures. These building types are illustrated in Figure 2 on the following page, and described below.
Townhome with surface parking: these two-story buildings with surface or carport parking typically have an average density of 20 units per acre.
Townhome with tuck-under garage: individual townhomes incorporate parking in “tuck-under” garages” at the surface level. Because parking is incorporated within units, this type of project can achieve higher densities than one with surface parking (about 30 units per acre).
-3

Building type Townhome Townhome
Multifamily
2‐3 stories
Multifamily
2‐3 stories
Multifamily
4‐5 stories
Surface parking
Tuck‐under/
garage
Surface/
carport
Garage
Podium/
garage
20 30 35 45 75
Wood frame
Urban block/
"Texas donut"
Wrapped
garage
90
Wood frame
Example
Parking
Approx. density/acre
Wood frame Wood frame Wood frame Wood frame
Wood frame
over concrete
podium
Minimum lot size 0.4 acres 0.25 acres 1 acre 0.7 acres 0.4 acres
9 high rise life safety
8
7 wood frame construction
6
5
4
3
2
1
Wood frame,
concrete
structure
3 acres
building
stories
Construction type
FIGURE 2
BUILDING TYPE MATRIX
Source: Strategic Economics, Community Design + Architecture.

Multifamily, 2-3 stories with surface parking: these multi-unit buildings typically consist of flats, sometimes in multiple buildings oriented to a courtyard. Parking is provided in surface lots or in carports. Multifamily, 2-3 stories with garage: this building type is the same as above, but can achieve higher densities due to a shared parking garage.
Multifamily, 4 to 5 stories over a podium: this building type consists of wood-frame construction over a concrete garage. This type of parking is usually more expensive than a stand-alone parking structure.
Urban block with wrapped garage: known in some regions as the “Texas donut”, this consists of a building or group of buildings that wrap around a shared parking garage. This building type requires the largest minimum lot size, about 1 acre. Because of the larger size and stand-alone parking garage, this kind of development is less costly on a per-square foot basis than a multifamily building with podium parking.
Impact of Transit and TOD-Supportive Policies on Development Feasibility
Transit and TOD-supportive land use policies can influence project feasibility in two main ways: by increasing achievable rents or sales prices and by reducing development costs. These impacts are discussed below.
The “Transit Premium”
Studies show that demographic and cultural changes in the US increasingly favor more compact development with convenient access to transit and urban amenities.1 Americans are increasingly prioritizing the advantages provided by neighborhoods near transit, including economic savings to households, reduced carbon emissions, healthier lifestyles, fewer traffic accidents, and reduced suburban sprawl. This trend is reinforced by a demographic shift toward smaller households, including a growing number of “empty nesters”, singles and non-family households who are more likely to value living in a walkable urban neighborhood. Demographic and cultural changes are resulting in a growing interest in cities and urban lifestyles, which means that there is increased demand for the kind of neighborhoods that are most likely to be served by transit. These trends are only reinforced by recent spikes in oil and gas prices.
New development can be designed to maximize the transit premium that can be achieved at any particular location because proximity to transit is an amenity that people are willing to pay for in the form of higher sale prices or rents. There is no standard premium that can be expected for housing near transit, because achievable sales prices and rents are influenced by a wide variety of factors. However, it is clear that development in areas with frequent connections to multiple centers for employment and entertainment achieve higher premiums compared to neighborhoods with less frequent service or reduced accessibility to desirable destinations.
CTOD recently conducted a survey of previous studies on this topic, summarized in Table 1. The findings of these studies indicates that for single family residential, the property value premium has ranged from two percent in San Diego (1992) to 32 percent in St. Louis (2004). For condominiums, the premium ranged from two percent to 18 percent in San Diego (2001), while for rental apartments the range was zero to four percent in San Diego (2001) to 45 percent in Santa Clara County (2002).
1 See, for example, Hidden in Plain Sight: Capturing the Demand for Housing Near Transit, Center for Transit-Oriented Development, 2004.
-5

It should be noted that many of these studies are dated, and there is reason to believe that the desirability of properties near transit is likely increasing, given changing demographics, rising gas prices, and renewed interest in urban lifestyles.
TABLE 1: SUMMARY OF FINDINGS FROM VALUE PREMIUM STUDIES
Land Use Range of Property Value Premium
Single Family Residential
Condominium
Apartment
Office
Retail
+2% to +32% (San Diego Trolley, 1992) (St. Louis MetroLink Light Rail, 2004)
+2% to +18% (San Diego Trolley, 2001)
+0% to +45% (San Diego Trolley, 2001) (VTA Light Rail, 2004)
+9% to +120% (Washington Metrorail, 1981) (VTA Light Rail, 2004)
+1% to +167% (BART, 1978) (San Diego Trolley, 2004)
Source: Capturing the Value of Transit, Center for Transit Oriented Development, 2008.
TOD-Supportive Policies
Figure 3 shows a range of TOD-supportive policy tools that are being contemplated in the Phoenix metropolitan area, and ways that they might contribute to improved development feasibility in the form of higher revenues or reduced costs.2 These tools are described in detail in a separate document, Strategic Package of Tools to Promote Transit Oriented Development in Metropolitan Phoenix. The matrix shows that there are several ways that TOD-supportive policies have the potential to enhance the feasibility of development, some in both direct and indirect ways. The policies are discussed below according to the three main categories used in the Strategic Package of Tools document: planning and visioning tools, implementation tools, and ongoing programs.
Planning and Visioning Tools
Planning efforts and land use guidelines provide a vision for future development that can provide developers some certainty about the kind of development that is desired by the public sector and/or local community. This certainty has the potential to reduce risk – and cost - for a developer, who otherwise might have to spend additional time and effort securing project entitlements. In some cases, planning efforts include detailed market and financial analysis that developers can use in planning for new development, also reducing cost.
2 Note: while these policies have the potential to contribute to development feasibility, it is not true in all cases. Moreover, many TOD projects rely on a combination of multiple policy tools and funding mechanisms.
-6

FIGURE 3: POTENTIAL IMPACT OF POLICY TOOLS ON PROJECT FEASIBILITY (Page 1 of 2)
Policy Tool Increase
Revenues Decrease
Costs Notes
Plan
ning
and
Vis
ioni
ng T
ools
Regional TOD Strategic Plan X X Planning efforts can provide more certainty for a developer about the future vision for a neighborhood, reduce entitlement risk, provide valuable information about the market, and help to align resources to support development.
Citywide TOD Strategic Plan X X
Prepare Station Area Plans & Market Studies X X
Station Area Rezoning: Rezone Station Areas, Use Restrictions Based on Public Health and Safety, and Transportation Impacts, and Optional Overlay Zone
X X
Land Use Intensity Tools: Density Bonuses and FARs & Building Heights Bonuses X Increased allowable density and heights can result in higher revenues from development where higher density projects are feasible.
Land Use Standards Enhancement: Form Based Codes and Design Guidelines X Like planning efforts, design guidelines can provide more certainty about the future character and quality of a neighborhood, and increase revenues from development.
Parking Tools: Revised Parking Standards, Shared Parking, and Parking Districtsg g g g X Policies that reduce the amount of parking required within individual development projects can have a major impact onp p j j p project costs.
Impl
emen
tatio
n To
ols
Fast Track Development Review X Expedited review results in lower "soft" costs for a developer.
Capital Funding for Infrastructure X This funding can help to fund infrastructure costs that would otherwise need to be borne by a developer.
Tax Increment Financing - REQUIRES LEGISLATION X Same as above.
Reduced Impact Fees in Station Areas - CURRENTLY INFEASIBLE X Reduced impact fees result in decreased costs for a developer.
Streetscape and Pedestrian/Bike Improvements X Enhanced "placemaking" and neighborhood amenities can make nearby development more valuable.
Façade and Site Frontage Improvement Program X Same as above
Tax Exempt Bonds X This funding can help to fund infrastructure costs that would otherwise need to be borne by a developer.
Tax Abatement - CURRENTLY INFEASIBLE X Tax abatement can be used to offset development costs.
Joint Development Program X X Joint development programs can make properties available for development and can facilitate development through public-private partnerships and innovative financing techniques.
Land Acquisition Loan Funds X Land Acquisition Loan Funds can reduce property acquisition costs or holding costs that would otherwise be borne by the developer, and assist with site assembly.
Funds for Buying Available Parcels in the Open Market X Same as above.

-
FIGURE 3: POTENTIAL IMPACT OF POLICY TOOLS ON PROJECT FEASIBILITY (Page 2 of 2)
Policy Tool Increase
Revenues Decrease
Costs Notes
Ong
oing
Pro
gram
s
Business District Association or Business Improvement Districts X The presence of a BDA or BID has been found to have a positive impact on nearby residential properties.
Marketing Plan n/a While a marketing plan has no direct impact on project costs or revenues, it can make developers aware of TOD opportunities.
Livable Communities Program X
The program can help make funds available for planning and urban amenities that improve neighborhood access and quality, and increase revenues for nearby development projects.
Community Development Corporation (CDC) Lead Efforts -CURRENTLY INFEASIBLE X
CDC's can take the lead in developing projects that include affordable housing or other community needs; these projects often have access to project subsidies and other funding sources that reduce overall costs.
Housing Trust Funds - CURRENTLY INFEASIBLE Housing Trust Funds CURRENTLY INFEASIBLE XX This dedicated source of funding for affordable housing can be d d jused to reduce project costs.
Source: Strategic Economics, Community Design + Architecture, US EPA.

At the same time, planning efforts also have the potential to increase revenues for a developer. In some cases, current zoning does not allow for the kind of development that is most likely to benefit from the introduction of transit. Tools that allow for TOD land uses, such as station area plans or zoning overlays, will have a direct impact on project feasibility by allowing for new development that could not otherwise be built.
As discussed above, higher-density building types are more expensive to build than lower-density ones such as single family homes or townhomes. Where higher-density development can generate enough revenues to offset these higher costs, however, it has the potential to generate much greater profit for a developer. The presence of urban amenities and neighborhood character can play a key role in contributing to the viability of these higher density development types. For example, a recent study by Johnson Gardner found that neighborhoods that include local-serving businesses that help make neighborhoods more “walkable” and offer needed services – such as grocers, florists, art galleries or cafes – have a positive impact on property values (and expected rents or sales prices for new development).3 Planning efforts can play an important role in enhancing and preserving neighborhood character and encouraging desirable neighborhood amenities.
One of the most direct ways that planning tools can impact development feasibility is by reducing the amount of parking that is required within an individual development project. In most parts of the country, the cost of structured parking is at least $25,000 per space, and underground parking can cost as much as $65,000 per space (compared to about $5,000 per space for surface parking). These costs can easily make or break a development project.
Studies show that households near transit require less parking, and many cities are reducing parking requirements for new housing near transit.4 Parking reductions not only result in lower overall development costs, but can also increase the amount of space that is available for revenue-generating development. The analysis later in this memo considers the impact of reducing parking from two to one space per unit.
Implementation Tools Many implementation tools are geared to help provide neighborhood amenities that generate value for surrounding properties. These include streetscape and pedestrian/bike improvements, and façade and site frontage improvement programs. A recent study by Susan Wachter at the University of Pennsylvania found that improvements to urban corridors (such as 19th Street or Apache Boulevard), reduction of vacant properties, and “green” investments in streetscape and open space, can increase the value of nearby homes – in some cases by more than 20 percent.5
A variety of tools can also be used to reduce or offset development costs, which can also have a positive impact on project feasibility. Expedited development review can reduce costs for a developer by reducing overhead costs and costly time delays. Tools such as tax exempt bonds and capital funding for infrastructure can assist with financing needed project infrastructure that would otherwise be borne by the developer.
Tools that assist with land acquisition, such as direct provision of funds to purchase parcels or land acquisition loan funds, can also reduce developer costs by reducing acquisition costs or holding costs, or by facilitating land assembly needed for new development.
3 Johnson Gardner, Urban Living Infrastructure, prepared for Oregon Metro in June 2007. 4 For example, Urban Land Institute, Developing Around Transit, 2004. 5 The Determinants of Neighborhood Transformations in Philadelphia, Identification and Analysis: The New Kensington Pilot Study, Susan Wachter, The Wharton School, University of Pennsylvania, 2005.
-8

Ongoing Programs Ongoing programs that help to promote successful neighborhoods can also improve the feasibility of TOD. For example, the University of Pennsylvania study mentioned above found that homes located in areas with Business Improvement Districts (BIDs) were worth 30 percent more than homes in other areas, because neighborhoods with successful neighborhood-serving business districts are more desirable to live in. Programs such as the Livable Communities Program can also help to support quality neighborhoods and provided needed urban amenities that can increase revenues for TOD.
Impact on Development Feasibil i ty in the Current Market
Strategic Economics conducted a financial analysis to illustrate how the presence of transit and TOD-supportive policies can improve development feasibility and make higher-density development more profitable for a developer. The analysis considers the impact of a combination of increased project revenues and reduced development costs, focusing on the range of building types shown previously in Figure 2. The costs and revenues in the “baseline scenario” (i.e., current market conditions) are compared to the costs and revenues under a “TOD scenario” that can achieve higher revenues and benefit from reduced development costs.
Revenue Assumptions
As described above, the presence of transit and TOD supportive planning, “placemaking”, neighborhood-serving retailers, and infrastructure and access improvements can all have positive impacts on project revenues. Figure 4 shows the impact of a 20 percent revenue premium – in this case, 20% higher rents - on the range of building types, on a per-unit basis (the value generated by one unit within the building). This revenue increase could result from a combination factors described earlier in the memo, such as corridor improvements, pedestrian and bike improvements, streetscape and other “greening” efforts, or other neighborhood amenities.
Revenues in the analysis are calculated assuming all development consists of rental apartments. The baseline value is based on average current market rents. The total value per unit, or “revenue”, is calculated using a capitalization rate. It should be noted that the average size of a townhome unit is assumed to be larger than other building types, and therefore per-unit revenues are higher.
Development Cost Assumptions
Policy tools can help to reduce development costs in a variety of ways, including shortening the timeframe for development by facilitating project entitlements, funding needed infrastructure, and assisting with land acquisition. Reduced parking requirements are one of the most widespread mechanisms used by local governments to promote TOD – and also one of the most effective. The analysis considers the impact of reducing parking from two spaces per unit to one. It also incorporates assumptions about how reductions in parking can result in greater development potential, as space that would otherwise be used for parking is “freed up” for additional housing units.
Figure 5 shows the impact of reduced parking on the development costs for different building types, on a per-unit basis. The figure compares the average cost of a unit of each building type (including parking) in the current market (the “baseline” scenario), to the per-unit cost of each building with a reduced parking ratio. The development costs include all costs to develop a building, including land costs, construction costs, and “soft” costs such as building permits, fees, legal costs and marketing. Changing the parking requirement results in a significant reduction in costs for all building types, but the impact is greater for building types with more expensive parking types, such as a parking structure or podium garage.
-9

FIGURE 4PER UNIT VALUES ‐ IMPACT OF 20% REVENUE PREMIUMRental Units
$0
$50,000
$100,000
$150,000
$200,000
$250,000
$300,000
Townhome,surface pkg
Townhome,garage
Multifamily2‐3 stories,surface pkg
Multifamily2‐3 stories, garage
Multifamily4‐6 stories,podium pkg
Urban block, wrapped
pkg structure
Baseline Revenue Premium
FIGURE 5PER UNIT DEVELOPMENT COSTS ‐ IMPACT OF REDUCED PARKING
$0
$50,000
$100,000
$150,000
$200,000
$250,000
$300,000
Townhome,surface pkg
Townhome,garage
Multifamily2‐3 stories,surface pkg
Multifamily2‐3 stories, garage
Multifamily4‐6 stories,podium pkg
Urban block, wrapped
pkg structure
Baseline Reduced Parking

-11-
Impact on Development Feasibility
In the current real estate market very few projects are able to move forward, in part because developers are finding it very difficult to secure project financing, and also because expected prices and rents are not high enough to compensate for the costs of development. Figure 6 shows the expected relationship between costs and revenues for a range of unit types in the current market (the “baseline” scenario). These are the same revenues shown in the previous chart, but this time they compare revenue costs. As shown, under current market conditions, costs exceed revenues for all building types, which means that all types are infeasible.
Figure 7 shows the combined impact of reduced parking and increased revenue due to the presence of transit. In this scenario, the value of townhome development exceeds the cost to develop it, which means that it would be profitable for a developer to undertake. More expensive building types remain infeasible, however the gap between costs and revenues is considerably reduced.
Figures 8 and 9 show the combined impact for each building, rather than on a per-unit basis. The revenue increase needed to make each of the building types feasible under both the “baseline” (current market) and TOD (increased revenues and reduced costs) scenarios is presented in Table 1. As shown, in the baseline scenario, rents would need to increase between 10 and 66 percent in order to make the building types feasible for a developer to build. Assuming higher rents and reduced parking ratios based on the presence of new transit and TOD-supportive policies, rents would need to increase between 0 and 23 percent.
As rents rise, it is interesting to note the likely sequence of development that could become feasible. Townhomes are the most likely to become feasible in the short term due to their relatively low construction costs. Over time, two- to three- story apartment buildings would also become feasible, followed by apartments built on an urban block. This urban block development type with a wrapped parking structure requires a larger parcel size, a minimum of about 3 acres. The last building type to become possible is a 4 to 6 story building with parking beneath, due to the higher cost of providing podium parking. Therefore, given the constraints of Proposition 207, communities should look to deploy a comprehensive approach to planning for TOD that utilizes a full array of tools to optimize the potential for increasing property values.
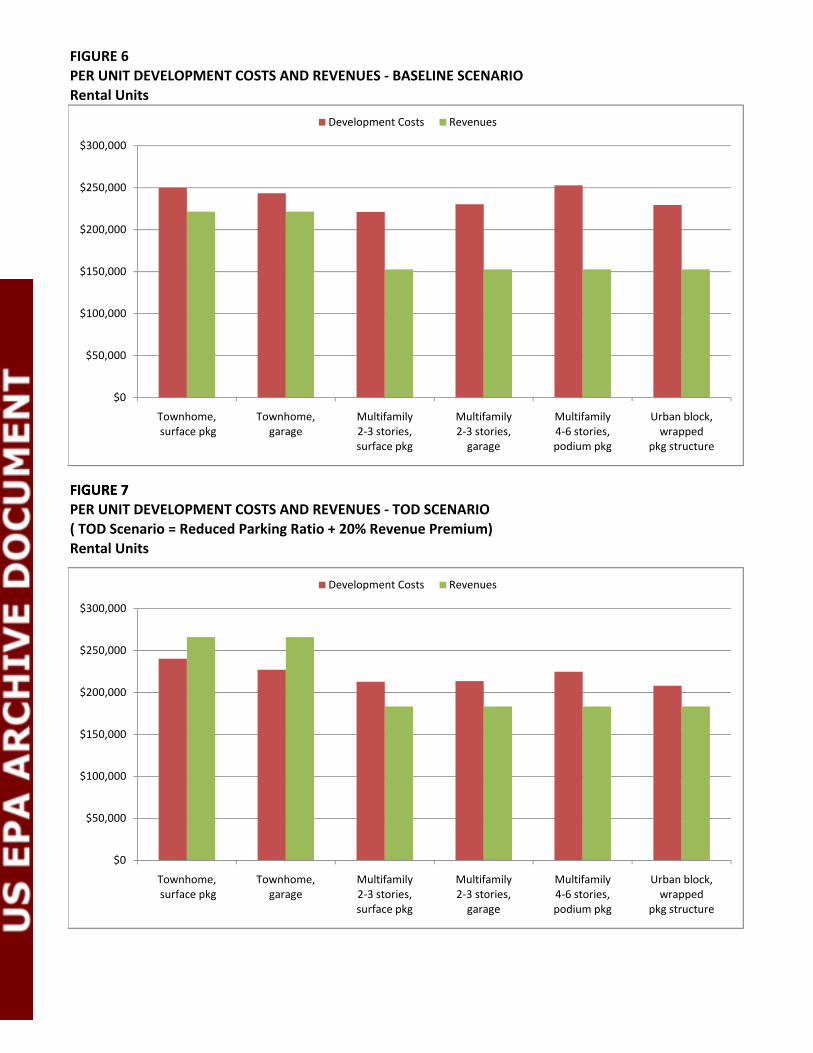
FIGURE 6PER UNIT DEVELOPMENT COSTS AND REVENUES ‐ BASELINE SCENARIORental Units
$0
$50,000
$100,000
$150,000
$200,000
$250,000
$300,000
Townhome,surface pkg
Townhome,garage
Multifamily2‐3 stories,surface pkg
Multifamily2‐3 stories, garage
Multifamily4‐6 stories,podium pkg
Urban block, wrapped
pkg structure
Development Costs Revenues
FIGURE 7FIGURE 7PER UNIT DEVELOPMENT COSTS AND REVENUES ‐ TOD SCENARIO( TOD Scenario = Reduced Parking Ratio + 20% Revenue Premium)Rental Units
$0
$50,000
$100,000
$150,000
$200,000
$250,000
$300,000
Townhome,surface pkg
Townhome,garage
Multifamily2‐3 stories,surface pkg
Multifamily2‐3 stories, garage
Multifamily4‐6 stories,podium pkg
Urban block, wrapped
pkg structure
Development Costs Revenues

FIGURE 8TOTAL DEVELOPMENT COSTS AND REVENUES ‐ BASELINE SCENARIORental Units
$0
$5,000,000
$10,000,000
$15,000,000
$20,000,000
$25,000,000
Townhome,surface pkg
Townhome,garage
Multifamily2‐3 stories,surface pkg
Multifamily2‐3 stories, garage
Multifamily4‐6 stories,podium pkg
Urban block, wrapped
pkg structure
Development Costs Revenues
FIGURE 9FIGURE 9TOTAL DEVELOPMENT COSTS AND REVENUES ‐ TOD SCENARIO( TOD Scenario = Reduced Parking Ratio + 20% Revenue Premium)Rental Units
$0
$5,000,000
$10,000,000
$15,000,000
$20,000,000
$25,000,000
Townhome,surface pkg
Townhome,garage
Multifamily2‐3 stories,surface pkg
Multifamily2‐3 stories, garage
Multifamily4‐6 stories,podium pkg
Urban block, wrapped
pkg structure
Development Costs Revenues
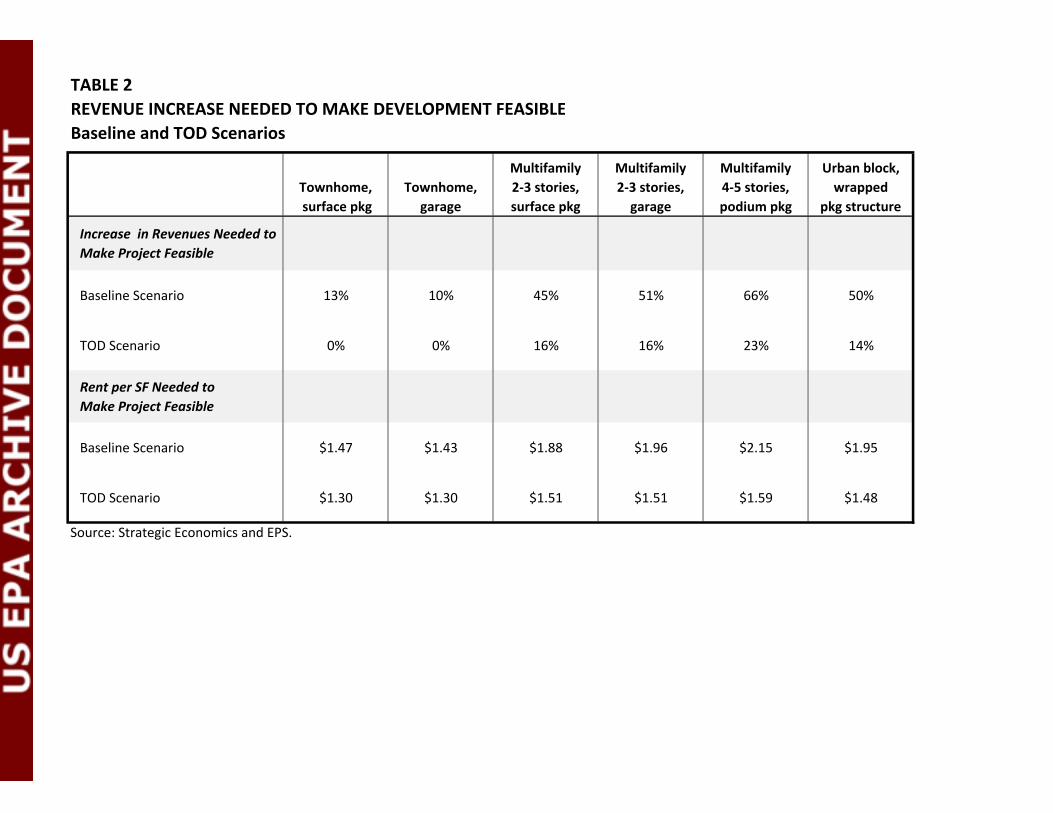
TABLE 2REVENUE INCREASE NEEDED TO MAKE DEVELOPMENT FEASIBLEBaseline and TOD Scenarios
Townhome, surface pkg
Townhome,garage
Multifamily2‐3 stories,surface pkg
Multifamily2‐3 stories, garage
Multifamily4‐5 stories,podium pkg
Urban block, wrapped
pkg structure
Increase in Revenues Needed to Make Project Feasible
Baseline Scenario 13% 10% 45% 51% 66% 50%
TOD Scenario 0% 0% 16% 16% 23% 14%
Rent per SF Needed to Make Project Feasible
Baseline Scenario $1.47 $1.43 $1.88 $1.96 $2.15 $1.95
TOD Scenario $1.30 $1.30 $1.51 $1.51 $1.59 $1.48
Source: Strategic Economics and EPS.