impact of trade liberalization on foreign direct … no. 36.pdfasia-pacific research and training...
TRANSCRIPT

Asia-Pacific Research and Training Network on Trade Working Paper Series, No. 36, June 2007
Impact of Trade Liberalization on Foreign Direct Investment
in Indian Industries
By
Bishwanath Goldar and
Rashmi Banga**
Institute of Economic Growth, University of Delhi Enclave, North Campus, Delhi
– 110 007, India. Email: [email protected]. ** United Nations Conference on Trade and Development (UNCTAD), The Taj Ambassador
Hotel, New Delhi. (All views expressed are personal) Email: [email protected]

Table of contents Executive Summary ....................................................................................2
1. Introduction.............................................................................................4
2. Review of the Literature .........................................................................5
3. Trends in FDI and Trade Flows in Indian Manufacturing Sector ..........5
4. Hypotheses regarding the effect of trade reforms on FDI inflows.........9
5. Results of Econometric Analysis..........................................................11
5.1 Panel data analysis ...........................................................................11
5.1.1 Data and Variables .....................................................................11
5.1.2 Empirical Results .......................................................................13
5.2 Inter-firm cross-section analysis ......................................................19
5.3 Inter-state cross-sectional analysis...................................................20
6. Concluding Remarks.............................................................................24
References.................................................................................................25
1

Executive Summary
Literature on FDI and trade has mainly concentrated on export-substituting or export-complementary nature of foreign direct investment (FDI). However, the relationship between FDI and trade has become far more complex in the current WTO regime wherein several developing countries have initiated import liberalisation and entered into trading arrangements. These have drastically reduced trading costs and encouraged trade. With the growing volumes of trade, the focus of policy makers in the developing countries has now shifted from whether FDI causes trade to whether trade can boost FDI inflows and in particular, what kinds of trade can boost FDI inflows?
There are reasons to expect that different kinds of trade would influence FDI flows differently. While trade associated with cross-border vertical integration may boost FDI by providing incentives of cost reduction, intra-industry trade may discourage FDI that seeks economies of scale. Within intra-industry trade (IIT) the impact may differ with respect to vertical and horizontal intra-industry trade. Vertical ITT may encourage FDI as it assures ownership advantages and a market; while horizontal IIT may discourage FDI as it may be more beneficial to trade rather than invest if the product is not produced locally. Net effect on FDI of such trade may be an important empirical question.
Though, some studies indicate that FDI is used to preserve markets that were previously established by exports and others have suggested that FDI, in particular U.S. FDI, follows exports, the impact of different kinds of trade on FDI inflows is still an area with limited research. This is a useful area for research with great significance for the policy makers. This paper makes an attempt to address these issues in the context of Indian industries.
The paper undertakes analyses at three levels. First, using panel data for 78 industries at three-digit level of industrial classification for the period 1991-92 to 1997-98, econometric models are estimated which (a) relate the extent of foreign investment in an industry in a particular year to intra-industry trade in that industry, level of materials import intensity and, a set of other variables that are expected to influence the degree of foreign presence; and (b) relate intra-industry trade and materials import intensity to trade barriers facing that industry and a set of other variables that are expected to influence materials imports and intra-industry trade. Second, an inter-firm cross-sectional analysis using data for a recent year is undertaken to explain inter-firm variations in the foreign share in equity of different firms and relating it to the trade behaviour of firms. And finally, inter-state analysis of FDI and trade flows is undertaken, trying to relate trade intensity of companies in a state to the magnitude of FDI inflows into the state.
Two major data sources used in the study are the Annual Survey of industries (ASI), which is published by the Central Statistical Organisation, Government of India and Prowess, Centre for Monitoring Indian Economy Pvt. Ltd (CMIE) that contains database on over seven thousand registered companies. A concordance table has been constructed wherein industries in Prowess are matched to three digit level industries in ASI. A panel dataset has been constructed for 78 industries at three-digit
2

level of industrial classification (National Industrial Classification) for the period 1991-92 to 1997-98.1 Data for industry characteristics are drawn from ASI while data on foreign direct investment, exports and technology for the matched industries are obtained from Prowess (CMIE). As a quantitative measure of the trade liberalisation process, the tariff rates and non-tariff barriers (import coverage ratio) are used. The intensity of intra-industry trade (IIT) is measured by the well-known Grubel-Lloyd (1975) index. To compute the above index, the basic data on India’s export and import, at the 4-digit levels of International Standard Industrial Classification (ISIC), have been obtained from the World Bank’s “Trade and Production Database CD-ROM”. The ISIC classification has been mapped into the ASI classification and indices for the 78 industries covered in the study have accordingly been obtained.
The results presented at the industry level indicate that trade liberalization, particularly reduction in tariff rates and higher export intensity, has caused materials import intensity and intra-industry trade to go up. The increase in materials import intensity reflecting to some extent the process of cross-border vertical integration has had a favourable effect on foreign investment inflows. But increase in intra-industry trade is not found to have a statistically significant effect. The results of inter-firm cross sectional analysis indicate that export intensity and import-availability ratios have significant favourable impact on foreign share in equity. These results corroborate the findings at the industry level that trade associated with cross-border vertical integration has a favourable effect on FDI inflow.
The relationship between trade and FDI is studied with the help of state level data on trade and FDI. The inter-state variations in FDI flows and the scale of international trade is analysed to find out if these two are related. A positive relationship is visible between the level of international trade the plants of companies located in the state are engaged in and the scale of FDI flows.
In sum, the results arrived at different levels indicate that trade liberalization
has had a favourable effect on FDI flows in India. It is also found that the regions having greater extent of international trade are able to attract greater amount of FDI. Some evidence is found that point to differential effects of trade associated with international vertical integration and intra-industry trade. Though liberalization has led to a substantial increase in intra-industry trade, much of the intra-industry being horizontal in nature in India is not found to have a strong favourable effect on FDI.
1 The period chosen has been dictated by the availability of comparable data. Since there has been a change in industrial classification in the ASI from 1998-99, the period of the analysis could not be extended beyond 1997-98.
3

1. Introduction
For a long time, the theory of international trade and the theory of foreign
direct investment have been relatively disjoint. But, empirical studies have commonly found foreign direct investment (FDI) and trade to be inter-linked. FDI has been found to either substitute trade (in the case of tariff-hopping investment) or complement trade (in the case of intra-firm trade). However, the relationship between FDI and trade has become far more complex in the current WTO regime wherein several developing countries have initiated import liberalisation and entered into trading arrangements that have drastically reduced trading costs and encouraged trade. With the growing volumes of trade, the focus of policy makers in the developing countries has now shifted from whether FDI causes trade to whether trade can boost FDI inflows and in particular, what kinds of trade can boost FDI inflows? The answers to these questions have gained importance with the bilateral and plurilateral trading options becoming available to the developing countries.
In spite of the significance of the issue, particularly to the developing
countries, there is hardly any literature on the impact of trade on FDI flows. Some studies indicate that FDI is used to preserve markets that were previously established by exports (Grosse and Trevino, 1996) while others have suggested that FDI and, in particular, U.S. FDI, follows exports (Eaton and Tamura, 1994). Though a large number of studies have been undertaken on the impact of FDI on trade, the impact of trade on FDI inflows yet remains to be estimated empirically.
There are reasons to expect that different kinds of trade would influence FDI
flows differently. Thus, one would expect differential impact of trade associated with cross-border or international vertical integration, and vertical and horizontal intra-industry trade2 on inward FDI flows in developing countries. While trade associated with cross-border vertical integration may boost FDI by providing incentives of cost reduction, intra-industry trade may discourage the FDI that seeks economies of scale.
It is evident from the above that the impact of different kinds of trade on FDI
flows in developing countries is not only an important and useful area for research but also holds great significance for the policy makers. However, this paper, which makes an attempt to address these issues in the context of Indian industries, has a limited aim. An analysis of the impact of India’s trade liberalisation of the 1990s on FDI in Indian industries is presented in the paper using industry-level and firm-level data. The relationship between trade and FDI is studies also in a regional context with the help of state level data on trade and FDI. Further, the paper examines the differential impact of trade associated with cross-border vertical integration and intra-industry trade on FDI inflows.
The rest of the paper is organized as follows. The next section presents a quick
review of the relevant literature. Section 3 describes the trends in trade and FDI in Indian manufacturing in the pre and post-reform period, as a background to the empirical analysis presented in the paper. Section 4 sets out some hypotheses
2 Horizontal intra-industry trade is trade in final products which are differentiated by attributes, while vertical intra-industry trade is trade in final products which are differentiated by quality.
4

regarding the effect that economic reforms, particularly trade liberalisation, may have had on FDI inflows and how the effects of intra-industry trade and inter-industry trade on FDI inflows differ. Section 5 presents the results of econometric analysis. Section 6 summarises and concludes.
2. Review of the Literature
There exists an extensive literature on the impact of FDI on trade. Following
Mundell (1957), it was long thought that FDI substitutes trade. The proposition was challenged by Agmon (1979), and subsequently a number of studies emphasised potential complementarities between FDI and trade. This literature has been reviewed by Ethier (1994, 1996) and Markusen (1995, 1998). However, recently, there have been some studies that have explored further the relationship between FDI and trade by taking a unified approach, which postulates simultaneous determination of the two flows in developed countries (Markusen and Maskus, 2001).
These studies on trade and FDI mentioned above can be divided into three
categories: First, those that argue that the determinants of FDI and trade are similar and therefore what determines trade also determines FDI flows (Ekholm, 2002). Second, those that estimate econometric models in which FDI, exports and imports are determined simultaneously and argue that all three are endogenous variables and therefore their interactions should be taken into account (Hejazi and Safarian, 2003). Lastly, those that look at the impact of regional trade agreements on FDI flows (Binh and Haughton, 2002; Worth, 2002). Banga (2004) shows that regional trading agreements like ASEAN and APEC can influence FDI inflows into the region as the risks associated with investments decline with greater regional integration. Though the above studies have to some extent noted the effects of trade on FDI inflows, they have not exclusively captured these effects by empirically determining the effects of different kinds of trade on FDI inflows. This paper adds to the existing literature by investigating the impact of trade associated with cross-border vertical integration and intra-industry trade on FDI flows for the Indian industry in the post reforms period. 3. Trends in FDI and Trade Flows in Indian Manufacturing
Sector
The economic reforms programme initiated by the Indian government in 1991 aimed at rapid and substantial integration of the Indian economy with the global economy in a harmonised manner. Accordingly, the industrial policy in the post-reforms period mainly aimed at de-licensing, privatisation, and FDI promotion, which was coupled with trade liberalisation in the manufacturing sector. To attract FDI, the policy regime for FDI was liberalised considerably. The first step in this direction was the grant of automatic approval, or exemption from case by case approval, for equity investment of up to 51 per cent and foreign technology agreements in identified high-priority industries. Gradually, FDI has been permitted in almost all industries.
Not only has the restrictions on foreign equity investments gone down, several
incentives to encourage FDI in manufacturing sector have also been undertaken e.g., tax incentives, tax holidays, etc. Also, to protect the interest of foreign partner and ensure proper treatment and facilitate business operations of foreign firms, India has
5

signed a number of bilateral investment treaties (BITs). India has also become a member of MIGA (Multilateral Investment Guarantee Agency).
Along with the efforts to improve FDI flows, trade has been encouraged to a
large extent by a substantial lowering of nominal rates of protection (NRP). The NRP fell from 90.8 per cent for the aggregate manufacturing sector in the year 1980-81 to 35 per cent in the year 1997-98, while effective rate of protection (ERP) fell from 99.5 to 41 per cent during the same period (Goldar and Saleem, 1992; and Nouroz, 2001). Simple average of applied tariffs on all products declined from 78.7 per cent in 1990 to 28.1 per cent in 2003, while the weighted average declined from 56.1 per cent to 28.2 per cent (Figure 1). Along with this, the coverage of non-tariff barriers (NTB) has also been reduced in the post-reforms period (Pursell, 1996; Mehta, 1999).
Figure 1: India's Applied Tariffs (Simple and Weighted Averages): 1990-2003
0
20
40
60
80
100
1990 1992 1997 1999 2001 2003
Simple Average
Weighted Average
In accordance with the tariff reforms, there has been a considerable and consistent improvement in the trade flows as a proportion of GDP as shown in Table 1. While trade as a percentage of GDP increased from 15.7 per cent in 1990 to 30.8 per cent in 2002, the post reform period witnessed a marked acceleration in the growth of both exports and imports. During the period 1970-71 to 1979-80 real export as a ratio of GDP grew at a rate of 3.7 per cent per annum, while in the period 1980-81 to 1989-90 it grew -0.6 per cent per annum; and in the period 1990-91 to 1998-99 the growth was around 4.6 per cent per annum (Goldar, 2002). On the other hand, real imports as a ratio of GDP grew at a rate of 1.1 per cent per annum, 0.3 per cent per annum and 7.9 per cent per annum in these three periods respectively. Imports of goods and services as a percentage of GDP in fact has been larger than exports of goods and services as a percentage of GDP (Table1). It may be noted, however, that while the gap between the two ratios was more than three percentage points in 1980, it was only 1.5 percentage points in 2003.
Along with the rapidly increasing trade volumes, Actual FDI flows rose from around USD 300 million in 1992-93 to more than USD 3 billion in 1997-98 and reached USD 7.5 billion in the financial year 2006. FDI as a percentage of gross capital formation increased from around 0.31 per cent in the 1990 to 2.6 per cent in 2002.
6

Table 1: Trends in India’s FDI and Trade Flows: 1980 to 2003 Year Trade (% of GDP) Foreign direct
investment, net inflows (% of GDP)
Imports of goods and services (% of GDP)
Exports of goods and services (% of GDP)
1980 15.7 0.0 9.5 6.3 1981 14.9 0.0 8.8 6.1 1982 14.5 0.0 8.4 6.1 1983 14.0 0.0 8.1 6.0 1984 14.4 0.0 7.9 6.5 1985 13.2 0.0 7.8 5.4 1986 12.5 0.0 7.2 5.3 1987 12.9 0.1 7.1 5.7 1988 13.7 0.0 7.6 6.1 1989 15.4 0.1 8.3 7.1 1990 15.7 0.1 8.6 7.1 1991 17.2 0.0 8.6 8.6 1992 18.7 0.1 9.8 9.0 1993 20.0 0.2 10.0 10.0 1994 20.4 0.3 10.3 10.0 1995 23.2 0.6 12.2 11.0 1996 22.4 0.6 11.8 10.6 1997 23.0 0.9 12.1 10.9 1998 24.1 0.6 12.9 11.2 1999 25.5 0.5 13.7 11.8 2000 28.5 0.5 14.6 13.9 2001 27.6 0.8 14.1 13.5 2002 30.8 0.7 15.6 15.2 2003 30.5 0.7 16.0 14.5
Source: world Development Indicators
However, it is interesting to note that as the Indian economy became more open and receptive to the world, growth of trade has been much faster than that of FDI (Figure 2). The ratio of FDI inflows to the annual rate of capital formation in manufacturing remained as low as around 5 percent during the period 1992-93 to 1998-99. The net inflow of FDI as a percentage of GDP remained less than 1% though there has been a rapid rise in FDI inflows (Figure 2).
7

Figure 2: Trade and FDI as a Percentage of GDP in India
0.0
5.0
10.0
15.0
20.0
25.0
30.0
35.0
1980
1981
1982
1983
1984
1985
1986
1987
1988
1989
1990
1991
1992
1993
1994
1995
1996
1997
1998
1999
2000
2001
2002
2003
0.00.10.20.30.40.50.60.70.80.91.0
Trade (% of GDP) FDI, net inflows (% of GDP)
Apart from the growth in FDI and trade, the liberalised regime has also affected the level of technology acquisition in the manufacturing sector by encouraging technology imports. Three main sources of technological advancement in manufacturing sector are imports of embodied technology (e.g., capital goods), imports of disembodied technology (through royalty payments, technical fees and lump-sum payments) and in-house research and development (R&D).
In the post reforms period, the imports of capital goods have been on an
average 2.4 per cent of the total imports and this has not increased much overtime as seen in Table 2. One of the reasons of this could be that domestic research and development has to some extent made possible replacement of imported machinery by domestic machinery. The in-house R&D efforts by industrial firms have been relatively low in India but these have shown a tendency to improve consistently overtime. R&D intensity increased to 3.3 percent in 1996-97 from 0.5 in 1990-91. The top 10 per cent industrial companies spent on an average about 8 percent of their sales on R&D during 1996-99.
8

Table 2: Trends in Technology Acquisition in Indian Manufacturing, 1990-91 to 1997-98
Year Import of Capital
Goods as a Percentage of Total Imports
R&D Expenditures as a Percentage of Total Sales
Import of Technology as a Percentage of Total Sales
1990-91 2.4 0.5 0.7 1991-92 2.1 0.9 0.9 1992-93 2.0 1.6 1.5 1993-94 2.6 1.6 2.5 1994-95 2.6 1.9 3.1 1995-96 2.8 2.5 4.4 1996-97 2.5 3.3 4.8 Source: Banga (2005). The table is based on the Handbook of Statistics on Indian Economy, DGCI&S and computations made from Prowess (C.M.I.E.). Note: Import of technology includes import of embodied as well as disembodied technology.
It may be pointed out that a considerable volume of technology has entered Indian industry through the route of technology imports i.e., purchase of technology. Imports of technology increased from 0.7 per cent of total sales in 1990-91 to around 5.0 per cent in 1996-97 (Table 2). In absolute terms, the payment for royalty and technical fees increased from USD 25.1 million in 1985 to USD 200.8 million in 1998. However, it is still much lower than those found in other developing countries (e.g., a comparative figure for Malaysia is USD 2392 million, USD 1002 million for Indonesia, USD 420 million for China and USD 804 for Thailand). 4. Hypotheses regarding the effect of trade reforms on FDI
inflows
It has been noted above that there has been a sharp increase in FDI in Indian industries in the post-reform period. This seems to be attributable largely to the liberalisation of industrial policy, particularly the policy towards FDI, which created a more favourable environment for foreign investment. But, the substantial liberalization of trade that took place in the post-reform period may have also contributed to the increase in FDI inflows. It seems reasonable to argue that reduction in tariffs and removal of quantitative restrictions on imports may have made conditions favourable for efficiency-seeking FDI and thus encouraged foreign investors to invest in India. Thus, one hypothesis to be tested in the paper is: Hypothesis 1: Increase in trade flows associated with international vertical integration in the post-reform period led to higher inflow of FDI in India in the post-reform period.
Studies that have analysed the impact of FDI on international vertical integration suggest that FDI leads to higher intra-firm trade and therefore higher international vertical integration. But, the issue under consideration here is the opposite one, viz. the impact of increase in international vertical integration of an industry through inter-industry trade on FDI inflows. A theoretical basis for the
9

hypothesis may be provided in the following way. It is expected that lower trading costs will lead to higher probability of international vertical integration of an industry. This will attract efficiency seeking and cost reducing FDI since it implies that foreign firms can now import cheaper intermediate goods which they may produce in some other country and export the final product to their home country or a third country.
As regards the Indian experience, one can find many examples where the Indian firms have becomes integrated vertically in the global supply chains in the process of globalisation. But, whether the growth of such trade has led to an increased FDI inflow in India is an empirical question, which is investigated in the next section.
Attention may now be turned to intra-industry trade. Veeramani (2003, 2004) has studied this aspect for Indian industries and reported that there was a marked increase in intra-industry trade in the post-reform era. According to his estimates, the index of inter-industry trade increased from 23% in 1987 to 31% in 1994 and further to 44% in 2000. Analysing econometrically the factors influencing intra-industry trade, he observes that trade liberalization was one of the important factors that were responsible for the increases in intra-industry trade. Veeramani’s analysis reveals an inverse relationship between intra-industry trade and involvement of multinational in the industry. He argues that foreign investment in India is mostly horizontal in nature (i.e., directed towards supplying the local market) rather than vertical. Accordingly, one would expect a negative relationship to arise between intra-industry trade and the extent of multinational involvement, representing the replacement of the export sales of differentiated products. It should be noted, however, that the question asked in this paper is different from what Veeramani investigates. The question is, whether this increase in intra-industry trade contributes to FDI inflows?
On the issue of the effect of intra-industry trade on FDI flows, it may be pointed out that vertical and horizontal intra-industry trade may have differential effects. Increase in vertical intra-industry trade (foreign firms exporting to India a product of higher quality) would make foreign firms aware of their ownership advantages and also assure them of the existence of the local markets. They would thus be induced to undertake investments so that they can avoid transportation costs and effectively compete with the local firms and other foreign firms. Hence, vertical intra-industry trade is expected to be FDI promoting. By contrast, horizontal intra-industry trade (foreign firms exporting to India a product of different variety than what is locally produced) may be a substitute to FDI. With the lowering of trading cost, the horizontal intra-industry trade may replace FDI. This would therefore not be favourable to FDI inflow, and may even cause the FDI inflows to decline.
The net effect of intra-industry trade on FDI will depend on the balance
between the favourable effect of vertical intra-industry trade and unfavourable effect of horizontal intra-industry trade. Accordingly, the second hypothesis put to empirical examination in the paper may be written as: Hypothesis 2: Vertical intra-industry trade will attract FDI into developing countries, whereas horizontal intra-industry trade may not attract FDI, and may even have a negative impact on inflow of FDI. The net effect will depend on the balance between the two opposing forces. In India, the adverse effect of horizontal intra-industry trade
10

dominated over the favourable effect of vertical intra-industry trade with the consequence that intra-industry trade had an adverse effect on FDI flows.
The first part of the hypothesis follows from the discussion above. As regards the latter part which pertains to the Indian experience, it may be noted that as pointed out by Veeramani (2004) most of the intra-industry trade of India is horizontal in nature, and therefore one would expect its impact to be larger than the impact of vertical intra-industry trade.
It is needless to say that if the two types of intra-industry trade could be
separated in the data, the separate effects could have been assessed empirically. However, from the available data, separate measures of horizontal and vertical intra-industry trade are hard to make, and therefore in the empirical analysis presented in the paper, one common index has been used. As a result, the observed effect of the intra-industry trade index is a blend of the effects of vertical and horizontal intra-industry trade.
5. Results of Econometric Analysis
The econometric analysis of the impact of import liberalisation on FDI in Indian industries carried out for this paper has three components. The first component is based on panel data for 78 industries at three-digit level of industrial classification (National industrial Classification) for the period 1991-92 to 1997-98. Econometric models are estimated which (a) relate the extent of foreign investment in an industry in a particular year to the levels materials import intensity and intra-industry trade in that industry and year, and a set of other variables that are expected to influence the degree of foreign presence, and (b) relate materials import intensity and intra-industry trade to trade barriers facing that industry and a set of other variables that are expected to influence materials imports and intra-industry trade. The second component is an inter-firm cross-sectional analysis using data for a recent year. An attempt is made to explain inter-firm variations in the foreign share in equity of different firms, relating it to the trade behaviour of firms. The third component is an inter-state analysis of FDI and trade flows, trying to relate trade intensity of companies in a state to the magnitude of FDI inflows into the state. The three parts of the analysis are presented in Sections 5.1, 5.2 and 5.3 respectively. 5.1 Panel data analysis 5.1.1 Data and Variables
A number of sources have been used to construct a panel dataset for this study. A major part comes from the database used earlier in the study of Banga (2005). Two major data sources are the Annual Survey of industries (ASI),3 which is published by the Central Statistical Organisation, Government of India and Prowess, Centre for
3 It covers all the production units registered under the Factories Act, 1948, ‘large ones’ on a census basis (with definition of ‘large’ changing over time) and the remaining on a sample basis. The Factories Act, it may be noted, applies to those units employing 10 or more workers and using power/ 20 or more workers not using power.
11

Monitoring Indian Economy Pvt. Ltd (CMIE) that contains database on over seven thousand registered companies. A concordance table has been constructed wherein industries in Prowess are matched to three digit level industries in ASI. A panel dataset has been has been constructed for 78 industries at three-digit level of industrial classification (National industrial Classification) for the period 1991-92 to 1997-98.4 Data for industry characteristics are drawn from ASI while data on foreign direct investment, exports and technology for the matched industries are obtained from Prowess (CMIE).
The share of foreign companies in total sales of the industries has been taken as the indicator of the level of FDI. Foreign company is defined on the basis of share in equity – more 10% foreign equity share has been taken as the cut-off for defining foreign firm. Export intensity is measured by the ratio of exports to sales. As a quantitative measure of the trade liberalisation process, the tariff rates and non-tariff barriers (import coverage ratio) are used. Goldar and Aggarwal (2005) have constructed a series on tariff and non-tariff barriers for various three-digit industries. This series has been used for this study.
To capture the influence of technology related factors, a set of variables is
used. These include R&D intensity, technology import intensity and capital goods import intensity. Data on R&D expenditure, technology imports (payment of royalty and technical fees, and lumpsum payments for technology) and imports of capital goods have been drawn from Prowess, and then matched to three-digit level industries of ASI.
The intensity of intra-industry trade (IIT) is measured by the well-known
Grubel-Lloyd (1975) index:
( )
( ) ,100×+
−−+=
iii MX
MiXiMiXiGL
where GLi is the index of IIT in industry i, and Xi and Mi are respectively the values of exports and imports in industry i. The value of GLi ranges from 0 to 100. If there is no IIT (i.e., one of Xi or Mi is zero) GLi takes the value 0. If all trade is IIT (i.e., Xi = Mi), GLi takes the value of 100. To compute the above index, the basic data on India’s export and import, at the 4-digit levels of International Standard Industrial Classification (ISIC), have been obtained from the World Bank’s “Trade and Production Database CD-ROM”.5 The ISIC classification has been mapped into the ASI classification and indices for the 78 industries covered in the study have accordingly been obtained.
4 The period chosen has been dictated by the availability of comparable data. Since there has been a change in industrial classification in the ASI from 1998-99, the period of the analysis could not be extended beyond 1997-98. 5 See Nicita and Olarreaga (2001) for details.
12
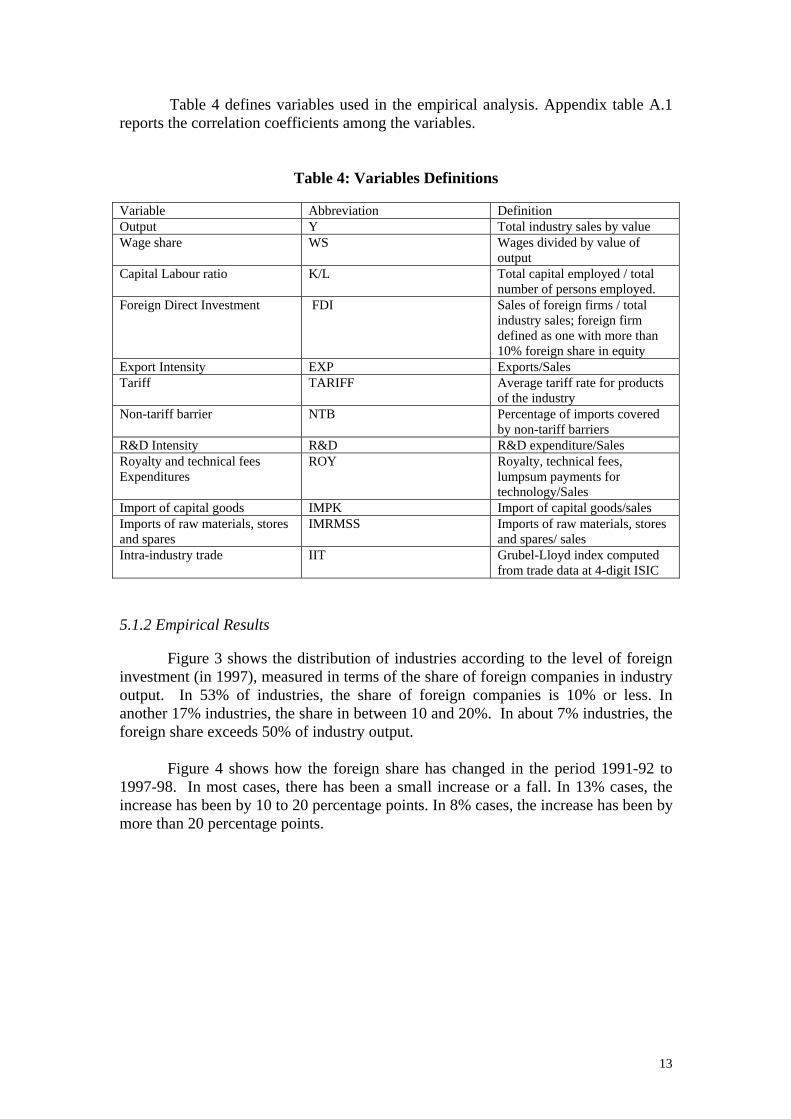
Table 4 defines variables used in the empirical analysis. Appendix table A.1 reports the correlation coefficients among the variables.
Table 4: Variables Definitions Variable Abbreviation Definition Output Y Total industry sales by value Wage share WS Wages divided by value of
output Capital Labour ratio K/L Total capital employed / total
number of persons employed. Foreign Direct Investment FDI Sales of foreign firms / total
industry sales; foreign firm defined as one with more than 10% foreign share in equity
Export Intensity EXP Exports/Sales Tariff TARIFF Average tariff rate for products
of the industry Non-tariff barrier NTB Percentage of imports covered
by non-tariff barriers R&D Intensity R&D R&D expenditure/Sales Royalty and technical fees Expenditures
ROY Royalty, technical fees, lumpsum payments for technology/Sales
Import of capital goods IMPK Import of capital goods/sales Imports of raw materials, stores and spares
IMRMSS Imports of raw materials, stores and spares/ sales
Intra-industry trade IIT Grubel-Lloyd index computed from trade data at 4-digit ISIC
5.1.2 Empirical Results
Figure 3 shows the distribution of industries according to the level of foreign investment (in 1997), measured in terms of the share of foreign companies in industry output. In 53% of industries, the share of foreign companies is 10% or less. In another 17% industries, the share in between 10 and 20%. In about 7% industries, the foreign share exceeds 50% of industry output.
Figure 4 shows how the foreign share has changed in the period 1991-92 to 1997-98. In most cases, there has been a small increase or a fall. In 13% cases, the increase has been by 10 to 20 percentage points. In 8% cases, the increase has been by more than 20 percentage points.
13

05
1015202530354045
no. o
f ind
ustri
es
up to10%
10-20% 20-30% 30-40% 40-50% 50-60% above60%
Share of foreign firms in output
Figure 3: Distribution of industries according to the level of foreign investment, 1997
0
10
2030
4050
60
no. o
f ind
ustr
ies
increaseup to 5%
or fall
5-10%increase
10-20%increase
20-30%increase
above30%
increase
percentage point increase
Figure 4: Change in share of foreign firms in industry output, 91-93 to 95-97
Note: Comparison is made between periods 1991-92 to 1993-94 and 1995-96 to 1997-98.
14

Estimates of the equation explaining foreign share
Table 5 presents the estimates of the equation explaining variations in the share of foreign companies in industry output, which is taken as an indicator of the level of foreign direct investment in different industries. The explanatory variables used are materials import intensity, intra-industry trade index, technology import intensity, R&D intensity, capital goods import intensity, value of industry output, capital-labour ratio, and the share of wages in value of output. The regression equation has been estimated by both the fixed-effects model and the random-effects model.
Table 5: Regression Results – determinants of foreign companies’ share in output of Indian industries
Estimation method Explanatory variables
Fixed Effects model Random effects model Materials import intensity 0.075 (0.6) 0.050 (0.4) Intra-industry trade index -0.04 (-0.7) -0.003 (-0.07) Technology import intensity
2.10 (1.68)* 2.24 (1.80)*
R&D intensity -1.25 (-0.4) -0.98 (-0.34) Capital goods import intensity
0.118 (0.8) 0.085 (0.6)
Industry output (10-8) 3.49 (2.08)* 1.78 (1.22) Capital-labour ratio (10-4) 0.67 (0.1) 3.98 (0.7) Wage share -0.59 (-1.55) -0.49 (-1.44) Hausman test: chi-sqr (7) 6.27 No. of observations 545 545 t-ratios in parentheses * statistically significant at 10% or higher level of significance
It would be noticed from Table 5 above that the regression results are not so good. Only two of the seven estimated coefficients are statistically significant in the estimate based on fixed-effects model, and only one coefficient is statistically significant in the case of random-effects model.
The coefficient of materials import intensity (taken as an indicator of cross-border vertical integration) is positive as hypothesized, but it is not statistically significant. The coefficient of the intra-industry trade variable is negative. In this case also, the coefficient is not statistically significant.
A closer examination of the data reveals that the share of foreign companies in industry output varies widely across industries. The sample average is 14%, but there are cases where the variable takes value above 90% (see Figure 3). When such observations are excluded, the regression results improve. Table 6 presents the revised estimates of the equation explaining variations in the share of foreign companies in industry output after all observations with foreign company share above 45% (approximately three times the sample average) are removed.
15

Table 6: Regression Results – determinants of foreign companies’ share in output of Indian industries (after removing cases of high foreign share)
Estimation method Explanatory variables
Fixed Effects model Random effects model Materials import intensity 0.15 (1.7)* 0.14 (1.7)* Intra-industry trade index 0.0086 (0.2) 0.0207 (0.7) Technology import intensity
2.04 (2.50)* 2.22 (2.75)*
R&D intensity -3.76 (-1.95)* -3.55 (-1.9)* Capital goods import intensity
0.098 (1.1) 0.075 (0.8)
Industry output (10-8) 3.00 (2.75)* 2.16 (2.33)* Capital-labour ratio (10-4) 2.79 (0.7) 3.19 (0.8) Wage share -0.35 (-1.33) -0.31 (-1.35) Hausman test: chi-sqr (7) 3.32 No. of observations 499 499
t-ratios in parentheses * statistically significant at 10% or higher level of significance
From the results presented in Table 6, it is seen that the coefficient of materials import intensity variable is positive and statistically significant at 10% level. The coefficient of the intra-industry trade variable is also positive, but it is not statistically significant. Turning to other variables, the results reported in Tables 5 and 6 indicate that higher level of industry output is associated with higher foreign share. The coefficient is probably picking up the effect of growth on foreign investment. Thus, one may interpret the result as signifying that foreign investment is relatively more in high growth industries rather than stagnant industries.
A positive relationship between technology import intensity and foreign share in industry output is indicated by the results, which probably shows that entry of foreign firms is relatively more in technology intensive industries. Interestingly, a negative relationship arises between R&D intensity and the share of foreign firm. One possible interpretation of the results is that the foreign firms undertake relatively less R&D in India as compared to indigenous firms since they have access to the centralized R&D being done by their parent firm.
The results suggest that foreign firms’ presence is relatively less in labour intensive industries. This inference may be drawn from the fact that the coefficient of wage share is found to be negative and the coefficient of capital-labour ratio is found to be positive. Equations explaining materials imports and intra-industry trade
16

The results presented in Tables 5 and 6 were concerned with the link between trade and FDI. To relate FDI to trade liberalization, it is important to go into the next part of the chain, i.e. the link between trade barriers and trade flows. Table 7 presents the estimates of an equation relating materials imports intensity to tariff and non-tariff barriers and some other variables. Table 8 presents estimates of such an equation for intra-industry trade. The results presented in Tables 7 and 8 indicate that lowering of tariff had a favourable effect on the growth of material import intensity as well as intra-industry trade. The coefficient of tariff rate is found to be negative and statistically significant at one percent level. The results for non-tariff tariff barriers are also in the same direction, though weak statistically (the coefficient of the quantitative restriction variable is negative but not statistically significant).
Table 7: Regression Results – determinants of materials import intensity
Estimation method Explanatory variables Fixed Effects model Random effects model
Tariff rate -0.00025 (-4.0)* -0.00025 (-4.1)* Quantitative restriction (import coverage ratio)
0.000005 (0.0) -0.00011 (-1.3)
Technology import intensity
-0.072 (-0.2) 0.020 (0.05)
R&D intensity 1.39 (1.59) 1.39 (1.6) Capital goods import
intensity -0.011 (-0.3) 0.018 (0.4)
Industry output (10-8) 0.30 (0.5) 0.15 (0.3) Capital-labour ratio (10-4) -0.56 (-0.3) -0.96 (-0.5)
Wage share -0.055 (-0.4) -0.056 (-0.5) Export intensity 0.25 (7.7)* 0.23 (7.9)*
Hausman test: chi-sqr (8) Not computed No. of observations 475 475
t-ratios in parentheses * statistically significant at 10% or higher level of significance
17

Table 8: Regression Results – determinants of intra-industry trade
Estimation method Explanatory variables Fixed Effects model Random effects model
Tariff rate -0.00049 (-2.67)* -0.00049 (-2.8)* Quantitative restriction (import coverage ratio)
-0.00018 (-0.7) -0.00031 (-1.2)
Technology import intensity
0.12 (0.1) 0.21 (0.2)
R&D intensity 6.35 (2.5)* 6.26 (2.4)* Capital goods import intensity
0.16 (1.2) 0.15 (1.2)
Industry output (10-8) 2.96 (1.75)* 2.78 (1.75)* Capital-labour ratio (10-4) -3.23 (-0.6) -2.14 (-0.4) Wage share -0.34 (-0.9) -0.28 (-0.8) Hausman test: chi-sqr (7) 3.62 No. of observations 475 475
t-ratios in parentheses * statistically significant at 10% or higher level of significance
As regard other explanatory variables used in the estimated regressions, the coefficients are statistically insignificant is almost all cases. One exception is export intensity, which is found to bear a significant positive relationship with material import intensity. Such a relationship is obviously expected. The other exception is R&D intensity. In the equation estimated for intra-industry trade, this variable has a significant positive coefficient. In the equation estimated for materials import intensity, the coefficient of R&D is positive and the t-ratio is marginally below the cutoff limit for 10% level of significance. It seems therefore that R&D intensity is positively related with materials imports and intra-industry trade. The coefficient of output variable is positive and statistically significant in the equation estimated for intra-industry trade. This possibly means that growth of industries results in higher intra-industry trade. No such effect is indicated for materials import intensity by the regression results obtained. To sum up, the results presented in Tables 5 through 8 indicate that trade liberalization, particularly reduction in tariff rates, caused materials import intensity and intra-industry trade to go up. The increase in materials import intensity reflecting to some extent the process of cross-border vertical integration had a favourable effect on foreign investment inflows. As regards the increase intra-industry trade, it is not clear from the regression results if it had a significant favourable effect on FDI inflows. It seems it probably did not.
18

5.2 Inter-firm cross-section analysis
To supplement the above analysis, an inter-firm cross-section analysis has been carried out using data for a recent year (for each firm data are taken for the latest year for which data were available). The variable of interest is the foreign share in equity of the firm. This is taken as the dependent variable. The explanatory variables include firm size, export intensity, materials import intensity, technology import intensity, and capital labour ratio. Data on these variables have been drawn from Capitaline corporate database, which covers about 7000 listed and unlisted companies. Altogether, data could be collected for about 2500 firms engaged in manufacturing activities.
To capture import competition and intra-industry trade, variables have been
constructed at industry level with the help of lasted input output table (1998-99). The extent of import competition is measured by import–availability ratio and for measuring intra-industry trade, the Grubel-Lloyd (1975) index has been used. The import-availability ratio and intra-industry trade index has been computed for different input-output sectors and then these have been applied to all firms belonging to those sectors.
The regression results are presented in Table 9. The equation for foreign
equity proportion has been estimated by the Ordinary Least Squares method and also by applying the tobit model (since in a large number of cases the dependent variable takes the value zero).
Table 9: Regression Results – determinants of foreign share in firm equity
Estimation method Explanatory variables OLS Tobit model
Materials import intensity 2.71 (2.3)* 3.91 (2.8)* Intra-industry trade index -0.0083 (-1.42) -0.0081 (-1.2) Import availability ratio 2.16 (2.36)* 3.18 (2.96)* Technology import intensity
1.58 (0.11) 3.51 (0.2)
Export intensity 1.48(2.3)* 1.92 (2.53)* Firm size (log of sales) 0.48(6.7)* 0.78 (9.2)* Ratio of net block to gross block
4.39 (5.19)* 5.12 (5.1)*
Capital-labour ratio 0.00022 (0.9) 0.00016 (0.5) Advertisement intensity -0.72 (-0.5) -1.01 (-0.5) R-squared 0.038 LR chi2(0) 150.7 No. of observations 2543 2543
t-ratios in parentheses * statistically significant at 10% or higher level of significance
19

The regression results presented in Table 9 indicate a significant positive relationship between materials import intensity and foreign share in equity. The results also show that export intensity and foreign share in equity are positively related. It may be noted further that the coefficient of import-availability ratio is positive and statistically significant. All these are consistent with the results reported in Section 5.1 above. There are indications from these results that trade associated with cross-border vertical integration has a favourable effect on FDI inflow as hypothesized. As regards intra-industry trade, the coefficient is found to be negative, but not statistically significant. Thus, these results do not indicate a favourable effect of intra-industry trade on FDI inflow, which is by and large in line with the results of panel data analysis presented in Section 5.1. It seems the adverse effects of horizontal intra-industry trade has neutralised or dominated over the favourable effects of vertical intra-industry trade and for this reason, the econometric results do not show a favourable effect of intra-industry trade on FDI inflows. As regards other explanatory variables used in the regression, a significant relationship of foreign share in equity is found with firm size and the ratio of net to gross block. A positive relationship between firm size and foreign share in equity is expected and thus the result is not surprising. The ratio of net to gross block may be taken as an indicator of vintage of capital stock. The finding of a positive relationship between the two variables indicates that the foreign share is relatively higher in those firms which have relatively new fixed assets. Interestingly, the technology import variable does not bear a significant relationship with foreign equity share. This is at variance with the results of panel data analysis. 5.3 Inter-state cross-sectional analysis
The effect of trade on FDI flows has been analysed above using inter-industry and inter-firm variations. This issue is now investigated in the context of regions or states. The inter-state variations in FDI flows and the scale of international trade is analysed to find out if these two are related. One difficulty encountered in undertaking this analysis is that while data on FDI are available state-wise, not such data are available for trade. The Capitaline data on balance sheets of companies (for 2005-06 or for the latest year for which data are available) have therefore been used to make an estimate of exports and imports of plant of companies located in various states.6
Table 10 shows for different states, their relative share in the FDI inflows during 2001-02 to 2005-06,7 FDI approvals during the same period, and exports, imports and total trade turnover (exports plus imports) of plants of companies located in the state. In a number of cases, it has been necessary to club some states because the FDI inflow data are not available for those states separately. It is seen from Table
6 For multi-plant companies, the value of sales, exports and imports has been distributed equally among plants, and then from plant level data so obtained the state level aggregates have been derived. 7 Data on FDI inflows and approvals have been taken from website of Indiastat.com. These are official data compiled by Indiastat.com.
20

10 that Maharashtra, Karnataka and Gujarat and Delhi (along with adjoining areas) account for a dominant part of FDI inflows as well as approvals. And, these are also the states that together account of a major part of exports, imports and trade. Table 10: Relative shares of States in FDI and Trade (%)
State Code used
FDI inflows
FDI approvals
Exports Imports Trade
Andhra Pradesh AP 4.92 6.02 4.03 3.12 3.49 Assam, Arunachal Pradesh, Manipur, Meghalaya, Mizoram, Nagaland, Tripura ASM 0.07 0.01 0.36 3.37 2.13 Bihar & Jharkhand BHR 0.00 0.01 1.11 2.69 2.04 Gujarat GUJ 5.13 11.16 17.11 27.24 23.07 Karnataka KAR 11.14 13.80 13.43 11.24 12.14 Kerala, Lakshadweep KER 0.48 1.28 1.14 3.41 2.47 Madhya Pradesh MP 0.30 0.34 2.18 1.60 1.84 Maharashtra MAH 29.34 30.14 20.56 18.68 19.45 Orissa ORS 0.57 0.03 1.84 1.16 1.44 Rajasthan RAJ 0.03 1.11 1.90 1.03 1.39 Tamil Nadu, Pondicherry TN 8.63 9.71 5.24 9.24 7.59 Uttar Pradesh, Uttaranchal UP 0.00 2.29 3.88 6.51 5.43 West Bengal, Sikkim, Andaman & Nicobar Islands WB 2.20 3.23 7.66 1.57 4.08 Punjab, Haryana, Himachal Pradesh, Chandigarh PNJ 2.37 7.94 4.04 4.76 4.46 Delhi, Part of Uttar Pradesh & Hariana* DLH 34.01 11.74 14.53 3.35 7.95 Goa GOA 0.81 1.19 1.00 1.03 1.02 All 100.00 100.00 100.00 100.00 100.00
* NOIDA and Gurgaon added A graphic presentation of state-wise data on FDI and trade is made in Figures
5 and 6. A positive relationship is visible between the level of international trade the plants of companies located in the state are engaged in and the scale of FDI flows. A positive correlation between trade and FDI across states is obvious also from Figure 7 in which the ratio of FDI approvals to net state domestic product for different states is plotted against the ratio of trade (exports plus imports) to sales of plants of companies located in the state.
Regressing FDI approvals (denoted FDIa) on trade and net state domestic
product (NSDP), the following equation is estimated (t-ratio in parentheses):
FDIa = constant + 0.051 TRADE + 0.013 NSDP n = 16 R2 = 0.72 (3.85) (1.64)
The coefficient of trade is positive and statistically significant at one percent level, indicating clearly a positive relationship between trade and FDI flows.
21

0
10000
20000
30000
40000
50000
60000
MAH KAR DLH GUJ TN PNJ AP WB UP KER GOA RAJ MP ORS ASM BHR
FDI,
Rs c
rore
0
20000
40000
60000
80000
100000
120000
Expo
rts a
nd im
port
s, R
s cr
ore
FDI apporval. 2001-02 to 2005-06 Exports Imports
Right scale
Figure 5: Exports, Imports and FDI approvals, by state
0
2000
4000
6000
8000
10000
12000
14000
16000
18000
20000
MAH KAR DLH GUJ TN PNJ AP WB UP KER GOA RAJ MP ORS ASM BHR
FDI,
Rs c
rore
0
20000
40000
60000
80000
100000
120000
140000
160000
Trad
e, R
s cr
ore
FDI inflow 2001-02 to 2005-06 FDI apporval. 2001-02 to 2005-06 Trade
Right scale
Figure 6: FDI approvals, FDI Inflows and Trade, by State
22

Figure 7: Trade and FDI intesity across states
00.02
0.040.06
0.080.1
0.120.140.160.18
0.2
0 0.2 0.4 0.6 0.8 1
Trade intensity
FDI i
nten
sity
Correlation coefficient = 0.9
23

6. Concluding Remarks
Very little research has been done so far on the effect of trade on FDI flows, although this is an issue of considerable significance to developing countries. There are reasons to expect that different kinds of trade may have different effects on FDI flow, but this has not been empirically examined so far. This paper made an attempt to address these issues in the context of Indian industries. The main focus of the paper was on the impact of trade liberalization on FDI in Indian industries. Further, the differential effects of trade associated with international vertical integration and intra-industry trade was examined.
The results indicated that trade liberalization had a favourable effect on FDI flows. It was also found that the regions having greater involvement in international trade were able to attract greater amount of FDI. Some evidence was found that point to differential effects of trade associated with international vertical integration and intra-industry trade. It was argued in the paper that the liberalization has led to a substantial increase in intra-industry trade, but much of the intra-industry being horizontal in nature, it did not have a favourable effect on FDI. On the other hand, the trade associated with cross-border vertical integration did have a favourable effect on FDI.
Although the econometric results relating to the differential effects of different types of trade reported in the paper are not very strong, the findings, if true, have important implications for trade and FDI policies of developing countries. Since the last decade there has been a substantial rise in the number of bilateral and regional trade agreements, especially between developing countries. There has also emerged a stream of literature that argues for South-South trade. However, while South-South trade may have many benefits for the developing countries, it may have some adverse implications for the flow of foreign direct investment. The results of the study suggest that if trade between similar partner countries is of intra-industry nature then it may lead to diversion of FDI flows towards the country with lower manufacturing cost and better FDI environment as the market of other country will now be easily accessible to the foreign investors.
24
References
Agmon, T. (1979), “Direct investment and intra-industry trade: substitutes or complements?” in Giersch, H. (ed.) On the Economics of Intra-Industry Trade, JCB
Banga Rashmi (2005), Impact of Liberalisation on Wages and Employment in Indian
Manufacturing Industries, Working Paper No. 153, Indian Council for Research in International Economic Relations.
Banga Rashmi (2004), Impact of Government Policies and Investment Agreements on FDI
Inflows, Working Paper No. 116, Indian Council for Research in International Economic Relations.
Binh N. and J. Haughton (2002), Trade Liberalization and Foreign Direct Investment in
Vietnam. Ethier, W.J. (1994), “Multinational Firms in the Theory of International Trade”, in Bacha, E.
(ed.), Economics in a Changing World, Macmillan, London. Ethier, W. J. (1996), “Theories about Trade Liberalisation and Migration: Substitutes or
Complements” in Lloyd, P. J. and Williams, L. (eds), International Trade and Migration in the APEC Region, Oxford, Oxford University Press.
Eaton, Jonathan and Akiko Tamura (1994), "Bilateralism and Regionalism in Japanese and
US Trade and Foreign Direct Investment Relationships", Journal of Japanese and International Economics, 8, 478-510.
Greenaway, Hine, and Milner (1995), Intra Industry FDI and Trade Flows: New Measures of
Globalisation of Production, Center for Research on Globalisation of Production, Working Paper 98/5
Goldar, Bishwanath (2000): “Employment Growth in Organised Manufacturing in India”,
Economic and Political Weekly, Vol. 35, No. 14, April 1 Goldar, Bishwanath (2002):‘Trade liberalization and manufacturing employment: The Case
India’, ILO 2002/34. Goldar, Bishwanath, and H.N. Saleem (1992), India’s tariff structure: Effective rates of
protection of Indian Industries, Studies in Industrial Development, Paper no. 5 (New Delhi, Ministry of Industry, Government of India) October.
Goldar, Bishwanth and Suresh Chand Aggarwal (2005), “Trade Liberalization and Price-cost
Margin in Indian Industries,” Developing Economies, 43, no. 3, September. Grosse, Robert and Len Trevino (1996), Foreign Direct investment in United States: An
Analysis by Country of Origin, JIBS, First Quater
Grubel, H. G., and P. J. Lloyd (1975) Intra-Industry Trade (London: Macmillan).
Hejazi W.and Safarian AE. (2003), Explaining Canada’s Changing FDI Patterns, Paper
presented in Canadian Economic Association, National Conference on policy.
25

26
Mehta, R. (1999), Tariff and Non-tariff Barriers of the Indian Economy: A Profile, Report, Research and Information System for the Non-aligned and Other Developing Countries, New Delhi.
Markusen James R. (1995), The Boundaries of Multinational Enterprises and the Theory of
International Trade, Journal of Economic Perspectives, 9,169-189. Markusen James R. and K. Maskus (2002), A Unified Approach to Intra-Industry Trade and
Foreign Direct investment” in Lloyd, P.J. and Lee, H.H. (eds), Frontiers of Research in Intra-Industry Trade (Houndmills: Palgrave and Macmillan).
Mundell, R. (1957), “International Trade and Factor Mobility,” American Economic
Review 47: 321-35. Nicita, A. and Olarreaga, M. (2001), Trade and Production, 1976-1999, Working Paper No.:
2701, Development Research Group, World Bank.
Nouroz, H. (2001). Protection in Indian manufacturing: An empirical study (Delhi,
MacMillan India Ltd). Pursell, Garry (1996), Indian Trade Policies since the 1991/92 Reforms, World Bank, mimeo. Veeramani, Choorikkad (2003), “Liberalisation, industry-specific factors and Intra-industry
trade in India,” Working Paper no. 97, Indian Council for Research on International Economic Relations, March.
Veeramani, Choorikkad (2004), “Trade liberalisation, multinational involvement, and intra-
industry trade in manufacturing”, Working Paper no. 143, Indian Council for Research on International Economic Relations, September 2004.
Worth T. (2002), Regional Trade Agreements and Foreign Direct Investment, Regional Trade
Agreements and U.S. Agriculture/AER-771 U 77

Appendix Table A.1: Inter-correlation matrix _______________________________________________________________________________________________ FDI IMRMSS IIT TARIFF NTB Output ROY R&D K/L
-----------------------------------------------------------------------------------------------
FDI | 1.0000
IMRMSS | -0.0602 1.0000
IIT | 0.0566 0.1527 1.0000
TARIFF | -0.0627 -0.1854 -0.1024 1.0000
NTB | -0.0303 -0.2504 -0.2296 0.1504 1.0000
Output | -0.0813 0.0664 0.0725 -0.2297 -0.1425 1.0000
ROY | 0.0719 0.0787 0.0485 0.0018 -0.0816 0.0074 1.0000
R&D | 0.0119 0.0762 0.0195 -0.0476 -0.0502 0.0040 0.0197 1.0000
K/L | 0.1426 -0.0567 0.0764 -0.0183 -0.0984 -0.0006 -0.0169 0.0074 1.0000
WS | 0.0065 -0.0342 0.0145 0.0479 -0.0386 -0.2505 -0.0804 -0.0380 -0.0014
IMPK | -0.0697 0.3177 0.0025 -0.1062 -0.0481 0.0062 0.0914 0.0688 -0.0273
EXP | 0.0209 0.3342 0.1559 -0.1144 0.0084 0.1067 -0.0404 0.0335 -0.0228 ________________________________________________________________________________________________
| WS IMPK EXP
----------------------------------------- WS | 1.0000
IMPK | -0.0200 1.0000
EXP | -0.0171 0.2822 1.0000 _________________________________________________________________________________________________
Note: For notation, see Table 4.