impact of two wheel vehicles on african combustion ... · impact of two wheel vehicles on ... in...
TRANSCRIPT
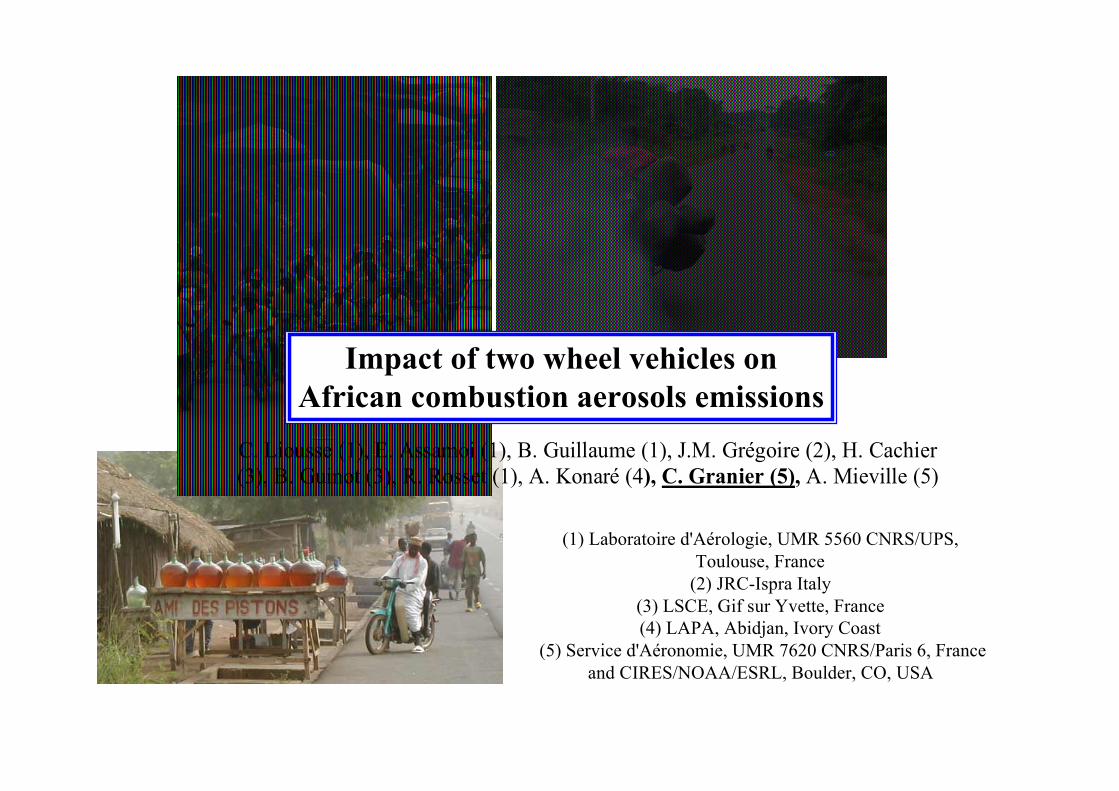
C. Liousse (1), E. Assamoi (1), B. Guillaume (1), J.M. Grégoire (2), H. Cachier
(3), B. Guinot (3), R. Rosset (1), A. Konaré (4), C. Granier (5), A. Mieville (5)
Impact of two wheel vehicles onAfrican combustion aerosols emissions
(1) Laboratoire d'Aérologie, UMR 5560 CNRS/UPS,Toulouse, France
(2) JRC-Ispra Italy(3) LSCE, Gif sur Yvette, France(4) LAPA, Abidjan, Ivory Coast
(5) Service d'Aéronomie, UMR 7620 CNRS/Paris 6, Franceand CIRES/NOAA/ESRL, Boulder, CO, USA
Anthropogenic pollution : a real concern over West African megacities…
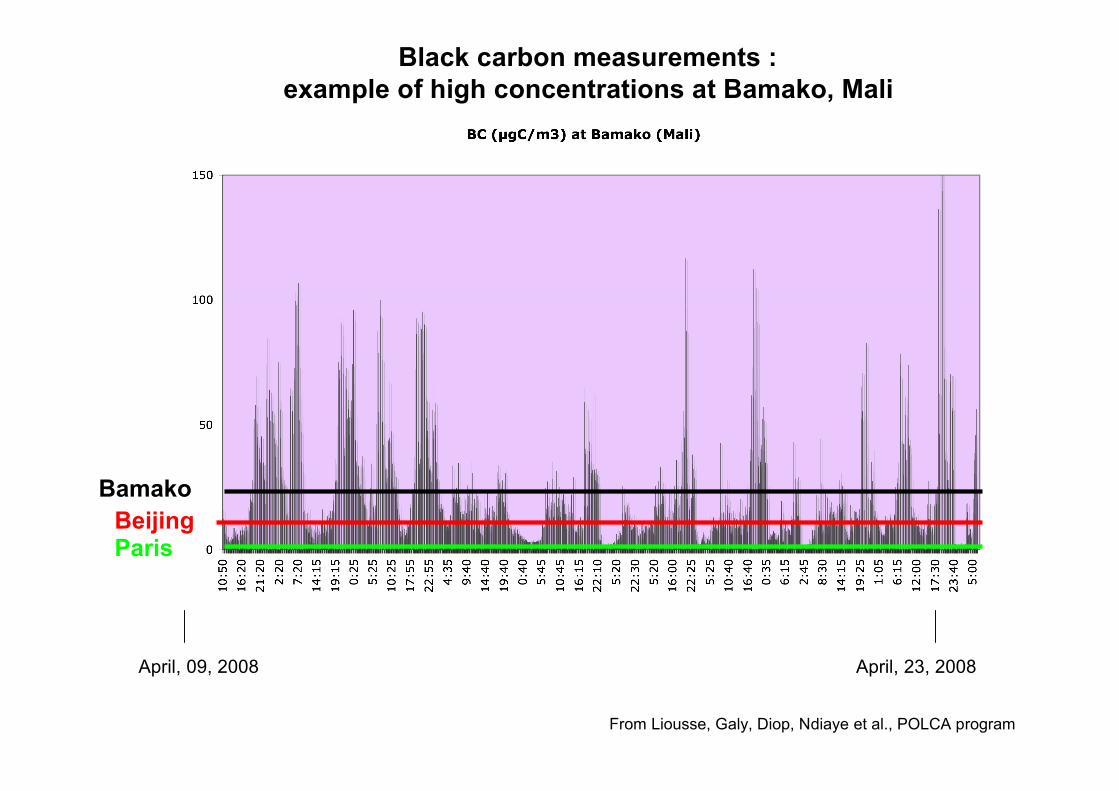
April, 09, 2008 April, 23, 2008
From Liousse, Galy, Diop, Ndiaye et al., POLCA program
BeijingParis
Black carbon measurements : example of high concentrations at Bamako, Mali
Bamako

Significanturban growth isexpected overWest Africa
Emission inventories for aerosols from fossilfuel and biofuel combustion sources exist only
for the global scale
Africa data are extracted from global model of emissions
Example: from Junker and Liousse,Atmospheric Chemistry and Physics (ACP), 2008
African Emissions are provided country by countrySpatialization is done by using the GISS population map
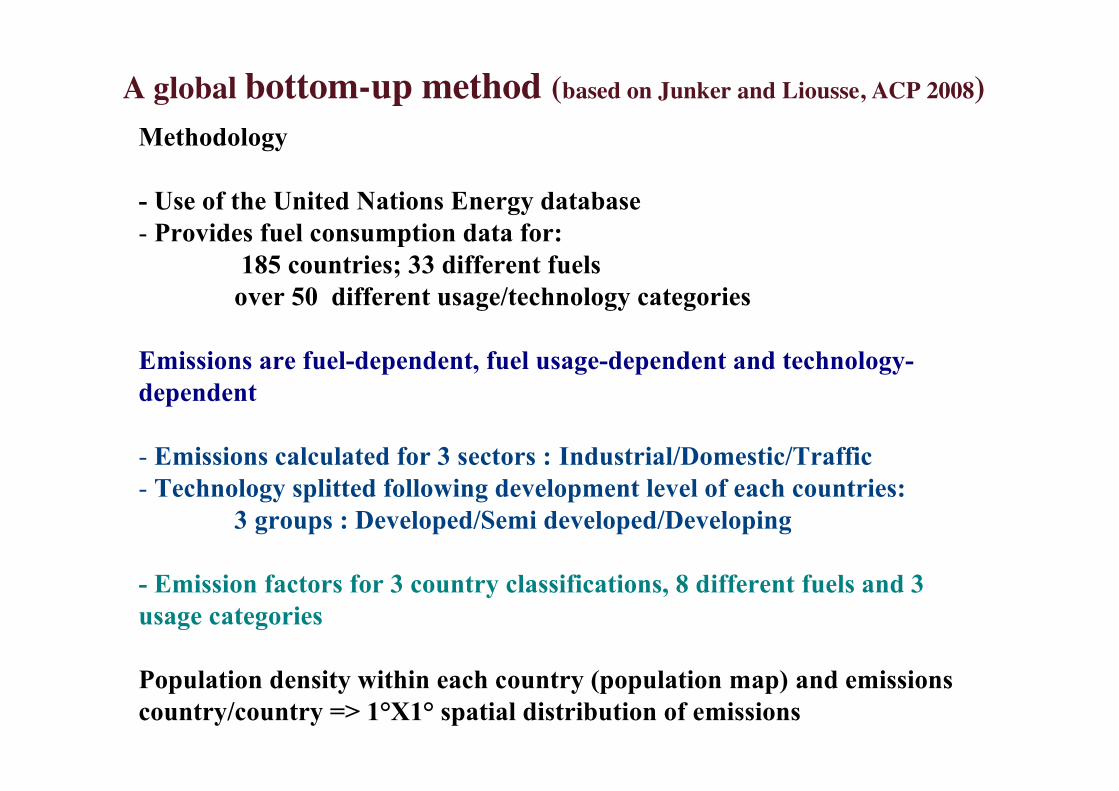
A global bottom-up method (based on Junker and Liousse, ACP 2008) Methodology
- Use of the United Nations Energy database- Provides fuel consumption data for:
185 countries; 33 different fuelsover 50 different usage/technology categories
Emissions are fuel-dependent, fuel usage-dependent and technology-dependent
- Emissions calculated for 3 sectors : Industrial/Domestic/Traffic- Technology splitted following development level of each countries:
3 groups : Developed/Semi developed/Developing
- Emission factors for 3 country classifications, 8 different fuels and 3usage categories
Population density within each country (population map) and emissionscountry/country => 1°X1° spatial distribution of emissions
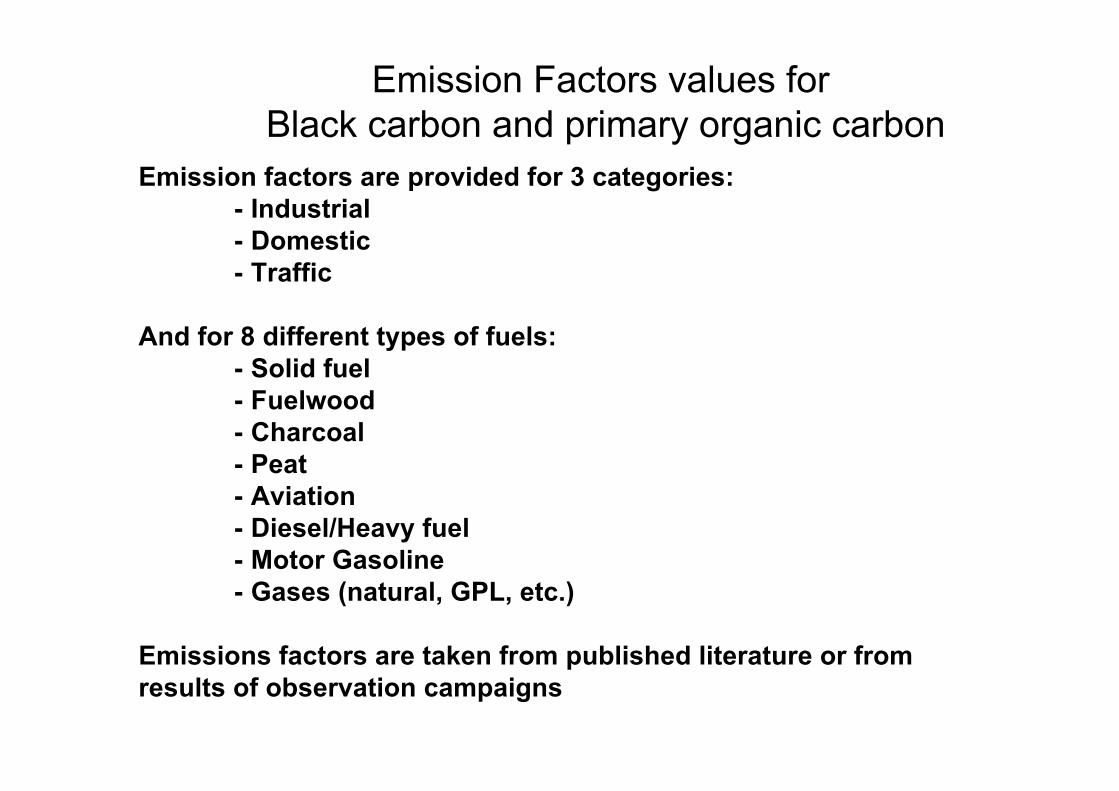
Emission Factors values for Black carbon and primary organic carbon
Emission factors are provided for 3 categories:- Industrial- Domestic- Traffic
And for 8 different types of fuels:- Solid fuel- Fuelwood- Charcoal- Peat- Aviation- Diesel/Heavy fuel- Motor Gasoline- Gases (natural, GPL, etc.)
Emissions factors are taken from published literature or fromresults of observation campaigns

Fossil fuel and biofuel combustions
0.64 Mt(BC)BC
Year 2000 Africa
0
BC (tons/1°x1°)
500 1000 50002500250
Total BC
Biofuel BCFossil fuel BC

African BC emissions by source types
Biomassburning
Biofuel combustions
Fossil fuelcombustions
2.28 Mt(BC)
0.44 Mt(BC) 0.20 Mt(BC)
0
BC (tons/1°x1°)
500 1000 50002500250 10000 25000
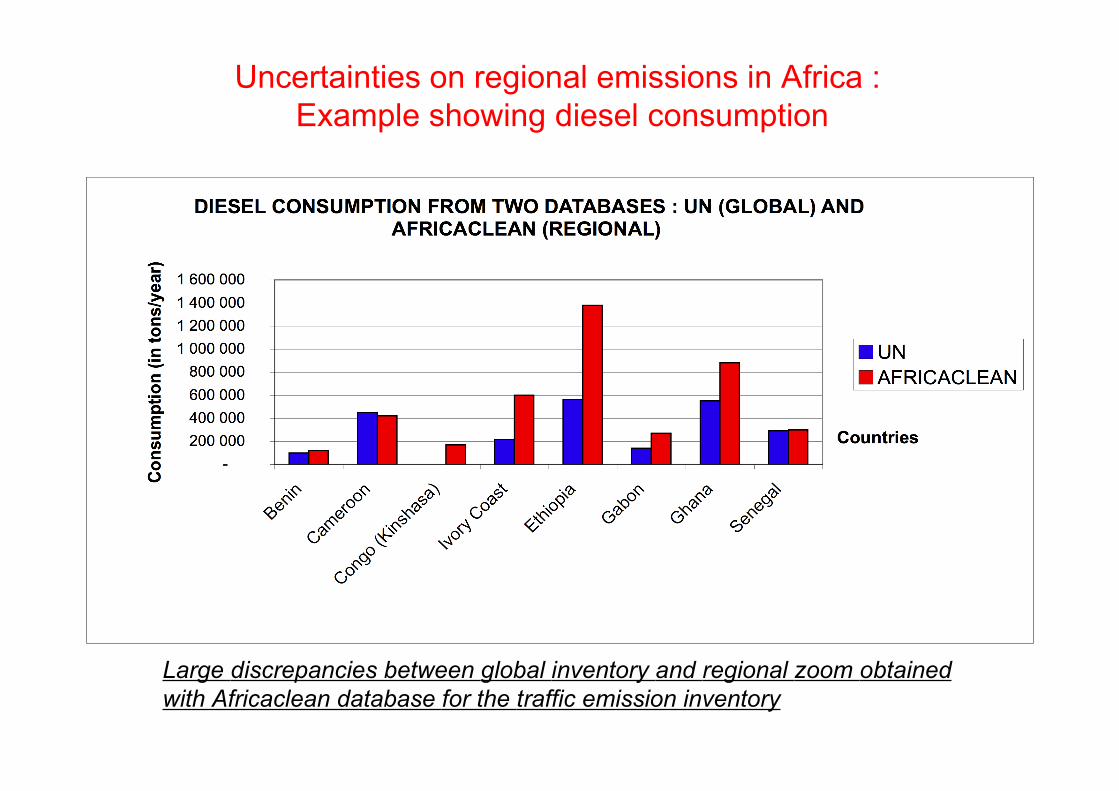
Uncertainties on regional emissions in Africa : Example showing diesel consumption
Large discrepancies between global inventory and regional zoom obtainedwith Africaclean database for the traffic emission inventory
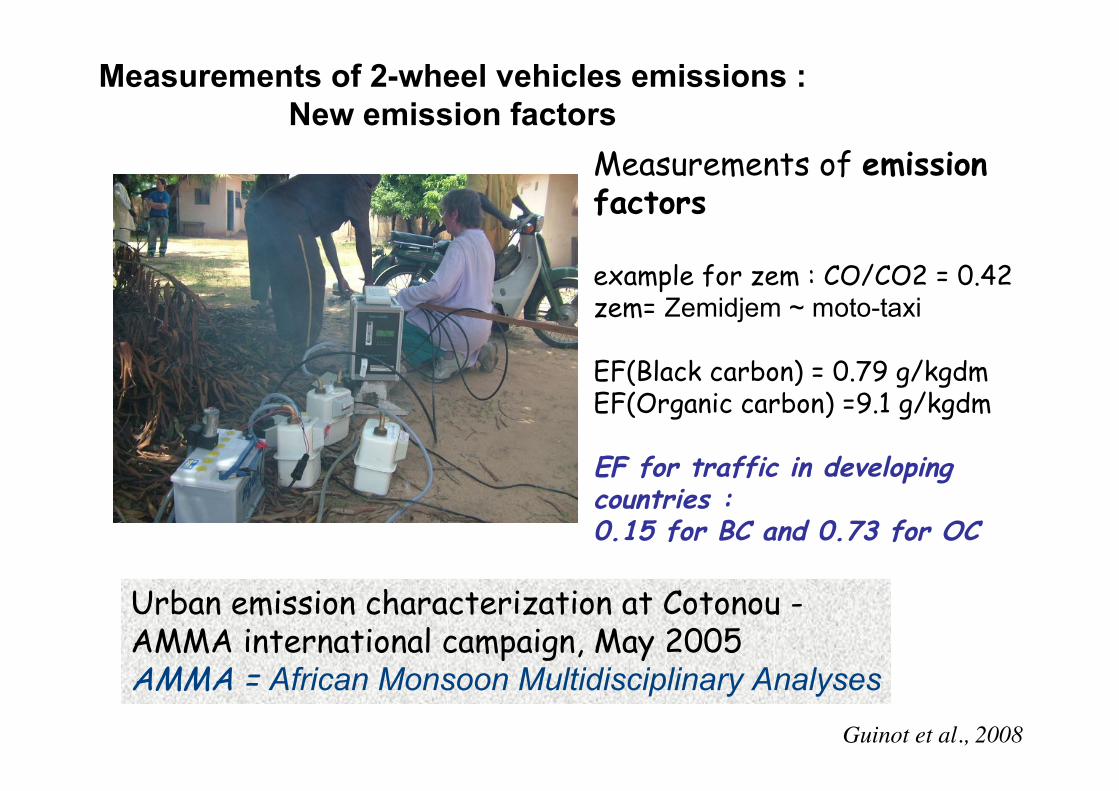
Urban emission characterization at Cotonou - AMMA international campaign, May 2005AMMA = African Monsoon Multidisciplinary Analyses
Measurements of emissionfactors
example for zem : CO/CO2 = 0.42zem= Zemidjem ~ moto-taxi
EF(Black carbon) = 0.79 g/kgdmEF(Organic carbon) =9.1 g/kgdm
EF for traffic in developingcountries :0.15 for BC and 0.73 for OC
Guinot et al., 2008
Measurements of 2-wheel vehicles emissions : New emission factors
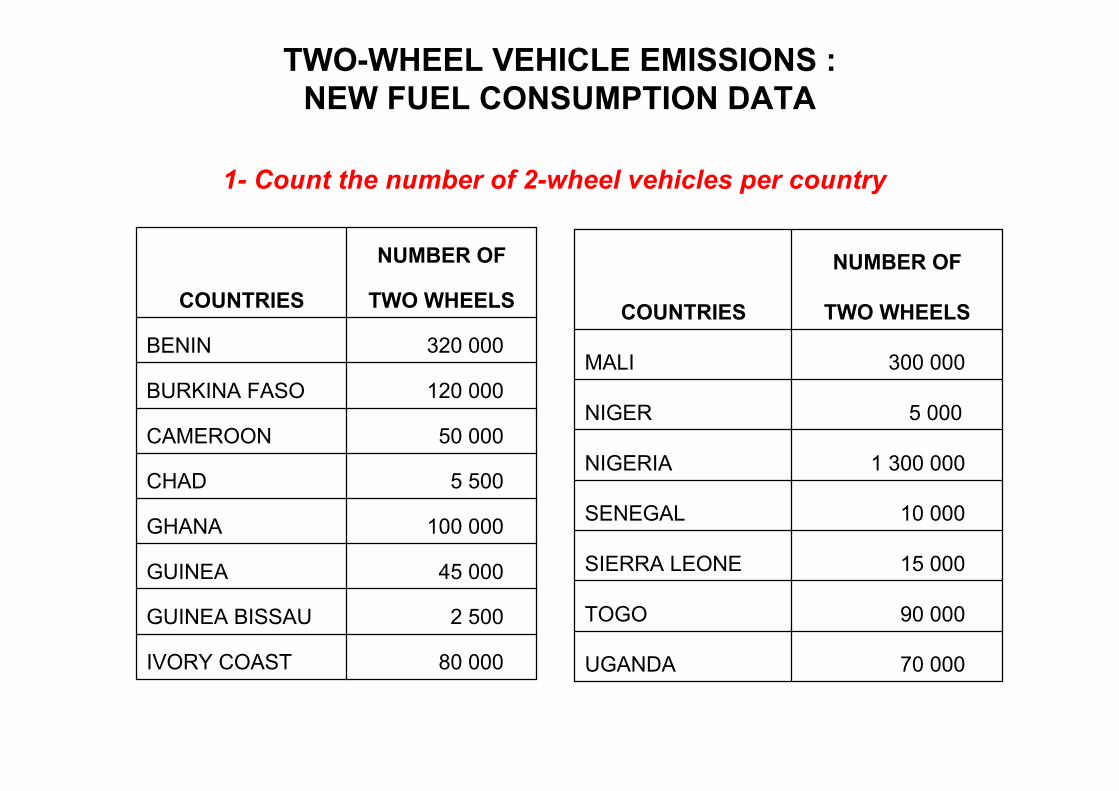
1- Count the number of 2-wheel vehicles per country
80 000IVORY COAST
2 500GUINEA BISSAU
45 000GUINEA
100 000GHANA
5 500CHAD
50 000CAMEROON
120 000BURKINA FASO
320 000BENIN
TWO WHEELS
NUMBER OF
COUNTRIES
70 000UGANDA
90 000TOGO
15 000SIERRA LEONE
10 000SENEGAL
1 300 000NIGERIA
5 000NIGER
300 000MALI
TWO WHEELS
NUMBER OF
COUNTRIES
TWO-WHEEL VEHICLE EMISSIONS :NEW FUEL CONSUMPTION DATA

25% oil : ρ = 776.254% oil : ρ = 754.2Fuel volumic mass(kg/m3)
BC = 0.79OC = 9.10
BC = 0.79OC = 9.10
BC = 0.55OC = 2.55
Emission factors(g/kg)
6341Daily consumption(liters)
7 days per week5 days per weekNumber of days ofusage
« zemidjans»
“clean” twowheels
« zemidjans »
“clean” twowheels
“high” scenario“low” scenario
2) Asumptions for a “low” and a “high” scenario

8.1 E+06
• minimum low scenario : Senegal 0,6 %• maximum low scenario : Mali 66 %
IMPORTANCE OF FUEL CONSUMPTION VALUES(TONS PER YEAR) DUE TO TWO-WHEEL VEHICLES
Comparison with data for total traffic (UN)
• minimum high scenario : Senegal 3 %• maximum high scenario : Mali 279 %
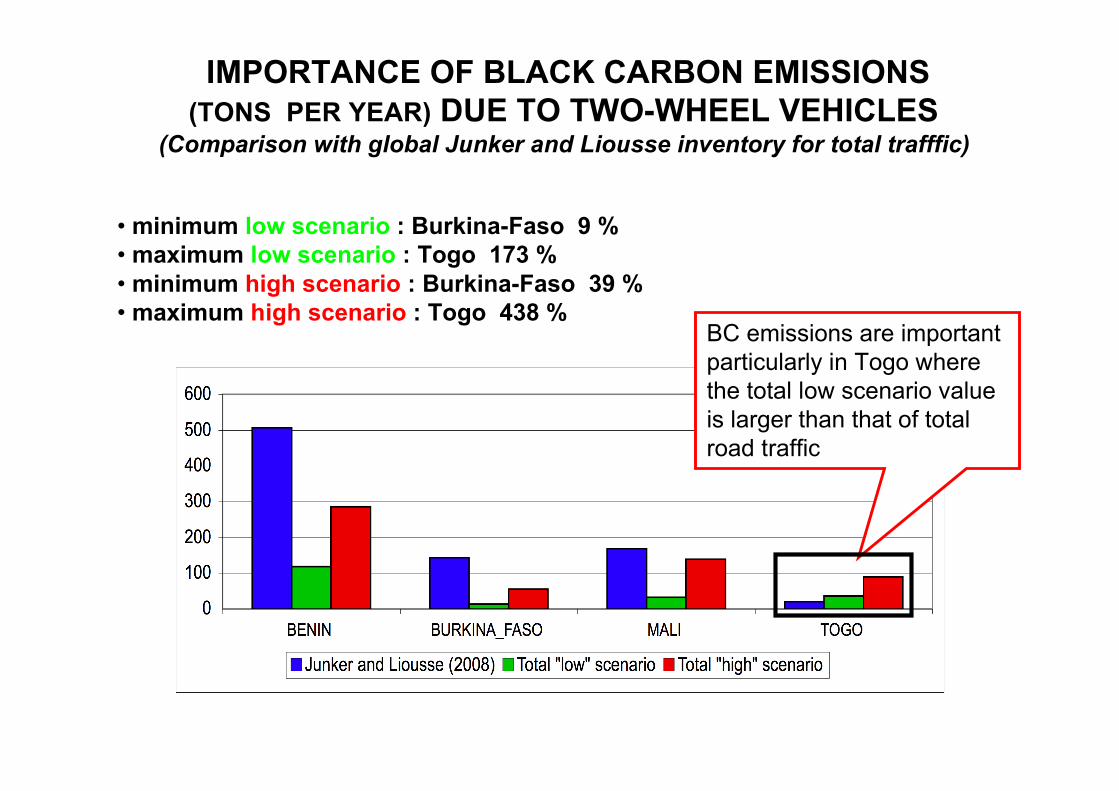
• minimum low scenario : Burkina-Faso 9 %• maximum low scenario : Togo 173 %• minimum high scenario : Burkina-Faso 39 %• maximum high scenario : Togo 438 %
IMPORTANCE OF BLACK CARBON EMISSIONS (TONS PER YEAR) DUE TO TWO-WHEEL VEHICLES
(Comparison with global Junker and Liousse inventory for total trafffic)
BC emissions are importantparticularly in Togo wherethe total low scenario valueis larger than that of totalroad traffic
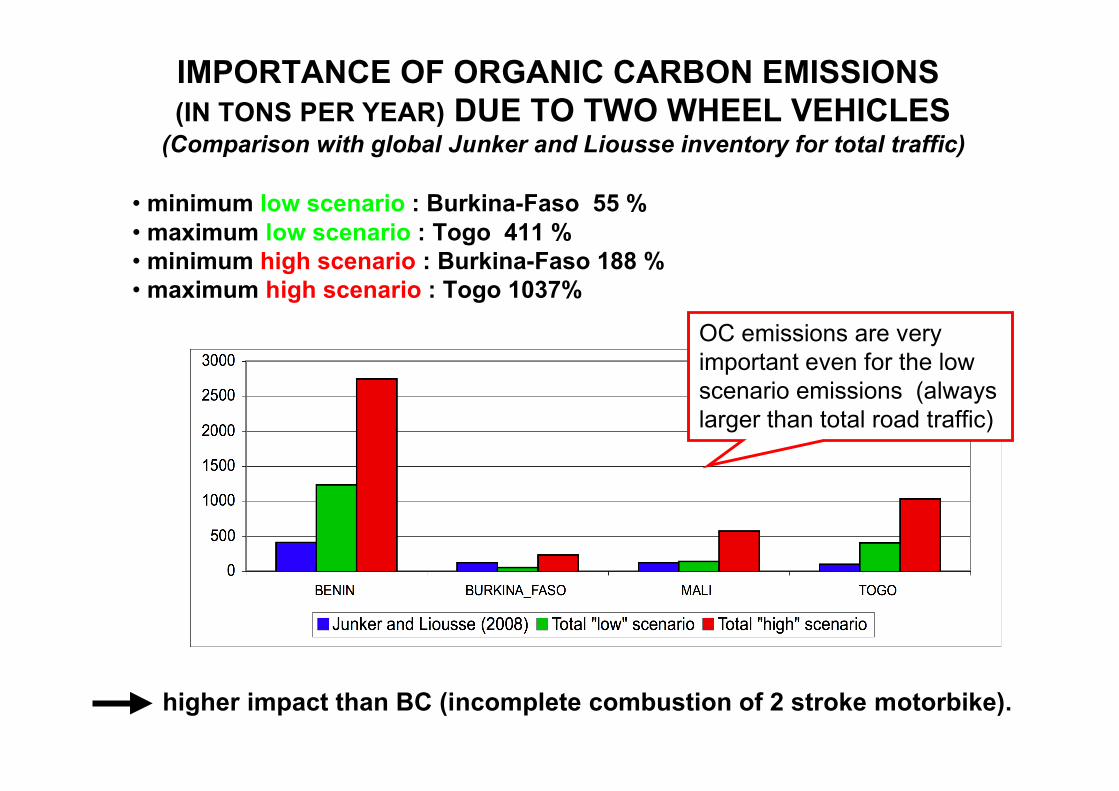
• minimum low scenario : Burkina-Faso 55 %• maximum low scenario : Togo 411 %• minimum high scenario : Burkina-Faso 188 %• maximum high scenario : Togo 1037%
IMPORTANCE OF ORGANIC CARBON EMISSIONS (IN TONS PER YEAR) DUE TO TWO WHEEL VEHICLES
(Comparison with global Junker and Liousse inventory for total traffic)
higher impact than BC (incomplete combustion of 2 stroke motorbike).
OC emissions are veryimportant even for the lowscenario emissions (alwayslarger than total road traffic)

OC Emissions differences between the Junker and Liousse (2008)inventory and the current study including 2-wheel vehicles
in tons/year
This work shows the importance of specific regional characteristics
Red indicates countrieswhere two-wheelvehicles dominate andblue countries wherethey are relatively lessimportant.
BeninTogo
Nigeria
Mali
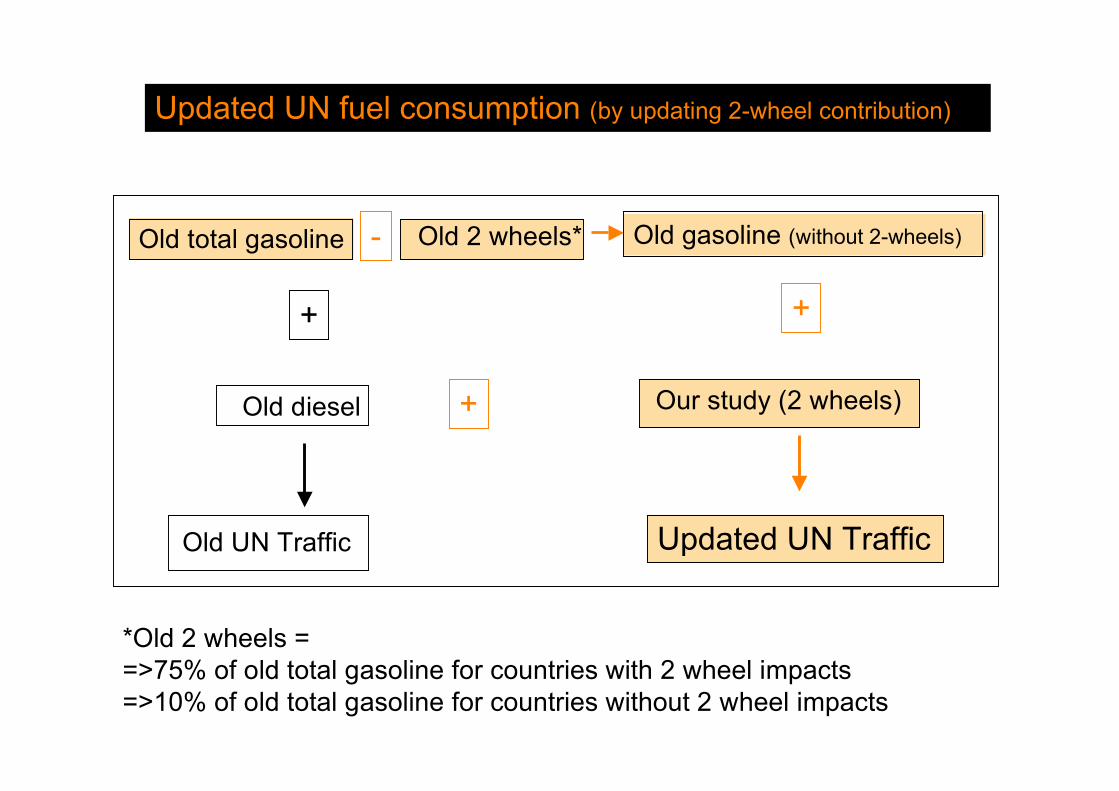
Updated UN fuel consumption (by updating 2-wheel contribution)
Old diesel Our study (2 wheels)
Updated UN TrafficOld UN Traffic
+
Old total gasoline Old gasoline (without 2-wheels) Old 2 wheels*
+
+
-
*Old 2 wheels ==>75% of old total gasoline for countries with 2 wheel impacts=>10% of old total gasoline for countries without 2 wheel impacts
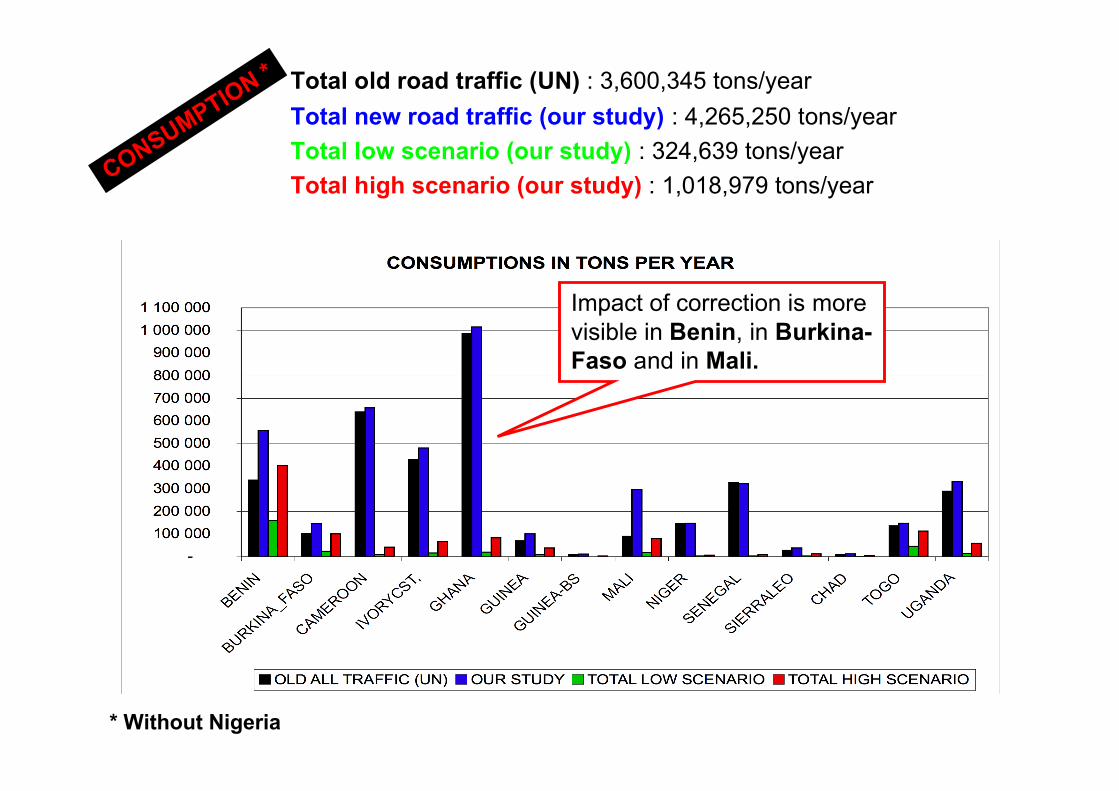
Total old road traffic (UN) : 3,600,345 tons/yearTotal new road traffic (our study) : 4,265,250 tons/yearTotal low scenario (our study) : 324,639 tons/yearTotal high scenario (our study) : 1,018,979 tons/yearCONSUMPTION *
Impact of correction is morevisible in Benin, in Burkina-Faso and in Mali.
* Without Nigeria

Updated BC and OC inventory (by updating 2-wheel contribution)
Old BC and OC diesel Our study (2 wheels)
Updated BC and OC trafficOld BC and OC Traffic
+
Old UN gasoline Old gasoline (without 2-wheels)and old EF (JL2008)
Old UN 2 wheels*
+
+
-
*Old 2 wheels ==>75% of old total gasoline for countries with 2 wheel impacts=>10% of old total gasoline for countries without 2 wheel impacts
Old UN gasolineand old EF (JL2008)
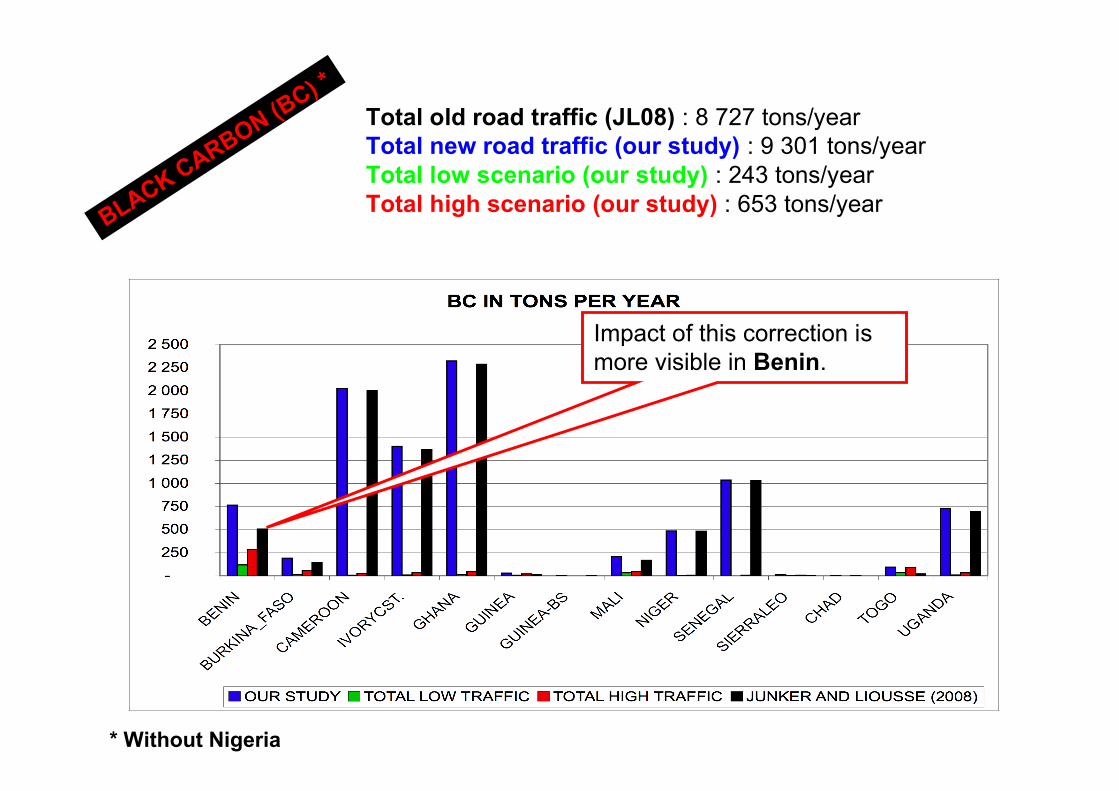
Total old road traffic (JL08) : 8 727 tons/yearTotal new road traffic (our study) : 9 301 tons/yearTotal low scenario (our study) : 243 tons/yearTotal high scenario (our study) : 653 tons/yearBLACK CARBON (B
C) *
Impact of this correction ismore visible in Benin.
* Without Nigeria

Total old road traffic (JL2008) : 5616 tons/yearTotal new road traffic (our study) : 10 577 tons/yearTotal low scenario (our study) : 2 021 tons/yearTotal high scenario (our study) : 5 345 tons/year
ORGANIC CARBON (OC) *
High impact in OC emissions.Total increase by 2.
* Without Nigeria

OLD OC EMISSIONS (JL - 2008)
in tons/year
NEW OC EMISSIONS CORRECTED (our study)
OC EMISSIONS BIOMASS BURNING (2000)
in tons/year
28 548 tons/year
14 085 tons/year 1 332 037 tons/year
A new hot spot of anthropogenicemissions in the coast of Guinean Gulfand north of Nigeria appears.
New corrected OC emissions are 2 times higherthan old (and 10 times smaller than the west africanbiomass burning emissions (instead of 20 before))
(Liousse et al. 2008 – Amma program)

CONCLUSIONS
Large underestimates of fuel consumption in the West African region inthe global database.
This work focused on two-wheel emissions shows the need to integrateAfrican specifities in BC and OC emissions (both on fuel consumption andemission factors).
More generally all traffic emissions need to be updated not only two-wheels but also for trucks and bus for Gasoline and also for Diesel.
A new emission hub is shown centered on the coast of Guinean Gulfand north of Nigeria this hub is expected to increase in futureprojections if no traffic regulation is taken.