impact of use of farming technology on livelihood of …
TRANSCRIPT

IMPACT OF USE OF FARMING TECHNOLOGY ON LIVELIHOOD OF SMALL-
SCALE DAIRY FARMERS IN LONGISA, BOMET COUNTY, KENYA.
BY
WILBERFORCE KIPNGETICH MUTAI
A Research Project Report Submitted in Partial Fulfillment of the requirement for the
award of the degree of Master of Arts in Project Planning and Management of the
University of Nairobi.
2018

Declaration
This research project is my original work and has not been presented for a degree or any
award in any University.
…………………… ……………………………… ……………………………..
WILBERFORCE KIPNGETICH MUTAI
L50/ 5782/2017
The research project has been submitted for examination with my approval as University
supervisor.
……………………………………………………. …………………………………
Prof. Justus O. Inyega
Associate Professor, Science Education
UNIVERSITY OF NAIROBI.
DEDICATION
This research project is dedicated to my parents (Ronald and Teresiah), wife (Caroline) and
children (Kipchirchir, Kiplangat and Cheptoo).
ii

ACKNOWLEDGEMENT
I would like to express my sincere gratitude to my supervisor, Prof. Justus O. Inyega, for his
thoughtful guidance and support throughout my study. I was able to learn a great deal under
his mentorship. I would also like to thank Dr. Moses. M. Otieno, of the Coordinator
University of Nairobi for mentoring me during my postgraduate studies. In addition, I would
like to thank Classmates, Michael Cheruyot and Richard Langat, for their material support. I
also would like to appreciate my family members for their moral support. Many thanks also
go to the participants sampled for the study for their cooperation during the study. Farmers,
agricultural officers and provisional officer who contributed to success of my research
program.
iii

Table of
DECLARATION..................................................................................................................................ii
DEDICATION....................................................................................................................................iii
ACKNOWLEDGEMENT...................................................................................................................ii
LIST OF TABLES...............................................................................................................................ii
LIST OF FIGURES.............................................................................................................................ii
ABBREVIATION AND ACRONYMS..............................................................................................ii
ABSTRACT..........................................................................................................................................1
CHAPTER ONE:INTRODUCTION.....................................................................................................2
1.0 Background of the Study..............................................................................................................2
1.1 Statement of the Problem.............................................................................................................5
1.2 Purpose of the Study.....................................................................................................................5
1.3 Research Objectives.....................................................................................................................5
1.4 Research Questions......................................................................................................................5
1.5 Significance of the Study..............................................................................................................6
1.6 Basic Assumptions of the Study...................................................................................................6
1.7 Limitations of the Study...............................................................................................................6
1.8 Delimitations of the Study............................................................................................................7
1.9 Definitions of Significant Terms..................................................................................................7
1.10 Organisation of the Study...........................................................................................................8
CHAPTER TWO: INTRODUCTION...................................................................................................9
2.2 Use of Dairy Farming Technology inMilk Production....................................................................9
iv

2.3 Theoretical Framework for the Study…………. ………………… .……... ..........13
2.3.1 Innovation Diffusion Model........................................................................................................14
2.3.2 Economic Constraint Model.......................................................................................................14
2.3.3 Adopter Perception Paradigm.....................................................................................................14
2.4 Conceptual Framework for the study.............................................................................................15
2.5 Summary of the Review Related Literature...................................................................................19
CHAPTER THREE: RESEARCH METHODOLOGY...................................................................20
3.0 Introduction....................................................................................................................................20
3.1 Research Design.............................................................................................................................20
3.2 Target Population...........................................................................................................................20
3.3Sample Size and Sampling Procedure.............................................................................................21
3.4 Data Collection Instruments...........................................................................................................23
3.5 Reliability and Validity of Instruments..........................................................................................23
3.5.1 Instrument Validity.....................................................................................................................23
3.6 Data Collection Methods ………………………………………………………………24
3.6 Data Analysis Methods..................................................................................................................25
3.7 Operational Definitions of Variables.............................................................................................25
CHAPTER FOUR::DATA ANALYSIS, INTERPRETATION AND PRESENTATION.................28
4.0 Introduction................................................................................................................................28
4.1 Participant Response Rate in The Study in Longisa Sub County..............................................28
4.2 Background of Sampled Small Scale Farmers in Longisa Sub County.....................................29
v
4.3 Impact of Education on Use of Dairy Technology by Small Scale Farmers in Longisa
Sub-County.......................................................................................................................................31
4.4 Credit Facilities availble to Small Scale Farmers in Longisa Sub-County, Bome.....................33
4.5 Milk Market Availability in Longisa Sub County......................................................................35
CHAPTER FIVE: SUMMARY OF FINDING, DISCUSSION, CONCLUSION AND
RECOMMENDATION.......................................................................................................................39
5.0 Introduction................................................................................................................................39
5.1 Summary of Findings.................................................................................................................39
5.2 Conclusion..................................................................................................................................41
5.3 Recommendations......................................................................................................................44
5.4 Suggestion for Further Studies...................................................................................................44
REFERENCES.....................................................................................................................................43
APPENDICES
Appendix 1: Questionnare for Small Scale Dairy Farmers..................................................................48
Appendix 2: Questionnare for Agricultural Officer.............................................................................53
Appendix 3: Questionnaire for milk collectors………………………………………………59
appendix 4 obsrvation check list…………………………………………………………… 61
Appendix 4: Reseach Permission ……………………………….………………………… ..62
vi
List of Tables
Table 1: Sample of Small Scale Farmers, Agricultural Officers and Milk Collectors in
Longisa Sub-County ……………………................................................................................22
Table 2: Operational Definition of Variables……….………………………………………..26
Table 4.1: Questionnaire Response Rate by Small Scale Farmers in Longisa Sub-
County………………………………………………………………………………………..28
Table 4.2: Distribution of Small Scale Dairy Farmers in Longisa Sub-County by
Gender………………………………………………………………………………………..29
Table 4.3: Age Distribution of Small Scale Dairy Farmers in Longisa Sub- County ……….30
Table 4.4: Small Scale Dairy Farmers’ Experience in Longisa Sub County ………............ 30
Table 4.5: level of education of small scale dairy farmers in Longisa Sub-County………....31
Table 4.6: Small Scale Farmers’ Source of Information in Longisa Sub County …………...3
sources of loan for small scale farmers in Longisa Sub-County
Table 4.8: Distribution of farmers by Credit Facilities……………………………................34
Table 4.9: Dairy Farmers’ view about Availability of Milk Markets in Longisa Sub County35
Table 4.10 Distribution of Dairy Farmers’ Use of Breeding Technology in Longisa Sub
County…………………………..………………... ………….………………………..35
Table 4.11 Number of Farmers Using Feeding Technology in Longisa Sub County
………………………………………………………………………………………………..36
vii
Table 4.12 Amount of Litres of Milk Produced in Litre per Cow in Longisa Sub-
County.37
Table 4.13 Comparison of Small Scale Dairy Farmers Milk Production Before and
After Use of Technology…………………………………………………………37.
viii

List of Figures
Figure 1: Conceptual frame work for the study
ix
ABBREVIATION AND ACRONYMS
ADC Agricultural Development Corporation
AI Artificial Insemination
AMR Automatic Milking Rotary
FAO Food and Agricultural Organization
GDP Gross Domestic Product
ILRI International Livestock Research Institute
KDB Kenya Dairy Board
RFID Radio Frequency Identification Device
WHO World Health Organization
x

AbstractThe study focused on impact of use of dairy farming technology on small-scale dairyfarmers’ livelihood in five wards in Longisa sub-County: Kembu, Merigi, Chemaner,Kipreres, and Longisa. An ex post facto research design was used in the study. 128 small-scale dairy farmers, two agricultural officers and ten milk collectors (drivers) were randomlysampled for the study. Data were collected using questionnaires, observations and documentanalysis. Data were analyzed using descriptive statistics and t-test procedure. It was foundthat there is a significant difference between farmers who adopted dairy farming technologyand those who did not (t(106) = -15.2240, p = 0.000) indicating that there is improvement inmilk production for farmers who utilise the farming technology. In addition, the studyestablished that the small-scale dairy farmers’ level of education plays a major role inadoption of farming technology, use of credit and milk market facilities leading to enhancedincome and positive impact on the farmers’ livelihoods. The study findings have implicationson Agricultural Education and Extension Officers, rural dairy farmers, Farmers’ TrainingCentres and teachers of agriculture in schools.
16
CHAPTER ONE: INTRODUCTION
1.0 Background of the Study
International livestock research institute, World Bank, coded livestock to be the most
highly valued in market with fastest development (World Bank, 2008). In a study done
in the East Mediterranean region of Turkey, a direct relationship was found among
improved dairy breed, investment, age of farmer to adoption of technology in dairy
farming (Boz, Akbay, Bas, Budak, 2011). In a study done in the Erzurum province of
Turkey, a statistically meaningful relationship was found between education status,
animal breed and subsidy benefits; and the innovation adoption of dairy farmers
(Aksoy, Kuleka, and Yavuk, 2001). However on both studies no relationship was
depicted among the studied elements and market availability, credit facilities and
extension services provided to small scale farmers.
An adoption of technology has greatly changed genetic and reproductive performance
of dairy animals. Technology such as AI, Embryo transplant, and sexed semen
technology have drastically improved milk production. Farmers are able to control
cows lactation period, improve breed and control herds (Aditya. 2001). The same
technology has been used in Longisa sub-county therefore factors influencing it
adoption have to be studied.
A research conducted in India, established that there was a relationship in extension
service, income of farmer, age of farmer, education level, and operation land holding to
adoption of technology in dairy farming (Cukur,2016) it was concluded that adoption of
dairy farming technologies by rural women in India, was related to milk marketing
channels, veterinary, health education ,economic, motivation social participation,
fodder, incentive, attitude, awareness, extension support and knowledge (Halakatti
Sassan, and Kamaraddi. 2007). The study is very extensive and it gave detailed
2
knowledge on most technologies applied by dairy farmers. A replica research is
necessary to be conducted in Bomet County.
In Malawi it was found that adoption of technology in dairy depend on milk yield and
extension visit (Tebug, Chekegwa and Wiedemamn. 2012) .The study actual depicted
an inverse decision making procedure. Farmers should be working towards improving
productivity not utilizing technology after getting positive results.
According to Akudugu, Ciuo and Dadzie (2011), the adoption of dairy technology
depends on extension service, access to credit facilities and expected benefits on the
technology. Research conducted on agricultural productivity and policy change in nine
Sub- Saharan African countries namely Angola, Nigeria, Ghana, Mozambique, Guinea,
Cameroon, Mali, Zambia, and Ethiopia indicated that structural adjustment on policies
that led to implementation of more favourable new agricultural technologies, effective
application of input led to significant change on output (Stall and Kaguongo. 2008).
The research did not address economic issues affecting farmers such as credit facilities
and market.
In study performed on Ethiopia it was concluded that adoption of dairy technology by
dairy farmers depends on owning agricultural land and availability of credit facilities.
Dairy production in Ethiopia is mostly subsistent type and rearing indigenous breeds
with low productivity (Azage and Alemu, 1998). The study did not actually explain
implication of any technology application in dairy farming
An extensive research was conducted in three districts of coast province Kilifi, Kwale
and Malindi these are the homeland of Mijikenda who have potential of be medium
scale dairy farmers. They have been implementing dairy production program before
and modern technologies application. The findings were there was no relationship
between labour availability and technology application, feeding procedure, and
3
therefore, production was hinder by lack of rainfall. Dairying farming is one the most
lucrative farming practice, with high return; it is the best means of eradicating poverty
if it is well utilized. The high population growth has resulted in immense demand for
milk both in rural and urban set up (ILRI, 2007).
The background study has identified that there is need to undertake a similar research in
Longisa sub county Bomet county Kenya to identify the impact of adoption of dairy
farming technology on livelihood of small scale farmers.
In Nyandarua, a research conducted indicated that government support in terms of
training, infrastructure development, disease control, financial support and breeding is
wanting. Therefore milk production has declined (Kamau and Gitau, 2001). It could be
the same treatment, farmers in Bomet are receiving therefore, and a research needs to
be conducted.
Returns in small scale dairy farming is very minimal; Cost of feeding, breeding,
transport is very expensive and hardly do farmers get to break-even point. Gain is only
realised during festive season and period of drought (Halake and Mamo, 2013)
Factors of production such as labour utilization, training, feeding, breeding, skill
labour effect economic benefit of zero grazing dairy farming (Langat Dennis, 2011).
The studies which have been conducted by different scholars have never captured Longisa
Sub-County .Longisa been a dairy farming area in Bomet county a study was need to be
undertaken to establish impact of dairy farming technology on livelihood of small scale dairy
farmers. The study findings have implications on Agricultural Education and Extension
Officers, rural dairy farmers, Farmers’ Training Centres and teachers of agriculture in
schools.
4
1.1 Statement of the Problem
Currently there is no document showing the influence of use of dairy farming
technology on the livelihood of small scale farmers in Bomet County .A research was
conducted to identify factors affecting adoption of technology in dairy farming.
It was therefore necessary for research to be conducted to establish the impact of use of
dairy farming technology on livelihood of small scale farmers in Longisa Sub-County,
Bomet County. The variables are education level of dairy farmers, availability of credit
facilities and market availability.
1.2 Purpose of the Study
The purpose of the study was to establish the impact of use of dairy farming technology
on livelihood of small scale dairy farmers in Longisa Sub-County, Bomet County,
Kenya.
1.3 Research Objectives
The research study was guided by the following objectives:
i. To determine the impact of level of education on livelihood of small- scale dairy
farmers.
ii. To establish how availability of credit facilities influence small scale dairy
farmers livelihood.
iii. To establish the influence of availability of milk markets on small- scale dairy
farmers livelihood
1.4 Research Questions
This research was guided by the following research questions:
i. To what extent does level of education influence the livelihood of small scale
dairy farmers?
5

ii. To what extent does availability of credit facilities impact on small scale dairy
farmers’ livelihood?
iii. How does milk market availability impact on small scale dairy farmers
livelihood?
1.5 Significance of the Study
Agriculture is a backbone of Kenya hence a decline in, standstill of production in any
agricultural sector affect income for both the dairy farmer and government. The
research will give government a limelight on where to invest to improve dairy
productivity .The information will be useful to dairy farmer and gauging and strategies
on how to improve their production. The study will be useful in prioritization,
implementation, distribution and allocation of resource to dairy projects in the area by
agricultural officers; it will be also useful in policy marking, planning regarding
extension services and financial support.
1.6 Basic Assumptions of the Study
During the study factors such as land dispute, infrastructures, was considered to be
homogenous to all farmers and government policies will not change during the period
of study. During the study it was assumed that element as market dynamics,
infrastructure, culture are constant. Also the instruments were assumed to be valid and
reliable to give the demanded results and respondent will give accurate information
inference
1.7 Limitations of the Study
This research challengers; these include the geographical vastness of the area under
study, unavailability and unwillingness of despondence and illiteracy of despondence.
The above hindrance was minimised by using a fast means of drop-collect of
6

questionnaires and using of observation checklist to support the collected data. The
unwillingness, unavailability and illiteracy of despondency though will affect the data
collected it assumed that the results will be enough to give reliable data.
1.8 Delimitations of the Study
The study was delimited to 128 small scale dairy farmers, 2 agricultural extension
Officers and ten milk collectors in Longisa Sub-County, Bomet County, Kenya. The
variable, influencing use of dairy technology by small scale dairy farmers; the level of
education, availability of credit facilities and market availability to dairy farmers was
focussed on.
1.9 Definitions of Significant Terms
Dairy Technology: Refer to use of no-traditional dairy farming tools, animal
husbandry, and milk handling and feeding of dairy
animals.
Dairy Farming- This term has been used here to refer to the small-scale
cattle milk producers
Small-scale Dairy Farmer – These are farmers keeping dairy cows with a herd
of less than five cattle. In this research therefore farmers
with a herd of less than five cattle irrespective of the
breeds were considered to be small-scale farmers.
Dairy: Means cattle kept for milk production.
Level of education: This is the skill, experience, general knowledge and
awareness of animal husbandry.
7
Credit facilities: It financial support either from financial institution,
Sacco and government.
Market availability: It is market distance and customer ready to buy
milk.
Livelihood: living standard of small scale farmers
1.10 Organisation of the Study
The study is organized in five chapters. Chapter one features background of the study,
statement of the problem, purpose of the study and objective of the study. It also
composed of research questions, significance of the study, limitation of the study,
basic assumptions of the study, sampling procedure, limitation and delimitation of the
study and definition of terms. It furthers look on the conceptual frame work and
finally the summery of the literature review. Chapter three contain the research
methodology of the study, it also describes the research design, target population,
sampling procedure, rules and techniques of data collection, pretesting, data analysis,
ethical consideration and finally definition of variables. Chapter four contain
questionnaires respond rate, distribution of respondent, correlation between variables
and data analysis. Chapter five contain summary of findings, conclusion,
recommendation and suggestion for further studies.
8
CHAPTER TWO: REVIEW OF RELATED LITERATURE
2.0 Introduction
This chapter discussed how level of education, availability of credit facilities, extension
services and market availability influence adoption of technology by small scale
farmers.
2.1 Livelihood of Small Scale Dairy Farmers
The Grameen Bank (GB) identified small scale dairy farming as the best means of
eradicating poverty. The bank facilitated the farmers in acquiring means of earning
Chowdhury, (1989). In both rural and semi- urban settlement the farming is very useful
in providing income as well as food to the farmers. There is a great relationship
between the dairy farming and livelihood of those who practice it (Paul 1996).
Poverty is rampant in rural areas, an intervention by government NGOs have been
initiated to reduce poverty level by encouraging small scale farmers to adopt dairy
technology. The initiative which have been undertaken include; introduction of improve
breed of dairy animals, financial support and providing training facilities.
Economic liberalisation in the 1900s saw sudden growth of private milk processing
plants, which killed the state own Kenya Co-operative Creameries which supported
small scale dairy farmers. This directly affected the living standard of small scale dairy
farmers (Karanja, 2003). Income from dairy farming was able to provide school fees,
food, medical care and clothing to small scale dairy farmers.
2.2 Use of Dairy Farming Technology on Milk Production
Application of reproductive and breeding technologies have a major impact on breeding
program genetic gain and dissemination of genetic gain in dairy animals’ production.
According to Shook, (2006), genetic has accounted for 55% of gain of the yield traits
16

and a third of change of time interval required to conception. This can be accomplished
through Artificial Insemination, sexed and traditional methods
. Dry matters which are balanced diet are good for dairy livestock (Idel, 2014). The cost
of industrial or concentrate feeds are in most cases unreachable by small scale farmers
especially in Kenya where animals and human beings are competing for food. This
advocate for homemade fodder, fodder is major food stuff for dairy animals. These are
green animals feed cut and semi dried Hay making is another way of storing food;
green matter, edible by animals are cut and moisture content reduced to a level which
cannot rot and fermented with little or no oxygen.( Idel 2014). The Adoption of
innovation as an idea, practice or object perceived as new by an individual, while
diffusion is the process through which the new idea spreads from a source – its original
invention by a creative individual to its adoption by users. Adoption implies a decision
to continue full use of the idea as distinct from a decision merely to try it, because of
the benefits / advantages accruing from adopting technology. Ogionwo, (1982) argues
that the more innovative the farmers are the better off the they become in terms of farm
income and high level of living, implying that farmers with great resources are likely to
take the risks involved in going over to a new practice. Rogers, (1968) indicate that the
relative advantage of innovation, that is positive related to adoption of the practice,
could be economically profitable or the new idea minimizes the costs. Rostow (1960)
argues that revolutionary changes in agricultural productivity are essential conditions
for successful take-off of economic growth of society. Chitere (1994) concurs with this
argument and indicates that the adoption of technology of the community members will
definitely bring social change in a given community. According to Chitere(1994),
innovations could be introduced to a few members of a social unit, for example a rural
10

village, then from these few members the innovations could diffuse, trickle down or be
communicated to other members of the social unit.
Adoption of technology involves application of mental and physical efforts directed to
achieving a better value. Technology is a tool that provides better living conditions and
enhances the capacity of the people concerned. It is a systematic application of
scientific knowledge to practical purposes and includes inventions, innovations,
techniques, practices and materials. Farmers implement new ideas, improve practice
and use research findings in order to boost their productivity in livestock. Dairy cattle
farming in Kenya were introduced by European white colonial settlers who imported
the exotic breeds, mainly the Ayrshires, Friesians, Guernsey and Jersey. These breeds
were later crossed with the indigenous cattle and over the years produced the national
dairy cattle herd
The dairy cattle population is estimated to about 3 Million in Kenya. In dairy sector, the
milk produced in Kenya is primarily from cattle, which contribute about (84%) and the
rest from camel (12%), and goats (4%). The major types of cattle kept are improved
exotic breeds and their crosses (60%) and indigenous zebu (24%) from the
communities in drier parts of the country (GOK, 1989). However, market oriented dairy
farming is concentrated in the high potential areas in Kenya where good feed supply
and disease control is much better. Dairy production can be classified into large or
small scale. The small-scale dominate, owning 80% of the 3 million dairy cattle which
consists of pure bred Friesian, Ayrshire, Guernsey, jersey and their crosses that produce
more milk than the indigenous breed.
11

2.2.1 Level of Education of Small Scale Dairy Farmers and Milk Production
A study carried out in China indicated that farmers’ adoption behaviour varies with
education and plan to expand and risk concerning new technology (Saha and Schwart,
1994). A similar research was done in turkey and found that; education is the most
basic and principle tools for farmers to adopt technology in Dairy Drought (Halake and
Mamo, 2013). Education level and experience of farmer give positive moves towards
adoption of technology by dairy farmers in Ethiopian (Lemna and Bekele, 2012).
Survey by ministry of livestock development has shown that most dairy farmers in
Imenti south district work without operation business plans and therefore they are
operating in trial and error methods. Therefore, they do not keep records of their daily
activities (MOLD, 2011). An educated farmer has high affinity to adopt technology.
This is according to a research conducted in meru District by (Behja, Gregory,
Philiph, and Luyombya. (2014). It was necessary for the same research to be conducted
in Longisa Sub county to establish if level of education influence small scale dairy
farmers to keep records
Investment on communication, information system and network has yielded
satisfactory fruits to adoption of technology by small-scale Farmers (Haggblade, 2011).
Accessibility to information can reduce time and price variability and link farmers to
potential buyers. Improving of national agricultural support system has been
championed the best alterative of increasing dairy production in sub-Sahara (Evenson
and Mwabu, 1998).Extension service was found to be a valuable channel of knowledge
and communication; useful in assisting farmers in improvement of dairy technology. It
facilitate in decision making and distribution of technology. These are fundamental
element of dairy farming this triggered the researcher to conduct the same research in
12

Longisa Sub County to establish the influence of the mention factors on the livelihood
of small scale dairy farmer.
2.2.2 Availability of Credit Facilities to Small Scale Farmers and Technology
Utilization
Initial cost of venturing into technology require a major financial and know how
investments, this may engorge into financial base of dairy farmers. They therefore find
it to be challenging to adopt technology thought a hand full can afford (Batz, 1996). A
study done in Aflonkarahisar, Turkey concluded that farmers who have access to credit
facilities have financial strength to acquire and maintain technology in dairy farming
(Ankara, 2008. Small scale dairy farmer in Longisa Sub-County may be affected by the
same attributes of Production this necessitate a research to be conducted.
2.2.3 Market Availability to Small Scale Farmers and Milk Production
In Uganda there was an agency to study how availability of milk infrastructure can
determine adoption of technology by farmers. It was found that poor market discourage
adoption of technology (Staal and Kaguogo, 2003).
Most farmers concentrate on local or the nearest market( Mogoka, 2009) .The Status Of
Good Dairy Farming Practice On Small Scale Farms(2010), found that dairy farmers in
western work no hard to improve milk production despite availability of unsatisfied
market. A study on features of dairy system supply the city of Nairobi found that dairy
farmers are trying to cope with land pressure to satisfy the market (Staal, etal. 2008).
2.3 Theoretical Framework of the Study
Three Models have over the years been used in agriculture technology adoption studies
as below.
13
2.3.1 Innovation Diffusion Model,
The innovation diffusion model entails that access to information, is a critical factor in
the adoption and diffusion of Technologies (Feder.J, Zilberman,R.T. 1985). Suggested
for the need for emphasizing the use of extension; visits, farm trials and other means to
transmit technical messages so as to cut on the search costs for technology thus enhance
adoption. This model is influenced by farmers characteristics like age, education among
others.
2.3.2 Economic Constraint Model
The economic model purports that economic constraints are major determinants to
adoption. (Smale, 1994) stated that in the short run with inputs being limited adoption
of technologies was challenged. However in the long run adoption decisions become
feasible. This showed why technologies which appeared like having been rejected
ended up being adopted after farmers long term planning.
2.3.3 Adopter Perception Paradigm
(Norris and Batie 1987) noted that even with full technical information, farmers
subjectively evaluated the technology different from scientists. This therefore calls for
periodic studies on technology adoption so as to address any gaps. Doss ,(2006)
indicated that farmers were usually able to provide information on why they did not
adopt a new technology and sometimes the answers provided were able to provide
insights into the constraints facing the farmers, while other times, multiple constraints
were binding so that removing the listed constraints did not necessarily result in the
farmer’s adoption of the technology.
14
Level of educatooFormal educatonExtension serviceAnimal husbandry
Livelihood of Small Dairy Scale Farmers
Ecooomic factors:Market distanceMilk price
Moderatog variables:Corporate interferenceDairy breedAnimal feeds
Land size
Credit facilitesLoan from SaccoLoan from banksGovernment support
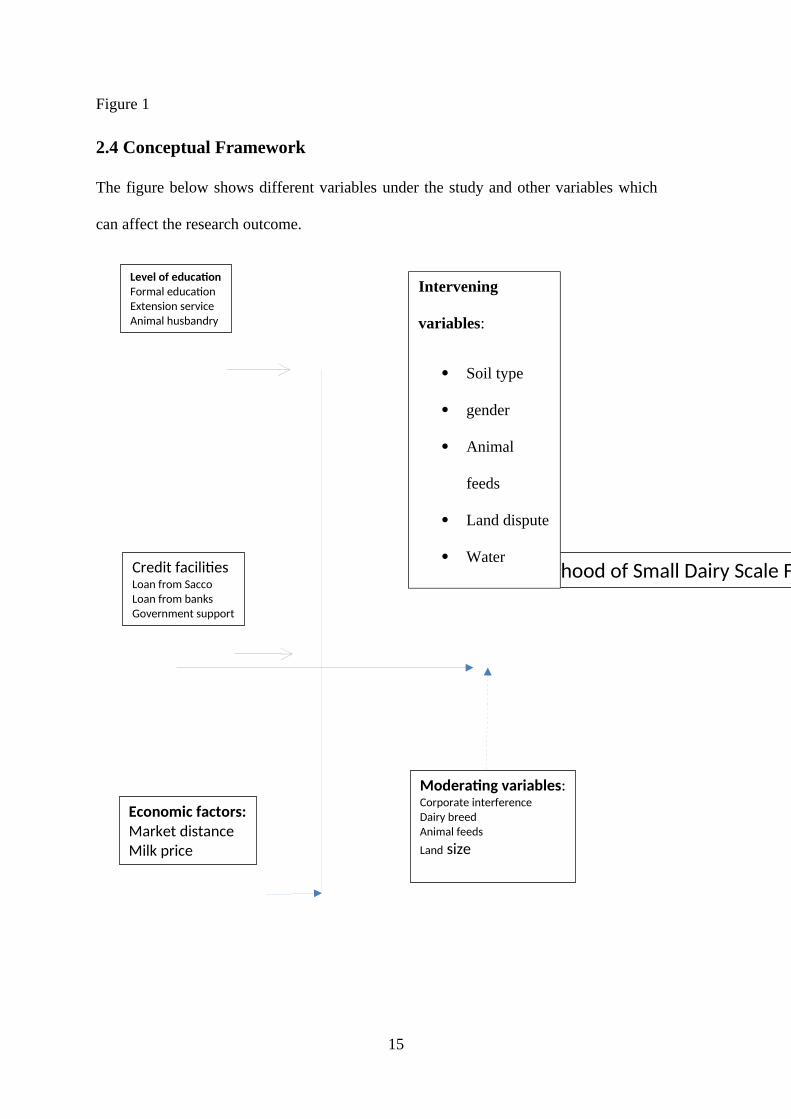
Figure 1
2.4 Conceptual Framework
The figure below shows different variables under the study and other variables which
can affect the research outcome.
15
Intervening
variables:
Soil type
gender
Animal
feeds
Land dispute
Water

Market availability for milk is considered a critical factor influencing adoption of the
various dairy technologies. Farmers are expected to adopt dairy technologies under
study so as to enhance and sustain milk production where the market was guaranteed.
Therefore farmers travelling the shortest distance to main milk market source have a
high chance of investing in terms of adopting the various technologies so as to sustain
production and income. The independent variables defined the study that is market is
based on the distance to the main milk market.
The dependent variables are milk production by dairy farmer per day, acreage under
Napier grass, Number of times made silage and number of times baled hay. For a
farmer to adopt the indicated technologies, education a critical role. However even
where education is available the market needed to be guaranteed. The two independent
variables therefore depended on each other. The one financing the project on the other
hand issued implementation guidelines on technologies to be adopted whether it made
economic sense or not. In this study apart from the project financier having guidelines
to be followed in terms of technologies to be adopted, the farmers groups also had
governing rules which motivated adoption. Where the owner had other sources of
income ploughed into the project or mobilized family lab or then adoption of the
technologies was enhanced.
The livestock sector contributes about 40% of the agricultural Gross Domestic Product
(GDP) which is about 10% of national GDP in Kenya (Muriuri, 2011). Several
researches have been performed in different regions in Kenya but not research has been
conducted in Longisa sub-county, Bomet County to establish factors affecting use of
dairy technology on milk production by small scale dairy farmers. This has attracted the
research to conduct the research on the variables affect the technology use and to come
16

up with findings, and present the findings in the most understandable format and to give
conclusion and recommendation.
2.5 Summary of the Review Related Literature
Several studied have been conducted in different places concerning dairy
technology, but none has been done on Longisa Sub-County concerning the
impact of dairy farming technology on livelihood of small scale farmers in
Longisa Sub-County, Bomet, Kenya. A study done by (Boz et. al, 2011) and
(Kaleka and Yavuk) both studies have no studied done on market availability,
credit facilities and extension services provided to small scale farmers.
A study done by (Aditya, R.K 2001) shows that there is a significant relationship
between animal productivity and breeding, but same research has not been done
in Longisa Sub- County. In Malawi a study done by (Tebud, at el 2012) shows
that there is an inverse relationship between dairy technology adoption and
education. A study had to be conducted in Longisa Sub-County to show the
relationship of dairy farming technology and livelihood of small scale dairy
farmers.
In Nyandarua, a research conducted indicated that government support in terms of
training, infrastructure development, disease control, financial support and
breeding is wanting. Therefore milk production has declined (Kamau and Gitau,
2001). It could be the same treatment, farmers in Bomet are receiving therefore,
and a research needs to be conducted.
19

CHAPTER THREE: RESEARCH METHODOLOGY
3.0 Introduction
This chapter entails description of the research design, target population, sampling size
and sampling procedure, operational definition of variables and data collection. The
chapter also captured data collection instruments, reliability and validity of instrument,
data analysis methods, results presentation and ethical consideration.
3.1 Research Design
The study adopted ex-post facto research design; this was a methodology used to
investigate population by selecting sample to analysis activities and come up with
results to be presented. The method is ideal for utilization of already collected data
available in cooling plants and also useful in testing of hypotheses about correlation
relationship. The design is useful in finding factors influencing use of technology by
small scale farmers. The design will aid in collecting data from large sample and for it
to use in intensive analysis and present data and finding in form of frequency, tables
and percentages that make it to be understand.
The scope covered sub-county of Longisa on use of dairy farming technology adopting.
The dependant variables are level of education of dairy farmers which includes formal
education, extension services and animal husbandry. The second variable is credit
facility availability from government and NGOs. The final variable is market
availability which is composition of market distance and milk price.
3.2 Target Population
The study covered 688 small scale dairy farmers who are members of Kembu, Kipreres,
Chemaner, Merigi and Longisa wards, they were randomly selected. Information
20
covering extension service, dairy technology and financial facilities will be collected
from Longisa sub-county agricultural officer.
3.3 Sample Size and Sampling procedure
Sampling entities represents the actual target population and comprises all the units that
are potential members of a sample (Kothari, 2008, Mugenda, 2008). In this study
sample of 128 respondents were used. The sampling frame obtained from two cooling
plants of Kembu and Longisa indicates all members serve by the plants. Stratified
random sampling was used to obtain the sample from different locations (strata) in the
Sub-county. For uniformity purposes proportionate stratified sampling method was
used to ensure all the locations are represented in the study. Simple random sampling
was used to select (respondents) smallholder dairy cattle farmers from each stratum.
The following formula was used to come up with an appropriate sample size for the
study as per Nassiuma (2000).
n= NC²/ (C²+ (N-1) e²) =688(0.25)²/ ((0.25)² + (688-1)0.02)²)) = 128
Where: n = Sample size,N = Population size
C = Coefficient of variation which is fixed between 25%
e = Margin of error which is fixed between 2%.
The sample size was calculated at 25% coefficient of variation, 2% margin of error and a
population of 688 dairy farmers.
All farmers were coded and used computer generated random numbers to identify farmers to
be sampled.
21

The study sought to establish the total number of small scale dairy farmers, agricultural
extension officers and milk collectors in Logisa Sub-County data was obtained from the
document found in the two cooling plants; Kembu and Longisa. Data was analysed as
shown in Table 1
Table 1: Sample of Small Scale Farmers, Agricultural Officers and Milk
Collectors in Longisa Sub-County
Cooling Plants Wards
Target
Population
of Dairy
Farmers
Sampled
Dairy
Farmers
Number of
Agricultural
Officers
Sampled
Agricultural
Officers
Number
of milk
collectors
Sampled
Milk
Collectors
Longisa Cooling
Plant
Longisa 11121 3
1
102
Kipreres 147 27 10 2
Kembu Cooling
Plant
Merigi 106 20 3
1
10 2
Kembu 138 26 10 2
Chemaner 186 34 10 2
Total 688 128 6 2 50 10
From table 1, it can be seen that 128 farmers, Agricultural officer and 10 milk
collectors were sampled for for the study. For the purpose of this study stratified
random sampling was employed. This produced estimate of overall population
parameter with greater precision and give more representation for homogenous
population. Population was grouped into five wards, stratum, out of each stratum
random sampling was done to select
The sampled were achieved by the assistance of computer to generate the random
numbers. The variation in sample figures was as a result of difference in target
population.
22
3.4 Research Instruments
Questionnaire was the main data collection instrument for collection of primary data. A
structured questionnaire with both open ended and close ended questions was used for
ease of interpretation and also gathering a wide range of data. One questionnaire
targeted the small scale dairy farmers and another one targeted the extension service.
Questionnaires were developed as per the research objectives; it was piloted where
correction was made by adding more content, modification and deleting.
Observation checklist, document analysis was also developed as per the objectives.
3.5 Reliability and Validity of Instruments
A pilot test was conducted to establish the effectiveness of data collection
instrument .A pilot sample of 6% was used which is equivalent to 7 small scale dairy
farmers (Mugenda and Mugenda, 2003).
3.5.1 Instrument Validity
Questionnaires were piloted where corrections, deletion, retention and modification
were done before actual study. Proper sampling was done to ensure homogenous
representation of all groups (stratum) Data collection was done within four days to
avoid major events happening to change opinions and attitude of samples. Research
questions were formatted to capture research objectives and expect judgement on
research instruments and data analysis were considered
3.5.2 Instrument Reliability
Reliability is the extent to which results are consistent over time and an accurate
representation of the total population under study. If the results of a study can be
reproduced under a similar methodology, then the instrument is considered to be
reliable (Joppe, 2000). The reliability of the results will be achieved through the
23
following; pilot testing of instrument, training of the assistant and reduce assistance to
reduce variability. The same can also be achieved by utilizing triangulation and making
a document trail of research findings.
3.6 Data Collection methods
Research permission was obtained from university of Nairobi; I communicated to sub-county
commissioner, agricultural officer, all the respective ward administrators, chiefs and sub-
chiefs about my aim of collecting the information. A requested the farmers to cooperate
during my research and inform them that the study was for academic purpose.
Questionnaires were distributed to respondents who are able to read; questions were read and
explained as they appear on questionnaire. They were waited to be filled and collect in case
where it was not possible to be collected an arrangement for a later day collection was
organised. Also informants were used to get information and data for the benefit of research.
Observation was also part of fundamental tools for data collection.
The study structured interviews, where the researcher asked each respondent the same
question. The researcher used a questionnaire with closed and open ended questions. To
verify data collected by questionnaire observation will be employed.
A key informant is anyone who could provide detailed information and opinion based
on his or her knowledge of milk production project in the study area. The study
interviewed four key informants who are involved in milk production projects in the
Sub County and those in leadership of the area. Key informants included; three officers
from Ministry of Livestock and one official from Kenya Dairy Board (KDB).
Questionnaire was the main data collection instrument for collection of primary data.
A structured questionnaire with both open ended and close ended questions was used
for ease of interpretation and also gathering a wide range of data. One questionnaire
24
targeted the small scale dairy farmers and another one targeted the extension service
provided by the District Livestock Production officers
3.7 Data Analysis Methods
Collected data was edited, coded, entered in the computer and cleaned to ensure
accuracy, consistency, uniformity and completeness. Statistical Package for Social
Sciences (SPSS) was used to generate descriptive statistics.
3.7 Operational Definitions of Variables
This section defines variables in terms of objectives, measurable indicators with related
means of data collections and means of analgising the data.
25
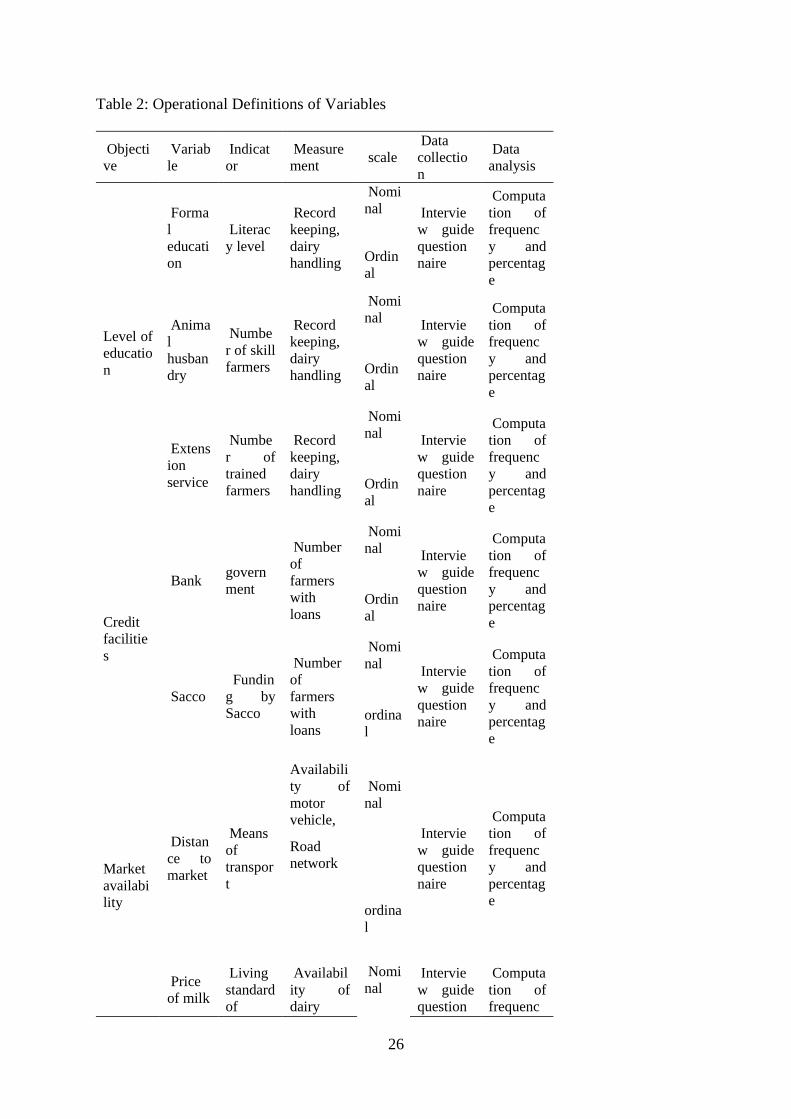
Table 2: Operational Definitions of Variables
Objective
Variable
Indicator
Measurement
scale Datacollection
Dataanalysis
Level ofeducation
Formaleducation
Literacy level
Recordkeeping,dairyhandling
Nominal Intervie
w guidequestionnaire
Computation offrequency andpercentage
Ordinal
Animalhusbandry
Number of skillfarmers
Recordkeeping,dairyhandling
Nominal Intervie
w guidequestionnaire
Computation offrequency andpercentage
Ordinal
Extensionservice
Number oftrainedfarmers
Recordkeeping,dairyhandling
Nominal Intervie
w guidequestionnaire
Computation offrequency andpercentage
Ordinal
Creditfacilities
Bank government
Numberoffarmerswithloans
Nominal Intervie
w guidequestionnaire
Computation offrequency andpercentage
Ordinal
Sacco Funding bySacco
Numberoffarmerswithloans
Nominal Intervie
w guidequestionnaire
Computation offrequency andpercentage
ordinal
Marketavailability
Distance tomarket
Meansoftransport
Availability ofmotorvehicle,
Nominal
Interview guidequestionnaire
Computation offrequency andpercentage
Roadnetwork
ordinal
Priceof milk
Livingstandardof
Availability ofdairy
Nominal
Interview guidequestion
Computation offrequenc
26

farmers structuresand better
naire y andpercentag
ordinal
3.8 Ethical Considerations
Ethical measures are principles the researcher should bind herself/ himself to in
conducting the research before data collection (Macmillan and Schumacher, 1993).
Initial approval is secured from the University of Nairobi. The respondents are assured
that the information given will be for the purpose of this research and will be treated
with utmost confidentiality
27
CHAPTER FOUR: DATA PRESENTATION, INTERPRETATION AND
ANALYSIS
4.0 Introduction
In this chapter background information for respondents is described; the description
variables are gender, age and education level. Variables under objectives; education
level, credit facilities, source of information, market availability and technology will be
discussed. Also in this chapter presentation of findings is discussed, analysed and
presented in relationship with the objectives. Much of data was qualitative therefore
was summarised and presented in form of frequency tables.
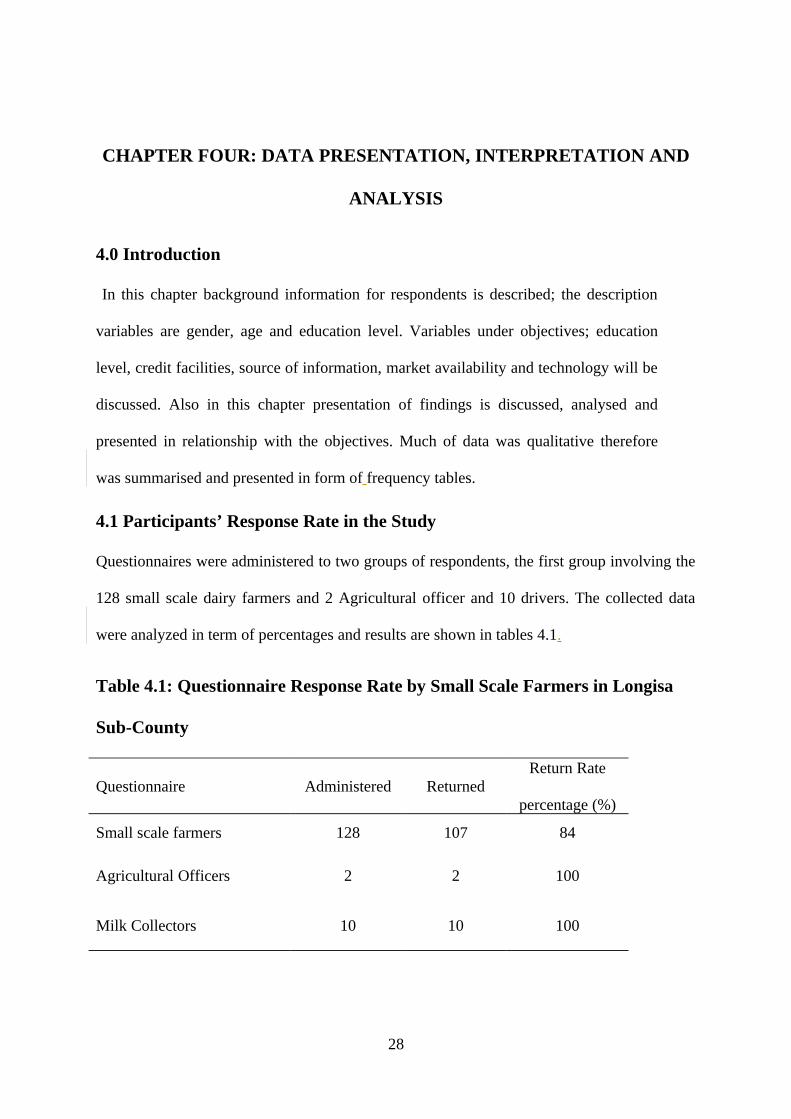
4.1 Participants’ Response Rate in the Study
Questionnaires were administered to two groups of respondents, the first group involving the
128 small scale dairy farmers and 2 Agricultural officer and 10 drivers. The collected data
were analyzed in term of percentages and results are shown in tables 4.1.
Table 4.1: Questionnaire Response Rate by Small Scale Farmers in Longisa
Sub-County
Questionnaire Administered ReturnedReturn Rate
percentage (%)
Small scale farmers 128 107 84
Agricultural Officers 2 2 100
Milk Collectors 10 10 100
28

It can be seen from Table 4.1 that out of 128 questionnaire copies administered to small
scale farmers only 107 were returned. This gave a return rate of 84%. In addition, the
questionnaire administered to Agricultural Extension Officers and milk collectors had a
return rate of 100%. Generally return rate is sufficient to make a true conclusion of the
results.
4.2 Background of Sampled Small Scale Farmers in Longisa Sub-County
The study sought to identity the distribution of respondents by gender during the study the
copies questionnaire were distributed to sampled small scale dairy farmers, data analysed I
percentage and found that the distribution of both genders is almost uniform. Results is
shown in Table: 4.2
Table 4.2: Distribution of Small Scale Dairy Farmers in Longisa Sub-County
by Gender
Sampled Dairy Farmers’ Gender Frequency Percentage (%)
Male 58 45.2
Female 70 54.8Total 128 100
Table 4.2 shows that the sampled small scale farmers consisted of males (45.2%) and females
(54.8%). This shows that most of the respondents in the study (54.8%) were female as
compared to (45.2%) males that constituted the sample. The sampled small scale dairy
farmers had a fairly equal representations by gender.
The study sought to identity the distribution of respondents by age. The result of the
analysed data is shown in Table 4.3:
29
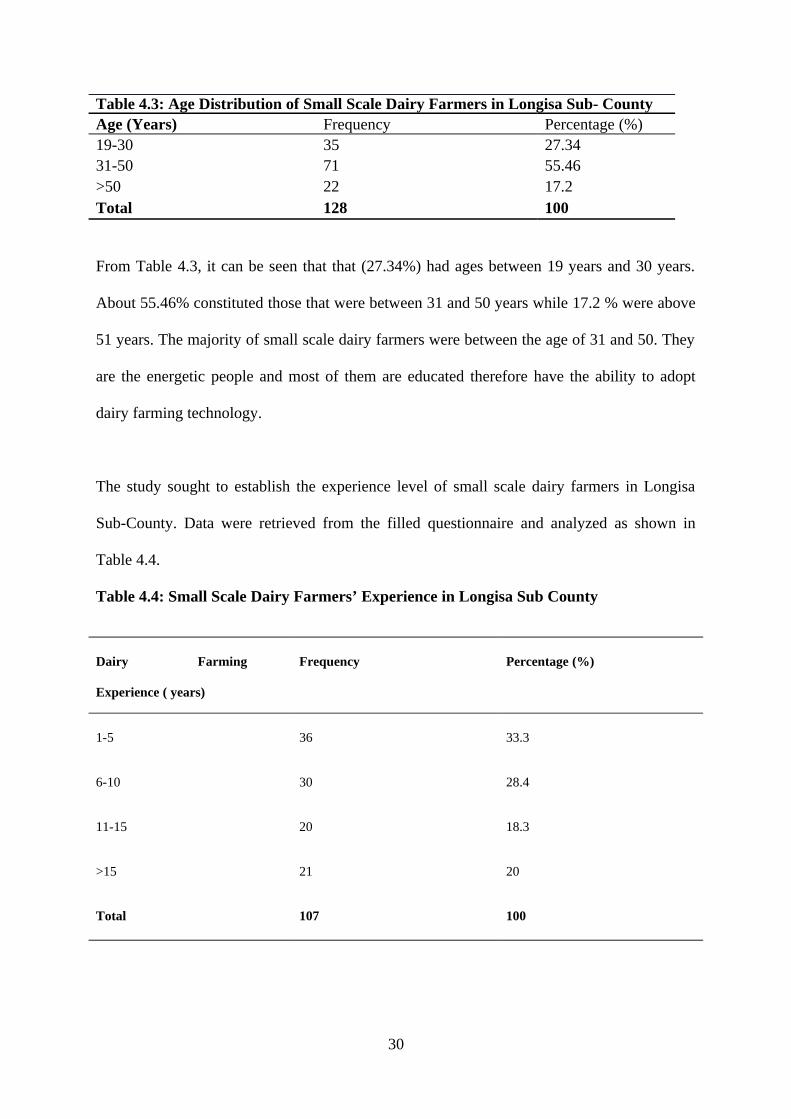
Table 4.3: Age Distribution of Small Scale Dairy Farmers in Longisa Sub- CountyAge (Years) Frequency Percentage (%)19-30 35 27.3431-50 71 55.46>50 22 17.2Total 128 100
From Table 4.3, it can be seen that that (27.34%) had ages between 19 years and 30 years.
About 55.46% constituted those that were between 31 and 50 years while 17.2 % were above
51 years. The majority of small scale dairy farmers were between the age of 31 and 50. They
are the energetic people and most of them are educated therefore have the ability to adopt
dairy farming technology.
The study sought to establish the experience level of small scale dairy farmers in Longisa
Sub-County. Data were retrieved from the filled questionnaire and analyzed as shown in
Table 4.4.
Table 4.4: Small Scale Dairy Farmers’ Experience in Longisa Sub County
Dairy Farming
Experience ( years)
Frequency Percentage (%)
1-5 36 33.3
6-10 30 28.4
11-15 20 18.3
>15 21 20
Total 107 100
30
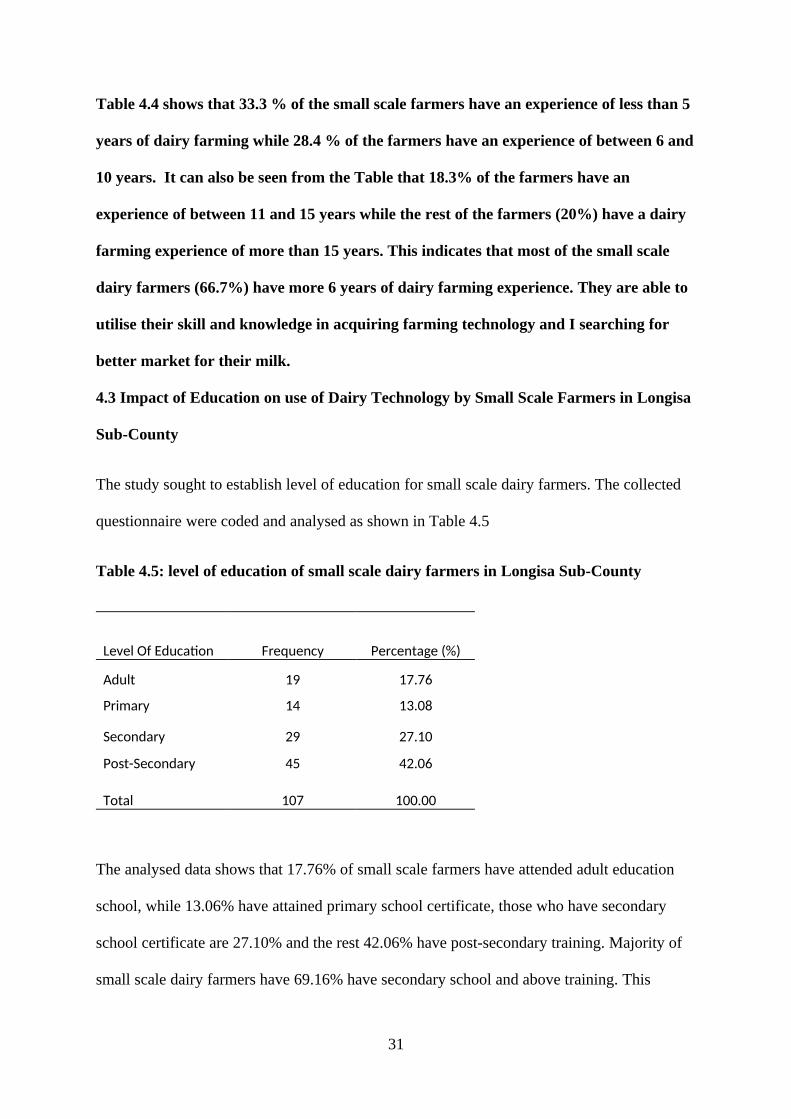
Table 4.4 shows that 33.3 % of the small scale farmers have an experience of less than 5
years of dairy farming while 28.4 % of the farmers have an experience of between 6 and
10 years. It can also be seen from the Table that 18.3% of the farmers have an
experience of between 11 and 15 years while the rest of the farmers (20%) have a dairy
farming experience of more than 15 years. This indicates that most of the small scale
dairy farmers (66.7%) have more 6 years of dairy farming experience. They are able to
utilise their skill and knowledge in acquiring farming technology and I searching for
better market for their milk.
4.3 Impact of Education on use of Dairy Technology by Small Scale Farmers in Longisa
Sub-County
The study sought to establish level of education for small scale dairy farmers. The collected
questionnaire were coded and analysed as shown in Table 4.5
Table 4.5: level of education of small scale dairy farmers in Longisa Sub-County
Level Of Educaton Frequency Percentage (%)
Adult 19 17.76
Primary 14 13.08
Secondary 29 27.10
Post-Secondary 45 42.06
Total 107 100.00
The analysed data shows that 17.76% of small scale farmers have attended adult education
school, while 13.06% have attained primary school certificate, those who have secondary
school certificate are 27.10% and the rest 42.06% have post-secondary training. Majority of
small scale dairy farmers have 69.16% have secondary school and above training. This
31
indicates that most small scale farmers have knowledge on dairy farming. They are also
educated on the availability and application of loan facilities. They also have knowledge on
the availability of market and market dynamics.
The study sought to identity how small scale dairy farmers acquire the knowledge on dairy
farming ,during the study the copies questionnaire were distributed to sampled small scale
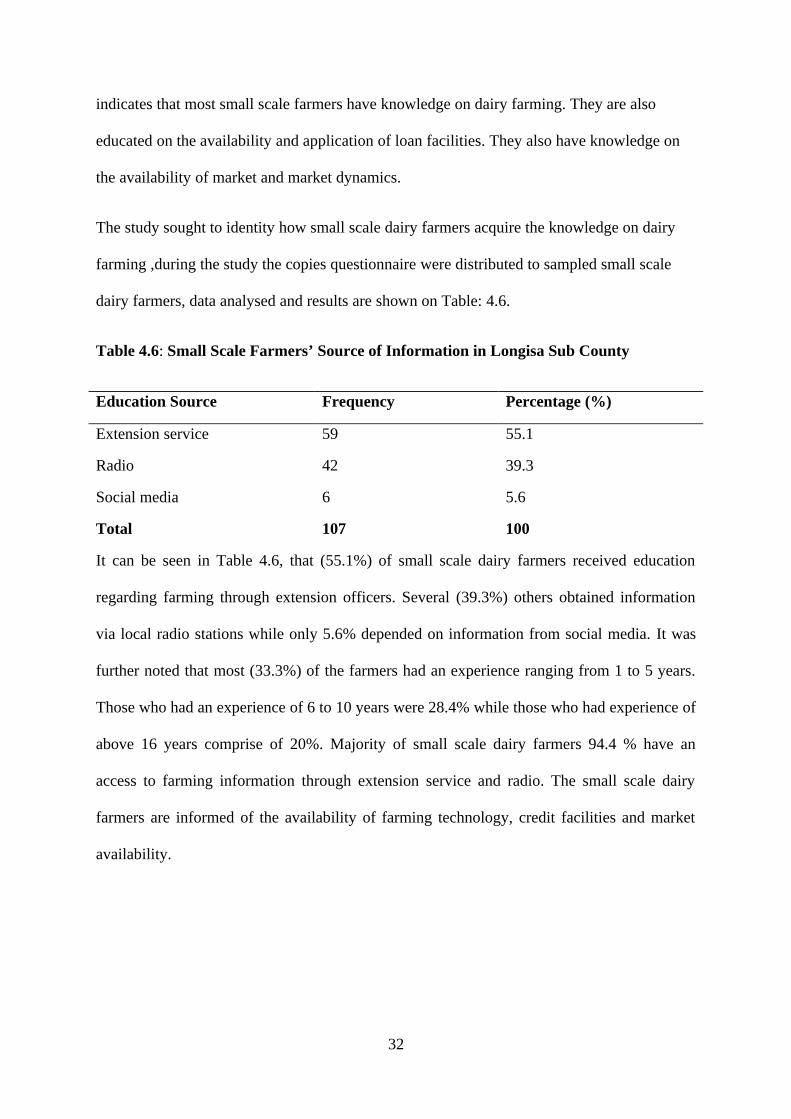
dairy farmers, data analysed and results are shown on Table: 4.6.
Table 4.6: Small Scale Farmers’ Source of Information in Longisa Sub County
Education Source Frequency Percentage (%)
Extension service 59 55.1
Radio 42 39.3
Social media 6 5.6
Total 107 100
It can be seen in Table 4.6, that (55.1%) of small scale dairy farmers received education
regarding farming through extension officers. Several (39.3%) others obtained information
via local radio stations while only 5.6% depended on information from social media. It was
further noted that most (33.3%) of the farmers had an experience ranging from 1 to 5 years.
Those who had an experience of 6 to 10 years were 28.4% while those who had experience of
above 16 years comprise of 20%. Majority of small scale dairy farmers 94.4 % have an
access to farming information through extension service and radio. The small scale dairy
farmers are informed of the availability of farming technology, credit facilities and market
availability.
32

4.4 Influence of Credit Facilities on Small Scale Farmers’ Livelihood in
Longisa Sub-County
The study sought to establish sources of loan for small scale dairy farmers. Data from
questionnaire analysed as shown in Table 4.7.
Table 4.7: sources of loan for small scale farmers in Longisa Sub-County
source of loao frequeocy Perceotage (%)
Sacco 36 33.64
Bank 22 20.56Family & Friends 15 14.01
Table Banking 34 31.79
107 100
As shown on Table 4.7. 33.64% of the farmers get loan from Sacco, while 20.56 % of the
farmers obtained loan from banks. Families and friend contribution amount to 14.01 % and
farmers who obtained loan through table banking are 31.79 %. Majority of the farmers
obtained loan from financial institution. The shown the farmers have enough knowledge on
financial planning and management.
The study sought to find out those small scale dairy farmers who apply and those who do not
applied for loan facility. The distributed and collected questionnaire was unanalysed as
shown on table 4.8.
Table: 4.8: Distribution of farmers by Credit Facilities
Loan Application Frequency Percent %
33
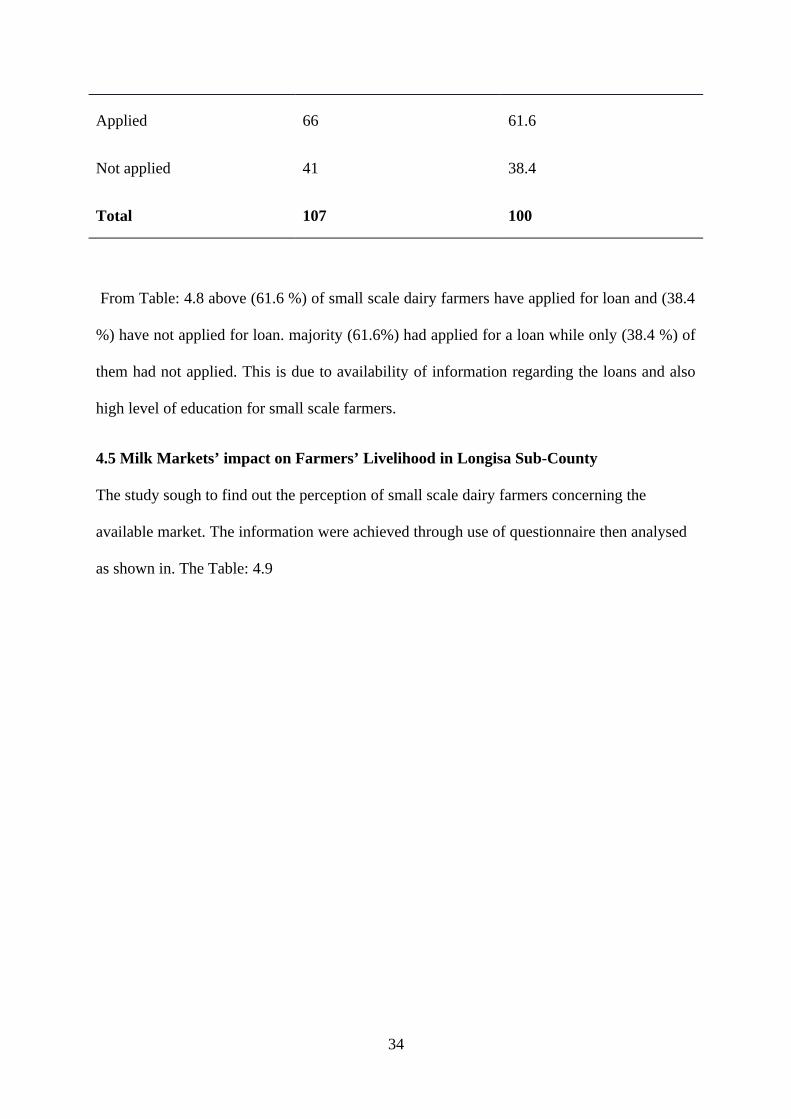
Applied 66 61.6
Not applied 41 38.4
Total 107 100
From Table: 4.8 above (61.6 %) of small scale dairy farmers have applied for loan and (38.4
%) have not applied for loan. majority (61.6%) had applied for a loan while only (38.4 %) of
them had not applied. This is due to availability of information regarding the loans and also
high level of education for small scale farmers.
4.5 Milk Markets’ impact on Farmers’ Livelihood in Longisa Sub-County
The study sough to find out the perception of small scale dairy farmers concerning the
available market. The information were achieved through use of questionnaire then analysed
as shown in. The Table: 4.9
34

Table 4.9: Dairy Farmers’ view about Availability of Milk Markets in Longisa Sub
County
Milks Market Adequacy Frequency Percentage (%)
Very good 9 8.4
Good 19 17.7
satisfactory 33 30.84
poor46 43.06
Total107 100
Table 4.9 indicates that 8.4% of small scale dairy farmers have very good market for milk,
while 17.7% have a good market for their milk, those whose have a fair market are 20.84%
and the rest 43.06% believe that they have a poor market for the milk. Majority 56.94% of
small scale dairy farmers are satisfied with milk market. There is a likelihood the dairy
farmers are getting good return from farming, hence they have income for their family needs.
Table 4.10: Distribution of Dairy Farmers’ Use of Breeding Technology in Longisa
Sub County
Breeding technology frequency Percent %AI 36 33Natural 71 67Total 107 100
Table: 4.10 indicate that 33% of small scale dairy farmers uses artificial insemination
while 33 %apply artificial insemination. Most dairy farmers have not adopted breeding
technology (AI) Most of those who have not adopted believe that the technology is not
a variable to them just by virtue of cost and availability. The natural breeding bull is
most likely to be of good breed to improve the trait of offspring.
35
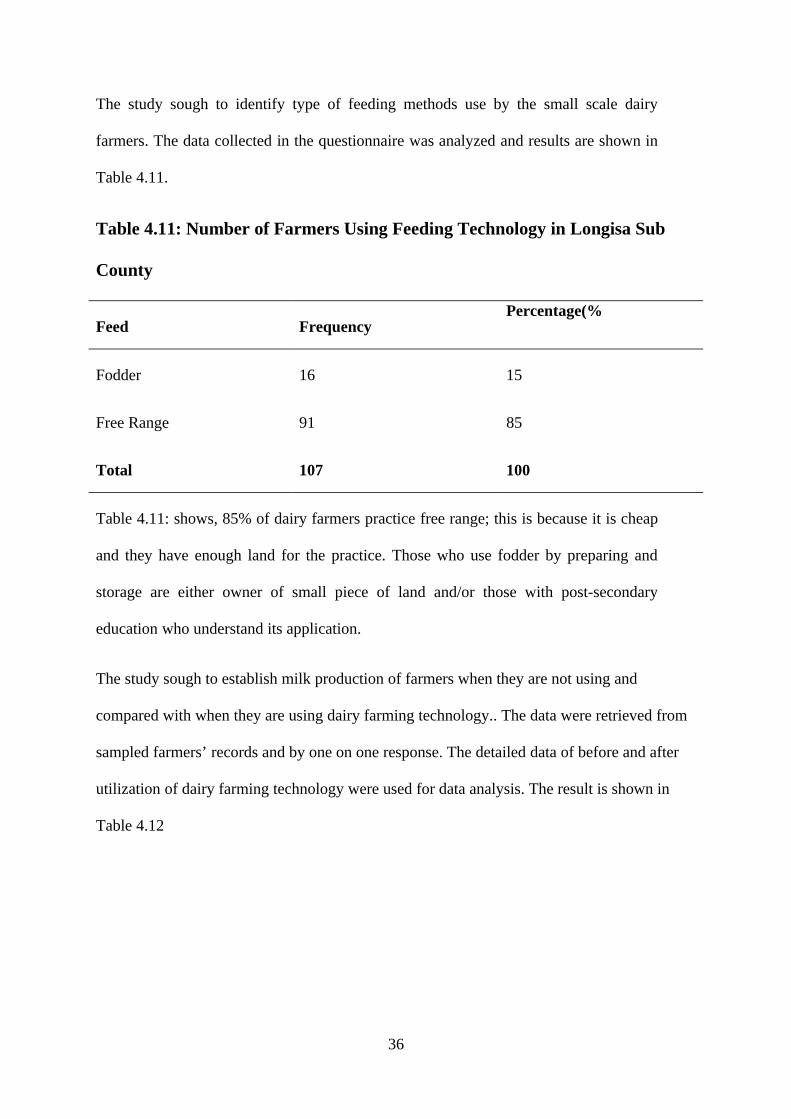
The study sough to identify type of feeding methods use by the small scale dairy
farmers. The data collected in the questionnaire was analyzed and results are shown in
Table 4.11.
Table 4.11: Number of Farmers Using Feeding Technology in Longisa Sub
County
Feed FrequencyPercentage(%
Fodder 16 15
Free Range 91 85
Total 107 100
Table 4.11: shows, 85% of dairy farmers practice free range; this is because it is cheap
and they have enough land for the practice. Those who use fodder by preparing and
storage are either owner of small piece of land and/or those with post-secondary
education who understand its application.
The study sough to establish milk production of farmers when they are not using and
compared with when they are using dairy farming technology.. The data were retrieved from
sampled farmers’ records and by one on one response. The detailed data of before and after
utilization of dairy farming technology were used for data analysis. The result is shown in
Table 4.12
36
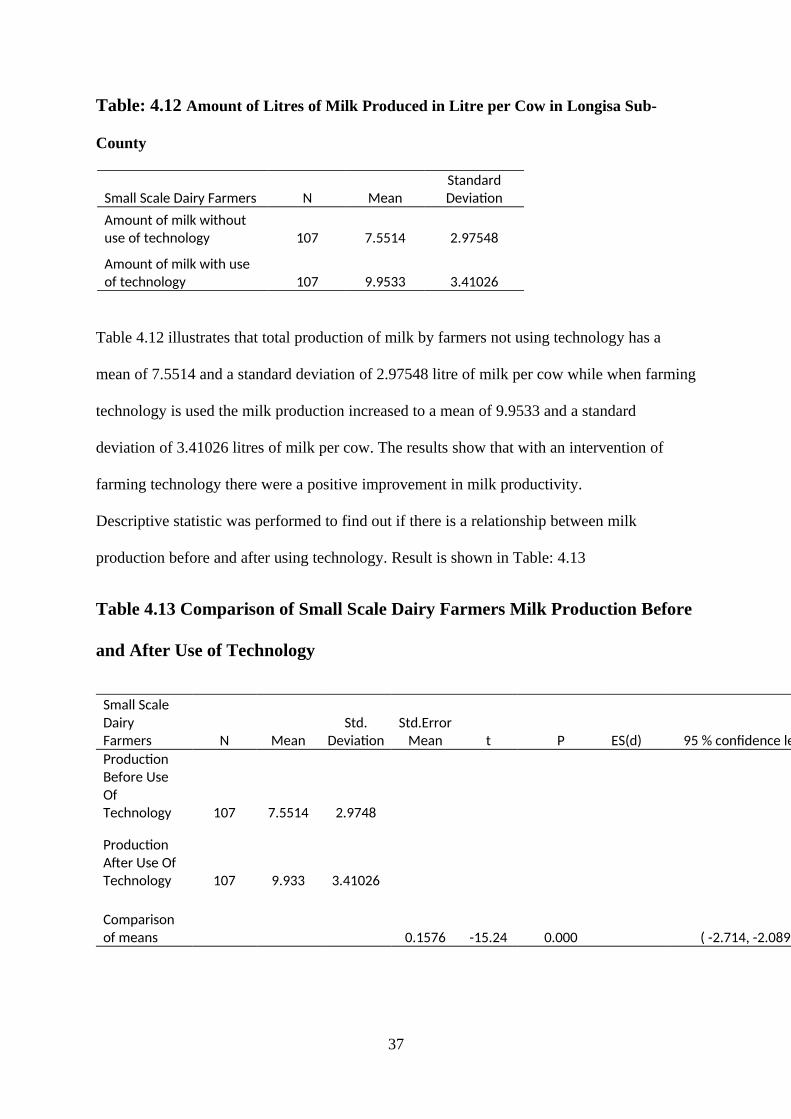
Table: 4.12 Amount of Litres of Milk Produced in Litre per Cow in Longisa Sub-
County
Small Scale Dairy Farmers N MeanStandardDeviaton
Amount of milk without use of technology 107 7.5514 2.97548
Amount of milk with use of technology 107 9.9533 3.41026
Table 4.12 illustrates that total production of milk by farmers not using technology has a
mean of 7.5514 and a standard deviation of 2.97548 litre of milk per cow while when farming
technology is used the milk production increased to a mean of 9.9533 and a standard
deviation of 3.41026 litres of milk per cow. The results show that with an intervention of
farming technology there were a positive improvement in milk productivity.
Descriptive statistic was performed to find out if there is a relationship between milk
production before and after using technology. Result is shown in Table: 4.13
Table 4.13 Comparison of Small Scale Dairy Farmers Milk Production Before
and After Use of Technology
Small Scale Dairy Farmers N Mean
Std.Deviaton
Std.ErrorMean t P ES(d) 95 % confdence level
Producton Before Use Of Technology 107 7.5514 2.9748
Producton Afer Use Of Technology 107 9.933 3.41026
Comparison of means 0.1576 -15.24 0.000 ( -2.714, -2.089)
37
t(106) = -15.2240, p = 0.000
A paired sample t-test was conducted to see if there is a difference between the means of the
milk Produced before and after adoption of technology at a significance level of 95%. From
Table: 4.11, the p-value was (0.000<0.05). This illustrates that there existed statistically
significant difference in the means of milk production before and after use of technology.
38
CHAPTER FIVE:
SUMMARY OF FINDING DISCUSSION, CONCLUSION AND
RECOMMENDATION
5.0:Introduction
This chapter is a summary of all the findings on the research in relation to dairy
technology adoption. It gives conclusion of the research based on the findings. It will
also highlights recommendation based on the research objectives and give gray areas
for further research.
5.1 Summary of Finding
The main objective of the study of the study was to find out factors influencing use of dairy
technology by small scale dairy farmer on milk production in Longisa sub-county, Bomet
County, Kenya. The study independent variables were; education level for dairy farmers,
availability of credit facilities to farmers, and availability of market for milk to dairy farmers.
The dependent variable was dairy farming technology which was measured in terms of
breeding, feeding and value addition on milk.
After the study it was established that education of dairy farmers play a major role in
adoption of technology. Old farmers practice old and outdated means of rearing dairy cattle,
they do not believe in adopting new technology, they are laggards. The study established that
the small-scale dairy farmers’ level of education plays a major role in adoption of farming
technology, farmers with skills and knowledge of animals husbandry have a upper hand in
using dairy farming technology. This led to improvement in milk production and
subsequently a positive impact on the farmers’ livelihoods.
39

Lack of credit facilities and unwillingness by farmers to acquire the facilities is a hindrance to
technology. Farmers believe that technology is too expensive for them to use. They only
consider initial capital cost and not considering return on investment and ultimate gain in
technology use on improved production. The study found that the availability of credit
facility to the farmers provide them with a better purchasing power to acquire farming
technology which after utilized led to improved milk production and hence uplifting the
livelihood of the farmers.
The research further found that the farmers are not satisfied with milk price despite the
availability of market. Therefore, this has demoralized them from adopting dairy technology
to improve milk output. Availability of ready market for milk provide the farmers with
resource for domestic use and hence resulted in a positive influence on small scale dairy
farmers’ livelihood because of enhance income from milk sold
It was evident that technology had a way of increasing the farmers’ milk production with a
bigger margin. Before use of technology farmers produced milk with a mean of (7.5514.
After adoption of technology milk production increased to a mean of (9.9533). This indicated
that dairy farming technology help small scale dairy farmers to produce more milk hence
their livelihood was likely to improve.
A paired sample t-test was conducted to see if there is a difference between the means of the
milk Produced before and after adoption of technology at a significance level of 95%. The p-
value was <0.05. It was also found that there is a significant difference between farmers who
adopted dairy farming technology and those who did not (t (106) = -15.2240, p = 0.000) this
indicated that there was improvement in milk production for farmers who utilised the farming
technology; which was facilitated by the level of education, availability of credit facility and
availability of ready market. This indicated that technology helps in improving dairy farming
40

productivity. The increase in milk production is likely to have a positive influence in
livelihood of the farmers.
5.2 Conclusion
The study conducted in Longisa Sub-county, Bomet County to established factor influencing
use of dairy technology by small scale farmers on milk production, Questionnaire were
distributed to dairy farmers, interview was conducted on agricultural officer and observation
was recorded. The collected data was analyzed and found that farmers with better education
facility have a better affinity to adopt dairy technology. They are aware of the available
technology of breeding (AI), value addition (milk fermenting, yoghurt making, and
packaging) and fodder making and storage.
Dairy farmers take their personal initiative to acquire knowledge through radio, social media.
Governments both central and county and NGOs have not been fully participating in
educating farmers on dairy technology; this has led to poor absorption and use of technology.
Education is a reliable transforming agent in technology.
The fear of uncertainty, poor milk price, failure to repay, fear of market uncertainty all these
has cribbed farmer from taking the risk of procuring loans.; they do not have Sacco to
facilitate loan supply neither do they have knowledge of the availability of financial support
from government and NGOs .due to unstable market price and inadequate assurance for
livestock financial institution fear investing on non-visible dairy business.
Market is available for milk from a relative short distance (1-4) km, despite very poor price,
as per farmers opinion, they do still supply milk to the market. Farmers do not give value
addition to their milk, they sell raw milk to private own chilling plants, therefore their profit
margin is very minimal.
It was evident that technology had a way of increasing the farmers’ milk production with a
bigger margin. Before use of technology farmers produced 808 litres with a mean of (7.5514)
41
and a Milk production range of between 1 litre and 14 litres. After adoption of technology
milk production increased to a total of 1065 litres with a mean of (9.9533) and a milk
production range of between 2 litres and 18 litres. A paired sample t-test showed that there
existed statistically significant difference in the means of milk production before and after
use of technology
It was also found that there is a significant difference between farmers who adopted dairy
farming technology and those who did not (t(106) = -15.2240, p = 0.000) this indicated that
there was improvement in milk production hence there is a likelihood of a better livelihood of
the farmers.
5.3 Recommendations
1. Government and NGOs need to educate farmers on the importance of using dairy farming
technology; breeding, value addition and fodder making and storage. They should also
improve on information dissemination both in skill building and knowledge equipping of
dairy farmers.
2. Farmers should be encourage to form groups so that they can be able to get fast and most
reliable training and information, secure loans through Sacco and get financial support by
NGOs and government.
3. Farmers should be encouraged to channel and save their earnings in banks and Sacco so
that they can be able to secure loans from the institutions.
4. Young people between the ages of (25-45) years should be encouraged to practice dairy
farming. These are people with education, energy and ability to perform better than the old
laggard farmers.
42
5.4 Suggestion for Further Studies
Influence of Youth in Small Scale Dairy Farming In Longisa Sub-County, Bomet
Kenya.
REFERENCES
Adijan, R.K (2006) Adoption of Breeding Technology in Dairy Industry and Their
Influence, USA
Aditya,R., Khanal,M. Jeffrey,W., 2001, Adoption and Profitability of Breeding
technology, USA
Aksoy,A., Kuleka,M., Yavuk,F., (2001) Analysis of the Factors affecting the Adoption
of Innovation of dairy farm, Erzurum, Turkey
Akudugu, M., Guo, E., Dadzie, S K(2012) Adoption of Modern Agriculture
Production Technologies by Farm Household, Ghana
Azage,T., and Alemu ,G.W.(1998) Prospects for Seri Urban Development, Ethiopia
Behja, G.P.L. (2014) Farmers Training and its Influence on Adoption of Improved
Dairy Husbandry Practice, Tanzania
Batz,F.J., K.J,Peter , W.Janssen (1996) the Influence of Technology Characteristic on
the Rate and Speed of Adoption
Boz, I., Akbay, C., Bas, S., & Budak, D. B. (2011). Adopton of innovatons and best
management practces among dairy farmers in the Eastern Mediterranean
region of Turkey. Animal and Veterinary Advances, 10(2), 251-261. Chitere,
Preston O. (1994). Community Development; Its concepton and practce with
Emphasis on Africa. Were Press
43

Chowdhurt. M (1989) Grammen Bank, Borrower Viability Finding, Bangladesh
Journal of Agricultural Economi Vol 12
Çiçek H, Cevger Y, Tandoğan M. 2008. Socio-economic factors afectng the level of
adopton of innovatons in dairy catle enterprises. Ankara University Faculty of
Veterinary Journal, 55: 183-187
Cukur,R. (2016) Food Science and Technology India
Doss, C.R., (2003) Understanding farm level Technology Adopton; Lessons learnt from
CIMMYT’S Microsurveys in Eastern Africa. CIMMYT Economics Working paper
03-07. Mexico, D.F:CIMMYT. Doss, C.R., (2006) Analyzing Technology Adopton,
Challenges and limitatons of micro studies. New Haven, CT 06520-8206,USA.
Agricultural Economics 34 (2006) 207–219
Evenson,R. , Mwabu,M. (1998) Effects of Agricultural Extension on Farm Yield, Kenya
FAO 2011 Dairy Development, Kenya
Feder, G., E. R. Just and D. Zilberman. (1990). “Adopton of Agricultural Innovatons in
Developing Countries: A Survey.” Economic Development and Cultural Change
33 (1985):255-298. Developing Countries, Malawi
Foltz, J. and G. Lang. “The Adoption and Impact of Management Intensive Rotational
Grazing on Connecticut Dairy Farms.” Renewable Agriculture and Food Systems 20, 4
(2005): 261-266.
Government of Kenya (1993). Ministry of livestock development Annual report Nairobi,
Kenya.
Haggblade,S. (2011) Modernizing Africa Agribusiness, Ghana
Halakatti,C.V, Sassan,C.M, Kamaraddi,A. (2007) Empowerment of Women through
Dairy Training, India
44
Halake. M (2013) Quality Management and Socio-Economic Factors as Determinant
of Dairy Farmers Productivity, Kenya
Hasan,C. Yavuk,C., Marut,T. (2008) Socio-Economic Factors Affecting the Level of
Adoption of Innovation in Dairy cattle Enterprise, Turkey
Hishan,K, El-Osta,H.S,, Morehant,M.J (1993) Technology Adoption and Its Impact on
Production Performance of Dairy Operation
Idel, K. (2014) the Adoption of Management Technologies, Ireland
ILRI, (2007) Report on Second External Program and Management Review, Kenya.
IPCBEE- International Conference on Agriculture and Animal Science (2012) Factors
Influencing Small Scale Dairy Farmers Decision to Adopt and Continue Use of
Successful Innovation, Mexico
ISSN 2224-3208 (2016) influence of dairy technology adoption.
ISSN: 2225-24369(2013) Published by Asian Society of Business and Commerce
Research 12
Karanja A. (2003) the Dairy Industry in Kenya, the Post Liberalisation Agenda
Kenya Dairy Board (2009) milk consumption in Kenya, Kenya
Langat. D. (2011) Factors Affecting Economic Importance of Zero Grazing, Kericho,
Kenya
Lemna,F, Trivedi,M.M, Bekele,T (2012) Adoption of Improvement dairy Husbandry
Practice and Its Relation with Socio-Economic Characteristic of Dairy Farmers,
Ethiopia
MOLD (2009) Smallholder Dairy Commercialization Program, Kenya
Mogoka,S. (2009) the Status of Good Dairy Farming Practice On Small Scale Farms,
Kenya
45

Muiruiri,K.M, Guyo,S.H, Ibuachu,C.J. (2014) Factors Influencing Growth of Dairy
Farming Business, Kenya
Mugenda, Mugenda (1998) Research Methods, Qualitative and Quantitative
Approaches, Kenya
Mwantusuma, M. (2010) Factors Influencing Adoption of Dairy Technology, Kenya
Paul P, (1996) Impact of Livestock Program on Bangladesh Rural Advancement
Committee, Department of Agricultural Economic
Saha, Love and Schwart (1994) Adoption of Emerging Technologies under Output
Uncertainty USA.
Shook, G.E. “Major Advances in Determining Appropriate Selection Goals.” Journal of
DairyScience 89. (2006): 1349-1361.
Short, S.D. “Characteristics and Production Costs of US Dairy Operations.” Statistical
Bulletin no. 974-6, USDA-ERS, 2004.
Short, S.D. “Structure, Management, and Performance Characteristics of Specialized
Dairy Farm Businesses in the United States.” Agriculture Handbook no. 720,
USDA-ERS, September 2000.
Smale,M., Just,R. leather (1994) land allocation USA. Stated that in the short run with
inputs being limited adoption of technologies was challenged.
Stall,S.J., Kaguongo,W. (2003) Dairy Sub-Sector Development Opportunities, Uganda
Staal,S.J, Jabbar,R Nin,J. (2008) Dairy Technology for Resource Poor, Ethiopia,
Kenya.
Tebug,S.F Chekegwa,S. Wiedemamn,S. (2012) On-Farm Evaluation of Dairy Farming
Innovation Up-Take, Malawi
46

Thorpe, W., Muriuki.I.G. Omore, A. Owanga, M.O. Stall (2000) Dairy Development in
Kenya in the Past, the Present and in the Future, Kenya
World Bank, (2008) Agriculture for development; world development USA
Appendix 1
Questionnaire for small scale farmers
I am Wilberforce Mutai a student from the University of Nairobi doing a research on
factors influencing use of dairy technology by small scale dairy farmers on milk
production in Longisa sub –county, Bomet County, Kenya. Congratulation for being
selected as one of small scale dairy farmers to assist in providing information related to
above named factors. The information is for academic in the University of Nairobi.
Your sincere information is highly appreciated.
The questionnaire is divided into five categories namely:
A. General information
B. Education
C. Credit facilities
D. Market
A. General Information Village Age Gender Education level ……………………
…. 20-29 Male None
Ward 30-39 Female Adult ……………………
..
40-49 primary
47
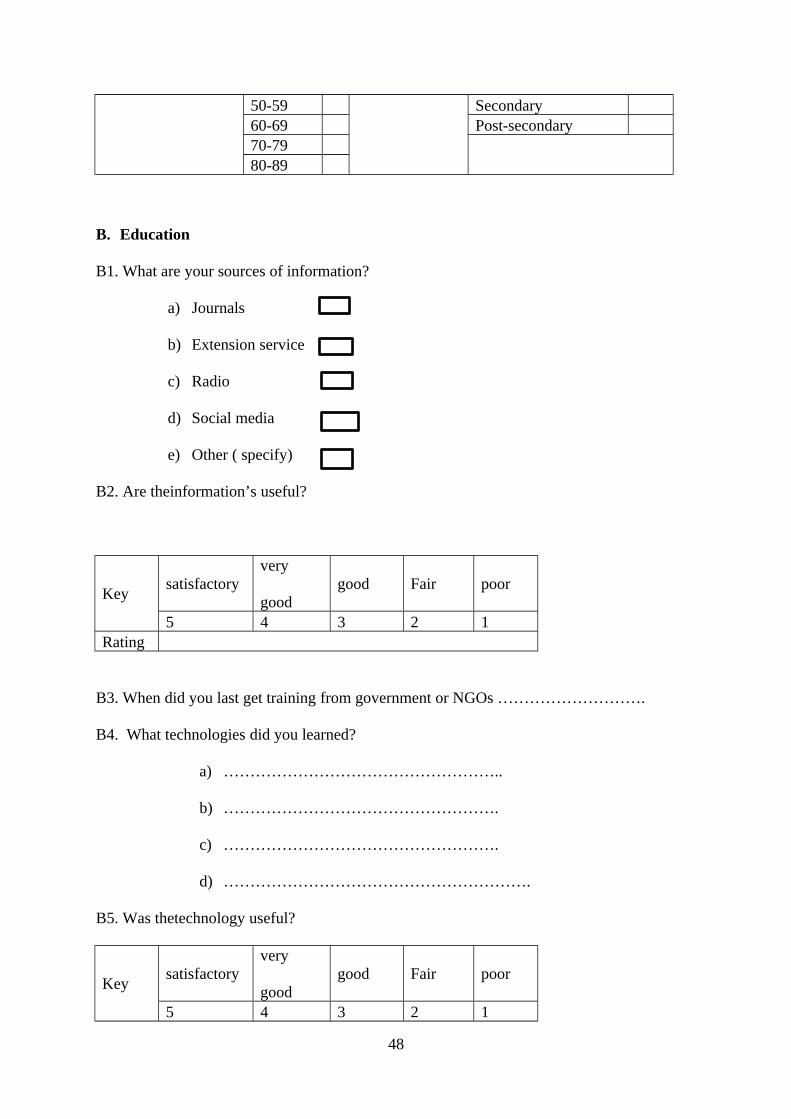
50-59 Secondary 60-69 Post-secondary 70-79
80-89
B. Education
B1. What are your sources of information?
a) Journals
b) Extension service
c) Radio
d) Social media
e) Other ( specify)
B2. Are theinformation’s useful?
Keysatisfactory
very
goodgood Fair poor
5 4 3 2 1Rating
B3. When did you last get training from government or NGOs ……………………….
B4. What technologies did you learned?
a) ……………………………………………..
b) …………………………………………….
c) …………………………………………….
d) ………………………………………………….
B5. Was thetechnology useful?
Keysatisfactory
very
goodgood Fair poor
5 4 3 2 1
48
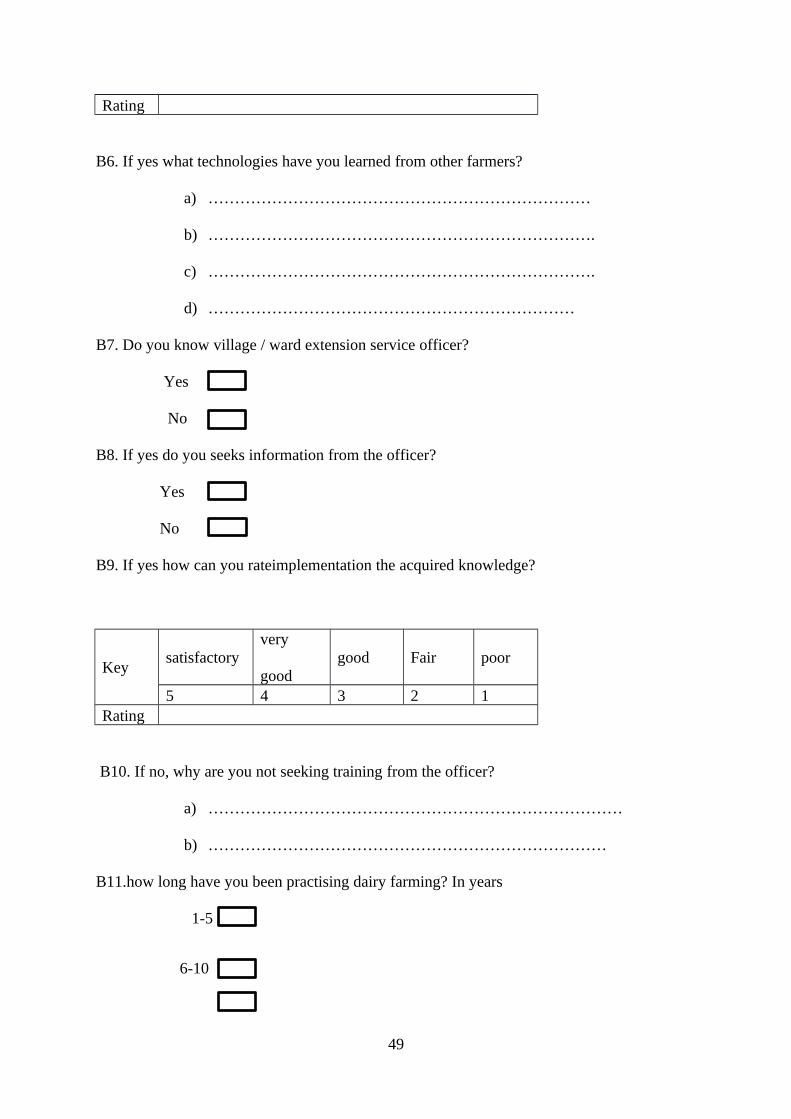
Rating
B6. If yes what technologies have you learned from other farmers?
a) ………………………………………………………………
b) ……………………………………………………………….
c) ……………………………………………………………….
d) ……………………………………………………………
B7. Do you know village / ward extension service officer?
Yes
No
B8. If yes do you seeks information from the officer?
Yes
No
B9. If yes how can you rateimplementation the acquired knowledge?
Keysatisfactory
very
goodgood Fair poor
5 4 3 2 1Rating
B10. If no, why are you not seeking training from the officer?
a) ……………………………………………………………………
b) …………………………………………………………………
B11.how long have you been practising dairy farming? In years
1-5
6-10
49
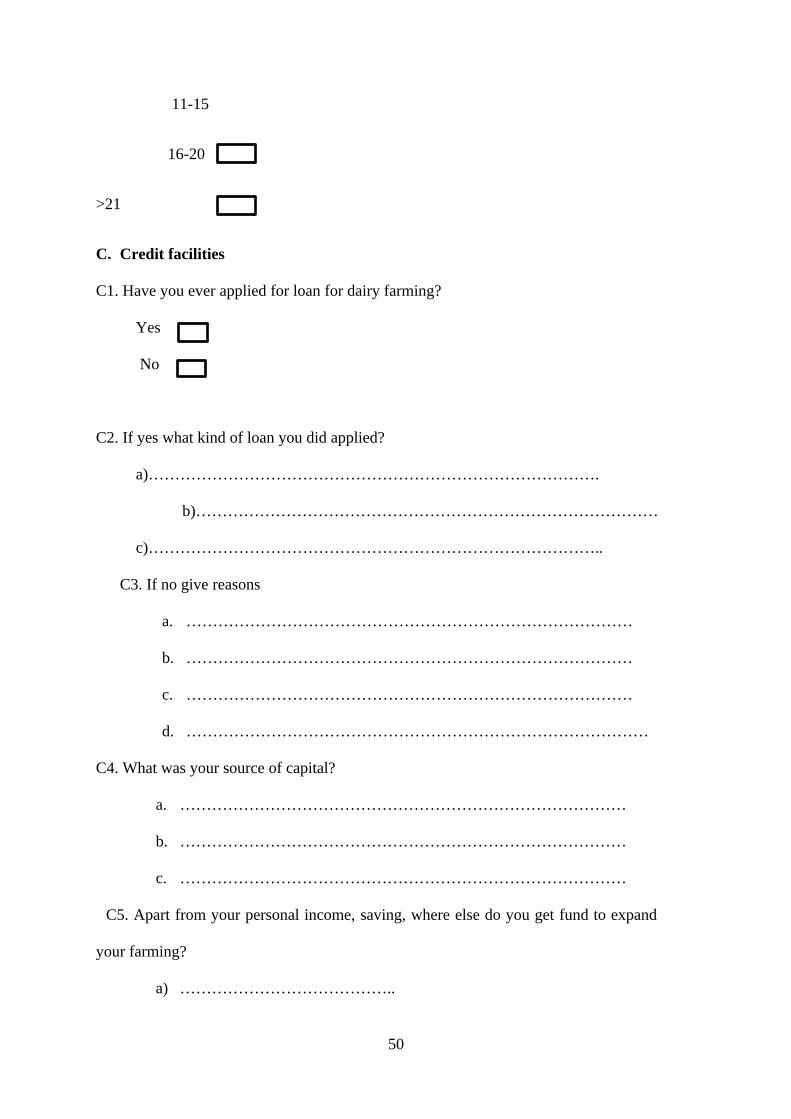
11-15
16-20
>21
C. Credit facilities
C1. Have you ever applied for loan for dairy farming?
Yes
No
C2. If yes what kind of loan you did applied?
a)………………………………………………………………………….
b)……………………………………………………………………………
c)…………………………………………………………………………..
C3. If no give reasons
a. …………………………………………………………………………
b. …………………………………………………………………………
c. …………………………………………………………………………
d. ……………………………………………………………………………
C4. What was your source of capital?
a. …………………………………………………………………………
b. …………………………………………………………………………
c. …………………………………………………………………………
C5. Apart from your personal income, saving, where else do you get fund to expand
your farming?
a) …………………………………..
50
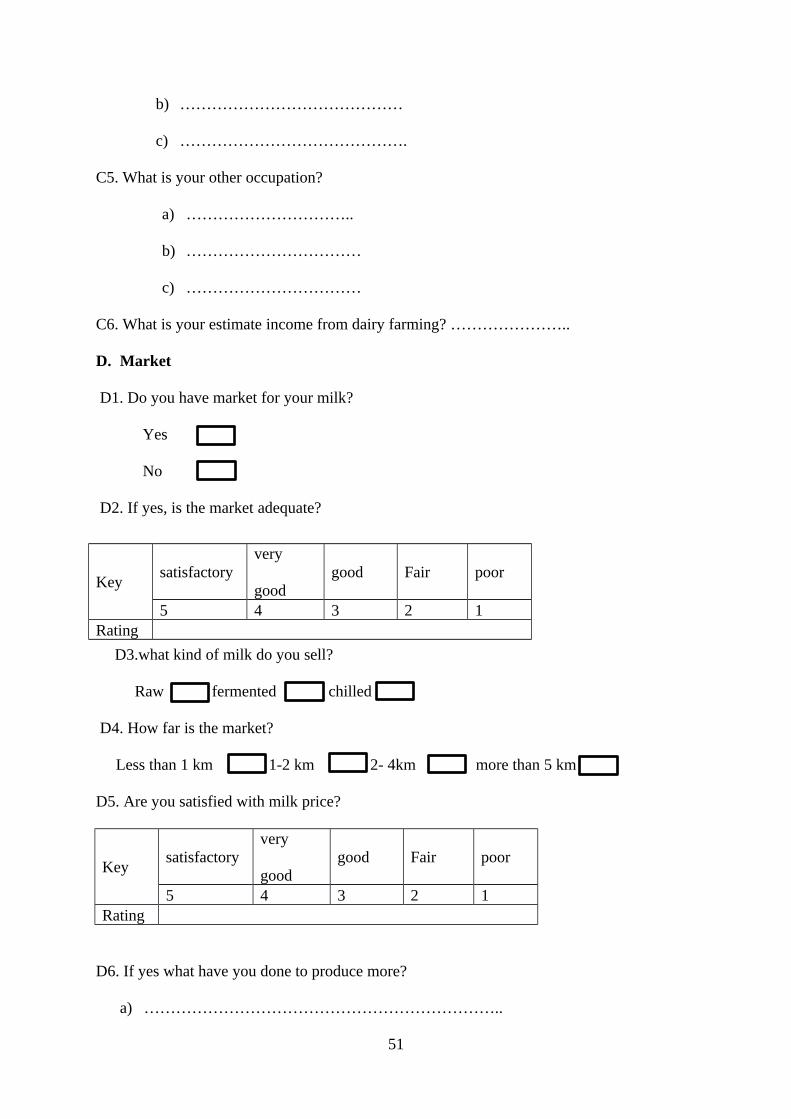
b) ……………………………………
c) …………………………………….
C5. What is your other occupation?
a) …………………………..
b) ……………………………
c) ……………………………
C6. What is your estimate income from dairy farming? …………………..
D. Market
D1. Do you have market for your milk?
Yes
No
D2. If yes, is the market adequate?
D3.what kind of milk do you sell?
Raw fermented chilled
D4. How far is the market?
Less than 1 km 1-2 km 2- 4km more than 5 km
D5. Are you satisfied with milk price?
Keysatisfactory
very
goodgood Fair poor
5 4 3 2 1Rating
D6. If yes what have you done to produce more?
a) …………………………………………………………..
51
Keysatisfactory
very
goodgood Fair poor
5 4 3 2 1Rating

b) ………………………………………………………………
c) …………………………………………………………..
d) …………………………………………………………..
D7. If no, what have you done to add valueto your milk?
a) ………………………………………………………………………….
b) …………………………………………………………………………..
c) …………………………………………………………………………..
d) …………………………………………………………………………..
D8. What are main challenges in milk market?
a) ………………………………………………………………………
b) ………………………………………………………………………
c) ………………………………………………………………………
D9. What technology have you applied to counter act the hindrances?
a) e- marketing
b) cooling plant
c) value addition
d) other (specify)
D1. What was your daily milk production before using technology per day per cow?
………………… litres
D2. What is your current daily milk production per day per cow?
……………………..litres
Appendix 2
Questionnaire for Agricultural Officers
E. Education
52
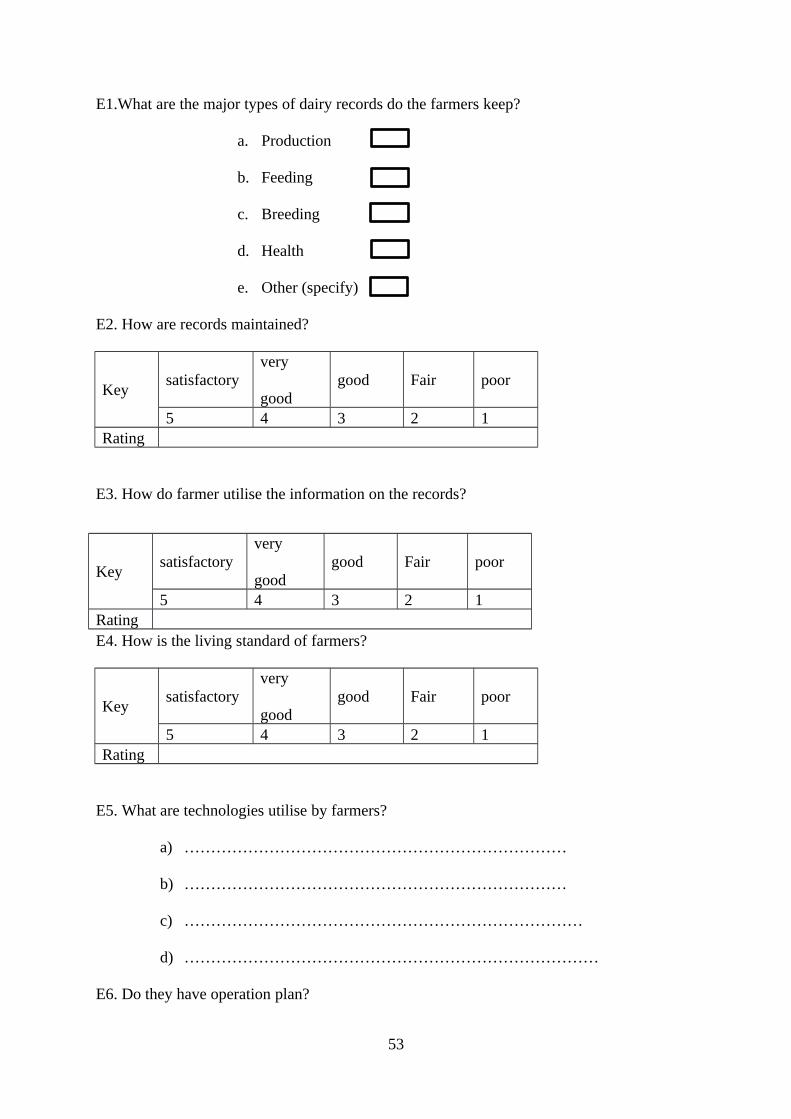
E1.What are the major types of dairy records do the farmers keep?
a. Production
b. Feeding
c. Breeding
d. Health
e. Other (specify)
E2. How are records maintained?
Keysatisfactory
very
goodgood Fair poor
5 4 3 2 1Rating
E3. How do farmer utilise the information on the records?
E4. How is the living standard of farmers?
Keysatisfactory
very
goodgood Fair poor
5 4 3 2 1Rating
E5. What are technologies utilise by farmers?
a) ………………………………………………………………
b) ………………………………………………………………
c) …………………………………………………………………
d) ……………………………………………………………………
E6. Do they have operation plan?
53
Keysatisfactory
very
goodgood Fair poor
5 4 3 2 1Rating

Yes
N o
E7. If yes is the plan being executed?
Keysatisfactory
very
goodgood Fair poor
5 4 3 2 1Rating
F. Credit facilities
F1. Do farmers have any form of security to facilitate acquiring of loan?
Yes
N o
F2. Do farmers have capacity to service loan?
Yes
N o
F3. Do farmers have capacity in term of knowledge to utilise loan very well?
Keysatisfactory
very
goodgood Fair poor
5 4 3 2 1Rating
F4. Do they have financial plan?
Yes
N o
54

F5. If yes, is the plan viable?
Keysatisfactory
very
goodgood Fair poor
5 4 3 2 1Rating
G. Extension service
G1. Do farmers have dairy farming journals?
Yes
No
G2. Are the farmers’ equipped with dairy farming skills?
Keysatisfactory
very
goodgood Fair poor
5 4 3 2 1Rating
H. Market
H1. Do cooling plants exist?
Yes
No
H2. If yes, what is the average quantity of milk being delivered by
farmers?.......................litres/day?
H3. What is the means of milk delivery to cooling plants?
a) ………………………………………………………………….
b) ………………………………………………………………
c) ………………………………………………………………….
55
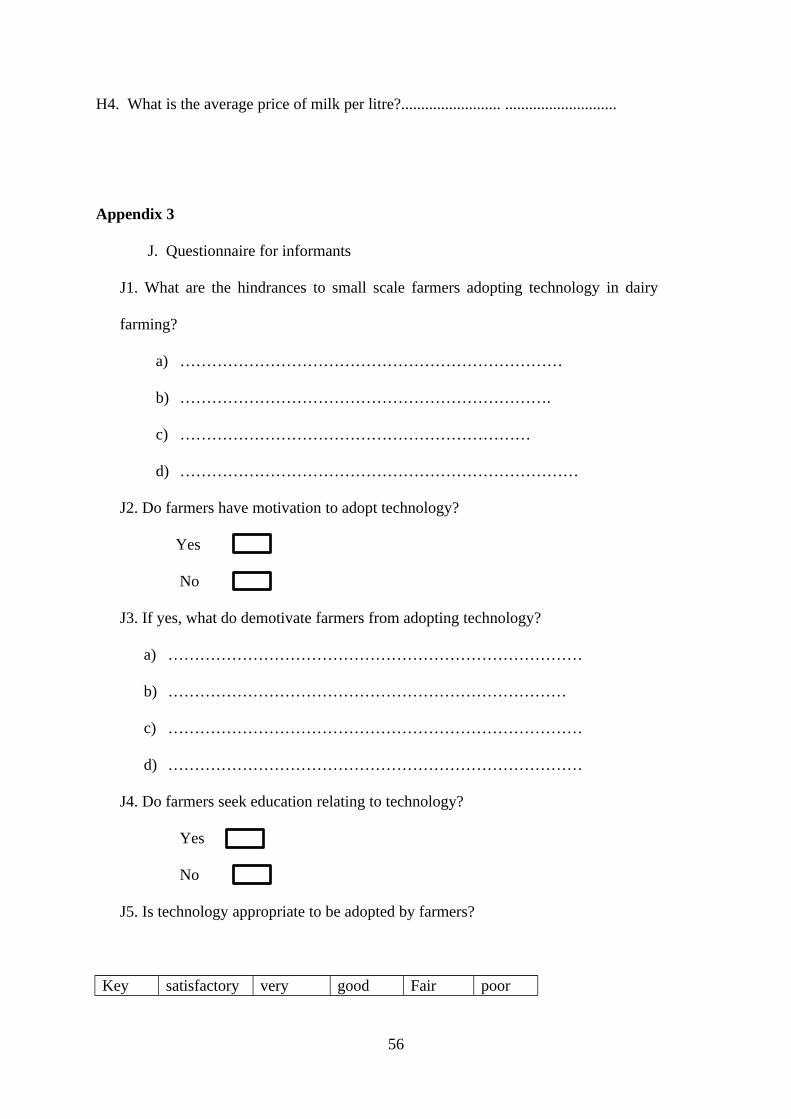
H4. What is the average price of milk per litre?......................... ............................
Appendix 3
J. Questionnaire for informants
J1. What are the hindrances to small scale farmers adopting technology in dairy
farming?
a) ………………………………………………………………
b) …………………………………………………………….
c) …………………………………………………………
d) …………………………………………………………………
J2. Do farmers have motivation to adopt technology?
Yes
No
J3. If yes, what do demotivate farmers from adopting technology?
a) ……………………………………………………………………
b) …………………………………………………………………
c) ……………………………………………………………………
d) ……………………………………………………………………
J4. Do farmers seek education relating to technology?
Yes
No
J5. Is technology appropriate to be adopted by farmers?
Key satisfactory very good Fair poor
56

good5 4 3 2 1
Rating
J5how is the rate of technology transfer to farmers?
Keysatisfactory
very
goodgood Fair poor
5 4 3 2 1Rating
J6. What is absorption rate of technology by farmers trained?
0-25% 26-50% 51-75% 76-100%
J7. What do encourage farmers to adopt technology?
a) …………………………………………………………………….
b) ………………………………………………………………………
c) …………………………………………………………………………
d) ………………………………………………………………
J8. Who offer training on dairy technology?
a) …………………………………………………………………
b) ……………………………………………………………………
c) ……………………………………………………………………………………..
How many farmers do you handle per day? ..........................................................
J10. Do you have policies to enhance adoption of technology in dairy farming?
Yes
No
J11. According to your opinion are the adopted technologies by farmers helpful?
57
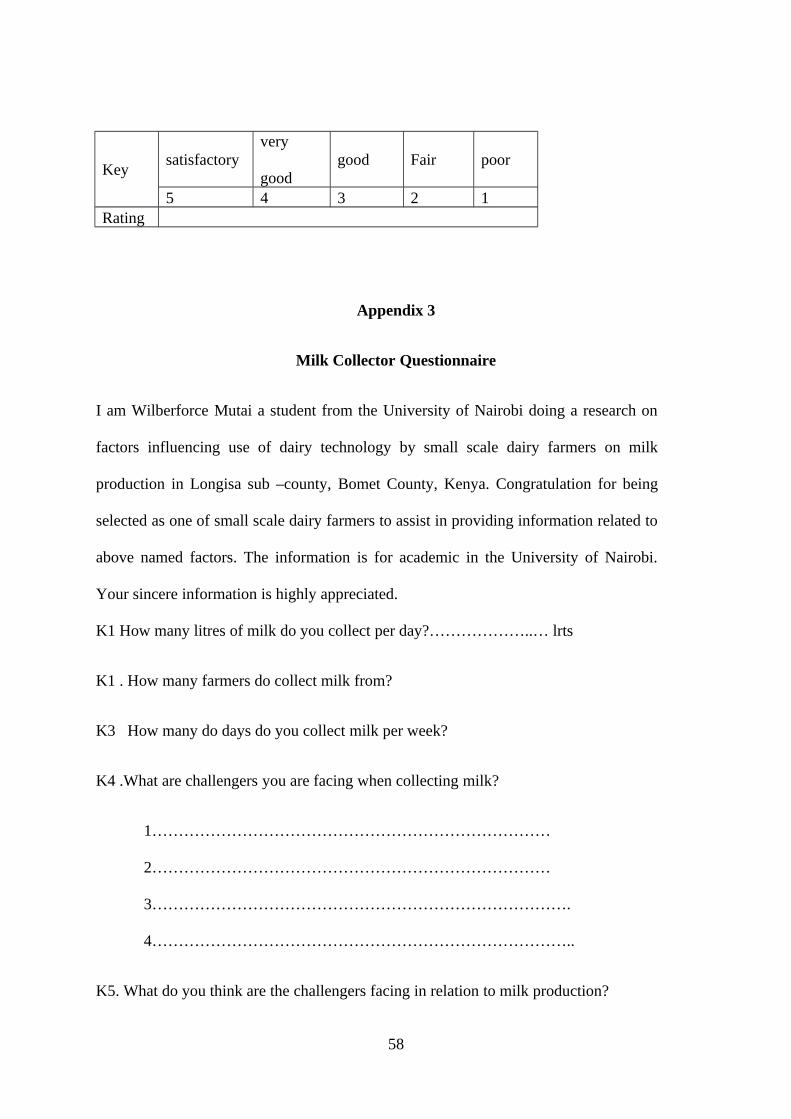
Keysatisfactory
very
goodgood Fair poor
5 4 3 2 1Rating
Appendix 3
Milk Collector Questionnaire
I am Wilberforce Mutai a student from the University of Nairobi doing a research on
factors influencing use of dairy technology by small scale dairy farmers on milk
production in Longisa sub –county, Bomet County, Kenya. Congratulation for being
selected as one of small scale dairy farmers to assist in providing information related to
above named factors. The information is for academic in the University of Nairobi.
Your sincere information is highly appreciated.
K1 How many litres of milk do you collect per day?………………..… lrts
K1 . How many farmers do collect milk from?
K3 How many do days do you collect milk per week?
K4 .What are challengers you are facing when collecting milk?
1…………………………………………………………………
2…………………………………………………………………
3…………………………………………………………………….
4……………………………………………………………………..
K5. What do you think are the challengers facing in relation to milk production?
58

1………………………………………………………………………………
2……………………………………………………………………………….
3……………………………………………………………………………….
4………………………………………………………………………………..
K6 In your view where do farmers get education concerning dairy farming?
……………………………………………………………………………….
K7 Where do farmers get loan to expand their dairy activities…………………
K8. Milk market available throughout the year ……YES………………NO………………
K8. How do farmers feel about the milk price…………………………………..
K9. What are the common breeds of dairy cows farmers are rearing?
1…………………………………………….
2…………………………………………..
3……………………………………………
4………………………………………………
59

Appendix 4
Observation check list
L1. What are the available dairy breeds available?
1……………………
2………………………….
3……………………….
4……………………………..
L2. Are farm structures available and how are the conditions of the structure?
………………………………………………………………………..
L3. How is the living condition of the farmers?.................................
L4 How many cows are available on the farm?........................................
L5 How is the condition of the cows?.........................................................
L5. Are road good for milk transport………………………………….
L6. Are animal feed available?...............................................................
L7. What kind of feed are in the farm?...................................................
60
L8. What is the approximate size of the farmer land?..........................hectares
L9 Are milk collecting point available?
L10. Are there dairy records for animal production and health?.........
61