impact of working capital management on … · working capital management is an important component...
TRANSCRIPT

International Journal of Management Studies ISSN(Print) 2249-0302 ISSN (Online)2231-2528 http://www.researchersworld.com/ijms/
___________________________________________- 78 - Vol-IV, Special Issue-4, November 2017
IMPACT OF WORKING CAPITAL MANAGEMENT
ON PROFITABILITY: EMPIRICAL EVIDENCE
FROM INDIAN TEXTILE INDUSTRY
Prof. Kushagra Goel,
Finance Faculty,
ASMSOC,
NMIMS University, Mumbai, India.
Surya Jain,
India.
ABSTRACT
Working capital is an important part of the capital of firm which helps to carry out
day to day activities. This study attempts to examine the effect of working capital
on profitability in the Indian Textile Industry. Variables used in this study include
Return on Assets and Return on Equity for profitability and Debtor's Collection
Period (DCP), Inventory Holding Period (IHP), Creditor's Payment Period
(CPP), Cash Conversion Cycle (CCC) and Current Ratio (CR) for working capital
management. The data analysis was carried out for top 10 textile industries listed
in National Stock Exchange of India for a period of 5 years between 2012 and
2016. The research methodology used in this study is descriptive statistics,
correlation analysis and regression models. The results show that there exists a
significant correlation between the profitability and working capital variables, for
instance, there exists a negative correlation between Return on Assets and
Debtor's Collection Period (DCP), Inventory Holding Period (IHP), Creditor's
Payment Period (CPP) and Cash Conversion Cycle (CCC). Textile being one of
the major sectors in India, the aim of this paper is to provide some useful
recommendation to the people handling this particular department in the industry.
Keywords: Textile, Working Capital Management, Profitability, India, Return on
Asset, Return on Equity, Cash Conversion Cycle, Correlation,
Regression

International Journal of Management Studies ISSN(Print) 2249-0302 ISSN (Online)2231-2528 http://www.researchersworld.com/ijms/
___________________________________________- 79 - Vol-IV, Special Issue-4, November 2017
INTRODUCTION:
Working Capital Management is an important component of Corporate Financial Management.
It shows us the relationship between Current Assets and Current Liabilities. The ultimate
objective of any firm is profit and wealth maximization but at the same time preserving the
liquidity of the firm is an important objective too, hence, proper balance between the short term
assets and current liabilities helps us to minimize the working capital requirement of any firm
and maximize its revenue.
A firm needs to be efficient in managing Working capital in order to increase its cash flows and
eventually decreasing its dependency on external financing. The working capital determines the
liquidity of a firm which is important for the day-to-day operations in order to meet demand and
increase its profitability. A firm should effectively manage its working capital in order to maintain
its risk and profitability and indeed help maximize shareholders value. Also, in-efficient
management of the working capital may increase risk of indebtedness even if the company is
maintaining its profitability. The profitability of a firm indicates the financial gains that a firm
gives and the ability of the firm to earn profits. There are many variables that indicate the
profitability of a firm like Return on Assets, Return on investment and Return on Equity.
Therefore, it becomes essential to study the relation between working capital and profitability.
The Indian Textile sector provides the largest employment in India and contributes almost 14%
to the exports by the country. In order to maintain its position the sector needs to provide high
quality products at economical cost and it also plays important role in the Indian Industrial
sector. The sector has future potential due to high demand in the Indian Market and
international demand; hence this study is important to understand the association between
working capital and profitability in the textile Industry. The study will help firms make certain
important decisions such as decision on inventory levels or the credit period that the firm can
give its debtors in order to clear their bills, so that the profitability of the firm increases and
many more crucial determinations. Therefore the study aims to answer whether there is
relationship between Working Capital and Profitability with the help of certain variables which
are the two subjects of this study.
LITERATURE REVIEW:
Various studies on listed firms in many countries have been performed to study the impact of a
firm’s working capital management on its profitability; different studies employ different
variables and techniques to study this impact. Some of them are as following:
Md. Asaduzzaman and Tabassum Chowdhary (2014) have examined the nature and extent of
the relationship between Working Capital Management and profitability of Bangladeshi Textile
Companies, alongside exploring the joint impact of different components of working capital
management on profitability. For this study and quantitative analysis along with multiple
regressions has been done to analyze the data using deductive approach. The data was collected
from Chittagong Stock Exchange (CSE) in Bangladesh for 21 companies for a period of 5 years
(2008-2012). It was found that working capital management and profitability is positively
correlated in the Bangladeshi textile companies. It was further found that inventory of number
of days, number of day’s accounts receivables and conversion period are positively correlated
with a firm’s profitability but the numbers of day’s accounts payable are negatively correlated.
Mohammad Morshedur Rehman (2011) study was designed to show the Profitability and
Working capital position of textile industries in Bangladesh, correlation between them and
whether the profitability is affected by Working Capital Management. Data was obtained for 9
sample textile companies (Size of company and availability of information was considered
before selection of these companies) in Bangladesh for a period of 3 years (2005-2008). The
study is based on both primary and secondary research whereas primary data was collected
through a questionnaire with an object to know the real practices in the textile industry and for
secondary research; the author relied on Annual reports and official records of the selected
companies. The collected data was analyzed and interpreted with the help of different financial

International Journal of Management Studies ISSN(Print) 2249-0302 ISSN (Online)2231-2528 http://www.researchersworld.com/ijms/
___________________________________________- 80 - Vol-IV, Special Issue-4, November 2017
ratios like Return on Investment, Return on Total Assets etc. and statistical tools like Mean,
Standard Deviation, Correlation Co-efficient etc. It was observed from the study that there
exists a positive correlation between working capital and profitability in the textile industry in
Bangladesh but the overall position is not satisfactory.
Dr. K. Senthikumar and Dr. A. Sengottaiyan (2015) studied the trends of efficiency of Working
Capital utilization of the various selected textile companies in India. 20 Companies were selected
out of a total of 750 companies which were listed at Centre for Monitoring Indian Economy
(CMIE) database on the basis of Net Asset Value exceeding Rs 1,000 crore. The study covers a
period of 15 years from 1997to 2011. The study was based on secondary data; data was collected
from published annual reports from CMIE PROWESS database and other publications such as
Stock exchange official directory, Economic times, Financial Times, RBI Bulletin and other
periodical journals. Three different indices Performance Index (PI), Utilization Index (UI) and
Efficiency Index (EI) were calculated for analysis and alongside ratio techniques and simple
statistical tools were also used. The study has strongly concluded that profitability in terms of
profit margin is significantly affected by decline in days in accounts receivables, days in accounts
payable and cash conversion cycle in textile industry, therefore, concluding that working capital
variables have considerable impact on return on assets of textile firms.
Sidrah Rizwan and Faiza Maqbool Shah, (2015), aimed to study the impact of working capital
management on a firm’s performance in textile spinning companies of Pakistan listed in the
Karachi stock Exchange. A sample of 10 companies had been utilized for this research that
covers a period of 7 years, from 2008 to 2014. The study has selected Return on Equity (ROE)
and Return on Assets (ROA) as the dependent variable for profitability and as for Working
capital management- Account receivable turnover (ARTO), Account payable turnover (APTO)
and Inventory Turnover had been selected as the independent variable. The tools used to
analyze the results were Spearman’s Correlation and Linear Regression Analysis. The study
found a weak negative correlation of ROA and ROE with ARTO, APTO and Inventory
Turnover on the contrary the Hypothesis showed that statistically there exists no relationship
between Working Capital Management and Profitability in a Firm (except inventory turnover
with ROA). The study also suggested that in order to increase profitability, the firms should
follow particular norms to reduce Inventory Turnover.
Malik Muhammad, Waseem Ullah Jan and Kifayat Ullah (2007), in their research aimed to
investigate the relationship between the components of working capital and profitability of a
firm. The data collected was secondary in nature from listed firms in the Karachi stock
exchange. The sample size was 25 companies, with data for the period 2001-2006. The
dependent variable in the study was Profitability while the independent variables were Cash,
Accounts Receivable, Accounts Payable and Inventory. The methodology used to show the
relation is Panel Data Methodology and the tools used to conduct the research were Correlation
and Regression Analysis. The results showed a Positive relationship between the Profitability
and cash, Inventory and Accounts Receivable while it showed a weak negative correlation with
Accounts Payable. This shows that Working Capital Management is important with respect to
Profitability of a Firm in the Textile Industry of Pakistan.
Agrim Aggarwal and Rahul Chaudhary (2015), in their Research paper aimed to study the effect of
Working Capital on the Profitability in Indian Firms. The companies chosen as sample were listed In
the Bombay Stock Exchange and the sample size was 364 companies which were selected based on
certain criteria’s. The study was based on data of period April 2010 to March 2014. In order to
conduct the research Gross Operating Profit Ratio was taken as the dependent variable and average
inventory conversion period, cash conversion cycle, debtors collection period and creditors payment
period were taken as the independent variables. The results found using regression and correlation
analysis showed a negative correlation between the Gross operating Profit Ratio and Debtors
collection period, cash conversion period and inventory conversion period, while it showed a
positive relation with creditor’s payment period. This shows that quick cash conversion period,
quick inventory conversion period, smaller debtor collection period and longer creditor’s payment
period is favourable in Indian firms and that the type of industry also affects the profitability.

International Journal of Management Studies ISSN(Print) 2249-0302 ISSN (Online)2231-2528 http://www.researchersworld.com/ijms/
___________________________________________- 81 - Vol-IV, Special Issue-4, November 2017
Vandana Kotak's and Dr. Abhay Panda's research on impact of working capital on liquidity and
profitability in the cotton textile industry in India (2015) states that the working capital
management policy of a firm depends on its size and age. New firms require maintaining large
stocks of inventory in order to keep the stock from running out and also spend lots of money on
lucrative discounts to lure customers. On the other hand, older larger firms can buy raw
materials on credit basis and enjoy favourable credit terms. By applying the two-way ANNOVA
technique they found the value of 'F' ratios of different sized and aged companies that proved
that there exists a significant difference in the working capital management policy of different
sizes and aged companies. By considering the correlation between the current and quick ratios
and the gross surplus ratio which measures overall profitability, they also proved that higher the
liquidity or liquid asset, lesser is the profitability. Sound liquidity to certain extent increases
profitability, beyond that it reduces profitability.
Hina Agha's objective of research (2014) was to find out if there is any relation between
profitability and working capital management. Return on Assets (ROA) has been taken as the
dependent variable and Creditors turnover ratio, debtor’s turnover Ratio, Inventory turnover
ratio and Current ratio have been taken as the independent variables. A Correlation Matrix has
been used to show the relationship between the dependent and independent variables. It shows a
positive strong relationship between ROA and ITO, ROA and DTO and a moderate relationship
between ROA and CTO. Thus, by increasing inventory turnover and debtor’s turnover and
decreasing creditor’s turnover ratios, the company can increase its profitability.
Dr Asha Sharma's analysis (2014) on working capital management and its effect on profitability
on the steel industry in India. Pearson's Correlation analysis is used to find the relation between
two variables i.e.; Gross working capital and fixed assets, gross working capital and sales, gross
working capital and total assets to measure efficiency. Gross working capital to EBIT ratio has
been used to measure profitability. She concluded that if there is good coordination and
management of working capital, the companies’ efficiency can improve. This in turn shows that
effective use of assets can improve earning capacity and profitability.
The objective of Dr. Arega Seyoum’s, Tadele Tesfay’s and Tadesse’s research paper (2016)
was to examine and analyze the impact of working capital management on the profitability of
food complex manufacturing companies operating around Addis Ababa from 2009 to 2013. The
results provided proof that the Cash Conversion Cycle, as a measure of working capital
management, negatively affects Return on Assets. A negative relationship between the
Receivables Collection Period, strong negative relation of Inventory Conversion Period,
Payment Deferral Period and profitability was also found.
Jyoti Mahato and Udaykumar Jagannathan (2016) studied the impact of working capital
management on profitability for the Indian telecom sector. Return on Assets, Average Collection
Period, Inventory Conversion Period, Average Collection Period, Cash Conversion Cycle, Debt
Ratio, Current Ratio, and Firm Size were taken as variables. Statistical tools such as, Regression
analysis, multiple regression analysis, Correlation analysis, T test, F test and analysis of variance
(ANOVA) and Descriptive Analysis are used. The result of study shows that there is significant
relationship between profitability and working capital management. The correlation analysis
shows that ROA has negative relationship with ACP, ICP, CCC and Current ratio.
Sumaira Tufail studied (2013) the impact of working capital management on profitability of
textile sector in Pakistan. Data for six years (2005-2010) of 117 out of 164 textiles companies in
Pakistan was selected for the study. Panel data methodology was used in this study since the study
consisted observations in a time series manner. A significant positive relationship was found
between working capital financing policy and profitability. The study also found a negative
relation between profitability and degree of aggressiveness of working capital financing policy.
The study also found a significant relationship between liquidity and profitability.
Prof. Chinta Venkateswara and Ramchandran Azhagaiah (Dec 2010) analyzed trend and pattern of
efficiency of working capital management for firms of cotton textile in India. The key indicators
used for the same purpose were Performance Index (PI), Utilization Index (UI), and Efficiency
Index (EI).For the purpose of analysis the selected firms are classified into three size categories i.e.

International Journal of Management Studies ISSN(Print) 2249-0302 ISSN (Online)2231-2528 http://www.researchersworld.com/ijms/
___________________________________________- 82 - Vol-IV, Special Issue-4, November 2017
"Small", "Medium" and "Large" based on average assets. The study reveals that Linear Growth Rate
(LGR) of PI, UI and EI in respect of WC efficiency for small size firms is significant while that of
for medium size firms, the trend of UI alone is significant. The trend of PI, UI and EI for large size
firms is insignificant. On the whole, despite the positive growth in PI, the WCM efficiency of overall
firms is found to be not encouraging because the constant factors are declining, which shows that the
fixed components of WC are more than the varying components of the WC.
Debasish Sur and Sk Mujibar Rahaman (Dec 2014) analyzed profitability status of the 18
selected companies in the Indian textile industry during the period 2002-03 to 2011-12. The
study showed that fixed assets management, inventory management and receivables
management of the companies made notable contribution towards improving their overall
profitability during the study period. Therefore, the textile industry in India should, in
addition to the efficient management of fixed assets, inventory and receivables, also focus on
the management of cash, and loans and advances with a view to strengthening their profit
earning capability. Moreover, in the present competitive global market conditions, the firms
should periodically review and reorient their strategies to achieve their value maximization
objective in the post-liberalization regime.
Azhagaiah and Gejalakshmi (2007) carried out a study for examining the efficiency of working
capital management of 30 selected companies in Indian textile industry during the period 1995-
96 to 2005-06. This study concluded that the efficiency of managing current assets of the
companies under study was one of the contributory factors towards enhancing their profitability.
OBJECTIVE OF THE STUDY:
The objective of the study is to examine, analyze and evaluate the impact of working capital
management on the profitability of Textile industries (general) in India over a period of 5 years
from 2012 to 2016. The specific objectives of the study are as follows:
To study the background, characteristics, growth and development of the Indian Textile Industry.
To determine the nature and extent of relationship between working capital management
and profitability in the Indian Textile Industry and statistically infer it.
To examine the impact of debtor’s collection period, inventory holding period, creditor’s
payment period, cash conversion cycle and current ratio on profitability position of Indian
Textile industries by considering Return on Assets & Return on Equity.
To suggest some measures for improvement in working capital management.
RESEARCH METHODOLOGY:
Type of Data:
Secondary data has been used for this study; therefore a non-survey method has been used
because the accounting information required for this study is easily obtainable from the
published annual reports and various other financial market related websites.
Source of Data:
The textile companies were selected fromwww.moneycontrol.com, after which, secondary data
has been collected from the annual reports of these companies which is reliable since these
reports are both legally audited and published. Moreover, an extensive literature review was
also done by searching different libraries online.
Period of the Study:
The study covers a period of 5 years of selected companies from 2012 to 2016 and an
accounting year of the company consists of 12 months from 1st April to 31st March
accordingly. The reason for restricting to this particular time period is to depict the current
scenario and show the latest trends in the Indian Textile Industry.
Sample Size:
Top 10 Indian Textile (general) companies were selected, representing approximately 90%
market share on the basis of market capitalization which are listed on any recognized Indian
Stock Exchange.

International Journal of Management Studies ISSN(Print) 2249-0302 ISSN (Online)2231-2528 http://www.researchersworld.com/ijms/
___________________________________________- 83 - Vol-IV, Special Issue-4, November 2017
Selected Variables and Computations:
The collected data has been analyzed and interpreted with the help of different financial ratios
as shown below; along with it for evaluation of profitability and working capital management of
selected companies different statistical tools like Correlation Co-efficient Analysis, Regression
Analysis, Multiple regression analysis, T Test, F test, Analysis of Variance (ANOVA) and
descriptive analysis have been used.
Table 1
Variables Abbreviation Measurement
Dependent Variable
Return on Assets ROA (Net Income/ Total Assets) * 100
Return on Equity ROE (Net Profit for Equity Shareholders/ Equity
Share Capital + Reserve & Surplus) * 100
Independent Variable
Debtor's Collection Period DCP (Average Debtors/Net Credit Sales)* 365
Inventory Holding Period IHP (Average Stock/Cost of Goods Sold)* 365
Creditor's Payment Period CPP (Average Creditors/Net Credit Purchases)* 365
Cash Conversion Cycle CCC DCP + IHP – CPP
Current Ratio CR Current Assets/ Current Liabilities
Source: Secondary Data
SCOPE/ LIMITATIONS OF THE STUDY:
a) The study covers only 10 selected Indian Textile firms which are listed only on any
recognized Indian stock exchange; however there are a large number of textile firms which
are operating in the unorganized sector which may reflect a significant impact of working
Capital on profitability and hence modify the actual results of this study.
b) The study is based on secondary data only and is limited to one sector.
c) The findings of this study is limited to only general textile companies, however, textile
companies are divided into composite, weaving, spinning, processing among various other parts.
HYPOTHESIS OF THE STUDY:
a) H0: There is no relationship between ROA and Debtors Collection Period.
H1: There is relationship between ROA and Debtors Collection Period. b) H0: There is no relationship between ROA and Creditors Payment Period.
H1: There is relationship between ROA and Creditors Payment Period. c) H0: There is no relationship between ROA and Inventory Holding Period.
H1: There is relationship between ROA and Inventory Holding Period. d) H0: There is no relationship between ROA and Cash Conversion Cycle.
H1: There is relationship between ROA and Cash Conversion Cycle. e) H0: There is no relationship between ROA and Current Ratio.
H1: There is relationship between ROA and Current Ratio. f) H0: There is no relationship between ROE and Debtors Collection Period.
H1: There is relationship between ROE and Debtors Collection Period. g) H0: There is no relationship between ROE and Creditors Payment Period.
H1: There is relationship between ROE and Creditors Payment Period. h) H0: There is no relationship between ROE and Inventory Holding Period.
H1: There is relationship between ROE and Inventory Holding Period. i) H0: There is no relationship between ROE and Cash Conversion Cycle.
H1: There is relationship between ROE and Cash Conversion Cycle. j) H0: There is no relationship between ROE and Current Ratio.
H1: There is relationship between ROE and Current Ratio.

International Journal of Management Studies ISSN(Print) 2249-0302 ISSN (Online)2231-2528 http://www.researchersworld.com/ijms/
___________________________________________- 84 - Vol-IV, Special Issue-4, November 2017
RESULTS AND FINDINGS:
Descriptive Analysis:
Table 2
Variable Mean Median SD MIN MAX
ROA 4.489 4.542 1.039 2.787 5.492
ROE 8.6 7.967 1.488 7.447 11.061
DCP 104.999 96.205 39.706 65.141 160.57
IHP 95.717 95.071 6.377 88.273 103.883
CPP 97.039 98.602 15.789 71.47 111.075
CCC 103.676 104.928 34.565 54.812 151.841
CR 1.894 1.847 0.364 1.377 2.345
Source: Primary Data
The above table gives us the descriptive statistics of all the dependent and independent variables
used in this research. ROA and ROE are both dependent variables over here which are the main
profitability indicators. ROA of a company shows how efficiently the company uses its assets to
earn returns. The average ROA is measured to be 4.48 with a standard deviation of 1.03 which
indicates that the volatility of ROA. The minimum return on assets the sampled firms earn on an
average is 2.787 and the maximum is 5.42. ROE on the other hand shows the efficiency of a
company to earn revenue per unit of equity. The average return on equity was found to be 8.6
and having a standard deviation of 1.48. The minimum return on equity that the sampled firms
can earn on an average is 7.447 and the maximum is 11.601.
DCP, IHP, CPP, CCP and CR are taken as the independent variables which are the measure of
working capital management. The average debtor’s collection period was found to be 104.9
which mean that the average number of days a debtor takes to pay the samples firms is 104.9
days and the standard deviation of DCP is 39.7. The average of creditor’s collection period was
found to be 97.03 having a standard deviation34.56.The average Inventory holding period is
95.7 days which indicates that the mean time the firms take to sell its inventory is 95.7 days and
the inventory holding period ranges from a minimum period of 88.27 days to a maximum of
103.88 days. The cash conversion period on an average is 103.676 days which means that the
average time the firms in the sector take to convert resources into cash is 103.676 days, the cash
conversion period ranges from 54.81 days to 151.84 days. The Current ratio was calculated at
1.89 having a standard deviation of 0.36.
Correlation Analysis:
Table 3
ROA ROE DCP IHP CPP CCC CR
ROA 1
ROE 0.766323 1
DCP -0.2334 -0.23749 1
IHP -0.41312 -0.52345 -0.08635 1
CPP -0.30175 -0.15212 0.797219 -0.07322 1
CCC -0.30379 -0.50164 0.619518 0.53952 0.182349 1
CR 0.399229 0.105496 -0.01849 -0.21081 -0.02035 -0.13282 1
Source: Primary Data
Prior to the regression result, it is important to check the correlation between various variables
on which the analysis is based. Pearson’s correlation grid is used to check the relationship
between variables.

International Journal of Management Studies ISSN(Print) 2249-0302 ISSN (Online)2231-2528 http://www.researchersworld.com/ijms/
___________________________________________- 85 - Vol-IV, Special Issue-4, November 2017
The above table shows the correlation between the selected variables of Working Capital and
Profitability. Correlation coefficient signifies the change in one variable due the change in the
other variable that is the relationship between the two variables. The ROA shows a negative
correlation with DCP. This means that earlier the Debtors pay the bills, the more the company is
efficient in converting its credit sales and thus increasing profitability. A low DCP would also
mean that the company is able to renew its inventory due to higher availability of cash and thus
the ROA would increase. The results also show a negative correlation between the ROA and the
IHP, which shows that if the inventory holding period is shorter, it would mean higher
profitability. A negative correlation between the ROA and CCP means the lower the Creditors
payment period the higher the Return on Assets. A low creditors Payment period would mean
that the companies are able to pay their creditors faster thus attracting business, therefore
increasing sales and eventually the return on assets. The cash conversion cycle indicates the
time a firm takes to convert its resources to cash, by collecting cash from its debtors and sales of
inventory and paying of its creditors for raw material.
The results show a negative correlation between the ROA and the CCC, which means the faster
the company recovers cash the more the return on assets. This negative correlation shows that
the companies in this sector are efficient in investing in resources in order to increase sales and
are able to recover the cash thus having higher profitability. There is a positive correlation
between the ROA and CR as shown in the table below. A higher current ratio indicates that the
companies in the sector have enough current assets to pay off its current liabilities thus
attracting more business and therefore higher return on assets.
The table shows a negative correlation between ROE and DCP, IHP, CCP and CCC. The
correlation between ROE and DCP indicates that the faster the debtors pay the bills; the
company is able to increase production due to availability of cash thereby increasing sales and
thus increasing the Return on Equity. The negative Correlation between ROA and IHP indicates
that the lower the Inventory holding period the higher will be the Return on Equity. Low
inventory holding period indicates the companies are able to make faster sales of its goods thus
making the firms more profitable, therefore the negative relation shows the efficiency of the
sector. There is negative correlation between the ROE and CCP shows that the firms are being
able to pay off their creditors faster thus attracting more customers and therefore higher
profitability. There is also a negative correlation between the ROE and the CCC which means
that the sector is systematic in converting their resources in final products and sales and creating
cash availability for operations thus making them more profitable. There is a positive
correlation between the CR and ROE which shows that, as the current ratio increases the Return
on equity increases because the firm is efficient in its operations.
Regression Analysis:
Relationship between ROA and DCP
Table 4
Summary Output
Regression Statistics
Multiple R 0.2334
R Square 0.05448
Adjusted R Square 0.03436
Standard Error 5.77975
Observations 49
ANOVA
df SS MS F
Regression 1 90.4598 90.4598 2.70792
Residual 47 1570.06 33.4056
Total 48 1660.52

International Journal of Management Studies ISSN(Print) 2249-0302 ISSN (Online)2231-2528 http://www.researchersworld.com/ijms/
___________________________________________- 86 - Vol-IV, Special Issue-4, November 2017
Coefficients Standard
Error t Stat P-value
Intercept 5.185 0.97934 5.2944 3.09E-06
DCP -0.0083 0.00507 -1.6456 0.10652
Source: Primary Data
In the above table we can see that the coefficient value of the independent variable (DCP) is
negative. Thus, there exists a negative relationship between ROA and DCP. An increase in the
DCP by one day will decrease the ROA by 0.0083.
The P-value is 0.106, which is greater than the significance level of 0.05. Thus, we will accept
the null hypothesis and reject the alternate hypothesis. There is no relationship between ROA
and DCP.
Relationship between ROA and IHP:
Table 5
SUMMARY OUTPUT
Regression Statistics
Multiple R 0.413120972
R Square 0.170668937
Adjusted R Square 0.153023595
Standard Error 5.412990095
Observations 49
ANOVA
df SS MS F
Regression 1 283.3993661 283.3994 9.672181
Residual 47 1377.121703 29.30046
Total 48 1660.521069
Coefficients Standard Error t Stat P-value
Intercept 7.521443794 1.287909805 5.840039 4.70E-07
IHP -0.033495666 0.010770266 -3.11001 0.003176
Source: Primary Data
In the above table we can see that the coefficient value of IHP is negative, and hence we can
conclude that there is a negative relationship between ROA and IHP. The coefficient value also
indicates that as the IHP increases by 1 day the ROA would decrease by 0.033.
The p-value is 0.00317, which is less than the significance level of 0.05. And hence we reject
the null hypothesis and accept the alternate hypothesis. There is a negative significant
relationship between ROA and IHP. The R squared value of 0.17 indicates that 17% of the
changes in ROA can be predicted from the changes in IHP.
Relationship between ROA and CPP:
Table 6
SUMMARY OUTPUT
Regression Statistics
Multiple R 0.301749
R Square 0.091052
Adjusted R Square 0.071713
Standard Error 5.666863
Observations 49
International Journal of Management Studies ISSN(Print) 2249-0302 ISSN (Online)2231-2528 http://www.researchersworld.com/ijms/
___________________________________________- 87 - Vol-IV, Special Issue-4, November 2017
ANOVA
df SS MS F
Regression 1 151.1943 151.1943 4.708148
Residual 47 1509.327 32.11333
Total 48 1660.521
Coefficients Standard Error t Stat P-value
Intercept 5.977047 1.11343 5.368138 2.40E-06
CPP -0.01714 0.007897 -2.16983 0.035109
Source: Primary Data
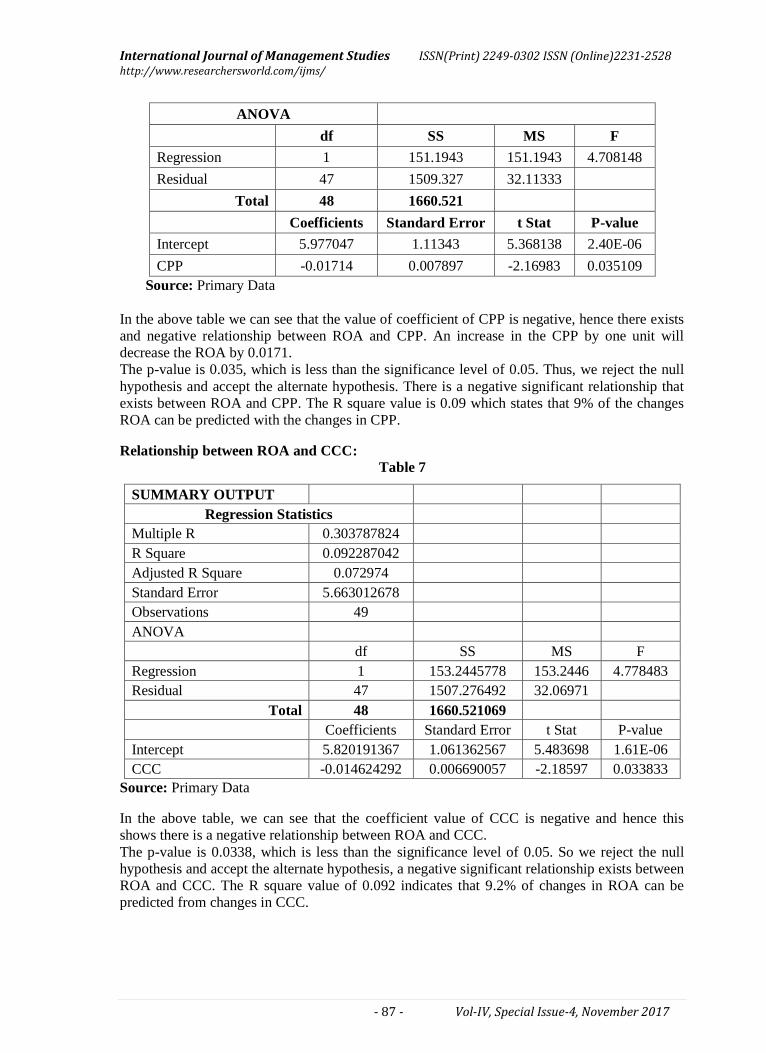
In the above table we can see that the value of coefficient of CPP is negative, hence there exists
and negative relationship between ROA and CPP. An increase in the CPP by one unit will
decrease the ROA by 0.0171.
The p-value is 0.035, which is less than the significance level of 0.05. Thus, we reject the null
hypothesis and accept the alternate hypothesis. There is a negative significant relationship that
exists between ROA and CPP. The R square value is 0.09 which states that 9% of the changes
ROA can be predicted with the changes in CPP.
Relationship between ROA and CCC:
Table 7
SUMMARY OUTPUT
Regression Statistics
Multiple R 0.303787824
R Square 0.092287042
Adjusted R Square 0.072974
Standard Error 5.663012678
Observations 49
ANOVA
df SS MS F
Regression 1 153.2445778 153.2446 4.778483
Residual 47 1507.276492 32.06971
Total 48 1660.521069
Coefficients Standard Error t Stat P-value
Intercept 5.820191367 1.061362567 5.483698 1.61E-06
CCC -0.014624292 0.006690057 -2.18597 0.033833
Source: Primary Data
In the above table, we can see that the coefficient value of CCC is negative and hence this
shows there is a negative relationship between ROA and CCC.
The p-value is 0.0338, which is less than the significance level of 0.05. So we reject the null
hypothesis and accept the alternate hypothesis, a negative significant relationship exists between
ROA and CCC. The R square value of 0.092 indicates that 9.2% of changes in ROA can be
predicted from changes in CCC.

International Journal of Management Studies ISSN(Print) 2249-0302 ISSN (Online)2231-2528 http://www.researchersworld.com/ijms/
___________________________________________- 88 - Vol-IV, Special Issue-4, November 2017
Relationship between ROA and CR:
Table 8
SUMMARY OUTPUT
Regression Statistics
Multiple R 0.399229
R Square 0.159383
Adjusted R Square 0.141498
Standard Error 5.449695
Observations 49
ANOVA
df SS MS F
Regression 1 264.6596 264.6596 8.911344
Residual 47 1395.861 29.69918
Total 48 1660.521
Coefficients Standard Error t Stat P-value
Intercept 2.157348 1.063089 2.02932 0.04811
CR 1.134502 0.380044 2.985187 0.004488
Source: Primary Data
In the above table, we can see that the coefficient value of CR is positive and hence it shows a
positive relationship between ROA and CR.
The p-value is 0.00448, which is less than the significance level of 0.05 and hence we reject the
null hypothesis and accept the alternate hypothesis. A positive significant relationship exists
between ROA and CR. The R square value of 0.159 indicates that 15.9% of the variance ROA
can be predicted from the variance in CR.
Relationship between ROE and DCP:
Table 9
SUMMARY OUTPUT
Regression Statistics
Multiple R 0.237489422
R Square 0.056401226
Adjusted R Square 0.036324656
Standard Error 14.54923667
Observations 49
ANOVA
df SS MS F
Regression 1 594.6746804 594.6747 2.809306
Residual 47 9948.97352 211.6803
Total 48 10543.6482
Coefficients Standard Error t Stat P-value
Intercept 10.70202826 2.465263729 4.341129 7.49E-05
DCP -0.021393449 0.012763838 -1.6761 0.10036
Source: Primary Data
In the above table, the coefficient value of DCP is negative and hence a negative relationship
exists between DCP and ROE. An increase in DCP by one day will decrease the ROE by 0.021.
The p-value is 0.1003, which is greater than the significance level of 0.05. Hence, we accept the
null hypothesis and reject the alternate hypothesis. No relationship exists between ROE and
DCP. The R square value is 0.056 which indicates that 5.6% of variations in ROE can be
predicted from variations in DCP.

International Journal of Management Studies ISSN(Print) 2249-0302 ISSN (Online)2231-2528 http://www.researchersworld.com/ijms/
___________________________________________- 89 - Vol-IV, Special Issue-4, November 2017
Relationship between ROE and IHP:
Table 10
SUMMARY OUTPUT
Regression Statistics
Multiple R 0.523451094
R Square 0.274001048
Adjusted R Square 0.258554262
Standard Error 12.76187602
Observations 49
ANOVA
df SS MS F
Regression 1 2888.97066 2888.971 17.73839
Residual 47 7654.67754 162.8655
Total 48 10543.6482
Coefficients Standard Error t Stat P-value
Intercept 18.70679222 3.036426258 6.160793 1.54E-07
IHP -0.106945065 0.025392397 -4.2117 0.000114
Source: Primary Data
In the above table, the coefficient value of IHP is negative and hence a negative relationship
exists between ROE and IHP.
The p-value is 0.00011, which is less than the significance level of 0.05, hence we reject the
null hypothesis and accept the alternate hypothesis. There exists a negative significant
relationship between ROE and IHP. The R square value indicates that 27.4% changes in ROE
can be predicted from the changes in IHP.
Relationship between ROE and CPP:
Table 11
SUMMARY OUTPUT
Regression Statistics
Multiple R 0.152116344
R Square 0.023139382
Adjusted R Square 0.002355114
Standard Error 14.80344605
Observations 49
ANOVA
df SS MS F
Regression 1 243.9735036 243.9735 1.113312
Residual 47 10299.6747 219.142
Total 48 10543.6482
Coefficients Standard Error t Stat P-value
Intercept 10.58700801 2.908594278 3.639905 0.000677
CPP -0.021767131 0.020629689 -1.05514 0.296757
Source: Primary Data
In the above table, CPP has a negative coefficient value; therefore a negative relationship exists
between ROE and CPP. An increase in CPP by one day will decrease the ROE by 0.0217.
The p-value of 0.296 is greater than the significance level of 0.05. Thus we accept the null
hypothesis and reject the alternate hypothesis. There exists no relationship between ROE and CPP
International Journal of Management Studies ISSN(Print) 2249-0302 ISSN (Online)2231-2528 http://www.researchersworld.com/ijms/
___________________________________________- 90 - Vol-IV, Special Issue-4, November 2017
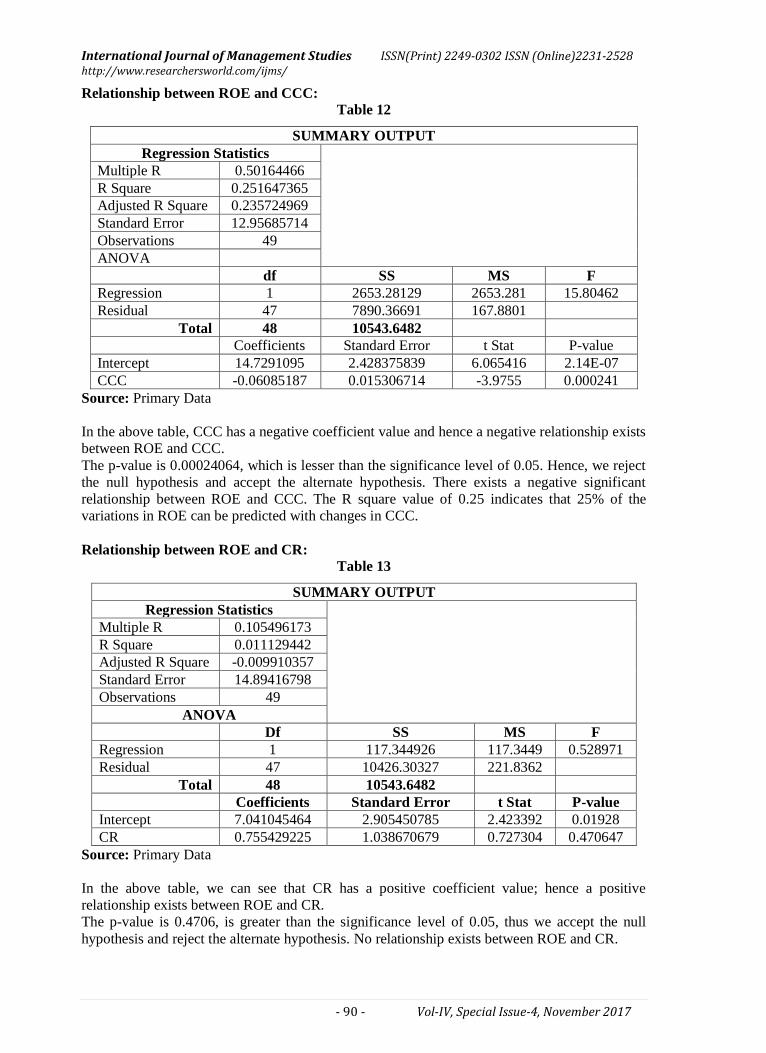
Relationship between ROE and CCC:
Table 12
SUMMARY OUTPUT
Regression Statistics
Multiple R 0.50164466
R Square 0.251647365
Adjusted R Square 0.235724969
Standard Error 12.95685714
Observations 49
ANOVA
df SS MS F
Regression 1 2653.28129 2653.281 15.80462
Residual 47 7890.36691 167.8801
Total 48 10543.6482
Coefficients Standard Error t Stat P-value
Intercept 14.7291095 2.428375839 6.065416 2.14E-07
CCC -0.06085187 0.015306714 -3.9755 0.000241
Source: Primary Data
In the above table, CCC has a negative coefficient value and hence a negative relationship exists
between ROE and CCC.
The p-value is 0.00024064, which is lesser than the significance level of 0.05. Hence, we reject
the null hypothesis and accept the alternate hypothesis. There exists a negative significant
relationship between ROE and CCC. The R square value of 0.25 indicates that 25% of the
variations in ROE can be predicted with changes in CCC.
Relationship between ROE and CR:
Table 13
SUMMARY OUTPUT
Regression Statistics
Multiple R 0.105496173
R Square 0.011129442
Adjusted R Square -0.009910357
Standard Error 14.89416798
Observations 49
ANOVA
Df SS MS F
Regression 1 117.344926 117.3449 0.528971
Residual 47 10426.30327 221.8362
Total 48 10543.6482
Coefficients Standard Error t Stat P-value
Intercept 7.041045464 2.905450785 2.423392 0.01928
CR 0.755429225 1.038670679 0.727304 0.470647
Source: Primary Data
In the above table, we can see that CR has a positive coefficient value; hence a positive
relationship exists between ROE and CR.
The p-value is 0.4706, is greater than the significance level of 0.05, thus we accept the null
hypothesis and reject the alternate hypothesis. No relationship exists between ROE and CR.

International Journal of Management Studies ISSN(Print) 2249-0302 ISSN (Online)2231-2528 http://www.researchersworld.com/ijms/
___________________________________________- 91 - Vol-IV, Special Issue-4, November 2017
CONCLUSION:
Working Capital plays a vital role in the organizations operations, enhancing profitability and
reducing the risk of insolvency. The aim of the study was to establish a relationship between the
Working capital and Profitability in the Indian Textile Industry. After having conducted the
analysis, the results imply that there exists a relationship between working capital and
profitability. According to the correlational analysis there exists a weak negative correlation
between the profitability variables, ROA and ROE and the working capital ratios DCP, IHP,
CCP and CCC. There is a positive relation between ROA and ROE and the working capital the
variable CR. The Regression analysis was used to check a significant impact on profitability.
The results show that IHP, CPP, CCC and CR have a significant impact on profitability as
compared to DCP whereas IHP and CCC have a significant impact on ROE as compared to CR,
CPP and DCP. Therefore, the ability of the firm to continuously operate in longer period will
depend on how firms deal with investment in working capital management as shortage of it may
lead to lack of liquidity and result in loss of production, sales and also goodwill.
The following has been concluded as per the table shown below which can help the industry to
identify the areas where they can focus for better performance.
Table 14
Variable Correlation with Profitability Significance
ROA ROE ROA ROE
Debtor's Collection Period Negative Negative Low Low
Inventory Holding Period Negative Negative High High
Creditor's Payment Period Negative Negative High Low
Cash Conversion Cycle Negative Negative High High
Current Ratio Positive Positive High Low
Source: Primary Data
RECOMMENDATIONS/ SUGGESTION:
a) In order to finance working capital needs companies should try to consider implementing
effective working capital management policies as discussed in this paper and not rely on
traditional sources of finance such as borrowing from bank
b) Industry should focus more on their inventory management study and avoid over stocking
of inventory and try to maintain good relations with supplier
c) The industry should also try to improve on reducing their cash conversion cycle, hence;
they should focus on developing and implementing effective CCC strategies which is both
interrelated and coordinated.
d) Another suggestion for future research is to focus on sources of working capital and to
ensure an optimal capital mix in order to ensure maximum liquidity and also try to study the
non-listed companies alongside other sectors within the industry.
REFERENCES:
Asaduzzaman, M., & Chowdhury, T. (2014). Effect of Working Capital Management on Firm
Profitibility: Empirical Evidence from Textiles Industry of Bangladesh. Research
Jornal ofFinance and Accounting, 5(8).
Rahman, M. M. (2011, January-June). Working Capital Management and Profitibility: A study
on Textiles Industry. ASA University Review, 5(1)
Senthikumar, D., & Sengottaiyan, D. (2015, July). Effeciency of Working Capital Management
with Reference to Select Textile Industry in India. International Journal of Emerging
Research in Management & Technology, 4(7).

International Journal of Management Studies ISSN(Print) 2249-0302 ISSN (Online)2231-2528 http://www.researchersworld.com/ijms/
___________________________________________- 92 - Vol-IV, Special Issue-4, November 2017
Agrim Aggarwal and Rahul Chaudhary (2015). Effect of Working Capital Management on
Profitability of Indian Firms. IOSR Journal of Business and Management (IOSR-JBM).
Malik Muhammad, Waseem Ullah Jan and Kifayat Ullah. Working Capital Management and
Profitability: An Analysis of Firms of Textile Industries of Pakistan. Journal of
Managerial Sciences, 6(2).
Sidrah Rizwan and Faiza Maqbool Shah(2015). Impact of Working Capital Management on
Firm's Performance. A case of Textile Spinning Sector in Pakistan. International
Journal of Scientific and Engineering Research, 6 (11).
Vandana Kotak and Abhay Panda (2015). Impact of working capital on Liquidity and
Profitability of Indian Cotton Industry. Abhinav National Monthly Referred Journal of
research in Commerce and Management, 4(7).
Hina Agha (2014). Impact of Working Capital Management on Profitability. Europeran
Scientific Journal.
Dr. Asha Sharma (2014). Effect of Working Capital Management on the Steel Industry in India.
Rao, Chinta Venkateswara; Azhagaiah, Ramachandran; Rao, K Chandrasekhara (Dec 2010).
Financial Management Focus On Working Capital Utilization In The Indian Cotton Textile
Industry: Methodological Analysis Journal of Financial Management and Analysis
Rahaman, Sk Mujibar; Sur, Debasish (Dec 2014). Profitability Trends in Selected Textile
Companies in India: A Cross-Sectional Analysis, IUP Journal of Business Strategy
Azhagaiah R and Gejalakshmi S (2007). Working Capital Management Efficiency Analysis,
UdyogPragathi, Vol. 31, No. 3, pp. 15-90.
Dr. Arega Seyoum, Tadele Tesfay, Tadesse Kassahun. Working Capital Management and its
impact on profitability evidence from food complex manufacturing firms in Addis
Ababa. International Journal of Scientific and Research Publications, Volume 6, Issue
6, June 2016.
*****