impact response of reinforced concrete beam and its
TRANSCRIPT

Impact Response of Reinforced Concrete Beam and ItsAnalytical Evaluation
Kazunori Fujikake1; Bing Li2; and Sam Soeun3
Abstract: This paper examines the impact responses of reinforced concrete �RC� beams through an experimental study and presents ananalytical model developed to predict the maximum midspan deflection and maximum impact load, which aids as an important perfor-mance index to evaluate the damage levels of RC beams when subjected to impact loadings. The experimental study involves a drophammer impact test and investigates the influence of drop height and the effect of the amount of longitudinal steel reinforcementcontributes to the response of RC beams. The RC beam specimens used in the experiment comprised of under-reinforced sectionsprovided with sufficient amount of transverse reinforcements to allow for an overall flexural failure. The experimental impact responsesof the RC beams were simulated with two-degree-of-freedom mass-spring-damper system model, in which the loading rate effects wereduly considered. The analytical results are in good agreement with the experimental results for the RC beams that exhibited overallflexural failure.
DOI: 10.1061/�ASCE�ST.1943-541X.0000039
CE Database subject headings: Concrete beams; Reinforced concrete; Impact loads; Loading rates; Deflection; Degrees of freedom.
Introduction
Some reinforced concrete �RC� structures must be designed forimpact loads, which may result from the crashing of compara-tively rigid heavy objects at low velocities, such as falling rocksin mountain areas and falling heavy loads dealt with in factoriesand warehouses due to accidents. A rational examination of thestructural safety of the RC structures subjected to impact loadingsis essential to develop a performance-based impact resistant de-sign approach, in addition to currently available design specifica-tions for impact loadings �e.g., American Association of StateHighway and Transportation Officials �AASHTO� 1991; UKAtomic Energy Authority �UKAEA� 1990�. Impact loading, ingeneral, is an extremely severe loading condition characterized byits application of a force of great intensity within a short duration.The behavior of a structural component under impact loading mayconsist of two response phases, as shown in Fig. 1: the localresponse due to the stress wave that occurs at the loading pointduring a very short period after impact; and the overall responseincluding the free vibration effect due to the elastic-plastic defor-mation that occurs over a long period in the whole structuralmember after impact. The overall response depends predomi-nantly on the loading rate effect and the dynamic behavior of thestructural component.
Overall failure tends to be a major issue concerning RC beams
1Professor, Dept. of Civil and Environmental Engineering, NationalDefense Academy, Yokosuka 239-8686, Japan.
2Associate Professor, School of Civil and Environmental Engineering,Nanyang Technological Univ., Singapore 639798, Singapore.
3Graduate Student, Dept. of Civil and Environmental Engineering,National Defense Academy, Yokosuka 239-8686, Japan.
Note. This manuscript was submitted on June 29, 2008; approved onMarch 4, 2009; published online on July 15, 2009. Discussion periodopen until January 1, 2010; separate discussions must be submitted forindividual papers. This paper is part of the Journal of Structural Engi-neering, Vol. 135, No. 8, August 1, 2009. ©ASCE, ISSN 0733-9445/
2009/8-938–950/$25.00.938 / JOURNAL OF STRUCTURAL ENGINEERING © ASCE / AUGUST 2009
subjected to impact loading �e.g., Hughes and Beeby 1982; Ish-ikawa et al. 2000; Kishi et al. 2001; Yamamoto et al. 2003; Kishiet al. 2003�. In contrast, local failure, such as penetration, scab-bing, perforation and/or punching shear, tends to be the predomi-nant mode of failure for RC plates subjected to impact loadings�e.g., Miyamoto et al. 1991; Agardh and Laine 1999; Dancygier2000; Li and Chen 2003; Zhang et al. 2005; Dancygier et al.2007�.
A clear correlation has been established between the maximumdeformation response and the degree of flexural damage to theRC beam subjected to impact loads based on previous researchworks �Fujikake et al. 2006�. The damage levels of the RC beamvary from no damage to moderate damage, severe damage andcomplete collapse with increasing maximum deformation. There-fore, to properly investigate the structural safety of RC beamsunder impact loading, it is important to estimate both its flexuralcapacity and its maximum deformation response as an importantdamage index.
In this study, a drop hammer impact test was performed ontwelve specimens of RC beams. The influence of drop height andthe amount of longitudinal reinforcement on the impact responsesof the RC beams was investigated. Nonlinear analysis was carriedout to evaluate the flexural capacity of the RC beams with theirrespective loading rate effects and is subsequently presented. Fi-nally, an analytical model to determine the maximum midspandeflection of RC beams subjected to impact loadings at its mid-span was developed.
Experimental Program
Test Specimens
The RC beam specimens as illustrated in Fig. 2 have cross-sectional dimensions of 250 mm in depth, 150 mm in width, and1,700 mm in length. The details of the test RC beams are given in
Table 1. The three variations of longitudinal reinforcement pro-
vided within the beam specimens include D13, D16, and D22deformed bars. The yield strengths of D13, D16, and D22 were397 MPa, 426 MPa, and 418 MPa, respectively. D10 bars spaced75 mm apart with a yield strength of 295 MPa were used asstirrups. The bending and shear resistances for each RC beamwere calculated based on JSCE Concrete Standard �Japan Societyof Civil Engineers �JSCE� 2002�, and tabulated in Table 2. Theshear resistance varied from 50–155% larger than its bending re-sistance. Therefore, all RC beams are expected to be weaker inflexure �i.e., flexure controlled beams�.
The mix proportion of the ready-mixed concrete used to castthe RC beams is tabulated in Table 3. The aggregates used had amaximum size of 10 mm. All tests were performed within a pe-riod of 4 days after 70 days of casting. The concrete compressivestrength at the time of testing was 42.0 MPa.
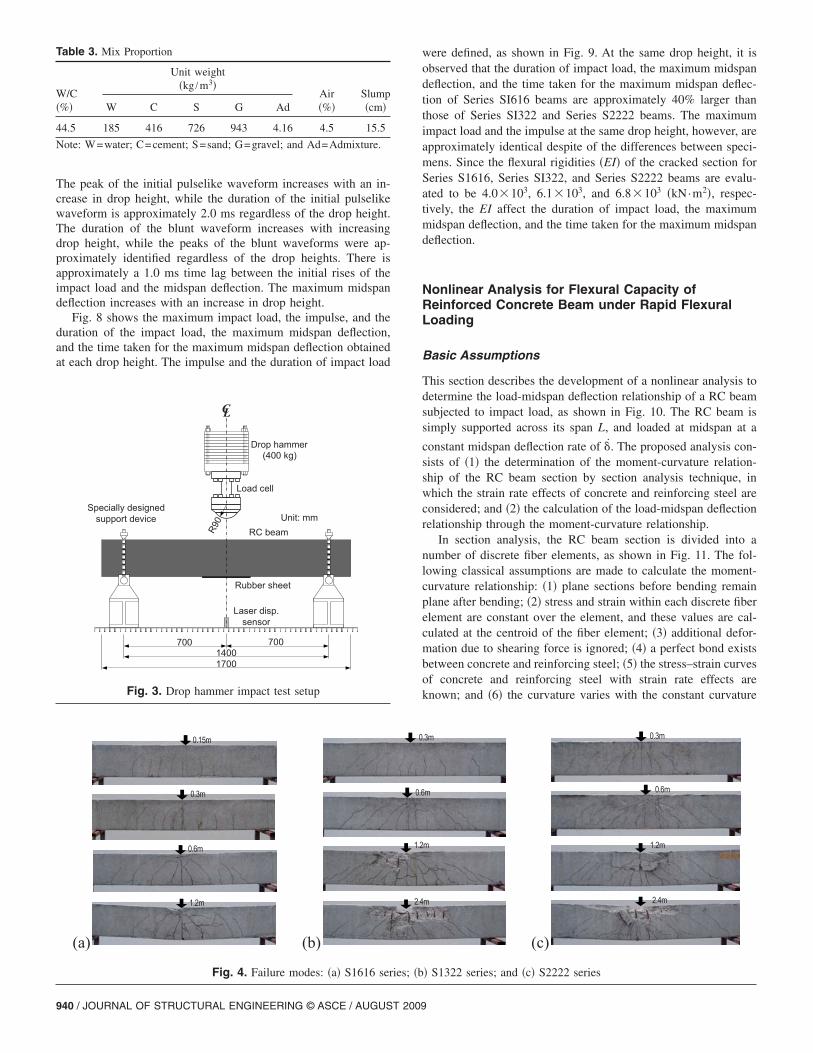
Impact Loading Test
For impact loading, a drop hammer impact loading machine wasused, as shown in Fig. 3. A drop hammer with a mass of 400 kgwas dropped freely onto the top surface of the RC beam at mid-span from four different heights: 0.15, 0.3, 0.6, and 1.2 m forSeries S1616 beam specimens; 0.3, 0.6, 1.2, and 2.4 m for SeriesSI322 and Series S2222 beam specimens. The striking head of thedrop hammer had a hemispherical tip with a radius of 90 mm. TheRC beam was supported over a span of 1,400 mm with speciallydesigned devices, allowing it to freely rotate while preventing itfrom moving out of displacement.
The contact force developed between the hammer and the RCbeam was measured using a dynamic load cell, which was rigidly
Table 1. Longitudinal Bar Arrangement
Designation
Compression side Tension side
Number and size�mm�
Area As��mm2�
Number and size�mm�
Area As
�mm2�
S1616 2-D16 397 2-D16 397
S1322 2-D13 126.7 2-D22 774
S2222 2-D22 774 2-D22 774
Transmission of stress waveLocal response
Overall response
Local failure
Impactor
Overall failure
Fig. 1. Impact responses of a RC member
JOURN
connected to the drop hammer. The midspan deflection responseof the RC beam was measured using a laser displacement sensor.The sensor uses a thin rubber sheet mounted on the bottom of theRC beam as a target to measure the response. The computer-baseddata acquisition system recorded the data at a sampling rate of100 kHz.
Experimental Results
Failure Mode
Typical failure modes obtained in the impact loading test areshown in Fig. 4. Series S1616 beams exhibited an overall flexuralfailure at all the drop heights. For Series SI322 and Series S2222beams, the overall flexural failure was observed only at a dropheight of no more than 0.6 m �1.97 ft�. Local failure with heavilycrushed concrete near the loading point was observed at a dropheight of not less than 1.2 m. The longitudinal tension reinforce-ment ratios are 1.26% for Series S1616 beams and 2.46% forSeries SI322 and Series S2222 beams. The balanced reinforce-ment ratio is calculated to be 4.28%. Thus, it is noteworthy thatfor the RC beam with an under-reinforced section �Pillai et al.1999�, increasing the amount of tensile reinforcement can causelocal failure near the impact loading point. Furthermore, it isnoted that the amount of longitudinal compressive reinforcementtends to affect the degree of the local failure since the length ofthe local failure for Series S1322 beams is approximately 20%larger than that for Series S2222 beams.
Impact Responses
Figs. 5–7 show the measured impact loads and midspan deflec-tions in Series S1616, Series SI322, and Series S2222 beams. Themeasured impact loads are characterized by an initial pulselikewaveform with comparatively high amplitude followed by a bluntwaveform with comparatively low amplitude, as shown in manyprevious researches �e.g., Hughes and Beeby 1982; Ishikawa et al.2000; Kishi et al. 2001; Yamamoto et al. 2003; Kishi et al. 2003�.
Table 2. Bending and Shear Resistances
Designation
Bending resistanceRM =4 Mu /L
�kN�
Shear resistanceRS=2 Vu
�kN� RS /RM
S1616 91.1 232.0 2.55
S1322 162.2 245.4 1.51
S2222 162.6 245.4 1.51
(a)
(b)
70150
40 40
250
210
4040
170
1,70022@75=1,65025 25
250
Unit: mm
Fig. 2. Rebar arrangement: �a� cross-sectional view; �b� side view
AL OF STRUCTURAL ENGINEERING © ASCE / AUGUST 2009 / 939
The peak of the initial pulselike waveform increases with an in-crease in drop height, while the duration of the initial pulselikewaveform is approximately 2.0 ms regardless of the drop height.The duration of the blunt waveform increases with increasingdrop height, while the peaks of the blunt waveforms were ap-proximately identified regardless of the drop heights. There isapproximately a 1.0 ms time lag between the initial rises of theimpact load and the midspan deflection. The maximum midspandeflection increases with an increase in drop height.
Fig. 8 shows the maximum impact load, the impulse, and theduration of the impact load, the maximum midspan deflection,and the time taken for the maximum midspan deflection obtainedat each drop height. The impulse and the duration of impact load
1400700
1700
Unit: mm
700
R90
Rubber sheet
Laser disp.sensor
Drop hammer
RC beam
CL
Specially designedsupport device
Load cell
(400 kg)
Fig. 3. Drop hammer impact test setup
Table 3. Mix Proportion
W/C�%�
Unit weight�kg /m3�
Air�%�
Slump�cm�W C S G Ad
44.5 185 416 726 943 4.16 4.5 15.5
Note: W=water; C=cement; S=sand; G=gravel; and Ad=Admixture.
(a) (b)
0.15m
0.3m
0.6m
1.2m
Fig. 4. Failure modes: �a� S1616 ser
940 / JOURNAL OF STRUCTURAL ENGINEERING © ASCE / AUGUST 2009
were defined, as shown in Fig. 9. At the same drop height, it isobserved that the duration of impact load, the maximum midspandeflection, and the time taken for the maximum midspan deflec-tion of Series SI616 beams are approximately 40% larger thanthose of Series SI322 and Series S2222 beams. The maximumimpact load and the impulse at the same drop height, however, areapproximately identical despite of the differences between speci-mens. Since the flexural rigidities �EI� of the cracked section forSeries S1616, Series SI322, and Series S2222 beams are evalu-ated to be 4.0�103, 6.1�103, and 6.8�103 �kN·m2�, respec-tively, the EI affect the duration of impact load, the maximummidspan deflection, and the time taken for the maximum midspandeflection.
Nonlinear Analysis for Flexural Capacity ofReinforced Concrete Beam under Rapid FlexuralLoading
Basic Assumptions
This section describes the development of a nonlinear analysis todetermine the load-midspan deflection relationship of a RC beamsubjected to impact load, as shown in Fig. 10. The RC beam issimply supported across its span L, and loaded at midspan at a
constant midspan deflection rate of �̇. The proposed analysis con-sists of �1� the determination of the moment-curvature relation-ship of the RC beam section by section analysis technique, inwhich the strain rate effects of concrete and reinforcing steel areconsidered; and �2� the calculation of the load-midspan deflectionrelationship through the moment-curvature relationship.
In section analysis, the RC beam section is divided into anumber of discrete fiber elements, as shown in Fig. 11. The fol-lowing classical assumptions are made to calculate the moment-curvature relationship: �1� plane sections before bending remainplane after bending; �2� stress and strain within each discrete fiberelement are constant over the element, and these values are cal-culated at the centroid of the fiber element; �3� additional defor-mation due to shearing force is ignored; �4� a perfect bond existsbetween concrete and reinforcing steel; �5� the stress–strain curvesof concrete and reinforcing steel with strain rate effects areknown; and �6� the curvature varies with the constant curvature
(c)
.3m
m
m
m
0.3m
0.6m
1.2m
2.4m
� S1322 series; and �c� S2222 series
0
0.6
1.2
2.4
ies; �b

rate �̇ given as a function of the constant midspan deflection rate
�̇, to incorporate the rate dependences of the constituent materials.
Stress–Strain Relationship of Concrete with StrainRate Effect
As shown in Fig. 12, the following stress–strain relationship ofconcrete is introduced for compression under any strain rate �̇:
� =AX + �B − 1�X2
1 + �A − 2�X + BX2 fcd� �1�
where A, B=constants; X=normalized strain and fcd� =dynamiccompressive strength corresponding to a strain rate �̇. The rela-tionship given by Eq. �1� is determined by three parameters,which are the initial elastic modulus E0d, the dynamic compres-sive strength fcd� , and the strain corresponding to the dynamiccompressive strength �cd� . Those parameters are given as a func-
˙
(a)
(b)
(c)
(d)
-50050100150200250
0 0.005 0.01 0.015 0.02 0
AnalysisExperiment
Impactforce(kN)
Time (s)
-100
0
100
200
300
0 0.005 0.01 0.015 0.02 0.025
AnalysisExperiment
Impactforce(kN)
Time (s)
-100
0
100
200
300
400
0 0.005 0.01 0.015 0.02 0.025 0.03
AnalysisExperiment
Impactforce(kN)
Time (s)
-1000
100200300400500
0 0.005 0.01 0.015 0.02 0.025 0.03
AnalysisExperiment
Impactforce(kN)
Time (s)
Fig. 5. Impact response for S1616: �a� drop height=0.15 m; �b� d
tion of the strain rate � as follows �Fujikake et al. 2001�:
JOURN
E0d = E0� �̇
�̇sc�0.002�log��̇/�̇sr��
1.12
�2�
fcd� = fc�� �̇
�̇s�0.006�log �̇/�̇sr�
1.05
�3�
�cd� = �c�� �̇
�̇sc�−0.036+0.01 log��̇/�̇sr�
�4�
where E0= initial elastic modulus for static loading �MPa�; E0
=3 ,320�fc�+6,900 �MPa�; �̇sc=1.2�10−5 �1/s�; fc�=compressivestrength under static loading �MPa�; �c�=strain corresponding tofc�; and if �̇��̇sc then E0d=E0, fcd� = fc�, and �cd� =�c�. The constantsA and B and the normalized strain X are defined in Table 4 �Ue-bayashi et al. 2001�.
It is assumed that the unloading and reloading behaviors incompression follow a straight line with a slope equal to the initial
0
5
10
15
20
0 0.005 0.01 0.015 0.02 0.025
AnalysisExperiment
Midspandeflection(mm)
Time (s)
051015202530
0 0.005 0.01 0.015 0.02 0.025 0.03
AnalysisExperiment
Midspandeflection(mm)
Time (s)
0
10
20
30
40
0 0.005 0.01 0.015 0.02 0.025 0.03 0.035
AnalysisExperiment
Midspandeflection(mm)
Time (s)
0
10
20
30
40
50
0 0.005 0.01 0.015 0.02 0.025 0.03 0.035
AnalysisExperiment
Midspandeflection(mm)
Time (s)
ight=0.3 m; �c� drop height=0.6 m; and �d� drop height=1.2 m
.025
0.03
0.035
0.035
rop he
elastic modulus E0d, as shown in Fig. 12. In the descending
AL OF STRUCTURAL ENGINEERING © ASCE / AUGUST 2009 / 941

branch after the dynamic compressive strength, the point corre-sponding to 20% of the dynamic compressive strength is definedas an ultimate state in this study.
On the other hand, as shown in Fig. 12, the stress–strain rela-tion of concrete in tension is given as
� = E0d� � � �td �5a�
� =� − �tu
�tu − �tdf td �td � � � �tu �5b�
� = 0 � � �tu �5c�
where f td=dynamic tensile strength at the strain rate �̇; �td
=strain corresponding to the dynamic tensile strength �=f td /E0d�;and �tu=−4.0�10−4. The dynamic tensile strength is given as
(a)
(b)
(c)
(d)
-100
0
100
200
300
400
0 0.005 0.01 0.015 0.02
AnalysisExperiment
Impactforce(kN)
Time (s)
-100
0
100
200
300
400
0 0.005 0.01 0.015 0.02
AnalysisExperiment
Impactforce(kN)
Time (s)
-1000
100200300400500
0 0.005 0.01 0.015 0.02 0.025
AnalysisExperiment
Impactforce(kN)
Time (s)
-200
0
200
400
600
800
0 0.005 0.01 0.015 0.02 0.025 0.03
AnalysisExperiment
Impactforce(kN)
Time (s)
Fig. 6. Impact response for S1322: �a� drop height=0.3 m; �b� d
�Ross et al. 1989�
942 / JOURNAL OF STRUCTURAL ENGINEERING © ASCE / AUGUST 2009
f td = f t exp�0.00126�log10�̇
�̇st�3.373 �6�
in which �̇st=1.0�10−7; f t=tensile strength under static loading= f t=−0.23fc�
2/3 �Japan Society of Civil Engineers �JSCE� 2002�;and if �̇��̇st then f td= f t. It is assumed that after cracking occurs,the unloading and reloading in tension follow the straight linewith a degraded elastic modulus, as shown in Fig. 12.
Stress–Strain Relationship of Reinforcing Steel withStrain Rate Effect
For reinforcing steel, a bilinear stress–strain relationship isadopted, as shown in Fig. 13. It is assumed that the elastic modu-lus Es and the strain hardening modulus Esp are independent ofloading rates following the experimental results by Limberger etal. �1982� and Ammann et al. �1982�. The effect of the loading
0
5
10
15
20
0 0.005 0.01 0.015 0.02 0.025
AnalysisExperiment
Midspandeflection(mm)
Time (s)
0
5
10
15
20
25
0 0.005 0.01 0.015 0.02 0.025
AnalysisExperiment
Midspandeflection(mm)
Time (s)
0
10
20
30
40
0 0.005 0.01 0.015 0.02 0.025 0.03
AnalysisExperiment
Midspandeflection(mm)
Time (s)
0102030405060
0 0.005 0.01 0.015 0.02 0.025 0.03 0.035
AnalysisExperiment
Midspandeflection(mm)
Time (s)
ight=0.6 m; �c� drop height=1.2 m; and �d� drop height=2.4 m
0.025
0.025
0.03
0.035
rop he
rate on the yield strength is considered. The following formula-

tion proposed by Takahashi �Japan Society of Civil Engineers�JSCE� 1993� is adopted to determine dynamic yield strength�fsyd�:
fsyd = fsys�1.202 + 0.040 � log10 �̇� � fsys �7�
where fsyd=dynamic yield strength at any strain rate �̇ and f sys
=static yield strength.Finally, the stress–strain relationship for reinforcing steel is
given as
� = Es � � for � �syd �8a�
� = fsyd + Esp�� − �syd� for � � �syd �8b�
in which �syd=strain corresponding to the dynamic yield strength:�syd= fsyd /Es and Esp=strain hardening modulus. It is also as-sumed that after yielding, the unloading and reloading follow the
(a)
(b)
(c)
(d)
-100
0
100
200
300
400
0 0.005 0.01 0.015
AnalysisExperiment
Impactforce(kN)
Time (s)
-100
0
100
200
300
400
0 0.005 0.01 0.015 0.02
AnalysisExperiment
Impactforce(kN)
Time (s)
-200
0
200
400
600
0 0.005 0.01 0.015 0.02
AnalysisExperiment
Impactforce(kN)
Time (s)
-200
0
200
400
600
800
0 0.005 0.01 0.015 0.02 0.025
AnalysisExperiment
Impactforce(kN)
Time (s)
Fig. 7. Impact response for S2222: �a� drop height=0.3 m; �b� d
straight line with a slope equal to Es.
JOURN
Relationship between Midspan Deflection Rate andCurvature Rate
When section analysis is performed on a simply supported RCbeam subjected to a rapid flexural load at midspan, as shown in
Fig. 10, the relationship between the midspan deflection rate ��̇�of the RC beam and the curvature rate ��̇� at the section is re-quired to calculate the strain rate at each fiber element in thisanalysis. Based on the linear elastic theory, the relationship be-tween the midspan deflection and the curvature, as shown in Fig.10, can be given as �Gere 2003�
� =M
EI=
12
L2 � �9�
In a similar manner, it is simply assumed that the following rela-
tionship exists between the curvature rate �̇ and the midspan˙
0
5
10
15
20
0 0.005 0.01 0.015 0.02
AnalysisExperiment
Midspandeflection(mm)
Time (s)
0
5
10
15
20
25
0 0.005 0.01 0.015 0.02 0.025
AnalysisExperiment
Midspandeflection(mm)
Time (s)
0
10
20
30
40
0 0.005 0.01 0.015 0.02 0.025
AnalysisExperiment
Midspandeflection(mm)
Time (s)
0102030405060
0 0.005 0.01 0.015 0.02 0.025 0.03
AnalysisExperiment
Midspandeflection(mm)
Time (s)
ight=0.6 m; �c� drop height=1.2 m; and �d� drop height=2.4 m
0.02
0.025
0.025
0.03
rop he
deflection rate �
AL OF STRUCTURAL ENGINEERING © ASCE / AUGUST 2009 / 943

�̇ =12
L2 �̇ �10�
This assumption seems to be reasonable because the influence ofloading rate on the mechanical properties of RC is expressed as afunction of the logarithmic value of the strain rate.
(a) (b)
(d)
����������������������������������������������������������������������������
������������������������������������������������������������������������������������������������������������
�����������������������������������������������������������������������������������������������������������������������������������������������������������
����������������������������������������������������������������������������������������������������������������������������������������
0
100
200
300
400
500
0.15 0.3 0.6 1.2 2.4
S1616������������ S1322
S2222
Max.impactload(kN)
Drop height (m)
0
500
1000
1500
2000
2500
3000
3500
4000
0.15
Impulse(N.sec)
������������������������������������
����������������������������������������������������
������������������������������������������������������������������������������������������������
�������������������������������������������������������������������������������������������������������������������������������������������������
0
10
20
30
40
50
0.15 0.3 0.6 1.2 2.4
S1616������������
S1322S2222
Max.midspandeflection(mm)
Drop height (m)
Fig. 8. Impact responses: �a� maximum impact load; �b� impulse; �ctaken for maximum midspan deflection
Impa
ctlo
ad*+ t
F
st et
* +Ðe
s
t
tdttF
se tt /
Fig. 9. Impulse and duration of impact load
f
f%
L
Constantdeflection
rate
Rapid loading
Fig. 10. Analytical object
944 / JOURNAL OF STRUCTURAL ENGINEERING © ASCE / AUGUST 2009
Analytical Moment-Curvature Relationship
Dividing the RC section into n-fiber concrete elements andm-fiber rebar elements, as shown in Fig. 11, an axial load andbending moment acting on the section at any curvature � aregiven as
N =A
�dA = �i=1
��c.iAc.i + �
j=1
��s.jAs.j �11�
(c)
d)
��������������������������������������������������������������������������������������������
������������������������������������������������������������������������������������������������������������������������
��������������������������������������������������������������������������������������������������������������������������������������������������������
0.6 1.2 2.4
616322222
height (m)
������������������������������������������������������������������������
��������������������������������������������������������������������������������
����������������������������������������������������������������������������������������������������
������������������������������������������������������������������������������������������������������������������������������������
0
0.005
0.01
0.015
0.02
0.025
0.03
0.035
0.04
0.15 0.3 0.6 1.2 2.4
S1616������������ S1322
S2222
Durationofimpactload(s)
Drop height (m)
��������������������������������������������������������������������
�����������������������������������������������������������������������������������������������
��������������������������������������������������������������������������������������������������������
��������������������������������������������������������������������������������������������������������������������������������
0
0.005
0.01
0.015
0.02
0.025
0.15 0.3 0.6 1.2 2.4
S1616������������ S1322
S2222
Timetakenfor
max.midspandeflection(s)
Drop height (m)
tion of impact load; �d� maximum midspan deflection; and �e� time
icy ,icA , ic,uic,g
js,g
i-th concrete fiberelement
0y
jsy ,
h%
ic,g%
js,g%
Strain and strain-rate distributions Stress distributions
js,u
h
h
Fiber element
j-th rebarelement
jsA ,
Concrete Rebar
Fig. 11. Section analysis considering strain rate distribution
dE0
tdf
cdf |
tdg
cdg | cudg |
cdf |2.0tug
dE0
Fig. 12. Stress–strain relationship for concrete
(
������������������������������������������������������������������������������������������
0.3
S1������������
S1S2
Drop
� dura

M =A
�ydA = �i=1
��c.ivc.iAc.i + �
j=1
��s.jvs.jAs.j �12�
where �c.i=stress acting on the ith concrete fiber element; Ac.i
=area of the ith concrete element; �s.j =stress of the jth rebar fiberelement; As.j =area of the jth rebar element; yc.i=distance fromthe extreme compression fiber to the centroid of the ith concretefiber element; and ys.j =distance from the extreme compressionfiber to the centroid of the jth rebar fiber element. In the beammember, the condition of N=0 must be satisfied by adjusting aneutral axis depth y0 as no axial force is acted on the section.
From a linear distribution of strains across the section depth inthe assumptions, the strains of the ith concrete fiber element andof the jth rebar element can be expressed as
�c.i = �y0 − yc.i� � � �13a�
�s.j = �y0 − ys.j� � � �13b�
where y0=distance from the extreme compression fiber to theneutral axis and �=curvature of the section.
From the basic assumptions, strain rates vary linearly with
depth at the section as well. Once the curvature rate �̇ is given byEq. �10�, the strain rate at each fiber element is determined as
�̇c.i = ��y0 − yc.i�� � �̇ �14a�
�̇s.j = ��y0 − ys.j�� � �̇ �14b�
Therefore, the stresses of any concrete fiber element and of anyrebar element ��c.i ,�s.j� are calculated with the strains ��c.i ,�s.j�and the strain rates ��̇c.i , �̇s.j� of the corresponding elements.
Analytical Load-Midspan Deflection Relationship
The load-midspan deflection relationship of a RC beam subjected
to rapid flexural loading at the midspan deflection rate �̇ is calcu-lated based on the moment-curvature relationship obtained from
the section analysis at the curvature rate �̇ given by Eq. �10�. Themidspan deflection of the RC beam can be calculated by integrat-ing the curvature distribution over one-half the length of the RCbeam. The curvature distribution is determined from the moment
Table 4. Constants of A and B and Normalized Strain X
Ascending portion ���cd� � Descending portion ����cd� �
A=E0d�cd� / fcd� , A=E0d�cd� / fcd� , B=1,
B= �A−1�2 /0.55�1−A,X=� /�cd� X= �� /�cd� �m where m=1.04+2� �fcd� /100�2
sydf
sE
spE
Stress
Strainsydg
sE
Fig. 13. Stress–strain relationship for reinforcing steel
JOURN
distribution corresponding to the impact load applied and takingthe boundary conditions into consideration. In the calculation, aconstant curvature region with a length Lp is taking place at mid-span for expressing the plastic deformation within a plastic hingeregion. The length of the plastic hinge region may be given as�Mattock 1967�
Lp = d + 0.05L �15�
in which d=effective depth and L=span.
Verification
A rapid flexural loading test on the same RC beams S1616,S1322, and S2222 used in the impact loading test were employedto validate the developed analysis approach. In the test, the RCbeams were simply supported over a span of 1,400 mm �66.9 in.�and loaded at midspan at the midspan deflection rates of 5.0�10−4 and 2.0 m/s �1.64�10−3 and 6.56 ft/s�. The load acting onthe RC beam was measured through a load cell. The deformationresponse of the RC beam was measured by using a laser displace-ment transducer at midspan. In the measured load, the inertia loadevaluated from acceleration, which was derived as second-orderderivations of the measured midspan deflection with respect totime, was eliminated from the measured load to evaluate the in-fluence of the loading rate on the true bending resistance of theRC beam �Banthia et al. 1989�.
The proposed analysis was applied to the experimental data.The calculations were carried out until the extreme compressionfiber reached to the ultimate state. The elastic and strain harden-ing modulus of the reinforcing bars were 200 GPa and 3 GPa,respectively. The concrete compressive strength was 42 MPa.Figs. 14–16 show the experimental and the analytical results. Asshown in Figs. 14–16, the influence of dynamic vibrations is stillobserved in the experimentally obtained load-midspan deflectionrelationships at the midspan deflection rate of 2.0 m/s, while the
(a) (b)
0
20
40
60
80
100
120
140
160
0 5 10 15 20 25 30 35 40
ExperimentAnalysis
Load(kN)
Midspan deflection (mm)
0
20
40
60
80
100
120
140
160
0 5 10 15 20 25 30 35 40
ExperimentAnalysisLo
ad(kN)
Midspan deflection (mm)
Fig. 14. Load-midspan deflection relations for S1616: �a� loadingrate=5.0�10−4 m /s; �b� loading rate=2.0 m /s
(a) (b)
0
50
100
150
200
250
300
0 5 10 15 20 25 30 35 40
ExperimentAnalysis
Load(kN)
Midspan deflection (mm)
0
50
100
150
200
250
300
0 5 10 15 20 25 30 35 40
ExperimentAnalysis
Load(kN)
Midspan deflection (mm)
Fig. 15. Load-midspan deflection relations for S2222: �a� loadingrate=5.0�10−4 m /s; �b� loading rate=2.0 m /s
AL OF STRUCTURAL ENGINEERING © ASCE / AUGUST 2009 / 945

inertia loads were delaminated assuming the first mode vibration.These vibration effects may result from the higher frequencymodes of more than the third vibration mode, which cannot bedelaminated by the inertia correction method based on the firstvibration mode. However, it can be seen that the analytical resultsare in good agreement with the averaged experimental results forall cases. The experimentally obtained load-midspan deflectionrelationships have enough load carrying capacity even afterreaching a midspan deflection of 30 or 40 mm. Thus, the analyti-cally calculated ultimate midspan deflections seem to be practical.
Analytical Evaluation of the Response of ReinforcedConcrete Beam under Impact Loading
Impact Response Analysis
The RC beam subjected to the drop hammer impact at midspanmay be modeled by two-degree-of-freedom mass-spring-dampersystem, as illustrated in Fig. 17 �Fujikake 2007�. This analyticalmodel can represent not only the overall response of the RC beambut also the local response at the contact point between the drophammer and the RC beam with the least degrees of freedom. Thespring k1 expresses the load-midspan deflection relationship ofthe RC beam with loading rate effects determined from the non-linear analysis described in the previous section. After the drophammer with an initial impact velocity vib hits the RC beam atmidspan, the RC beam, and the drop hammer move together with
(a) (b)
0
50
100
150
200
250
300
0 5 10 15 20 25 30 35 40
ExperimentAnalysis
Load(kN)
Midspan deflection (mm)
0
50
100
150
200
250
300
0 5 10 15 20 25 30 35 40
ExperimentAnalysis
Load(kN)
Midspan deflection (mm)
Fig. 16. Load-midspan deflection relations for S1322: �a� loadingrate=5.0�10−4 m /s; �b� loading rate=2.0 m /s
400 kg
Part expressing the overresponse of a RC Beam
Part expressing the localimpact response betweendrop weight and a RC Bea
Drop hammer
Fig. 17. Two-degree-of-freedom
946 / JOURNAL OF STRUCTURAL ENGINEERING © ASCE / AUGUST 2009
the same velocity via. This assumes a perfectly plastic collision�Suzuki et al. 1996�. From the conservation of momentum law,the velocity via is given as
via =m2
m1 + m2vib �16�
where m1=equivalent mass of RC beam �=17AcL /35=60 kg:=density of RC beam=2,400 kg /m3, Ac=sectionalarea of RC beam� and m2=mass of hammer �=400 kg�. The mid-span deflection rate of the RC beam yields a maximum value justafter impact and becomes zero at the maximum midspan deflec-tion. Thus, the midspan deflection rate of the RC beam should bechanging continuously. In this study, the load-midspan deflectionrelationship of the RC beam is evaluated on the assumption thatthe RC beam deforms at the velocity via given by Eq. �16�. Thisassumption is reasonable because the influence of loading rate onthe mechanical properties of the RC beam is expressed as a func-tion of the logarithmic value of the strain rate. The contact springk2 is assumed to be 120,000 kN/m based on Hertz’s contacttheory �Timoshenko and Goodier 1984�. The damping coeffi-cients c1 and c2 are assumed to be 0 and one-half of a criticaldamping coefficient for the part expressing the local responsegiven as the following equation, respectively.
c2 =� m1m2
m1 + m2k2 �17�
The analytical impact responses in the impact load and midspandeflection and those obtained from the impact test are shown inFigs. 5–7. The analytical results were shown to be in good agree-ment with the experimental results when the RC beams exhibitedonly an overall flexural failure. There was, however, a big differ-ence between the analytical and experimental midspan deflectionresponses of Series 1322 and S2222 beam specimens when sub-jected to a drop height of 2.4 m. It exhibited both local failurenear the impact loading point and an overall flexural failure mode.The local failure observed in the RC beams was presumed to havebeen formed at the first peak of the impact load, which is approxi-mately 400 kN. Therefore, as a result of a large consumption oftotal impact energy input used to form the local failure shortlyafter impact, the experimental maximum midspan deflection ap-peared to be small as compared to that of the analytical one. Theexperimental maximum midspan deflections for Series S1322 and
1k
2k
1c
2c
1u
2u 2m
1m
Load
Disp.
Compression side
Tension side
Compression sideLoad
Disp.Quasi-static response of RC beam
Response of interface spring
s-spring-damper system model
all
am}}mas

S2222 beam specimens subjected to a drop height of 2.4 m areapproximately 33% and 18% smaller than the analytical ones,respectively. The fact that the extent of the local failure for SeriesS1322 beam specimens was larger than that of the Series S2222beam specimens, it is suggested that the difference in maximummidspan deflections between the experiment and the analysis islager for Series S1322 beam specimens as compared to the SeriesS2222 ones.
Dissipation Energy and Analytical Model for MaximumMidspan Deflection
Typical time variations of energy calculated by a two-degree-of-freedom mass-spring-damper system model are shown in Fig. 18.
-1000
0
1000
2000
3000
4000
5000
6000
0 0.005 0.01 0.015 0.02 0.025
Energy(J)
Time (s)
Dissipated energy of c2
Strain energy of k1
Kinetic energy of m1and m
2
Potential energy of m1and m
2
Strain energy of k2
Initial impact energy
Fig. 18. Typical time variation of energy at drop height=1.2 m forS1616
0
500
1000
1500
2000
0 0.5 1 1.5 2 2.5 3
S1616S1322S2222
Dissipationenergy(J)
Drop height (m)
Eq.(18)
Fig. 19. Relationship between dissipation energy and drop height
(a) (b)0
10
20
30
40
50
0 0.2 0.4 0.6 0.8 1 1.2 1.4
ExperimentTwo-DOF analysisEq.(19)
Maximum
midspan
deflection(mm)
Drop height (m)
S1616
0
10
20
30
40
50
0 0
Maximum
midspan
deflection(mm)
Fig. 20. Relationship between maximum midspan defl
JOURN
At the maximum midspan deflection, the strain energy stored byspring k1 reaches its highest value; and the kinetic energy of m1
and m2 comes to zero. It should be noted that the energy dissi-pated by dashpot c2 reaches approximately 13% of the initialimpact energy given by m2vib
2 /2. In the two-degree-of-freedommodel analysis, energy obtained by summing up the energy dis-sipated by damper c2 and the energy stored within spring k2 untilthe maximum midspan deflection is defined as dissipation energy.Fig. 19 shows the relationship between the dissipation energy andthe drop height. The dissipation energy linearly increases with anincrease in drop height, as illustrated in Fig. 19.
On the other hand, assuming a perfectly plastic collision be-tween the drop hammer and the RC beam, energy loss can becalculated by
ER =m1m2
2�m1 + m2�vib
2 �18�
where vib=�2gh �g=acceleration of gravity, h=drop height�.The relationship given by Eq. �18� is shown in Fig. 19. As can
be seen in Fig. 19 that the dissipation energy calculated by thetwo-degree-of-freedom model fits with the relationship given byEq. �18�. Therefore, the following energy conservation equationcan be drawn with consideration given to dissipation energy:
m2vib2
2− ER + �m1 + m2�g�max =
0
�max
P���d� �19�
where g=acceleration of gravity and P ���=load �P�-midspandeflection ��� relationship for the spring k1.
Eq. �19� provides a means to calculate the maximum midspandeflection of a RC beam subjected to impact loading withoutusing the impact response analysis with the two-degree-of-freedom system model. The maximum midspan deflections esti-mated by the two-degree-of-freedom model analysis and Eq. �17�,and those obtained from the impact test are shown in Fig. 20. Theanalytical results were shown to be in good agreement with theexperimental results when the RC beams exhibited only an over-all flexural failure.
Tables 5–7 summarizes the analytically obtained maximummidspan deflections ��max� and ultimate midspan deflections ��u�,together with the velocities of the drop hammer just before andafter impact �vib , via�. The ultimate midspan deflections for Se-ries S1616, S1322, and S2222 beam specimens were estimated tobe about 15.7 mm, 11.5 mm, and 14.1 mm, respectively. Theultimate drop height, defined as the drop height at which themaximum midspan deflection equaled to the ultimate midspandeflection, for Series S1616, S1322, and S2222 beam specimens
(c)1.5 2 2.5 3
tanalysis
p height (m)
S1322
0
10
20
30
40
50
0 0.5 1 1.5 2 2.5 3
ExperimentTwo-DOF analysisEq.(19)
Maximum
midspan
deflection(mm)
Drop height (m)
S2222
and drop height: �a� S1616; �b� S1322; and �c� S2222
.5 1
ExperimenTwo-DOFEq.(19)
Dro
ection
AL OF STRUCTURAL ENGINEERING © ASCE / AUGUST 2009 / 947

are estimated to be 0.48 m, 0.6 m, and 0.76 m, respectively. Themaximum midspan deflection exceeded the ultimate midspan de-flection when the hammer was dropped at a height higher than theultimate height.
In this proposed analytical procedure, the examination of thestructural safety for the RC beam under impact loading is madepossible by comparing the analytical maximum deformation re-sponse with its ultimate deformation capability, as shown in Fig.21. For example, in Table 5, the maximum midspan deflections ata drop height not more than 0.3 m are smaller than the ultimatemidspan deflections; these cases can be considered safe. Themaximum midspan deflections for Series S1322 and S2222 beamspecimens at a drop height of 2.4 m exceed the correspondingultimate midspan deflections, as shown in Tables 6 and 7; thesecases can be considered unsafe. It is, however, currently impos-sible to determine the allowable impact load shown in Fig. 21 asa criterion for the local failure. Thus, it warrants further researchon the local failure.
Conclusions
Based on the results presented in this paper, the following con-clusions were drawn:1. The amount of longitudinal reinforcement significantly af-
fected the failure modes of RC beams under impact loading.The RC beam with comparatively lower amounts of longitu-dinal steel reinforcement exhibited only overall flexural fail-ure, while the RC beam with the comparatively higher
Table 5. �u and �max for S1616
Drop height�m�
vib
�m/s�via
�m/s��u
�mm��max
a
�mm��max
b
�mm�
0.15 1.72 1.49 15.5 5.8 6.1
0.30 2.43 2.10 15.6 10.2 10.5
0.60 3.43 2.97 15.7 18.8 19.2
1.20 4.85 4.21 15.8 36.0 36.6aBy two-degree-of-freedom analysis.bBy Eq. �19�.
Table 6. �u and �max for S1322
Drop height�m�
vib
�m/s�via
�m/s��u
�mm��max
a
�mm��max
b
�mm�
0.30 2.43 2.10 11.2 6.3 6.7
0.60 3.43 2.97 11.4 11.3 11.7
1.20 4.85 4.21 11.6 21.3 21.8
2.40 6.86 5.95 11.8 41.2 41.7aBy two-degree-of-freedom analysis.bBy Eq. �19�.
Table 7. �u and �max for S2222
Drop height�m�
vib
�m/s�via
�m/s��u
�mm��max
a
�mm��max
b
�mm�
0.30 2.43 2.10 13.9 6.3 6.6
0.60 3.43 2.97 14.0 11.2 11.5
1.20 4.85 4.21 14.1 20.7 21.1
2.40 6.86 5.95 14.3 39.6 40.1aBy two-degree-of-freedom analysis.b
By Eq. �19�.948 / JOURNAL OF STRUCTURAL ENGINEERING © ASCE / AUGUST 2009
amounts of longitudinal reinforcement exhibited not only theoverall flexural failure but also local failure located near im-pact loading point due to the large impact from the loadingacting on a single point.
2. The amount of longitudinal compression reinforcement af-fected the degree of the local failure. Local failure was sub-stantially reduced when heavy longitudinal compressionreinforcement was provided. Thus, it can be concluded thatcompression reinforcement helps to increase the resistance ofa beam local response when subjected to impact loading.
3. The following characteristics of impact responses: the maxi-mum impact load, the impulse, the duration of impact load,the maximum midspan deflection, and the time taken for themaximum midspan deflection increased as the drop heightwas increased. The duration of impact load, the maximummidspan deflection, and the time taken for the maximummidspan deflection were affected by the flexural rigidity ofthe RC beams.
4. A nonlinear analysis was carried out to determine the load-midspan deflection relationship of the RC beam and the ef-fects of loading rates were developed.
5. An analytical model was developed to determine the maxi-mum midspan deflection. The maximum midspan deflectionis an important index for evaluating damage levels of RCbeams subjected to impact loading. The analytical model wasshown to be in good agreement with the experimental mid-span deflection when the RC beams exhibited only an overall
allowablePP ~max
ultimateff ~max
ultimatef
maxPmaxf
allowableP
Fig. 21. Design flow of RC beam subjected to impact loading
flexural failure.
6. It was observed that the local failure was formed shortly afterimpact by comparing the analytical midspan deflections tothose obtained from the experiments conducted.
Acknowledgments
The writers thank K. Masuda and K. Hagishima, who are formerstudents in the National Defense Academy, Japan for their assis-tance in performing the impact loading test and rapid loading test.
Notation
The following symbols are used in this paper:A � constant for stress–strain relationship of
concrete;Ac � cross section area of RC beam;
Ac,i � area of the ith concrete fiber element;As,j � area of the jth rebar fiber element;
B � constant for stress–strain relationship ofconcrete;
c1 � damping coefficient for overall response;c2 � damping coefficient for local response;d � effective depth;
Es � elastic modulus of reinforcing steel;Esp � strain hardening modulus of reinforcing steel;E0 � initial elastic modulus of concrete under static
loading;E0d � initial elastic modulus of concrete at strain rate
�̇;EI � flexural rigidity;fc� � compressive strength of concrete under static
loading;fcd� � dynamic compressive strength of concrete at
strain rate �̇;fsyd � dynamic yield strength of reinforcing steel at any
strain rate �̇;f sys � yield strength of reinforcing steel under static
loading;f t � tensile strength of concrete under static loading;
f td � dynamic tensile strength of concrete at strain rate�̇;
g � acceleration of gravity;k1 � load-midspan deflection relationship of RC
beam;k2 � load-displacement relationship of contact spring;L � span;
Lp � length of plastic hinge region;M � bending moment;m1 � equivalent mass of RC beam;m2 � mass of hammer;N � axial load;
P�t� � load eliminating inertia load;Pi�t� � inertia load;
Pm�t� � load measured by a load cell;P��� � load-midspan deflection relationship;
u1 � midspan deflection of RC beam;u2 � displacement of drop hammer;X � normalized strain;
via � velocity of hammer and RC beam just after
impact;JOURN
vib � velocity of drop hammer just before impact;yc.i � distance from the extreme compression fiber to
the centroid of the ith concrete fiber element;ys.j � distance from the extreme compression fiber to
the centroid of the jth rebar fiber element;�0�t� � acceleration at midspan;
� � midspan deflection of RC beam;�max � maximum midspan deflection of RC beam;
�u � ultimate midspan deflection of RC beam;
�̇ � midspan deflection rate of RC beam;� � strain;
�c,i � strain of the ith concrete fiber element;�s.j � strain of the jth rebar fiber element;�syd � strain corresponding to dynamic yield strength of
reinforcing steel;�td � strain corresponding to dynamic tensile strength
of concrete;�tu � critical tensile strain of concrete �=−4.0�10−4�;�c� � strain corresponding to static compressive
strength of concrete;�cd� � strain corresponding to dynamic compressive
strength of concrete;�̇ � any strain rate;
�̇c.i � strain rate of the ith concrete fiber element;�̇sc � reference strain rate �=1.2�10−5 /s� for concrete
in compression;�̇st � reference strain rate �=1.0�10−7 /s� for concrete
in tension;�̇s,j � strain rate of the jth rebar fiber element;
� density of RC beam;� � stress;
�c.i � stress acting on ith concrete fiber element;�s.j � stress of jth rebar fiber element;
� � curvature; and
�̇ � curvature rate.
References
Agardh, L., and Laine, L. �1999�. “3D FE-simulation of high-velocityfragment perforation of reinforced concrete slabs.” Int. J. ImpactEng., 22, 911–922.
American Association of State Highway and Transportation Officials�AASHTO�. �1991�. Guide specifications and commentary for vesselcollision design of highway bridges, AASHTO, Washington, D.C.
Ammann, W., Mühlematter, M., and Bachmann, H. �1982�. “Stress-strainbehaviour of non-prestressed and prestressed reinforcing steel at highstrain rates.” Proc., RILEM/CEB/IABSE/IASS Interassociation Symp.on Concrete Structures under Impact and Impulsive Loading, BAM,Berlin, 146–156.
Banthia, N. P., Mindess, S., Bentur, A., and Pigeon, M. �1989�. “Impacttesting of concrete using a drop-weight impact machine.” Exp. Mech.,29�1�, 63–69.
Dancygier, A. N. �2000�. “Scaling of non-proportional non-deformingprojectiles impacting reinforced concrete barriers.” Int. J. ImpactEng., 24, 33–55.
Dancygier, A. N., Yankelevsky, D. Z., and Jaegermann, C. �2007�. “Re-sponse of high performance concrete plates to impact of non-deforming projectiles.” Int. J. Impact Eng., 34, 1768–1779.
Fujikake, K. �2007�. “Response analysis of RC beams subjected to impactloads.” Proc., 1st Int. Workshop on Performance, Protection, andStrengthening of Structures under Extreme Loading �CD-ROM�, Univ.of British Columbia, Vancouver.
Fujikake, K., Mori, K., Uebayashi, K., Ohno, T., and Mizuno, J. �2001�.
AL OF STRUCTURAL ENGINEERING © ASCE / AUGUST 2009 / 949

“Constitutive model for concrete materials with high-rates of loadingunder tri-axial compressive stress states.” Proc., 3rd Int. Conf. onConcrete under Severe Conditions, Vol. 1, JSCE, Tokyo, 636–643.
Fujikake, K., Senga, T., Ueda, N., Ohno, T., and Katagiri, M. �2006�.“Study on impact responses of reactive powder concrete beam and itsanalytical model.” J. Adv. Concr. Technol., 4�1�, 99–108.
Gere, J. M. �2003�. Mechanics of materials, 6th Ed., Brooks/Cole,Belmont.
Hughes, G., and Beeby, A. W. �1982�. “Investigation of the effect ofimpact loading on concrete beams.” Struct. Eng., 60B�3�, 45–52.
Ishikawa, N., Katsuki, S., and Takemoto, K. �2000�. “Dynamic analysisof prestressed concrete beams under impact and high speed loadings.”Proc., 6th Int. Conf. on Structures under Shock and Impact, WITPress, Southampton, 247–256.
Japan Society of Civil Engineers �JSCE�. �1993�. “Impact behavior anddesign of structures.” Structural Engineering Series 6, JSCE, Tokyo�in Japanese�.
Japan Society of Civil Engineers �JSCE�. �2002�. Standard specificationsfor concrete structures 2002, structural performance verification,JSCE, Tokyo �in Japanese�.
Kishi, N., et al. �2003�. “Round robin analysis of RC beam subjected toan impact load due to a falling weight.” Proc., 1st Int. Conf. on De-sign and Analysis of Protective Structure against Impact/Impulsive/Shock Loads, DAPSIL, Tokyo, 305–318.
Kishi, N., Ikeda, K., Mikami, H., and Yamaguchi, E. �2001�. “Dynamicbehavior of RC beams under steel weight impact loading-effects ofnose-shape of steel weight.” Proc., 3rd Int. Conf. on Concrete UnderSevere Conditions, Univ. of British Columbia, Vancouver, 660–667.
Li, Q. M., and Chen, X. W. �2003�. “Dimensionless formulae for penetra-tion depth of concrete target impacted by a non-deformable projec-tile.” Int. J. Impact Eng., 28, 93–116.
Limberger, E., Brandes, K., and Herter, J. �1982�. “Influence of mechani-cal properties of reinforcing steel on the ductility of reinforced con-crete beams with respect to high strain rates.” Proc., RILEM/CEB/IABSE/IASS Interassociation Symp. on Concrete Structures under
950 / JOURNAL OF STRUCTURAL ENGINEERING © ASCE / AUGUST 2009
Impact and Impulsive Loading, BAM, Berlin, 134–145.Mattock, A. H. �1967�. “Discussion of ‘rotational capacity of reinforced
concrete beams.’” J. Struct. Div., 93�ST2�, 519–522.Miyamoto, A., King, M. W., and Fujii, M. �1991�. “Analysis of failure
modes for reinforced concrete slabs under impulsive loads.” ACIStruct. J., 88�5�, 538–545.
Pillai, S. U., Kirk, D. W., and Erki, M. A. �1999�. Reinforced concrete
design, 3rd Ed., McGraw-Hill Ryerson, Toronto.Ross, C. A., Thompson, P. Y., and Tedesco, J. W. �1989�. “Split-
Hopkinson pressure-bar tests on concrete and mortar in tension andcompression.” ACI Mater. J., 86�5�, 475–481.
Suzuki, S., Katsuki, S., Ishikawa, N., Ishikawa, Y., and Furukawa, K.�1996�. “A fundamental study on local dissipated energy and rheologymodel at impact point of concrete specimen by the pendulum impacttest.” Journal of Structural Mechanics and Earthquake Engineering,36�543�, 91–105 �in Japanese�.
Timoshenko, S. P., and Goodier, J. N. �1984�. Theory of elasticity, 3rdEd., McGraw-Hill Int., Singapore.
Uebayashi, K., Fujikake, K., Ohno, T., Mizuno, J., and Suzuki, A. �2001�.“Stress-strain model with dynamic strain softening behaviors for con-crete materials under triaxial compressive stress states.” Journal ofMaterials, Concrete Structures and Pavements, 50�669�, 135–148 �inJapanese�.
U.K. Atomic Energy Authority �UKAEA�. �1990�. Guidelines for the De-sign and Assessment of Concrete Structures Subjected to Impact,SRD, Cheshire.
Yamamoto, M., Masuya, H., and Nishimura, Y. �2003�. “A study on theimpact test method and characteristics of impact behavior of variousreinforced concrete beams.” Proc., 1st Int. Con. on Design and Analy-sis of Protective Structure against Impact/Impulsive/Shock Loads,DAPSIL, Tokyo, 245–255.
Zhang, M. H., Shim, V. P. W., Lu, G., and Chew, C. W. �2005�. “Resis-tance of high-strength concrete to projectile impact.” Int. J. ImpactEng., 31, 825–841.