impacts of agricultural practices and policies on ... · pdf filemidwest and the northern...
TRANSCRIPT

1
Impacts of Agricultural Practices and Policies on Potential Nitrate Water Pollution in the Midwest and Northern Plains of the United States
JunJie Wu, P. G. Lakshminarayan, and Bruce A. Babcock
Working Paper 96-WP 148
February 1996
Center for Agricultural and Rural Development
Iowa State University Ames, Iowa 50011-1070
For content questions please contact Bruce Babcock ([email protected]) or P. G. Lakshminarayan ([email protected]). JunJie Wu is a visiting scientist, CARD; P.G. Lakshminarayan is an associate scientist and manager of CEEPES, CARD; and Bruce A. Babcock is an associate professor of economics and head of the Resource and Environmental Policy Division, CARD. This research was partially supported by EPA Cooperative Agreement CR822045-01-1. The authors wish to thank Phil Gassman, Mark Siemers, Alicia Carriquiry, Paul Mitchell, and Toshitsugu Otake for assisting with data collection and programming.

2
ABSTRACT
An empirical model is developed to estimate the effects of alternative farming practices on
potential nitrogen runoff and leaching in 128,591 National Resources Inventory sites across the
Midwest and the Northern Plains of the United States. This model integrates the effects of soils,
climate, crops, and management practices on nitrogen loss. The model is applied to evaluation of
two policy scenarios. The first scenario reduces N fertilizer application rates by 25 percent through
the soil N test. The second replaces continuous cropping practices with crop rotations. The results
show that policy effects vary widely across the study region. This analysis emphasizes the
importance of conducting policy analysis on a disaggregated scale.
Key words: farming practices, nitrogen runoff and leaching, spatial heterogeneity, disaggregated
policy analysis

3
IMPACTS OF AGRICULTURAL PRACTICES AND POLICIES ON POTENTIAL NITRATE WATER POLLUTION IN THE MIDWEST AND NORTHERN PLAINS
OF THE UNITED STATES
Public concern that use of fertilizers, especially nitrogen, is contributing to the
contamination of the nation’s surface water and groundwater is widespread. Nitrate-N is the most
commonly detected agricultural chemical in groundwater. In a recently released report, the U.S.
Geological Survey (USGS) found that nitrate concentrations in 21 percent of samples collected
beneath agricultural land exceeded the 10 mg/l maximum contamination level set by the U.S.
Environmental Protection Agency (Mueller et al.). Reflecting the increased awareness of the scope
and diversity of nonpoint source water pollution, several national inventories have been conducted
to determine the status, trend, or spatial patterns of nitrate concentrations in groundwater or surface
water (Smith, Alexander, and Wolman; Mueller et al.). While a few studies have evaluated
groundwater contamination potential from nitrogen use at the regional or national levels (Nielsen
and Lee; Kellogg, Maizel, and Goss), many have examined the impact of farming practices on
nitrate water pollution at the field, farm, or watershed levels (see Hallberg for a review). Although
these studies have linked nitrate water pollution to land use, nitrogen application rates, management
practices, and hydrogeologic settings, they have not provided adequate results that confirm the
effectiveness of alternative farming practices and policies in reducing agricultural water pollution.
Because of difficulties in measuring discharges from individual sources, the literature on
nonpoint pollution control policies has focused on instruments applied to inputs and management
practices (Shortle and Dunn). Specifically, a number of empirical studies in recent years have
evaluated nitrogen-use taxes and restrictions for controlling nonpoint-source water pollution
(Johnson, Adams, and Perry; Taylor, Adams, and Miller; Mapp et al.; Helfand and House; Wu et

4
al.). Given the political difficulty and high monitoring cost of imposing direct controls on farmers,
researchers are exploring other ways to reduce nitrate water pollution. Improved farming
techniques, such as N testing and precise placement of fertilizers, show some promise of reducing
fertilizer applications, but not farm returns (Babcock and Blackmer; Swanson; Shortle et al.; Bosch,
Fuglie, and Keim).
Adoption of conservation practices, such as crop rotations, has been suggested as another
way to reduce nonpoint pollution (Diebel et al.; Braden et al.). There is evidence that eliminating
the base acreage concept from farm programs would increase crop rotations. Hennessy, Babcock,
and Hayes found that, under a free-market scenario, continuous corn producers in Iowa would shift
to a corn-soybean rotation because of the yield-enhancing rotation effects. Williams, Llewelyn, and
Barnaby compared wheat and grain sorghum rotations grown continuously, in fallow systems, and
in rotation under conventional and no-till methods for western Kansas. They found that current
commodity programs encourage continuous wheat as opposed to a wheat-sorghum-fallow rotation.
Little is known, however, about how effective these alternative farming practices would be in
reducing nitrate water pollution.
The primary objective of this study is to evaluate the impacts of alternative management
practices and policies on nitrate water pollution in the Corn Belt, Lake States, and Northern Plains
of the United States. An empirical model is developed by combining U.S. Department of
Agriculture (USDA) data from the 1992 National Resources Inventory (NRI), the SOILS 5 (Soil
Interpretation Record System), and the 1992 USDA Cropping Practices Survey. This model
incorporates much more detailed physical and production system information than previous
national or regional assessments. The model is used to identify high-risk areas in the study region
and to evaluate the effects of two policy scenarios on nitrate water pollution in the high-risk areas.
The first scenario reduces N fertilizer application rates by 25 percent through the soil N test. The
second replaces continuous cropping practices with crop rotations. The spatial variation of the
policy effects are demonstrated.

5
Study Region
The study region includes 12 states in the Corn Belt, Lake States, and Northern Plains. The
region accounted for 57 percent of the nation’s cropland in 1992 (USDA/Soil Conservation
Service), and produced 89 percent of the nation’s corn, 81 percent of the nation’s soybeans, 56
percent of the nation’s sorghum, and 56 percent of the nation's wheat in 1991. The total nitrogen
and phosphate use in the study region are 6.12 and 2.41 million nutrient tons, in 1993, or 54 percent
of total U.S. application (USDA/Economic Research Service 1994).
This study focuses on nitrate water pollution from production of corn, soybeans, sorghum,
wheat, and alfalfa. These five crops and summer fallow account for about 90 percent of cropland in
the study region according to the 1992 NRI. Corn and soybeans are the major crops in the Corn
Belt and Lake States, accounting for 72 percent of cropland. In the Northern Plains, wheat and corn
are the major crops and account for 51 percent of cropland.
Fourteen major crop rotations were identified using the 1992 NRI (Table 1). The most
commonly used rotation in the Corn Belt and Lake States was corn-soybean, while the most
commonly used rotations in the Northern Plains were wheat-fallow and wheat-sorghum-fallow.
About 17.4 percent of cropland was cultivated with conservation tillage, and 10.6 percent was
cultivated using conservation practices such as contouring, terracing, and strip-cropping. Irrigation
is another major factor influencing nutrient leaching. In 1992, 6.7 percent of the region’s cropland
was irrigated, with most of these irrigated acres in Nebraska and Kansas.
The Empirical Model
A major challenge for evaluating nonpoint source water pollution at the regional level is to
account for the spatial heterogeneity of agriculture. Which crops are grown and how they are
grown varies from farm to farm, and affects nitrogen use and pollution. Because physical attributes
of the land are not homogeneous, nitrate water pollution also can vary dramatically across farms

6
that grow the same crop and use identical farming practices. Climate also plays a large role in
determining water-quality impacts of farming practices. Heterogeneous land and climate
complicate the design of models intended to capture the impacts of agriculture on water pollution
since they add a spatial dimension to the analysis. Thus, the analyst must know not only how
cropping patterns are distributed across farms, but also the location of crops, cropping practices,
and the physical attributes of the land on which the crops are grown.
To capture spatial heterogeneity, agricultural land in the region is divided into plots or
microunits. Each microunit is homogeneous in production systems and resource settings. A
production system is defined by crop choice, rotation, tillage system, conservation practice,
irrigation, and other management practices; a resource setting is determined by soil type, weather,
and hydrogeologic properties. Total nitrogen runoff or leaching loss in an area within the study
region is estimated by
(1) NL A Zi ii
= ∑ ,
where NL is the total nitrogen runoff or leaching loss in the area, Ai is the acreage of microunit i,
and Zi is the per acre nitrogen runoff or leaching loss in microunit i. Zi depends on the production
system and the resource setting in the microunit:
(2) Z G X Ri i i= ( , ) ,
where Xi is a vector of variables that describes the production system in microunit i, and Ri is a
vector of variables that describes the resource setting in microunit i. Given cropping patterns, the
impact of a change in management practices on nitrogen runoff and leaching is estimated by
(3) A G X R G X Ri i i i ii
[ ( , ) ( , )]−∑ 1 ,

7
where Xi1 is a vector of variables that describe the management practices on microunit i.
This model indicates that two types of data are needed for evaluating nitrogen runoff and
leaching potential. One is the spatial distribution of production systems and resource settings, and
the other is the nitrogen runoff and leaching losses under each combination of production systems
and resource settings. A four-step procedure is used to derive and analyze these data. The first step
is to identify the important combinations of production systems and resource settings in the study
region and their spatial distributions. The second step is to estimate nitrogen runoff and leaching
equations from (2). In the third step, we predict nitrogen runoff and leaching potential in each
microunit by using the estimated nitrogen runoff and leaching equations. Because a vast amount of
site-specific nitrogen loss data is generated, a geographic information system (GIS) is used to
present and interpret the results. Spatial patterns of nitrogen runoff and leaching potential as well as
high-risk areas also are identified. In the final step, we evaluate the effectiveness of conservation
farming practices and nitrogen use reductions in reducing nitrogen runoff and leaching losses in the
high-risk areas.
Identifying Production Systems and Resource Settings
The 1992 NRI and the SOILS 5 databases are the two primary data sources used to identify
the spatial distribution of production systems and resource settings in the study region. The 1992
NRI is the latest in a series of inventories conducted by the Natural Resource Conservation Service
(formerly, the Soil Conservation Service) of the U.S. Department of Agriculture. The purpose of
the NRI is to determine the status, condition, and trend of the nation’s soil, water, and related
resources (Goebel and Dorsch). Information on nearly 200 attributes was collected at each NRI
sample point. The attributes include land use and cover, cropping history, irrigation type, tillage
practices, conservation practices, topography, hydrology, and soil type.
Data for the 1992 NRI were collected for more than 800,000 nonfederal locations. The

8
sampling design guarantees that inferences at the national, regional, state, and substate levels can be
made in a statistically reliable manner. Each NRI point is accompanied by an expansion factor that
assigns each point the appropriate weight under the design. In our study region, there are 128,591
NRI points growing corn, soybeans, sorghum, wheat, or legume hay. Of these points, 55,024 are in
the Corn Belt, 21,600 in the Lake States, and 51,967 in the Northern Plains.
We linked the 1992 NRI to the SOILS 5 database to identify soil profile properties at each
point. Climatic data were derived from long-term historical weather records at weather stations
across the United States. Each point is linked to a weather station using the Thiessen polygon
technique within ARCINFO, a Geographic Information System (GIS). Based on cropping practice,
soil profile property, and weather at each point, unique combinations of production systems and
resource settings were identified. The 2,141 general soils (each with a maximum of six soil
profiles), 14 crop rotations, four tillage practices, four conservation practices, two irrigation
systems, and many weather conditions in the study region constituted hundreds of thousands of
unique combinations of production systems and resource settings. The NRI expansion factors
determined the distribution of these combinations.
Estimation of Nitrogen Loss Equations
The relationship between agricultural practices and nitrogen losses as stylized in equation
(2) reflects the knowledge of many disciplines. The relationship has been represented by simulation
models in previous field- or watershed-level analyses. Although simulation models are analogs of
real processes, their direct application to regional analyses is generally prohibitive (Bouzaher et al.).
Because hundreds of thousands of unique combinations of production systems and resource settings
are identified in our study region, it is impractical to simulate nutrient runoff and leaching under
each and every combination. To simplify our task, metamodeling is used (Bouzaher et al.).
A metamodel approximates outcomes of a complex simulation model with regression
analysis. Previous applications include Bouzaher et al., who estimated loadings of 16 major

9
herbicides in surface water and groundwater in the Corn Belt and Lake States; Teague and
Bernardo, who examined the impact of irrigation and nitrogen application levels on nitrogen
leaching in the Central High Plains; and Wu, Mapp, and Bernardo, who evaluated the impact of
alternative water quality policies on crop choices and irrigation investment decisions in the
Oklahoma panhandle. Applications of metamodels in management, industrial, and computer fields
are documented in Kleijnen.
For our analysis, a representative sample was selected from all combinations of production
systems and resource settings in the study region. Nitrogen runoff and leaching were then
simulated for each combination in the sample with a widely accepted biogeophysical process
model, the Water Quality and Erosion Productivity Impact Calculator (EPIC-WQ). Nitrogen runoff
and leaching equations were then estimated based on the simulation results.
EPIC-WQ Simulations
The 1992 NRI provides an ideal database for selecting a sample of production systems and
resource settings for EPIC-WQ simulations. To obtain a representative sample, NRI points within
each major land resource area (MLRA), as defined by the USDA, were first grouped according to
production system. Then 10 percent of the NRI points were randomly selected from each group.
A total of 11,403 NRI points were selected and EPIC-WQ simulations were run at each point. 1
EPIC-WQ was developed to simulate the effects of agricultural practices on crop yield and
nutrient losses by surface runoff, sediment movement, and leaching below the root zone. EPIC-
WQ has nine major components: hydrology, weather, erosion, nutrients, plant growth, soil
temperature, tillage, economics, and plant environment. The model has been validated and
calibrated for a wide variety of conditions, particularly for those prevalent in this study region. For
a detailed discussion of the EPIC-WQ model and its validation, see Williams, Jones, and Dyke and
Jones et al.

10
Three major categories of data are needed for EPIC-WQ simulations: production systems,
soil profile properties, and weather. Production system data were obtained from several sources.
Crop rotation at each NRI point was determined by using cropping history information at the point.
The NRI also reports whether conventional or conservation tillage was practiced at each point. We
randomly assigned conservation tillage points into reduced and no-till categories based on crop-
specific and state-level distributions of reduced and no-till acres estimated from data published by
the Conservation Technology Information Center (CTIC).
The nitrogen and phosphorus application data for the EPIC-WQ simulations were collected
from several sources. Preliminary estimates for each state in the study were estimated from the
Federal Enterprise Data System (FEDS). These preliminary estimates were distributed to soil
fertility experts attending a soil fertility workshop in St. Louis, Missouri, on October 27, 1994. The
experts were asked to review the FEDS estimates and, if they felt these preliminary assessments
were unreasonable, to provide their own best estimates for their states. In addition, the experts were
asked to estimate how crop rotation, tillage, and irrigation might affect fertilizer rates. Based on the
survey results, nitrogen and phosphorus application rates by crop, rotation, tillage, and irrigation
were then estimated.
Timing and methods of nitrogen application were identified through the USDA 1992
Cropping Practices Survey (USDA). Fertilizer data compiled by the Tennessee Valley Authority
facilitated identification of nitrogen forms used in each state. For simplicity, it was assumed that all
phosphorus fertilizer was applied at planting as mineral phosphorus. Planting and harvesting dates
for all crops were obtained from the USDA’s 1972 Agriculture Handbook (Statistical Reporting
Service, USDA). The dates were updated from the USDA 1992 Cropping Practices Survey.
Soil and weather data also were needed for the EPIC-WQ simulations. The soil profile
properties at each NRI point were obtained by linking the 1992 NRI with the SOILS 5 database.
Daily weather inputs to EPIC-WQ were obtained from the EPIC-WQ weather generator (Sharpley
and Williams), which generates daily values of precipitation, maximum temperature, minimum

11
temperature, solar radiation, wind speed, and relative humidity. These daily values are generated
for each selected NRI point from the long-term historical weather records at the weather station to
which the NRI point was linked.
An automatic input file builder and control program written in the C++ programming
language simplified the task of linking all databases and constructing the EPIC-WQ input files for
every selected NRI point. The same program automates execution of the EPIC-WQ simulations
and extraction of the pertinent output data from the standard EPIC-WQ output file. A 30-year
EPIC-WQ simulation run was conducted for each of the 11,403 selected NRI points. Each run
provides daily estimates of nitrogen runoff and leaching. Nitrogen runoff is measured as NO - N3
leaving the field through surface runoff, and nitrogen leaching is measured as NO - N3 leaving the
root zone by percolation. 2
Empirical Specification of the Metamodels
The 30-year averages of simulated nitrogen runoff and leaching loadings provide the data
for the dependent variables of the nitrogen runoff and leaching metamodels. 3 Preliminary analysis
of the data showed that the loadings varied across management practices and watersheds. The
distributions of both runoff and leaching loadings were nonnormal and positively skewed (to the
right). Initial results from a linear regression of loadings on management practices, physical
attributes, and their interaction terms yielded a poor fit and wedge-shaped residual patterns,
indicating existence of heteroskedasticity.
The heteroskedasticity was corrected using procedures similar to the generalized Box-Cox
power transformation to find a variance-stabilizing transformation of the dependent variables (Box
and Hill). The transformed dependent variables take the form of NR NPα δ and , where NR and NP
are, the 30-year average of the simulated nitrogen runoff and leaching, and α δ and are the power
transformation parameters. The normal scores ranking method proposed by Blom was used to rank
alternatives α δ and and select the best transformation. Thus, these nitrogen runoff and leaching
12
metamodels are empirically estimated:
(3) NR Xi i i1 3 5/ . ,= +β ν
(4) NP Xi i i1 2 5/ . = +η υ ,
where i = 1, ..., 11,403 denotes the 11,403 selected NRI points for EPIC-WQ simulations,
Xi represents the independent variables listed in the first column of Table 2, and ν υi i and are the
error terms. Equations (3) and (4) were estimated separately.
Estimation Results
Table 2 presents estimates of the metamodel coefficients. Overall, the metamodels fit the
data very well and most of the model coefficients are significant at the 1 percent level. The
metamodels were validated with cross-validation methods, which are useful for testing in-use
prediction accuracy (Snee). The metamodels were also validated by comparing the frequency
distributions of nitrogen losses predicted by EPIC-WQ and by the metamodels. The results indicate
the metamodels approximate the nitrogen-loss predictions of EPIC-WQ very well.
The impacts of management practices and resource settings on nitrogen runoff and leaching
are reflected by both the coefficient of the relevant variable and the coefficient on the interaction
term between the relevant variable and nitrogen rate. Thus, an alternative production practice may
affect nitrogen runoff and leaching in one of these ways: (a) it increases the intercept but reduces
the coefficient of N, (b) it reduces the intercept but increases the coefficient of N, (c) it increases
both the intercept and the coefficient of N, or (d) it reduces both the intercept and the coefficient of
N. These four cases are shown, as panels a, b, c, and d of Figure 1.
If an alternative production practice does not change the nitrogen application rate, then it
would reduce nitrogen losses if and only if the nitrogen application rate is greater than Na in case a
and less than Nb in case b (Figure 1). The alternative would always increase nitrogen loss in case c

13
14
and reduce nitrogen runoff or leaching in case d if the nitrogen application rate is not changed.
Many management practices and resource settings, however, do affect nitrogen application rates.
When this occurred, the impact of the alternative practice was determined. First, we estimated the
nitrogen runoff and leaching under the referenced practice or resource setting. We then estimated
the nitrogen application rate ( N * in Figure 1) that would result in the same runoff or leaching level
under the alternative. The alternative would result in a larger nitrogen runoff or leaching if and only
if more than N * pounds of nitrogen per acre are used.
Based on the estimated coefficients of the nitrogen runoff and leaching metamodels,
determination was made of the case (a, b, c, or d) to which each management practice and resource
setting belonged, the values of N N Na b, , * or were estimated, and the impacts of alternative
management practices and resource settings on nitrogen runoff and leaching were determined. The
results are reported in Table 3.
Because nitrogen application rates generally are not changed for different tillage systems
(Randall and Bandel), 4 the direction of the impact of tillage practices on nitrogen runoff and
leaching can be determined by comparing the nitrogen application rate to N Na b or . The results
suggest that the effect of reduced tillage on nitrogen runoff and leaching depends on the nitrogen
application rate of the cropping system to which they are applied and that no till reduces nitrogen
runoff when the nitrogen application rate is higher than 132 pounds per acre but has little effect on
nitrogen leaching. These results are generally consistent with previous studies. Baker performed a
comprehensive review of the literature addressing the effects of conservation tillage on nitrogen
losses in surface runoff water. He found that nitrogen losses for conservation tillage estimated by
previous studies ranged from 9 to 109 percent of those for conventional tillage. 5 Several studies
have examined the effect of tillage systems on nitrogen leaching, but reached different conclusions.
Tyler and Thomas, and Thomas, Wells, and Murdock estimated that more nitrogen leached below
90 centimeters in a killed-sod/no-till system than in a conventional treatment. In contrast, Kanwar,
Baker, and Laflen, working on a loam soil in Iowa, observed less leaching in no-till plots than in

15
moldboard plow plots. Other research (Kitur et al.) found no difference between tillage systems in
nitrogen leaching. Gilliam and Hoyt used an N-balance approach to examine N leaching. After a
comprehensive literature review, they concluded that conservation tillage may increase or decrease
N leaching, depending upon soil and weather conditions.
No coefficients on dummies for contouring and strip-cropping and their interaction terms
with N rates are significant at the 10 percent level in either the nitrogen runoff or the leaching
metamodels (table 2). The other conservation practice, terracing, however, has statistically
significant coefficients in both the runoff and leaching metamodels. The impact of terracing on
nitrogen runoff belongs to case a, with Na = 29 pounds/acre. The impact of terracing on nitrogen
leaching belongs to case b, with Nb = 368 pounds/acre. Because average annual nitrogen
application rates for most cropping systems are between 29 and 368 pounds/acre, terracing would
reduce nitrogen runoff and leaching for most cropping systems. The results in Table 3 also indicate
that, although irrigation always causes more nitrogen leaching, it may not always cause more
nitrogen runoff, particularly when nitrogen application rates are high.
Our analysis suggests that the relative effects of alternative cropping systems on nitrogen
losses depend on soil, climate, and hydrologic properties. A cropping system may cause more
nitrogen loss on one soil, but less on another soil. Table 3 shows the relative effects of cropping
systems on Clarion soil in Story County, Iowa. The results reveal that production of continuous
corn on Clarion soil would cause more nitrogen runoff than a five-year rotation of two years of corn
and three years of alfalfa, but would cause less nitrogen runoff than production of continuous
soybeans or any rotation system that involves only corn and soybeans. This finding is consistent
with the fact that soybeans is the most erosive of the crops under study. Production of continuous
corn on Clarion soil would cause more nitrogen leaching than the corn-soybean rotation or the corn-
corn-soybean rotation, but would cause less nitrogen leaching than continuous alfalfa or any
rotation that involves more than one year of soybeans or alfalfa. This result is not surprising
because soybeans and alfalfa are nitrogen-fixing crops.

16
The soil hydrologic group dummies and their interaction terms with the nitrogen application
rate also perform well. The coefficients for these variables indicate that for a given cropping
system, production on the two well-drained soils (hydrologic groups A and B) would cause less
nitrogen runoff and more nitrogen leaching than on the two poorly drained soils (hydrologic groups
C and D). This result is consistent with the findings of Mueller et al. that median nitrate
concentrations ranged from 4.7 mg/l in groundwater beneath hydrologic group A soils to 0.17 mg/L
in groundwater beneath hydrologic group D soils. Soil hydrologic groups C and D are less
susceptible to nitrogen leaching for two reasons (Mueller et al.). First, fine-grained deposits in
group C and D soils retard the downward movement of water, and therefore of nitrogen, to
groundwater. Second, poorly drained soils are usually anaerobic, favoring ammonia as the stable
form of nitrogen and thus preventing nitrate from forming.
Spatial Patterns of Potential Nitrate Water Pollution
Nitrogen runoff and leaching losses were estimated for all of the 1992 NRI sites that were
growing corn, sorghum, soybeans, wheat, or legume hay by using the nitrogen runoff and leaching
metamodels. For the entire study region, the average annual runoff and leaching, were estimated to
be 3.99 pounds/acre and 4.07 pounds/acre, which accounted for about 5.5 percent and 5.6 percent
of total nitrogen applied. These estimates are consistent with the findings of Turner and Rabalais,
who examined changes in water quality in the Mississippi River during this century and estimated
that nitrogen loading through all processes (including runoff, leaching, and subsurface flow)
represents no more than 22 percent of total nitrogen applied. Table 4 presents estimates of average
annual nitrogen runoff and leaching by state and USDA farm production region. The results
indicate that the Corn Belt has the highest average runoff per acre, while the Lake States region has
the highest average leaching per acre.
Of the 12 states in the study, Missouri is most vulnerable to nitrogen runoff. This finding
reflects the production systems and physical attributes of that state. Missouri has the lowest

17
average permeability and the highest clay percentage and water erosion rate in the region. Missouri
also has the second highest mean annual precipitation. These physical and climatic conditions,
along with its large acreage of nitrogen-intensive crops, make Missouri more vulnerable to nitrogen
runoff overall than any other state in the study.
The results in Table 4 show that Michigan, Ohio, Indiana, and Wisconsin are most
vulnerable to nitrogen leaching. High nitrogen leaching potential in these states also reflects their
production systems and resource settings. Wisconsin, Michigan, and Indiana have the highest
average permeability among all states. Indiana also has the largest annual precipitation in the
region. In addition, these states all have large acreages of corn and/or alfalfa, the two most
leaching-prone crops.
Spatial heterogeneity of soil, climate, and production systems leads to large variations in
nitrate water pollution. In many cases, it is more important to present the distribution of
environmental outcomes rather than aggregate outcomes, because aggregate measures do not
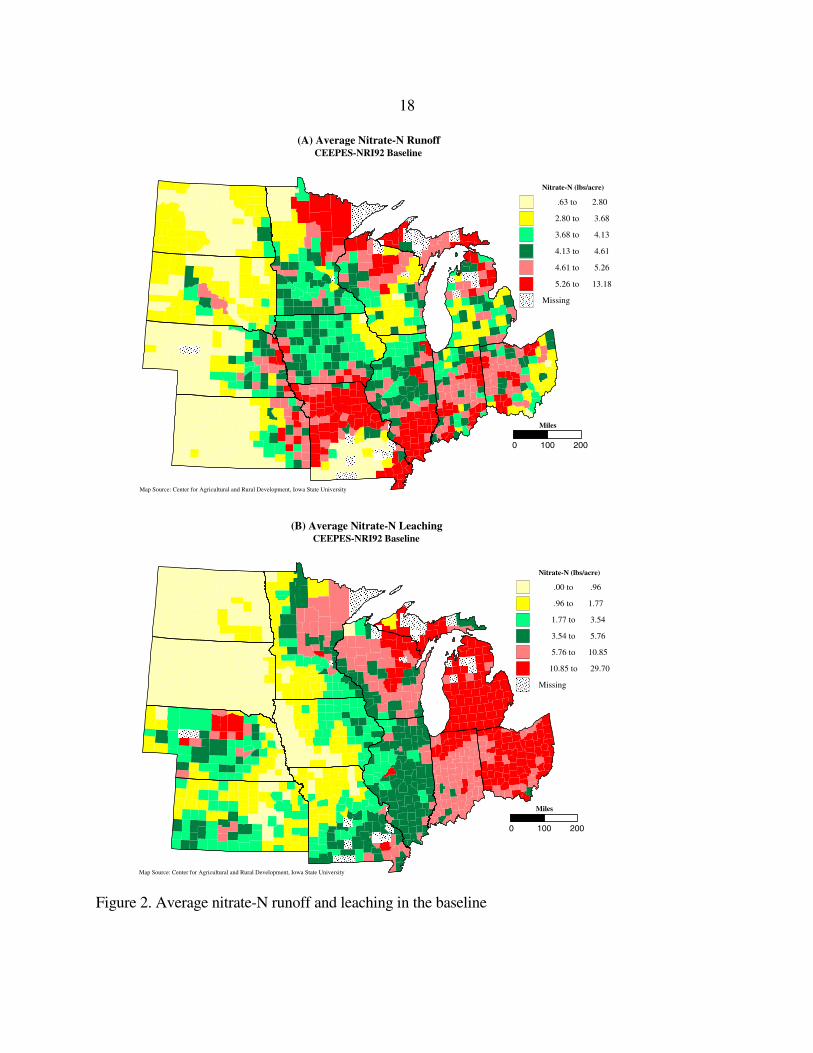
identify regional situations of extreme severity. The spatial patterns of average nitrogen runoff and
leaching potential for each county in the study region are shown in Figure 2.
There are significant spatial variations in potential nitrogen runoff (panel A of Figure 2). It
is highest in the Ohio and Missouri River drainage basins and the northern Lake States. Although
per acre runoff is high in the northern Lake States, total runoff is relatively low because of the small
cropland acreage in the area. The pattern seems consistent with previous findings. Smith,
Alexander, and Lanfear estimated the amount of nitrogen delivered to streams from different land
use. They found corn and soybean fields delivered much more nitrogen to the nearby streams than
did wheat fields, forest land, rangeland, or urban areas per square mile. Omernik examined the
nonpoint nutrient runoff by using the U.S. Environmental Protection Agency National
Eutrophication Survey data. He found that nitrate concentrations downstream from agricultural
areas were highest in the Corn Belt.
18
Nitrate-N (lbs/acre)
.63 to 2.80
2.80 to 3.68
3.68 to 4.13
4.13 to 4.61
4.61 to 5.26
5.26 to 13.18
Missing
Miles
2001000
(A) Average Nitrate-N RunoffCEEPES-NRI92 Baseline
Map Source: Center for Agricultural and Rural Development, Iowa State University
Nitrate-N (lbs/acre)
.00 to .96
.96 to 1.77
1.77 to 3.54
3.54 to 5.76
5.76 to 10.85
10.85 to 29.70
Missing
Miles
2001000
(B) Average Nitrate-N LeachingCEEPES-NRI92 Baseline
Map Source: Center for Agricultural and Rural Development, Iowa State University
Figure 2. Average nitrate-N runoff and leaching in the baseline

19
Panel B of figure 2 shows the spatial patterns of nitrogen leaching potential. Nitrogen
leaching potential is highest in Ohio, Indiana, Nebraska, and a large portion of the Lake States; it is
lowest in the Dakotas. High leaching potential in Ohio and Indiana may be from a combination of
high nitrogen application rates, large annual precipitation, and relatively vulnerable soil conditions.
According to our survey, the average nitrogen application rate to continuous corn is about 150
pounds/acre in Ohio and Indiana, which is 25 pounds higher than the rate in Iowa. High leaching
potential in the Nebraska Central Platte can be attributed to widespread irrigation in the area. High
leaching potential in a large part of the Lake States may result from high soil permeability and large
alfalfa and corn acreage. Low leaching potential in the Dakotas can be attributed to fallow-based
crop enterprises, low nitrogen application rates, and low annual precipitation.
A few national assessments have been conducted to determine the spatial patterns of
nitrogen leaching potential. Huang, Westernbarger, and Mizer estimated the distribution of
cropland potentially vulnerable to nitrogen leaching and found that the Corn Belt states have most
of this cropland. Kellogg, Maizel, and Goss developed a groundwater vulnerability index for
nitrogen fertilizer (GWVIN). Relative to our study region, they found that nitrogen leaching
potential was highest in Indiana, Illinois and Ohio and was lowest in the Dakotas. One notable
discrepancy between their findings and ours is that Michigan and Wisconsin were ranked low in
leaching according to their GWVIN index, but were ranked high according to our results. The
discrepancy may reflect that GWVIN does not incorporate essential information on soil profile
properties and production systems that was included in our EPIC simulations. The GWVIN index
was measured as the product of a percolation factor and excess nitrogen. The only soil profile
properties incorporated into the percolation factor consisted of the soil hydrologic group
information. Furthermore, excessive nitrogen was estimated only for corn, wheat, and cotton.
Thus, high nitrogen leaching from alfalfa production was not reflected in the results of that study.

20
The Impacts of Changing Crop Management Practices
The empirical model we developed was applied to evaluate two crop management practices:
(a) a 25 percent reduction in nitrogen application rate, and (b) a switch from monoculture to crop
rotations. The 25 percent reduction in nitrogen application rates is assumed to be achieved through
improved farming techniques such as soil N testing, split application, and precise fertilizer
placement. Therefore, the reduction in nitrogen use is assumed not to change cropping patterns.
Switches to crop rotations presumably result from perceived changes in current commodity
programs. One main theme of proposed changes to current commodity programs for the 1995 Farm
Bill is to increase planting flexibility. Based on studies by Hennessy, Babcock, and Hayes and
Williams, Llewelyn, and Barnaby, we assumed that in the Corn Belt and Lake States, continuous
corn will be switched to the corn-soybeans rotation, and continuous wheat and continuous sorghum
will be switched to the wheat-sorghum rotation without farm program constraints; in the Northern
Plains, continuous corn will be switched to a corn-soybeans rotation, and continuous wheat and
continuous sorghum will be switched to the wheat-sorghum-fallow rotation.
For the nitrogen use policy simulation, nitrogen application rates were reduced by 25
percent for all NRI points, and nitrogen runoff and leaching were reestimated using the
metamodels. The new estimates were compared with baseline results to determine policy impact.
Likewise, to evaluate the crop rotation policy, the cropping systems at all NRI points that were
growing continuous corn, sorghum, or wheat were switched into one of the region-specific crop
rotation systems. Nitrogen runoff and leaching losses at each NRI point were then reestimated
using the metamodels.
Reducing Nitrogen Application Rates by 25 Percent
Reduced nitrogen losses in runoff and leaching by state and region under this policy are
shown in Table 4. The reduction in runoff ranges from a low of 13.8 percent in Ohio to a high of
25.2 percent in North Dakota. The spatial variability in leaching reduction is even more dramatic,

21
ranging from insignificant reduction in the Dakotas to 19.2 percent in Nebraska. 6 Reducing
nitrogen application rates has little effect on leaching in the Dakotas because very little nitrogen
percolates out of the root zone, even under current application rates. The Lake States respond well
in reducing both runoff and leaching. Runoff losses are reduced by 21.5 percent and leaching
losses by 11.3 percent. Runoff and leaching are least responsive to nitrogen use reduction in the
Corn Belt, where runoff is reduced by 17.2 percent and leaching by only 6.9 percent.
The policy impacts at the county level are shown in panels A and B of Figure 3. Panel A
shows percentage changes in average runoff per acre, and panel B shows percentage changes in
average leaching per acre. In general, absolute reductions in runoff and leaching are larger in areas
where the loading rates are higher, but percentage reductions are smaller in these areas. Exceptions
are some counties in the northern Lake States where both absolute and percentage reductions are
relatively large. Overall, the predicted changes in nitrate losses suggest that a 25 percent reduction
of nitrogen application rates can significantly reduce nitrogen loss.
Table 5 shows the changes in total net returns when nitrogen application rates are reduced
by 25 percent through soil N testing. Assuming crop yields are not affected, the changes in total net
returns are equal to savings in nitrogen costs minus soil N testing costs. Nitrogen cost savings were
estimated for each state by multiplying nitrogen use reduction by the 1992 state-level nitrogen
prices. Total soil N testing costs were estimated by multiplying total crop acreage by the per acre
soil N test costs. Soil N testing costs are taken from Bosch, Fuglie, and Keim. The results indicate
total net returns would increase significantly in all three major production regions.
Crop Rotation Policy
Under this policy, 10.1 million acres would be switched from monoculture to crop rotation
in the Corn Belt, 9.5 million acres in the Lake States, and 24.6 million acres in the Northern Plains.
The effects of this policy on runoff and leaching by state and region are shown in Table 4. The
Lake States region responded with the maximum reduction in total nitrogen losses, even though

22

23
they had the fewest acres switched. Similar results were obtained under the nitrogen use policy for
the Lake States. In Nebraska, switching from monoculture to crop rotations would increase runoff
by 3.14 percent but would reduce leaching by 23.1 percent, the largest reduction among all states.
Given that the Platte River drainage basin in Nebraska has significant concentrations of nitrate-N in
groundwater (Mueller et al.), encouraging farmers to implement more crop rotations would
alleviate some of the problem. In Kansas and the Dakotas, switching continuous wheat and
sorghum into the wheat-sorghum-fallow rotation would increase nitrogen leaching. This may be
caused by the lack of a cover crop and by higher moisture retention in the fallow year of a wheat-
sorghum-fallow system (Williams, Llewelyn, and Barnaby).
The policy impacts at the county level are shown in panels C and D of Figure 3. Comparing
these two panels with those in Figure 2 indicates that areas with highest runoff have a relatively
small percentage reduction, even though absolute reductions in these areas are relatively large.
Exceptions are parts of the northern Lake States, where both absolute and percentage reductions are
large. Many areas of Kansas and the Dakotas would have increased nitrogen leaching under the
rotation policy, although the magnitude would be small (see table 4). The largest reductions in
nitrogen leaching were predicted only in some of the high-risk areas. The other high-risk areas,
especially those in Indiana and southern Michigan and Ohio, would experience only a small
reduction in leaching. The spatial heterogeneity suggests that uniform policies and aggregate
measures of policy impacts may not be very useful.
Changes in total net returns after switching to crop rotations are reported in the last column
of Table 5. The changes in per acre net returns when continuous corn is switched to the corn-
soybeans rotation were estimated for each state from yields and production costs under these two
cropping systems. The data on crop yields, prices, and costs are taken from the 1992 CARD/RCA
budgets. Changes in per acre net returns in the Corn Belt and Lake States when continuous wheat
and sorghum are switched to the wheat-sorghum rotation were estimated using data from the
CARD/RCA budgets. Changes in per acre net returns in the Northern Plains when continuous
wheat and sorghum are switched to the wheat-sorghum-fallow rotation were taken from Williams,
24
Llewelyn, and Barnaby. The results indicate that, although switching to crop rotations would not be
as effective as a 25 percent reduction in nitrogen application rates, it would increase net returns by a
much larger amount in each of the three major production regions.
Concluding Remarks
We have developed an empirical model for estimating the effects of alternative
management practices on potential nitrogen loss in runoff and leaching. The effects of two policy
scenarios on nitrate-N losses in the Corn Belt, Lake States, and the Northern Plains of the United
States were evaluated. The first scenario reduces N fertilizer application rates by 25 percent
through the soil N test. The second replaces continuous cropping practices with crop rotations.
The analytical tool used to evaluate these scenarios is a set of metamodels that summarize the
impacts of soil, climate, crops, and management practices on nitrogen runoff and leaching. The
metamodels were estimated using the EPIC-WQ simulation results for a stratified, randomly
selected sample of the 1992 NRI points. The potential for surface water and groundwater pollution
for each geographic unit in the study region was determined by combining the 1992 NRI with the
metamodels. The measurements were made for a total of 128,591 sites. The 1992 NRI and several
other databases were used to determine the joint distribution of soil, climate, crop, rotation, tillage,
and irrigation method. The metamodels estimated nutrient losses in runoff and leaching under each
of these combinations. Our findings show that if current trends of reduced agricultural subsidies continue and
producers become increasingly reliant on precision farming techniques, a significant reduction in
nitrogen losses can be expected. However, the effects of these changes vary widely across the study
region. On average, it appears that the largest absolute changes in N losses occur in areas that have
the highest losses, but the percentage changes in these areas are sometimes small. However, there
are some problem areas with small absolute changes and some with large percentage reductions.
Of particular note, the rotation policy would seem to increase leaching losses in parts of Kansas

25
where such losses may already be high. This policy evaluation emphasizes the importance of
conducting policy analysis on a disaggregated scale.

26
Tab
le 1
. C
ropl
and
Dis
trib
utio
n by
Cro
p R
otat
ion
in th
e U
.S. M
idw
est,
1992
____
____
____
____
____
____
____
____
____
____
____
____
____
____
____
____
____
____
____
____
____
____
____
____
____
____
____
____
____
____
____
____
____
____
____
____
____
_
Stat
e C
ropl
and
CC
C
SSS
WW
W
GG
G
C-S
C
CS
CSW
SS
C
W-F
W
GF
W-S
W
-G
AA
A
CC
AA
A
OT
H
CR
P
____
____
____
____
____
____
____
____
____
____
____
____
____
____
____
____
____
____
____
____
____
____
____
____
____
____
____
____
____
____
____
____
____
____
____
____
____
_
(1
00 a
cres
)
---
----
----
----
----
----
----
----
----
----
----
----
----
----
----
----
----
----
----
----
----
----
----
----
----
- per
cent
----
----
----
----
----
----
----
----
----
----
----
----
----
----
----
----
----
----
----
----
----
----
----
----
-
Ohi
o 12
2,15
3 7.
78
2.44
0.
56
0.00
28
.79
5.12
27
.07
4.79
0.
00
0.00
1.
02
0.00
10
.28
2.23
7.
34
2.58
Indi
ana
138,
624
12.8
5 3.
21
0.24
0.
02
43.2
6 12
.96
11.2
1 3.
31
0.00
0.
00
0.51
0.
00
2.98
0.
51
5.97
2.
99
Illin
ois
247,
937
9.96
1.
11
0.06
0.
02
55.7
7 8.
31
14.2
4 2.
11
0.00
0.
00
0.20
0.
00
2.30
1.
17
1.89
2.
87
Iow
a 26
9,47
3 15
.10
1.69
0.
04
0.01
49
.80
11.5
5 0.
21
2.25
0.
00
0.00
0.
02
0.00
5.
86
1.98
3.
73
7.77
Mis
sour
i 14
7,72
0 2.
96
9.99
1.
14
0.53
17
.88
5.00
21
.76
4.84
0.
00
0.00
1.
09
0.30
7.
18
0.83
15
.64
10.8
5
Mic
higa
n 92
,075
23
.03
2.00
1.
81
0.10
12
.23
5.50
10
.97
2.25
0.
02
0.00
0.
79
0.00
16
.05
2.15
20
.33
2.77
Wis
cons
in
114,
431
24.9
7 0.
93
0.31
0.
11
4.58
2.
94
1.11
0.
72
0.00
0.
00
0.10
0.
00
30.6
7 11
.93
15.8
1 5.
81
Min
neso
ta
231,
139
10.2
0 2.
31
8.52
0.
03
28.7
3 4.
70
7.31
3.
65
0.44
0.
00
1.66
0.
00
8.78
2.
85
12.9
9 7.
83
Kan
sas
294,
026
4.84
0.
88
15.5
4 0.
12
2.34
0.
00
0.00
0.
00
16.6
6 24
.49
6.13
13
.00
2.25
0.
29
3.72
9.
74
Neb
rask
a 20
5,78
6 29
.01
1.16
3.
43
0.57
18
.44
0.00
0.
00
0.00
7.
86
5.94
2.
28
8.09
6.
77
1.65
8.
17
6.62
S. D
akot
a 18
1,58
5 11
.38
1.37
9.
58
0.62
16
.10
0.00
0.
00
0.00
8.
61
7.43
7.
41
2.21
11
.48
1.25
12
.87
9.68
N. D
akot
a 27
6,36
5 2.
83
0.50
25
.48
0.04
0.
59
0.00
0.
00
0.00
16
.66
9.95
4.
89
0.12
4.
99
0.25
23
.20
10.5
0
Tot
al
2,32
1,31
4 11
.75
2.01
7.
12
0.17
23
.81
4.42
6.
24
1.73
5.
51
5.40
2.
52
2.57
7.
50
1.82
10
.22
7.22
____
____
____
____
____
____
____
____
____
____
____
____
____
____
____
____
____
____
____
____
____
____
____
____
____
____
____
____
____
____
____
____
____
____
____
____
____
_
Not
es: C
CC
= c
ontin
uous
cor
n, S
SS =
con
tinuo
us s
oybe
ans,
WW
W =
con
tinuo
us w
heat
, GG
G =
con
tinuo
us s
orgh
um, C
-S =
cor
n-so
ybea
n, C
CS
= co
rn-c
orn-
soyb
eans
, CSW
= c
orn-
soyb
eans
-whe
at,
SSC
= s
oybe
ans-
soyb
eans
-cor
n, W
-F =
whe
at-f
allo
w, W
GF
= w
heat
-sor
ghum
-fal
low
, W-S
= w
heat
-soy
bean
s, W
-G =
whe
at-s
orgh
um, A
AA
= c
ontin
uous
alf
alfa
, CC
AA
A =
cor
n-co
rn-a
lfal
fa-a
lfal
fa
-alf
alfa
, OT
H =
oth
er c
ropp
ing
syst
ems,
CR
P =
Con
serv
atio
n R
eser
ve P
rogr
am la
nds.

27
Table 2. Estimates of Coefficients for Nitrogen Runoff and Leaching Metamodels ___ Nitrogen Runoff ___ ___Nitrogen Leaching___ Variable Parameter t-Valuea Parameter t-Value Intercept -1.1621 -12.38 1.0158 2.92 N application rate (kg/ha) 0.0212 23.77 0.0083 2.51 Tillage, conservation, and irrigation practice dummies (Reference: Conventional tillage) Reduced tillage 0.0147 1.82 -0.0455 -1.52 No till 0.0593 4.54 -0.0552 -1.14 Contouring -0.0072 -0.39 0.0212 0.31 Strip-cropping -0.0393 -1.58 0.0538 0.58 Terracing 0.0192 1.73 -0.1298 -3.16 Irrigation 0.3478 29.09 1.1430 25.79 Interaction between the N application rate and tillage, conservation and irrigation practices N*Reduced tillage -0.0001 -1.32 0.0008 2.09 N*No till -0.0004 -2.96 0.0006 1.11 N*Contouring -0.0001 -0.42 -0.0006 -0.66 N*Strip-cropping 0.0005 1.40 0.0016 1.07 N*Terracing -0.0006 -3.45 0.0003 0.36 N*Irrigation -0.0030 -21.84 -0.0004 -0.80 Rotation practice dummies (Reference: Continuous alfalfa) Continuous corn -0.0223 -0.90 -0.9538 -10.36 Continuous soybeans 0.5134 20.94 -0.3710 -4.08 Continuous wheat -0.2303 -12.72 0.1368 2.04 Continuous sorghum -0.0996 -2.62 0.2282 1.62 Corn-Soybeans rotation 0.1748 7.26 -0.4840 -5.43 Corn-Corn-Soybeans rotation 0.0204 0.51 -1.3416 -9.08 Corn-Soybeans-Wheat rotation -0.0911 -2.91 0.3975 3.43 Soybeans-Soybeans-Corn rot. 0.1826 4.03 -0.3819 -2.27 Wheat-Fallow rotation 0.1653 11.29 1.1225 20.69 Wheat-Sorghum-Fallow rot. -0.1317 -4.54 0.6107 5.68 Wheat-Soybeans rotation 0.2806 6.57 1.2817 8.10 Wheat-Sorghum rotation -0.0487 -1.64 0.4716 4.29 Corn-Corn-3 years Alfalfa 0.1869 4.04 -0.4000 -2.33 Interaction between the N application rate and rotation practices N*Continuous corn -0.0135 -20.99 -0.0091 -3.79 N*Continuous soybeans -0.0080 -7.61 -0.0026 -0.67 N*Continuous wheat -0.0112 -17.17 -0.0128 -5.26 N*Continuous sorghum -0.0135 -13.27 -0.0155 -4.11 N*Corn-Soybeans -0.0106 -14.95 -0.0093 -3.54 N*Corn-Corn-Soybeans -0.0114 -15.21 -0.0020 -0.71 N*Corn-Soybeans-Wheat -0.0088 -11.34 -0.0155 -5.42 N*Soybeans-Soybeans-Corn -0.0094 -9.83 -0.0077 -2.17

28
Table 2. Continued ___ Nitrogen Runoff ___ ___Nitrogen Leaching___ Variable Parameter t-Valuea Parameter t-Value N*Wheat-Fallow -0.0136 -20.58 -0.0203 -8.28 N*Wheat-Sorghum-Fallow -0.0080 -9.08 -0.0147 -4.52 N*Wheat-Soybeans -0.0142 -11.04 -0.0353 -7.38 N*Wheat-Sorghum -0.0129 -18.47 -0.0139 -5.37 N*Corn-Corn-3 years Alfalfa -0.0151 -19.53 -0.0012 -0.43 Rainfall and soil properties Rainfall (mm) 0.0007 24.88 0.0042 39.59 Slope 0.0033 2.53 -0.0533 -11.11 Clay percentage -0.0044 -8.90 -0.0209 -11.45 Organic matter percentage -0.0015 -1.18 0.0335 7.15 Bulk density 0.1107 4.38 1.1027 11.76 Soil pH -0.0211 -3.90 -0.0434 -2.17 Permeability -0.0079 -3.27 -0.0162 -1.78 Available water capacity 0.6129 4.78 -5.9605 -12.54 Interaction between the N application rate and soil properties and rainfall N*Rainfall -0.00001 -13.15 0.0000 -1.21 N*Slope -0.00002 -1.46 0.0002 2.90 N*Clay percentage 0.00003 4.14 0.0001 2.33 N*Organic matter percentage 0.00004 2.65 0.0001 1.94 N*Bulk density -0.0020 -5.94 0.0016 1.27 N*Soil pH 0.0002 3.59 0.0010 3.91 N*Permeability 0.0001 2.69 0.0002 2.17 N*Available water capacity 0.0009 0.54 0.0001 0.02 Hydrologic group dummies (Reference: Hydrologic group A) Hydrologic group B 0.1974 7.92 0.0224 0.24 Hydrologic group C 0.4255 15.40 -0.4201 -4.10 Hydrologic group D 0.6178 21.03 -0.8977 -8.25 Interaction between the N application rate and hydrologic groups N*Hydrologic group B -0.0006 -2.20 -0.0047 -4.74 N*Hydrologic group C -0.0006 -2.01 -0.0063 -5.57 N*Hydrologic group D -0.0003 -0.94 -0.0074 -5.92 Latitude 0.0083 10.27 0.0067 2.23 Longitude 0.0113 18.36 -0.0285 -12.44 R2 0.75 0.73 aThe 1%, 5%, and 10% critical values of the t-distribution are 2.58, 1.96, and 1.65.

29
Table 3. The Impacts of Alternative Management Practices and Resource Settings on Nitrogen Runoff and Leaching Nitrogen Runoff Nitrogen Leaching .
Variable Case a Na/Nb/N* Change in Case Na/Nb/N
* (lb/acre) runoff (lb/acre) Tillage, Conservation, and Irrigation Practices (Relative to Conventional Tillage or No Irrigation) Reduced tillage a Na = 131 Reduced if N > 131 b Nb = 51 Increased if N > 51 No till a Na = 132 Reduced if N > 132 - --- Contouring - --- Little effect - --- Strip-cropping - --- Little effect - --- Terracing a Na = 29 Reduced b Nb = 386 Reduced Irrigation a Na = 103 Reduced if N > 104 a Na = 2,551 Increased Soil Hydrologic Group (Relative to Group A) Group B a Na = 294 Increased a Na = 4 Reduced Group C a Na = 633 Increased d --- Group D a Na = 1,838 Increased d ---
Rotation (Relative to Continuous Corn) b Corn-Soybeans c N* = 27 Increased a N* = 69 Reduced Corn-Corn-Soybeans c N* = 61 Increased b N* = 87 Reduced Soybeans-Soybeans-Corn c N* = 21 Increased c N* = 45 Increased 2-yr Corn-3 years Alfalfa a N* = 138 Reduced c N* = 26 Increased Continuous Soybeans c N* = 0 Increased c N* = 27 Increased if N >27 Continuous Alfalfa c N* = 19 Increased if N > 19 c N* = 3 Increased a Case a: the alternative increases the intercept but reduces the coefficient of N; Case b: the alternative reduces the intercept but increases the coefficient of N; Case c: the alternative increases both the intercept and the coefficient of N; and Case d: the alternative reduces both the intercept and the coefficient of N. b N* and the changes in nitrogen losses are determined based on the following assumptions: (a) the crops are dryland produced on Clarion soil (hydrologic group A) in Story County, Iowa, by using conventional tillage, and (2) the annual nitrogen application rate for continuous corn is 125 pounds/acre.

30
Tab
le 4
. A
vera
ge A
nnua
l per
Acr
e N
O3
-N L
osse
s in
Run
off a
nd L
each
ing
____
____
____
____
____
____
____
____
____
____
____
____
____
____
____
____
____
____
____
____
____
____
____
____
____
____
____
____
____
___
N
Run
off
N
Lea
chin
g
----
----
----
----
----
----
----
----
----
----
----
----
----
----
----
----
----
--
----
----
----
----
----
----
----
----
----
----
----
----
----
----
----
----
--
Stat
e B
asel
ine
25%
N R
educ
tion
Rot
atio
n Po
licy
Bas
elin
e 25
% N
Red
uctio
n R
otat
ion
Polic
y
____
____
____
____
____
____
____
____
____
____
____
____
____
____
____
____
____
____
____
____
____
____
____
____
____
____
____
____
____
___
(l
b/ac
re)
(% c
hang
e)
(% c
hang
e)
(lb/
acre
) (%
cha
nge)
(%
cha
nge)
C
orn
Bel
t 4.
84
-17.
2 -1
4.1
5.33
-6
.9
-5.4
I
llino
is
4.80
-1
7.5
-15.
5 4.
57
-7.7
-7
.0
I
ndia
na
4.77
-1
5.3
-10.
9 9.
62
-7.9
-6
.8
I
owa
4.19
-1
9.6
-15.
1 1.
74
-18.
2 -1
5.0
M
isso
uri
6.51
-1
7.4
-15.
9 2.
63
-2.2
0.
7
O
hio
4.79
-1
3.8
-10.
1 12
.50
-2.9
-1
.4
Lak
e St
ates
4.
08
-21.
5 -1
3.9
6.30
-1
1.3
-6.2
M
ichi
gan
4.11
-1
9.3
-6.8
15
.44
-8.3
-3
.7
M
inne
sota
4.
05
-23.
0 -2
0.9
2.39
-1
6.8
-12.
7
W
isco
nsin
4.
12
-20.
1 -5
.7
7.07
-1
2.7
-5.9
Nor
ther
n Pl
ains
3.
03
-18.
6 -9
.7
1.69
-8
.7
-3.0
K
ansa
s 2.
64
-15.
7 -8
.1
2.30
-2
.3
6.6
N
ebra
ska
3.55
-1
5.4
3.1
4 2.
91
-19.
2 -2
3.1
N
orth
Dak
ota
3.00
-2
5.2
-23.
0 0.
55
0
28.2
S
outh
Dak
ota
3.03
-1
9.2
-13.
7 0.
52
0
17.5
St
udy
Reg
ion
3.99
-1
8.4
-12.
7 4.
07
-8.4
-5
.2
____
____
____
____
____
____
____
____
____
____
____
____
____
____
____
____
____
____
____
____
____
____
____
____
____

31
Table 5. Changes in total net return under the two policy scenarios __________________________________________________________ Region 25% N Reduction Crop Rotation __________________________________________________________ ----------million dollars---------------
Corn Belt 77.53 196.16 Lake States 11.99 117.22 Northern Plains 24.43 387.94 ___________________________________________________________

32
ENDNOTES
1. We compared the population and sample frequency distributions of four key soil properties: clay percentage, bulk density, pH, and organic matter percentage. The result indicated the population and sample frequency distributions were almost identical, implying that a representative sample was obtained. 2. The water balance simulated by EPIC version 5,125 (used in this study) produced less than normal percolation of water below the root zone and above normal evapotranspiration rates. Therefore, the percolation results of EPIC version 5,125 were calibrated based on version 3040, whose water balance simulation was at expected levels. 3. Average annual nitrogen losses tend to be influenced by a small number of weather-related effluent spikes. It is the probability of these effluent spikes that dominates the human health concern of the public and policy makers. Conservation practices which reduce expected nitrogen losses might not reduce the probability that a high rainfall event will cause large nitrogen runoff and leaching. However, effluent spikes, particularly when they are measured at the bottom of the root zone, are not transferred to consumers because groundwater acts as a buffer. Thus, mean nitrogen runoff and leaching are useful indicators of surface and groundwater contamination potential. 4. Randall and Bandel surveyed agronomists in each of the 48 contiguous states regarding N management with conservation tillage. They found that there was no difference in N recommendations for various tillage systems in most states. Where an extra amount was suggested, the justification for the increase was to compensate for volatilization and immobilization. Proper placement was stressed more than N rate when surface residues exist. 5. In independent studies, Baker and Laflen, and Wendt and Burwell concluded that on average, conservation tillage reduces nitrogen runoff, with a probable average reduction of 20 to 25 percent. 6. Coincidentally, soil N tests have been conducted for a larger proportion of crop acres in Nebraska than in other areas of the study region (ERS, USDA 1993).

33
REFERENCES
Babcock, B.A., and A.M. Blackmer. “The Value of Reducing Temporal Input Nonuniformities.” J. Agr. and Resour. Econ. 17(December 1992):335-47.
Baker, J.L. “Conservation Tillage: Water Quality Implications.” In A System Approach to
Conservation Tillage, F. M. D’Itri, ed., pp 217-380. Chelsea, MI: Lewis Publishers, Inc., 1985. Baker, J.L., and J.M. Laflen. “Effect of Corn Residue and Fertilizer Management on Soluble Nitrogen
Runoff Losses.” Trans. ASAE 25(1982):344-48. Blom, G. Statistical Estimates and Transformed Beta Variables. New York: John Wiley and Sons,
1958. Bosch, D.J., K.O. Fuglie, and R.W. Keim. “Economic and Environmental Effects of Nitrogen Testing
for Fertilizer Management.” Rep. No. AGES 9413, USDA, Economic Research Service, Washington, DC, April 1994.
Bouzaher, A., P.G. Lakshminarayan, R. Cabe, A. Carriquiry, P.W. Gassman, and J.F. Shogren.
“Metamodels and Nonpoint Pollution Policy in Agriculture.” Water Resour. Res. 29 (June 1993):1579-87.
Box, G.E.P., and W.J. Hill. “Correcting Inhomogeneity of Variance with Power Transformation
Weighting.” Technometrics 16(1974):385-89. Braden, J. B., G. V. Johnson, A. Bouzaher, and D. Miltz. "Optimal Spatial Management of
Agricultural Pollution." Amer. J. Agr. Econ. 71(May 1989):404-13. Conservation Technology Information Center. 1993 National Crop Residue Management Survey.
West Lafayette IN: National Association of Conservation Districts, 1993. Diebel, P.L., D.B. Taylor, S.S. Batie, and C.D. Heatwole. “Low-Input Agriculture as a Ground Water
Protection Strategy.” Water Res. Bull. 28(July/August 1992):755-61. Gilliam, J.W., and G.D. Hoyt. “Effect of Conservation Tillage on Fate and Transport of Nitrogen.” In
Effects of Conservation Tillage on Groundwater Quality: Nitrates and Pesticides, T.J. Logan, J.M. Davidson, J.L. Baker, and M.R. Overcash, eds., pp. 217-40. Chelsea MI: Lewis Publishers, Inc., 1987.
Goebel, J. W., and G. D. Dorsch. National Resources Inventory: A Guide for Users of the 1982 NRI
Data Files. Staff Pub., USDA, Soil Conservation Service, Washington, D. C., July 1986 (Revised).
Hallberg, G.R. “Nitrate in Ground Water in the United States.” In Nitrogen Management and Ground-
Water Protection, R.F. Follet, ed., pp. 35-74. New York: Elsevier Science Publishing Co., 1989.

34
Helfand, G.E., and B.W. House. “Regulating Nonpoint Source Pollution Under Heterogeneous
Conditions.” Amer. J. Agr. Econ. 77(November 1995):1024-1032. Hennessy, D., B.A. Babcock, and D. Hayes. “The Budgetary and Resource Allocation Effects of
Revenue Assurance.” Working Paper No. 95-WP130, Center for Agricultural and Rural Development, Iowa State University, February 1995.
Huang, W.-Y., D. Westernbarger, and K. Mizer. “The Magnitude and Distribution of U.S. Cropland
Vulnerable to Nitrate Leaching.” In Making Information Work: Proceedings, National Governors Association Conference, Washington DC., 18-23 January 1992.
Johnson, S.L., R.M. Adams, and G.M. Perry. “The On-Farm Costs of Reducing Groundwater
Pollution.” Amer. J. Agr. Econ. 73(November 1991):1063-72. Jones, C.A., J.R. Williams, A.N. Sharpley, and C.V. Cole. “Testing the Nutrient Components of
EPIC.” In Symposium Proceedings of the Natural Resources Modeling, D.G. Decoursey, ed. Pingree Park CO, 1985.
Kanwar, R.S., J.L. Baker, and J.M. Laflen. “Nitrate Movement Through the Soil Profile in Relation to
Tillage System and Fertilization Application Method.” Trans ASAE 28(1985):1802-07. Kellogg, R.L., M.S. Maizel, and D.W. Goss. “Agricultural Chemical Use and Ground water Quality:
Where Are the Potential Problem Areas?” USDA Staff Rep., Soil Conservation Service/Economic Research Service, Washington, DC, December 1992.
Kitur, B.K., M.S. Smith, R.L. Blevins, and W.W. Frye. “Fate of N-Depleted Ammonium Nitrate
Applied to No-Tillage and Conventional Tillage Corn.” Agron. J. 76(1984):240-42. Kleijnen, J.P.C. Statistical Tools for Simulation Practitioners. New York: Marcell Dekker, Inc., 1987. Mapp, H.P., D.J. Bernardo, G.J. Sabbagh, S.Geleta, and K.B. Watkins. “Economic and Environmental
Impacts of Limiting Nitrogen Use to Protect Water Quality: A Stochastic Regional Analysis.” Amer. J. Agr. Econ. 76(November 1994):889-903.
Mueller, D.K., P.A. Hamilton, D.R. Helsel, K.J. Hitt, and B.C. Ruddy. “Nutrients in Ground Water of
the United States -- An Analysis of Data Through 1992.” Water-Resources Investigations Rep. No. 95-4031. U.S. Geological Survey, Denver CO, 1995.
Nielsen, E.G., and L.K. Lee. “The Magnitude and Costs of Groundwater Contamination From
Agricultural Chemicals: A National Perspective.” Agr. Econ. Rep. No. 576, USDA, Economic Research Services, Washington DC, 1987.
Omernik, J.M. “Nonpoint Source-Stream Nutrient Level Relationships-A Nationwide Study.” Rep.
No. EPA-600/3-P77-105, U.S. Environmental Protection Agency, Corvallis OR, 1977.
35
Randall, G.W., and V.A. Bandel. “Overview of Nitrogen Management for Conservation Tillage Systems: An Overview.” In Effects of Conservation Tillage on Groundwater Quality: Nitrates and Pesticides, Logan et al., eds., Chelsea MI: Lewis Publishers, Inc., 1987.
SAS Institute Inc. SAS/ETS TM Users’ Guide, Version 5. Cary NC: SAS Institute, Inc., 1984. Sharpley, A.N. and J.R. Williams, eds. “EPIC--Erosion/Productivity Impact Calculator: 1. Model
Documentation.” Tech. Bull. No. 1768, USDA, Washington DC, 1990. Shortle, J.S., and J.W. Dunn. “The Relative Efficiency of Agricultural Source Water Pollution Control
Policies.” Amer. J. Agr. Econ. 68(August 1986):668-77. Shortle, J.S., W.N. Musser, W.C. Huang, B. Roach, K. Kreahling, D. Beegle, and R.M. Fox.
“Economic and Environmental Potential of the Pre-sidedressing Soil Nitrate Test: Final Report.” Prepared for the U.S. Environmental Protection Agency through Dept. of Agr. Econ. and Rural Sociol., Pennsylvania State University, 1993.
Smith, R.A., R.B. Alexander, and K.J. Lanfear. “Stream Water Quality in the Conterminous United
States-Status and Trends of Selected Indicators During the 1980’s.” In National Water Summary 1990-91: Hydrologic Events and Stream Water Quality, R.W. Paulson, E.B. Chase, J.S. Willams, and D.W. Moody, eds. Water-Supply Paper No. 2400, U.S. Geological Survey, Denver CO,1993.
Smith, R.A., R.B. Alexander, and M.G. Wolman. “Water Quality Trends in the Nation’s Rivers.”
Science 235(1987):1607-15. Snee, R.D. “Validation of Regression Models: Methods and Examples.” Technometrics 19(1977):415-
28. Swanson, E.R. “Economic Implications of Controls on Nitrogen Fertilizer Use.” In Nitrogen in
Agricultural Soils, pp.773-90, Agronomy Monograph No. 2, 1982. Taylor, M.L., R.M. Adams, and S.F. Miller. "Farm-Level Response to Agricultural Effluent Control
Strategies: The Case of the Willamette Valley." J. Agr. and Resour. Econ. 17(July 1992):173-85.
Teague, M., and D.J. Bernardo. “Estimating Nitrogen Percolation Relationships: An Application of
Tobit Analysis.” Agr. Systems (forthcoming). Tennessee Valley Authority, Economic and Marketing Staff. Commercial Fertilizers. TVA, Muscle
Shoals AL. Various issues through December 1993. Thomas, G.W., K.L. Wells, and L. Murdock. “Fertilization and Liming.” In No-Tillage Research:
Research Reports and Reviews, R.E. Phillips et al., eds. Lexington KY: University of Kentucky, 1981.
36
Turner, R.E., and N.N. Rabalais. “Changes in Mississippi River Water Quality This Century.”
Bioscience 41(March 1991):140-47. Tyler, D.D., and G.W. Thomas. “Lysimeter Measurement of Nitrate and Chloride Losses from
Conventional and No-Tillage Corn.” J. Environ. Qual. 6(1979):63-66. U.S. Department of Agriculture. The 1992 Annual Cropping Practices Survey. Unofficial data files.
USDA, Washington DC 1994. U.S. Department of Agriculture, Economic Research Service. “RTD UPDATES: Area Studies---
Central Nebraska Basin Study.” USDA/ERS, Washington DC, January 1993. . “RTD Updates: Fertilizer, No. 1.” USDA/ERS, Washington DC, March 1994. U.S. Department of Agriculture, Soil Conservation Service. The 1992 National Resources Inventory.
Database, USDA/SCS, Washington DC, March 1994. U.S. Department of Agriculture, Statistical Reporting Service. Usual Planting and Harvesting Dates,
Field and Seed Crops, by States in Principal Producing Areas. Agriculture Handbook No. 283, USDA/SRS, Washington DC, March 1972 (revised).
Wendt, R.C., and R.E. Burwell. “Runoff and Soil Losses for Conventional, Reduced and No-Till
Corn.” J. Soil and Water Conserv. 40(1985):450-54. Williams, J. R., C.A. Jones, and P.T. Dyke. "EPIC, the Erosion Productivity Index Calculator." Model
Documentation, Vol. 1. Temple, Texas: U.S. Department of Agriculture, Agricultural Research Service, 1988.
Williams, J.R., R.V. Llewelyn, and G.A. Barnaby. “Risk Analysis of Tillage Alternatives with
Government Programs.” Amer. J. Agr. Econ. 72(February 1990):172-81. Wu, J. J., H.P. Mapp, and D.J. Bernardo. "A Dynamic Analysis of the Impact of Water Quality Policies
on Irrigation Investment and Crop Choice Decisions." J. Agr. and Appl. Econ. 26 (December 1994):506-25.
Wu, J.J., M.L. Teague, H.P. Mapp, and D.J. Bernardo. “An Empirical Analysis of the Relative Efficiency of Policy Instruments to Reduce Nitrate Water Pollution in the U.S. Southern High Plains.” Canad. J. Agr. Econ. 43 (November 1995): in press.