impacts of an ict-assisted program on attitudes and ... · dp rieti discussion paper series...
TRANSCRIPT

DPRIETI Discussion Paper Series 17-E-030
Impacts of an ICT-assisted Program on Attitudes and English Communicative Abilities: An experiment in a Japanese high school
HIGUCHI YukiNagoya City University
SASAKI MiyukiNagoya City University
NAKAMURO MakikoKeio University
The Research Institute of Economy, Trade and Industryhttp://www.rieti.go.jp/en/

1
RIETI Discussion Paper Series 17-E-030
March 2017
Impacts of an ICT-assisted Program on Attitudes and English Communicative Abilities: An experiment in a Japanese high school*
HIGUCHI Yuki
Nagoya City University
SASAKI Miyuki
Nagoya City University
NAKAMURO Makiko
Keio University
Abstract We conducted a randomized experiment targeting 322 Japanese high school students to examine the impacts of a
newly developed English learning program. The treated students were offered an opportunity to communicate for
25 minutes with English-speaking Filipino teachers via Skype several times a week over five months. The
opportunities were offered as extracurricular activities and were not included in their grades. Results show that
only 6% of the treated students completed the recommended number of lessons over the observation period. In
addition, the Skype program made the treated students more interested in an international vocation and foreign
affairs. However, probably due to the low completion rate, the students did not improve their English speaking
and listening abilities as measured by a standardized test. Further investigation shows that the take-up rate was
particularly low among students showing a tendency to procrastinate. These results suggest the importance of
maintaining students’ motivation to keep using such information and communications technology (ICT)-assisted
learning programs if they are not already incorporated into the existing curriculum. Having procrastinators self-
regulate may be especially crucial. However, significant positive changes in the students’ attitude support the use
of such programs even as extracurricular activities.
Keywords: Field experiment, Impact evaluation, English education, Information and communication technology,
Applied linguistics, Procrastination
JEL classification: C9, I2, H4
RIETI Discussion Papers Series aims at widely disseminating research results in the form of professional
papers, thereby stimulating lively discussion. The views expressed in the papers are solely those of the
author(s), and neither represent those of the organization to which the author(s) belong(s) nor the Research
Institute of Economy, Trade and Industry.
* This study is conducted as a part of the “Measurement of the qualities of health and education services, and analysis of their determinants” project undertaken at the Research Institute of Economy, Trade and Industry (RIETI).
2
I. Introduction
Providing students with high quality inputs is important in improving the quality of
education. As an alternative to conventionally used inputs (e.g., textbooks, blackboard),
the effects of using information and communication technology (ICT) have been recently
examined in various areas in education (e.g., Bulman and Fairlie, 2016; Gee and Hayes,
2011; Levy, 2009). One of the advantages of adopting ICT in education is that it can
provide personalized and self-paced learning opportunities whereas formal education
generally provides uniform inputs for students in the same classroom. Examples of ICT-
assisted education include an educational software designed to complement the primary
school curriculum for the teaching of languages (Rouse and Krueger, 2004; Nakamuro
and Kayaba, 2016) as well as for math (Carrillo, Onofa, and Ponce, 2010; Lai et al, 2013)
and video-recorded tutorials used in cramming schools to prepare students for university
entrance exams (Kono, Sawada, and Shonchoy, 2016). However, such ICT inputs are
generally introduced as extra-curricular activities, and their utilization depends on the
students’ motivation to use them.
It is increasingly recognized among economists that various decisions in our life
depends on our degree of self-control (e.g., Laibson, 1997; O’Donoghue and Rabin, 1999).
A series of studies by Onji and Kikuchi (2011) and Onji (2013) illustrates how the self-
control issue arises in education, where lack of self-control, including procrastination, can
result in poor test performance. Based on these studies, we hypothesize that lack of self-
control is also likely to hinder the utilization of ICT-assisted education programs,
especially when provided as extra-curricular activities. The lack of self-control and
consequent limited utilization is arguably a cause of mixed impacts of ICT education
reported in the survey article by Bulman and Fairlie (2016). To shed light on the

3
relationship between students’ use of ICT inputs, their degree of self-control, and
effectiveness of the ICT inputs, we conducted a randomized experiment to analyze
impacts of an ICT-assisted program provided as an English extra-curricular activity.
Methodologically, we experimentally introduced a newly-developed online
English learning program, which makes use of Skype, to 322 students in Grade 10. The
Skype program is an individualized, self-paced program in which students communicate
with English-speaking Filipino interlocutors at mutually convenient times using learning
materials of their own choice. We selected English education as our research target
because the quality of English education has recently been one of the most serious
political concerns in Japan due to its inefficiency (Butler and Iino, 2005). In contrast to
the high internationally-normed performance of Japanese students’ in math, reading, and
science as measured by the OECD’s Program for International Student Assessment
(PISA) for Grade 9 students, their performance in English has been far from satisfactory.
According to a nationwide English test conducted in 2014 by the Ministry of Education,
Science, Sports, and Culture, Japan, (henceforth, MEXT), a majority of Grade 12 students
were ranked at the lowest level (A1) in the Common European Framework of Reference
for Languages (CEFR), with their speaking performance lowest among the four skills
measured. Based on these results, MEXT recognized that the quality of English education,
particularly in nurturing speaking abilities, should be improved (MEXT, 2015).
In our experiment, we introduced the Skype English Program with a cross-over
design. First, we randomly selected half of our sample (161 students) to be given
opportunities to use the program from July to November 2015 (five months), while the
remaining 161 students were given opportunities to use the program during the following
five months (from January to May 2016). While all the sample students had equal

4
opportunities to use the program by May 2016, only half of them had availed themselves
of this opportunity in December 2015, when we conducted endline survey. We therefore
called the students exposed to the program in the first round (July to November, 2015)
the treatment group, and those exposed to it in the second round (January to May, 2016)
the control group.
Combining program usage records and panel data collected before and after the
introduction of the program to the treatment group (but not yet to the control group), three
findings stand out. First, as the Skype program was introduced outside of the regular
English curriculum, the utilization rate turned out to be low. Only 10 out of the 161
students in the treatment group took lessons 50 times or more over the five months, as
recommended by the program provider, and 31 students did not take even a single lesson.
In addition, Poisson regressions show that the take-up rate was particularly low among
students with a tendency to procrastinate. Second, despite such a low take-up rate, the
program positively changed the attitude of the treated students, especially in terms of their
interest in an international vocation and foreign affairs. This finding is important because
longitudinal studies of attitudinal changes in foreign language students are rare (Ortega
and Iberri-Shea, 2005). In particular, LATE estimates suggest that the magnitude of
impacts was larger for students with higher level of program utilization.
Third, despite the positive impacts on the students’ attitude, the measured impacts
on their English communication skills are not statistically significant. This may be
attributed to the low take-up rate as well as the low intensity of the program (25 minutes
per lesson) in comparison with the students’ concurrent regular English classes (50 per
lesson on most weekdays). These findings suggest that the Skype program can positively
change students’ attitudes toward an international vocation and foreign affairs, a factor
5
that has been found to lead to improvements in the English communication skills of
Japanese students over time (e.g., Sasaki, 2011; Yashima, Zenuk-Nishide, and Shimizu,
2004). However, to make a contribution to the study of students’ English proficiency
development, this would have to be examined over a longer period. At present, this the
study can only suggest that the program has the potential to improve the participants’
English communicative abilities. Based on these findings and their implications, more
research is warranted on how to improve and maintain students’ motivation, particularly
those with a tendency to procrastinate, to use self-regulatory programs such as the one
targeted in this study.
The remainder of this paper is organized as follows. Section 2 explains the
experimental design, including the context, timeline, and details of our intervention and
checks for balance. Section 3 discusses the issue of program take-up, and Section 4
presents estimated program impacts. Finally, Section 5 contains a summary of the
findings and implications for future studies.
II. Experimental Design
Context and Timeline
We collaborated with a public high school located in central Japan. The school belongs
to the top tier in the region. For example, the school was selected as one of the 112 Super
Global High Schools (SGH) among the 4,939 high schools in Japan as of 2015. SGHs are
selected based on the school’s strong determination to nurture globalized leaders with
high levels of interest in societal problems, communication skills, and problem solving
abilities, and selected schools receive special budgetary support from MEXT to nurture
students who will play internationally active roles in the future. The school agreed to

6
introduce the Skype program as part of the extra-curricular activities.
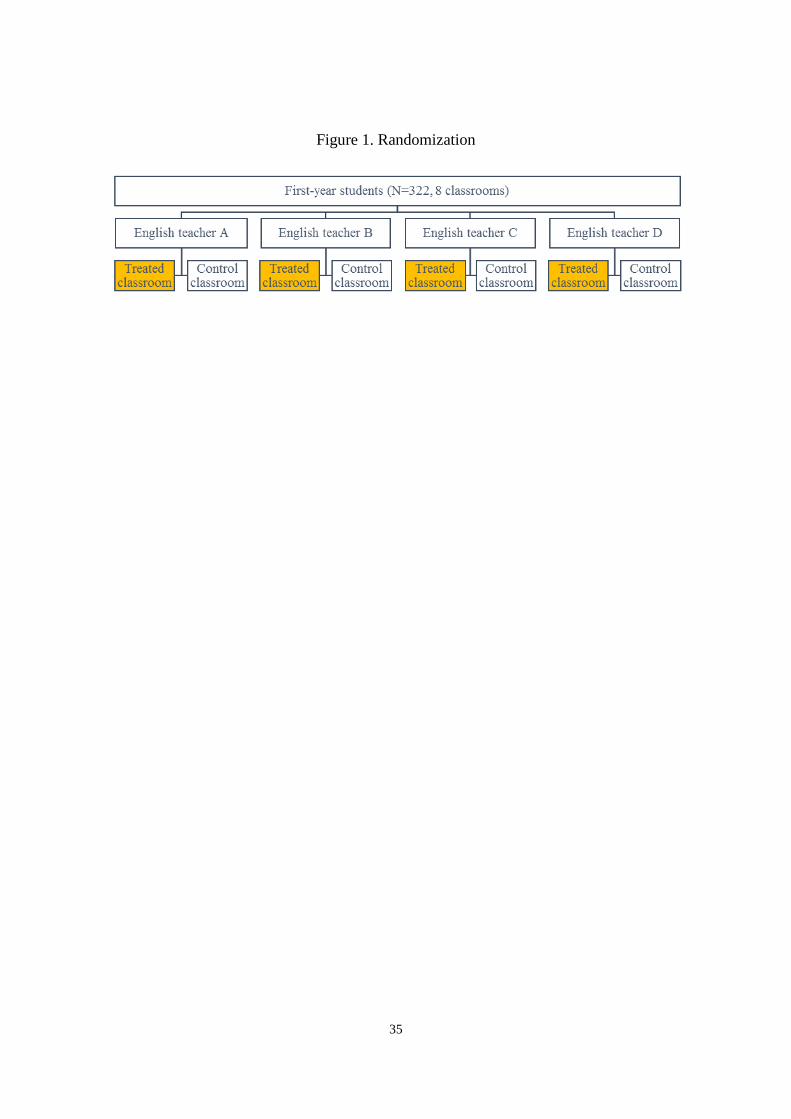
Our sample consisted of all 322 first-year students enrolled in this high school
(Grade 10).1 As all of them had passed the same entrance examination, they formed a
relatively homogeneous group, with high levels of academic achievement at the time of
the experiment. As the school does not stream students into specialized classes in Grade
10, all of them were randomly assigned to one of eight classrooms, each consisting of 40
or 41 students (see Figure 1 for illustration). With regards to English teachers in this
school, each of four English teachers was responsible for two of these eight classes. Using
such classroom and English teacher assignment, we randomized the sample students at
the teacher-classroom level, randomly selecting one of the two classes instructed by each
English teacher to the treatment group and the other to the control group. In sum, we had
four experimental classes (160 students), and four control classes (161 students).
Prior to introducing the program, we conducted a survey designed to collect
information on the students’ characteristics, including past exposure to English, current
study environment, attitude toward English communication, and family background,
including parental educational attainment. The survey was conducted in June 2015, using
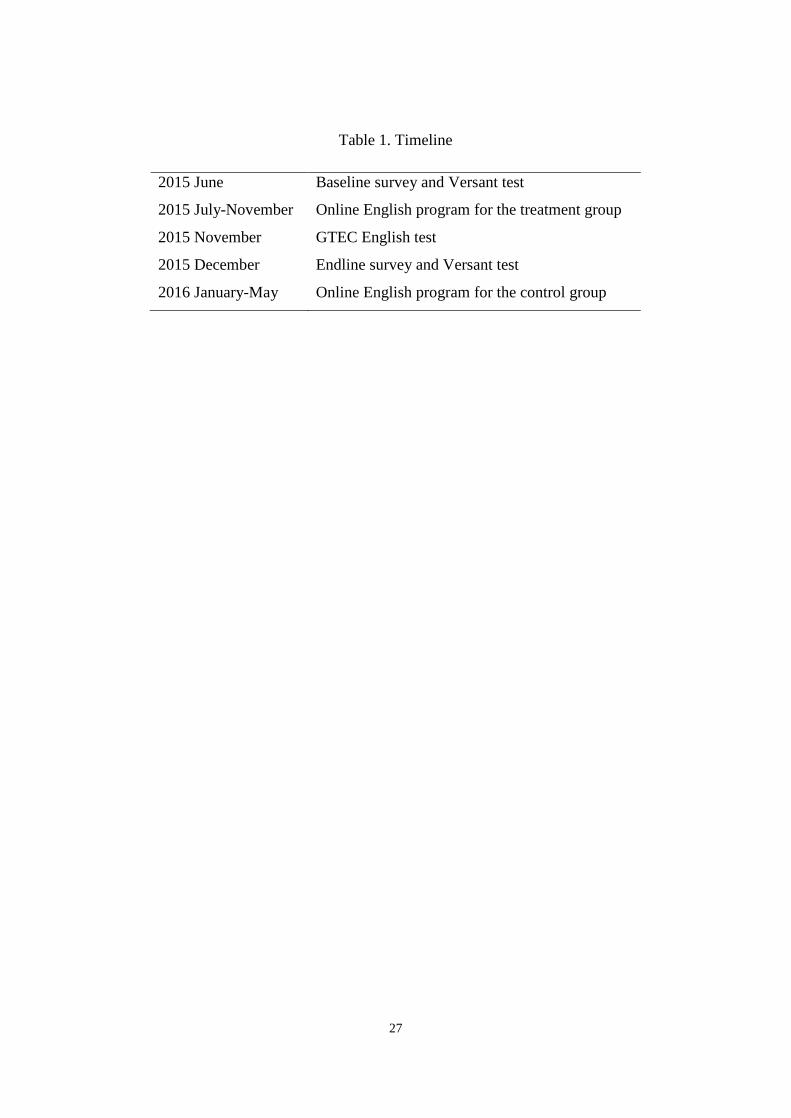
a mark-sheet questionnaire we developed. The timeline of our research is presented in
Table 1.
[INSERT TABLE 1 ABOUT HERE]
Soon after the baseline survey was conducted, the sample students took the
1 We provided all the parents of the sample students with the information on our research purpose before starting data collection and intervention. As parents of one student refused to provide data for our analyses, we excluded the data collected from that student, and thus the sample size is 321 in our empirical analyses.
7
Versant speaking test (Pearson Inc., 2008), a standardized test designed to evaluate the
oral English skills (integrated listening and speaking) of non-native English speakers. We
chose this particular test because of its reported high validity and reliability among
populations similar to the participants in the present study and because it requires a
relatively short time (20 minutes) to conduct compared to other English communication
tests (e.g., TOEFL iBT). During the Versant test, the students listened to questions spoken
in English and gave verbal answers in English. Their answers were recorded and scored
online. The test was conducted in a computer room inside the school by class, and thus,
the test-taking environment was essentially the same for all students. Due to the
overburden of internet connection, however, the answers of some students were not
properly recorded and were therefore removed from the subsequent analysis. Answers
were scored according to four criteria: (i) sentence mastery; (ii) vocabulary; (iii) fluency;
and (iv) pronunciation.
Following the survey and Versant test administered in June 2015, we began our
intervention in July 2015. The students in the treatment classes were provided with
opportunities to use the Skype program free of charge.2 To mitigate inequality between
the two groups (as mentioned above), we provided the same amount of intervention with
a time lag, with the program being made available to the treatment classrooms from July
to November, 2015 and to the control classrooms from January to May, 2016.
In December 2015, when only the treated students had received the program, we
conducted an endline survey and Versant test. In other words, to investigate the effects of
the Skype program, the treatment and the control classes were compared using difference
2 Although the market price of the program is ¥5,800 (about $52) per month, we provided the students with the Skype program free of charge. This included one 25-minute lesson for every day of intervention.
8
in differences design. In addition, in November 2015, the students took the GTEC for
STUDENTS test, another standardized test developed and distributed by Benesse Co. to
evaluate reading, writing, listening, and writing skills in English. The test consisted of 30
multiple-choice listening items (13 minutes), 30 multiple-choice reading items (24
minutes), 3 performative writing items (26 minutes), and 4 performative speaking items
(12 minutes). As the test was taken when only the treated students were exposed the
program, we compare the performance of the two groups. After the control group received
the opportunities to use the Skype program from January to May 2016, all 322 students
had been exposed to the same intensity of intervention (or lack thereof) by the end of May
2016.
Intervention
Our intervention consisted of providing the sample students with opportunities to use the
Skype program. In contrast to conventional face-to-face English learning methods, in this
program, learners and teachers do not have to be present in the same space. In addition,
learners can be matched with teachers on a more flexible basis because learners can select
among available teachers at a time of their convenience. Such online English programs
have become increasingly popular among Japanese business persons, partly because of
the time flexibility and partly because of the low cost of such programs relative to similar
face-to-face English learning programs offered by commercial conversation or cramming
schools.3 However, according to the baseline survey we conducted before the beginning
of the intervention, 65% of the students have never heard of this type of online English
3 This reduction in costs has become possible thanks to the hiring of English-speaking Filipino teachers, a development that constitutes a prime example of expanding business process outsourcing (BPO) to the Philippines.
9
learning program, only one was using the program, and another ten had used it in the past.
In this baseline survey, 30% of the students responded that they would be very willing to
use the program if given the chance, and another 50% responded that they were
moderately willing to use it. Hence, while the program was new to most of the students,
it was favorably perceived at the beginning of our intervention.
The Skype program was provided to the students outside of their regular English
classes. Each lesson took 25 minutes, and the students were recommended to take one
lesson every three days (i.e., ten lessons a month, or 50 in total) in order to take full
advantage of the program. The students could make an appointment for a lesson at any
time between 6 am and 1 am on the next day, and could choose any of the available
teachers. If the student’s preferred teacher was not available at the time of their
convenience, they could choose another time slot or another available teacher in the same
slot. The pool of teachers consisted mostly of current students or graduates of the
University of the Philippines, the top national university in the country. Because English
is the language of instruction in their home university and also because they were
screened on the basis of the company’s strict hiring criteria, we judged that the quality of
the teachers was reasonably guaranteed. While some of the teachers spoke Japanese,
participating students had to communicate entirely in English with the help of the chatting
(texting) function in Skype. Students were free to choose appropriate study materials for
each lesson from a wide range of materials provided by the program, including daily
conversation, academic talk, grammar and vocabulary, and business English. In other
words, the participants’ choices of teachers, time slots, and study materials were totally
up to them. Most importantly, while we provided the students with opportunities to use
the program, it was ultimately up to them whether and how often to take lessons,

10
especially since their participation was not included in their grades.
Balance Check
Table 2 presents the basic characteristics of students in the two groups. As we were
interested in analyzing the effect of procrastination on the utilization of our program, we
collected information on the tendency to procrastinate as well as information on
(im)patience and present bias (see the next section for definitions). In addition, data on
other characteristics that could potentially influence the take-up rate and impacts of the
Skype program were collected. These included family background (number of books at
home and parental educational attainment),4 past exposure to English, and current study
environment (having their own room, owning a smartphone, a personal computer, or a
tablet, commuting time to school, and membership of a school sports club). Except for
number of books at home, which is different between two groups at 10% significance
level, their characteristics were balanced. Hence, we concluded that the randomization
was successful.
[INSERT TABLE 2 ABOUT HERE]
III. Program Utilization
Measurement of Procrastination
Procrastination was measured through six questions asking students to rate their
perception of themselves taken from Osaka University (2013) and Honda and Nishijima
4 Number of books at home is reported to be a good proxy of cultural capital (e.g., Lareau, 1987; DiMaggio, 1982).
11
(2007). The questions (originally written in Japanese and translated by the authors)
included items such as: “Are you a person who postpones plans even when you make
one?” “Are you a person who impulsively buys things you like?” and “Are you a person
who is happy as long as you have fun now?” The students answered all six questions with
categorical responses; Yes, Moderately yes, 50/50, Moderately no, or No. We assigned a
score of 4 to the answer Yes, 3 to Moderately yes, 2 to 50/50, 1 to Moderately no, and 0
to No. We then aggregated the scores for all six questions in order to construct a single
index of procrastination, which ranged from 0 to 24 (4 maximum by 6 items). These
aggregated scores were normalized by subtracting the sample means divided by the
standard deviations and were presented as z-scores.
In addition to the tendency to procrastinate, we elicited two other behavioral
attributes, namely (im)patience and present bias, using standard questions to measure
time preference (e.g., Frederick, Loewenstein, and O'Donoghue, 2002). We asked
whether students would prefer to receive “¥2,000 (about $18) today or ¥2,500, ¥3,000, or
¥3,500 a month later.” Based on the answers to these three questions, we computed the
1-month current discount rate from today. The impatience variable was scored 0 if the
discount rate was less than 25%, 1 if 25-50%, 2 if 50-75%, and 3 if more than 75%.
Similarly, we asked whether the students would prefer to receive “¥2,000 six months later
or ¥2,500, ¥3,000, or ¥3,500 7 months later” in order to compute the 1-month future
discount rate in sixth months’ time. By comparing the two discount rates (current and in
sixth months), we constructed a dummy variable for present bias, which was assigned one
if the current discount rate was greater than the future discount rate.
Program Utilization
12
Figure 2 shows daily changes in the number of students who took the lessons based on
program usage records. Of the total 160 students assigned to the treatment group, the
average number of students who took lessons per day was 25 in July 2015. However, if
all students followed the recommended 10 lessons a month, that number should be 52
(=10 lessons times 160 students divided by 31 days). Thus, the take-up rate in the first
month of the intervention was about half. Moreover, the number of students taking
lessons gradually decreased, presumably as the novelty effect faded, with the average
number falling to 15 in August, 12 in September, 6 in October, and 5 in November. The
take-up rate among the control group also showed a declining tendency. However, the
number of lessons taken up was much lower than in the treatment group throughout the
five-month period. This can be explained by the change in students’ orientation toward
university entrance exams (as the share of listening in the Center Exam, the crucial
entrance exam taken by most applicants for university admission, is small and speaking
is not a part of the exam; see Sasaki, 2011) as well as by an increased study workload. In
addition, reduced encouragement may also explain the lower take-up rate among the
control group because we occasionally visited the school to ask the school principal and
the English teachers to encourage the utilization of the program in the first period but not
in the later one.
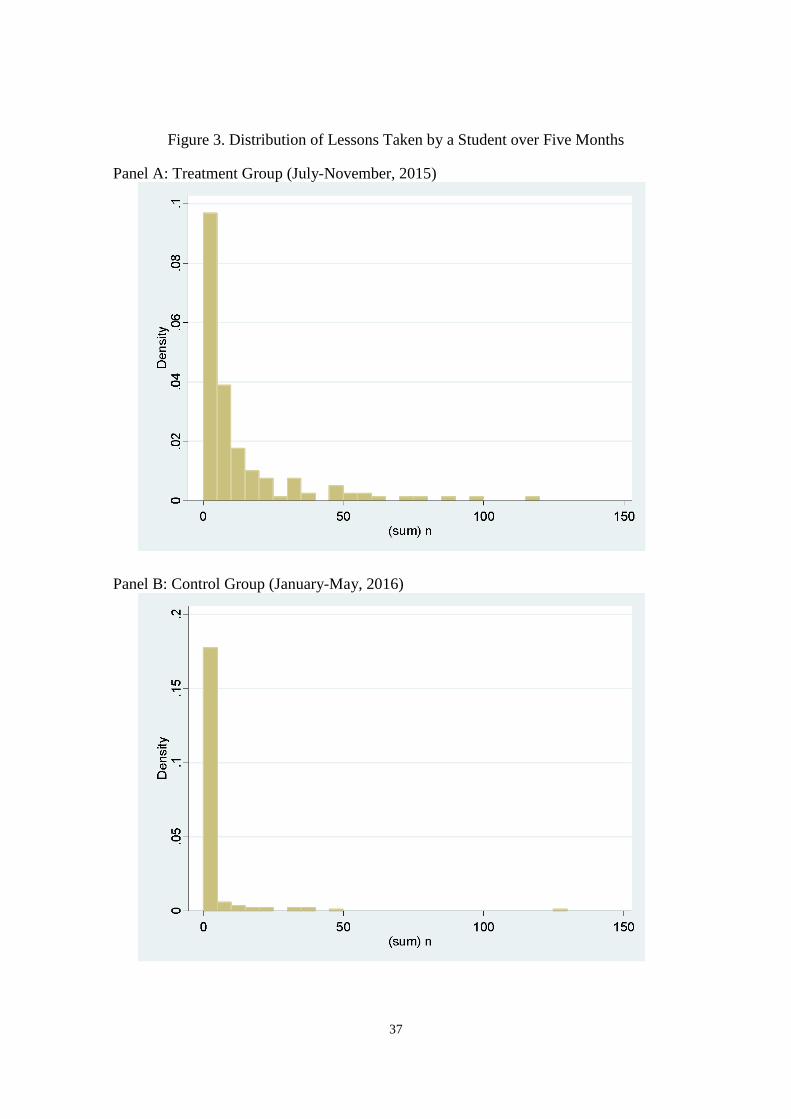
Panel A of Figure 3 shows the distribution of lessons taken in five months among
the treated students. By the end of our first intervention, 31 (19%) of the 160 students
never took any lessons, and 57 (36%) took 5 or fewer lessons. Only 23 students (14%)
completed 25 or more lessons, which was only about half of the recommended number,
of whom only 10 (6%) completed the recommended 50 or more lessons over the five
months. Furthermore, Panel B illustrates that the utilization was even lower in the control
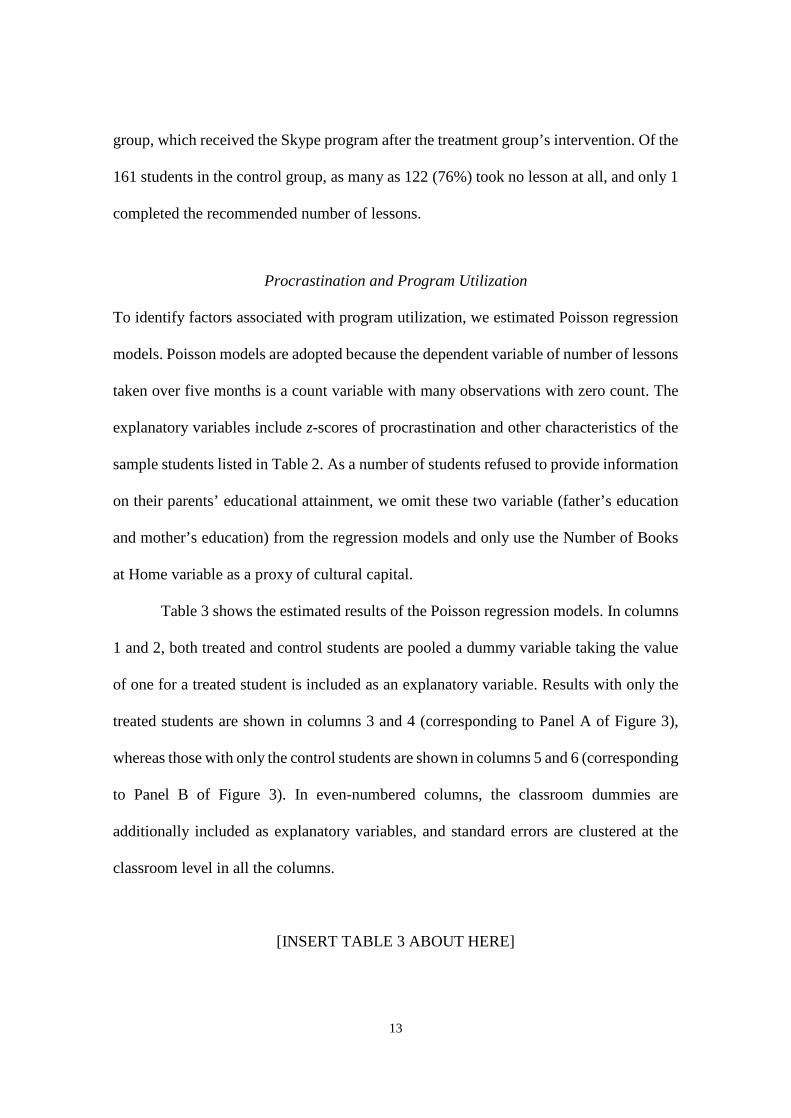
13
group, which received the Skype program after the treatment group’s intervention. Of the
161 students in the control group, as many as 122 (76%) took no lesson at all, and only 1
completed the recommended number of lessons.
Procrastination and Program Utilization
To identify factors associated with program utilization, we estimated Poisson regression
models. Poisson models are adopted because the dependent variable of number of lessons
taken over five months is a count variable with many observations with zero count. The
explanatory variables include z-scores of procrastination and other characteristics of the
sample students listed in Table 2. As a number of students refused to provide information
on their parents’ educational attainment, we omit these two variable (father’s education
and mother’s education) from the regression models and only use the Number of Books
at Home variable as a proxy of cultural capital.
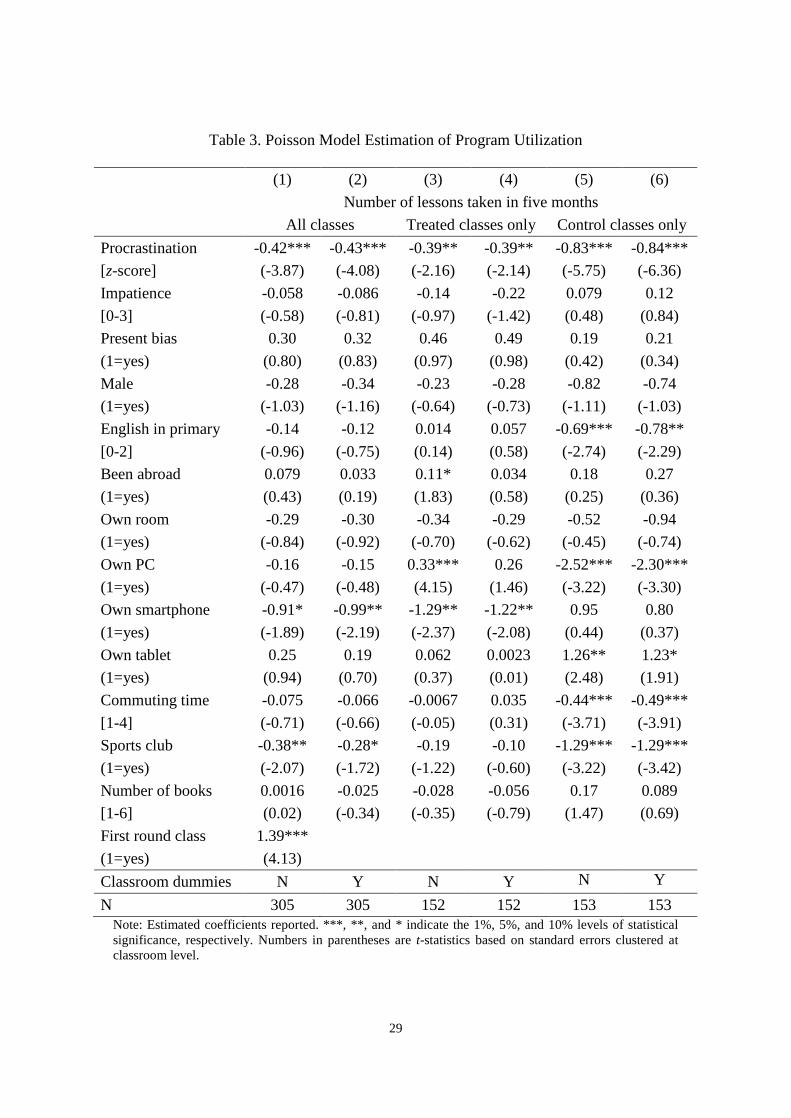
Table 3 shows the estimated results of the Poisson regression models. In columns
1 and 2, both treated and control students are pooled a dummy variable taking the value
of one for a treated student is included as an explanatory variable. Results with only the
treated students are shown in columns 3 and 4 (corresponding to Panel A of Figure 3),
whereas those with only the control students are shown in columns 5 and 6 (corresponding
to Panel B of Figure 3). In even-numbered columns, the classroom dummies are
additionally included as explanatory variables, and standard errors are clustered at the
classroom level in all the columns.
[INSERT TABLE 3 ABOUT HERE]
14
In all the columns, the procrastination variable is negative and significant,
illustrating the detrimental effect of procrastination on program utilization. This effect is
observed both in the first period, when the novelty effect was likely to be large, and in
the second period, when the control group were given opportunities to use the Skype but
their interest in the program started to decrease. Evidently, the issue of self-control is a
concern when a new ICT-assisted program such as the one used in the present study is
introduced. In terms of size of the effects, marginal effects of procrastination is computed
as -3.21 at the means of all explanatory variables; that is, a standard deviation increase in
the procrastination index reduces the number of lessons by three times for an average
student. Although the magnitude seems to be small, the first few trials of the program is
critical for subsequent utilization. The program was new to most of the students and,
according to our informal interviews with sample students, they started to like the
program as they went through initial few lessons and talked with Filipino interlocutors.
To identify factors associated with the initial decision to try the program, we
estimate Probit regression models, where the dependent variable is a dummy variable that
takes the value of one if a student ever used a program and zero if he/she never took any
lesson. As discussed above, the share of such never-taker is 19% in the first round and
76% in the second round. The estimated results are reported in Table 4 in a similar manner
as Table 3. The coefficient of procrastination is negative and significant in all the columns.
The estimated coefficient in column 1, i.e., -0.43, indicates that a standard deviation
increase in the procrastination index increases the probability that a student never takes
lesson by 11 percentage point, which is not negligible. Therefore, Tables 3 and 4 suggest
that students’ procrastination tendency hinders their first take-up and their subsequent
utilization of the program.
15
[INSERT TABLE 4 ABOUT HERE]
In contrast to consistently significant coefficient of procrastination, variables
representing impatience and present bias have weaker predictable power for program
utilization. These two variables are based on questions asking their preference in
monetary trade-off, and students in Grade 10 may not be accustomed to such monetary
trade-off of ¥2,000 (about $18) in their daily life. Instead, our procrastination variable,
which is based on a number of questions asking their general tendency in real life, has
stronger predictable power. The English in Primary School variable has unexpectedly
negative sign in both Tables. This indicates that students who started to be exposed to
English from their younger age are less likely to start and continue using the program
although such students are expected to have lower psychological barrier to communicate
with English interlocutors. Another notable point illustrated in these Tables is the
negative and significant coefficients of commuting time and sports club participation. It
seems that the utilization of time-consuming extra-curricular ICT lessons is constrained
by students’ available time. Particularly, participation in extra-curricular sport activity
appears to be an intervening factor.
IV. Impacts of Skype Program
Outcome Measures
We included two sets of outcome measures to evaluate the impacts of the Skype
program: Attitudes and English communicative abilities. To quantitatively measure any
changes in student attitudes toward English communication before and after the
16
intervention, we employed two motivational attributes, which have been found to
influence students’ second language development: International posture and Willingness
to communicate (WTC) (e.g., Yashima et al., 2004). First, the construct of International
posture was operationally defined as a composite of four sub-constructs: (1) Intercultural
orientation; (2) Interest in an international vocation; (3) Reactions to different customs,
values, or behaviors; and (4) Interest in foreign affairs. These sub-components and
corresponding items were adapted from those made available on the homepage of
Professor Tomoko Yashima, the researcher who first introduced this construct in the field
of applied linguistics (e.g., Yashima et al., 2004).5 Using all 22 items available (7 for
Sub-component 1, 6 for Sub-component 2, 5 for Sub-component 3, and 4 for Sub-
component 4), we further changed these into yes/no questions. We then computed a score
for each of the four sub-components of International posture and then computed total
scores, which ranged from 0 to 22, with higher score indicating a more internationally
oriented student. Although original version of the 22 questions were asked with a six-
point Likert scale, we simplified to yes/no questions in order to avoid causing excessive
fatigue to the students, who had to respond to many questions in our survey.
The second motivational variable (WTC) has also been found to have significant
and complex relationships with second language learner confidence, motivation, and
actual language use (e.g., MacIntyre, 2007). As in the case of International posture, we
took the eight items that measured WTC from the above-mentioned homepage because
they have been successfully used with Japanese high school students learning English as
a second language (e.g., Yashima, 2009).6 The questions asked whether the students
5 Retrieved on March 10, 2017 from: http://www2.ipcku.kansai-u.ac.jp/~yashima/data/kokusai.pdf 6 Retrieved on March 10, 2017 from: http://www2.ipcku.kansai-u.ac.jp/~yashima/data/wtc_scale.pdf
17
would communicate in English in hypothetical situations such as “group discussions on
an English course,” “giving a speech in public,” and “a chance meeting with a foreign
friend in the street.” A six-point Likert scale offered the following choices; always,
usually, sometimes, not very often, seldom, and never. We assigned 5 points to the answer
always, 4 to usually, 3 to sometimes, 2 to not very often, 1 to seldom, and 0 to never and
compute z-value of the total points.
To quantify the students’ English communicative ability, we use Versant and
GTEC test scores. As discussed in Section II, we collected data for the attitude measures
and Versant test scores both before and after our intervention in order to measure the
development of these variables. With regard to GTEC scores, we had only cross-sectional
data collected after the intervention.
Econometric Specification
To analyze the impacts of the Skype program, we applied two econometric specifications:
Value-added regression and Fix-effect regression. Let yijt be an outcome variable, which
can be attitude or English communicative ability, of student i in classroom j at the time t.
The Value-added specification is written as:
yijt = α + β Treatmentij + γ yijt-1 + εijt, (1)
where Treatmentij is a dummy variable taking the value of one for the treated student in
class j, yijt-1 is an outcome variable at t-1 (as we have only two time period, t-1 stands for
the baseline and t stands for the endline), and εijt is a standard error clustered at the
classroom level. β is our parameter of interest, which captures the intention-to-treat (ITT)

18
impacts of the program. In addition to the conventionally adopted Value-added
specification in analyzing academic performance, we also adopt a standard Fixed effect
model to control for unobserved time-invariant student-level heterogeneity, υi, with the
following specification;
yijt =α + β Treatmentij * Endlinet + δ Endlinet + υi + εijt. (2)
where Endlinet is a dummy variable taking the value of one if the data is collected in the
endline, i.e., after the intervention. υi is removed by estimating Equation (2) with Fixed-
effect specification. β is our parameter of interest, capturing the ITT program impacts
whereas δ captures changes in the outcome variable from the baseline to the endline,
which are mostly consequences of regular school curriculum as well as other changes that
are commonly occurred to all students.
Next, to analyze the differential impacts of the Skype program by level of its
utilization, we use an instrumental approach to estimate local average treatment effect
(LATE) (Imbens and Angrist, 1994). Specifically, we replace Treatmentij in Equations
(1) and (2) with Lessonski, which takes the value of one if student i took at least k lessons
during the intervention period. We use Treatmentij as an instrument for Lessonski to
estimate the program impact for students in compliance by changing the threshold number
of lessons. As the assignment of the treatment was random, Treatmentij works as a valid
instrument.
Estimation Results
Panel A of Table 5 shows ITT estimates of program impacts on students’ attitudes. Odd-

19
numbered columns report estimated results of Equation (1) whereas even-numbered
columns report those of Equation (2). Although not significant, column 1 and 2 show
positive coefficients of the Treatment on the total international posture score. In the Fixed
effect estimation in column 2, coefficient of the Endline is negative, indicating that
overall international posture score tended to decline from the baseline survey in June 2015
to endline survey in December in the same year. This is likely because that students
became more oriented toward university entrance exams and lost interest in international
communication as their school curriculum shifted toward preparation for entrance exams.
The coefficient of the Treatment is 0.47 whereas the coefficient of the Endline is -0.46
(not significant but p-values is close to 0.1), suggesting that the Skype program helped
mitigating the reduction in international posture score.
[INSERT TABLE 5 ABOUT HERE]
When we take a closer look at sub-constructs of the total score, this is more evident
in Sub-component 2 (interest in international vocation) reported in columns 5 and 6. The
coefficient of the Treatment is 0.26 whereas the coefficient of the Endline is -0.20, both
of which are statistically significant, indicating that students generally became less
interested in international vocation after they spend half a year in Grade 10 but the Skype
program helped retain their interest in international vocation. In addition, columns 9 and
10 suggest that the program helped students to have their interest in foreign affairs. Taken
together, we can claim with some confidence that communication with the English-
speaking Filipino teachers via online lessons positively altered student attitudes despite
the low level of program take-up.

20
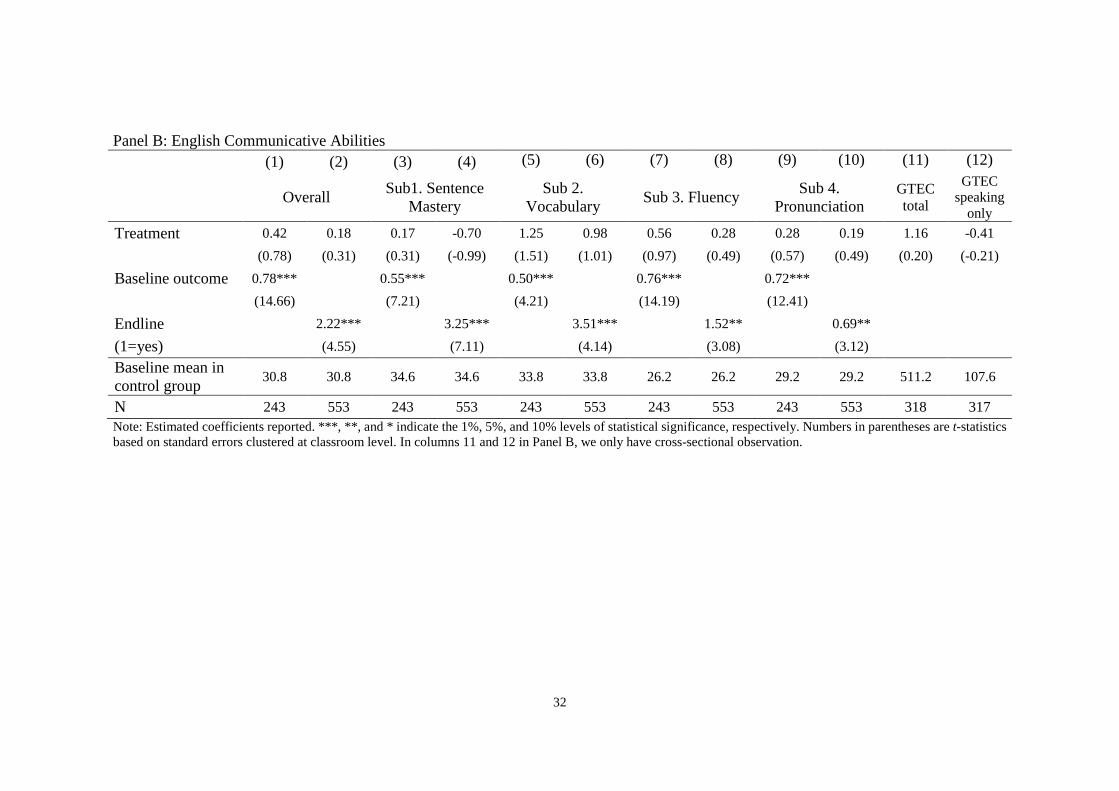
Panel B of Table 5 shows ITT estimates of program impacts on students’ English
communicative abilities. Despite the suggestive evidence of changes in students’ attitudes,
we do not find any significant changes in their English communicative abilities. However,
attitudinal attributes have been reported to lead to eventual improvement in their second
language (e.g., Sasaki, 2011; Yashima et al., 2004), and significant impacts of the Skype
program may appear in a longer-term. Unfortunately, due to the experimental designs to
guarantee equality, all the sample students received the same length of Skype intervention
by the end of May 2016, and thus, we do not have variations to evaluate such longer-term
impacts. Another important point to note from Panel B is the significant coefficient of the
Endline dummy in odd-numbered columns. As scores of the standardized Versant test are
comparable over time, the positive and significant coefficients suggest that students’
communicative abilities increased from June to December, most likely due to their regular
English curriculums. In columns 11 and 12, we report the results of GTEC exams. Since
we only have scores of November 2015, these are results of cross-sectional regressions
by regressing GTEC scores on the Treatment dummy with standard errors clustered at the
classroom level. Same as the Versant scores, the coefficients are not significant with p-
value close to zero, and thus, the program does not improve students’ scores on GTEC
exam.
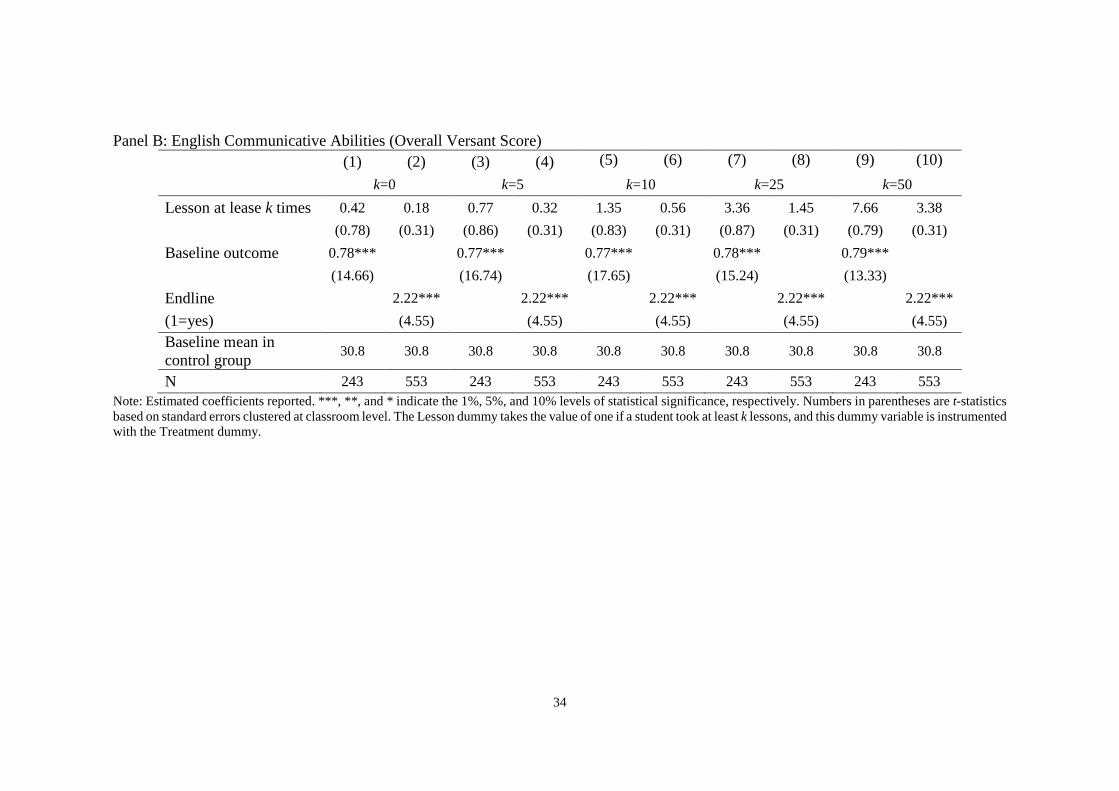
Next, we report LATE estimates of program impacts in Table 6. Columns 1 and
2 correspond to columns 1 and 2 in Table 5 as a benchmark. When we set k=0, the Lesson
dummy becomes equivalent to the Treatment dummy. In columns 3 and 4, where k=5,
the Lesson dummy takes the value of one if a student took at least five lessons in the
intervention period, and thus, the coefficient captures the impacts of the Skype program
for students who completed at least five lessons. As expected, the size of coefficient
21
becomes larger as k increases, indicating that students who took more lessons benefited
more from the program. The coefficient is significant is columns 3, 5, and 7. In column
7, for instance, students who took at least 25 lessons gained on average 3.90 points in
their total international posture score. The size of coefficient is large compared to the
baseline mean reported at the bottom of Tables. Therefore, the program has a potential to
dramatically change students’ attitudes if used continuously. In Panel B, although
coefficients are not statistically significant, the size of the coefficient increases as k
increases. This also support our argument that students who can regularly use the program
may largely benefit from the program.
[INSERT TABLE 6 ABOUT HERE]
V. Conclusion
We conducted a unique field experiment in collaboration with a Japanese high school to
provide students with an ICT-assisted program for English. Through the examination of
program usage records and panel data collected before and after the experiment, we
analyze factors associated with the program utilization and estimate the program impacts.
With ITT specification, we found that the program significantly changed attitudes of the
treated students but not their English communicative abilities. We could justifiably
speculate that the insignificant improvement in English communication was due to the
low take-up rate of the targeted program. In fact, we find suggestive evidence that
students who regularly utilized the program largely benefited from it, using LATE
specification. Hence, it is important to consider how to encourage students to use ICT-
assisted programs including the one under this study. To the extent that we find students

22
showing a tendency to procrastinate were less likely to start and continue using the
program, it is particularly important to consider how to motivate such students to use ICT-
assisted programs.
Together with the overall results showing that the participating students
significantly improved in their attitudinal attributes, which can have a positive impact on
their English development on a long-term basis, the findings of the study have important
implications for English education in Japan. The findings also suggest the direction in
which future research should be directed since the problem remains of how to motivate
and maintain use of ITC-assisted programs offered outside of regular English classes.
23
References
Bulman, G., Fairlie, R.W. 2016. “Technology and Education: Computers, Software, and
the Internet,” in Hanushek, E.A., Machin, S.J., and Woessmann, L. (eds.)
Handbook of the Economics of Education, Volume 5, 239-280. Amsterdam:
Elsevier.
Butler, Y.G., Iino, M. 2005. “Current Japanese Reforms in English Language Education:
The 2003 Action Plans.” Language Policy, 4, 25-45.
Carrillo, P., Onofa, M., Ponce, J. 2010. “Information Technology and Student
Achievement: Evidence from a Randomized Experiment in Ecuador,” Inter-
American Development Bank Working Paper.
DiMaggio, P. 1982. “Cultural Capital and School Success: The Impact of Status Culture
Participation on the Grades of US High School Students,” American Sociological
Review, 47(2), 189-201.
Frederick, S., Loewenstein, G., O'Donoghue, T., 2002. “Time Discounting and Time
Preference: A Critical Review,” Journal of Economic Literature, 40(2), 351-401.
Gee, J.P., Hayes, E.R. 2011. Language and Learning in the Digital Age. London:
Routledge.
Honda,Y., Nishijima, H. 2007. “Toritsu koukouseino seikatsu koudou ishiki nikansuru
ankeeto” [Survey of Lifestyles, Behaviors, and Attitudes of High-schoolers in
Tokyo]. Retrieved on March 10, 2017 from:
http://berd.benesse.jp/berd/center/open/report/toritsu_kousei/2009/pdf/siryou_01.
Imbens, G., Angrist, J., 1994. “Identification and Estimation of Local Average Treatment
Effects,” Econometrica, 62(2), 467-476.
24
Kono, H., Sawada, Y., Shonchoy, A.S. 2016. “DVD-based Distance-learning Program
for University Entrance Exams: Experimental Evidence from Rural Bangladesh,”
CIRJE Discussion Papers.
Laibson, D. 1997. “Hyperbolic Discounting and Golden Eggs.” Quarterly Journal of
Economics, 112(2), 443-477.
Lareau, A. 1987. “Social Class Differences in Family-school Relationships: The
Importance of Cultural Capital,” Sociology of Education, 60(2), 73-85.
Lai, F., Zhang, L., Qu, Q., Hu, X., Shi, Y., Boswell, M., Rozelle, S. 2013. “Computer
Assisted Learning as Extracurricular Tutor? Evidence from a Randomized
Experiment in Rural Boarding Schools in Shaanxi,” Journal of Development
Effectiveness, 5(2), 208-231.
Levy, M. 2009. “Technologies in Use for Second Language Learning.” Modern
Language Journal, 93(s1), 769-782.
MacIntyre, P.D. 2007. “Willingness to Communicate in the Second Language:
Understanding the Decision to Speak as a Volitional Process.” Modern Language
Journal, 91(4), 564-576.
MEXT. 2015. “Heisei 26 nendo eigokyouiku kaizen notameno eigoryokuchousa
jigyouhoukoku” [Results of the English Test Conducted to Improve English
Education in Japan in 2015]. Retrieved on November 23rd, 2016 from:
http://www.mext.go.jp/a_menu/kokusai/gaikokugo/1358258.htm
Nakamuro, M., Kayaba, Y. 2016. “Studying Alone or Together: How Do the Incentives
Make Students More Productive?” RIETI Discussion Paper Series, 16-J-028.
O’Donoghue, T., Rabin, M. 1999. “Incentives for Procrastinators.” Quarterly Journal of
Economics, 114(3), 769-816.

25
Onji, K. 2013. “Estimating the Effects of Procrastination on Performance: A Small
Sample Study,” Journal of Socio-Economics, 44(1), 85-90.
Onji, K., Kikuchi, R. 2011. “Procrastination, Prompts, and Preferences: Evidence from
Daily Records of Self-directed Learning Activities,” Journal of Socio-Economics,
40(6), 929-941.
Ortega, L., Iberri-Shea, G. 2005. “Longitudinal Research in Second Language
Acquisition: Recent Trends and Future Direction,” Annual Review of Applied
Linguistics, 25, 26-45.
Osaka University. 2013. “Kurashino konomito manzokudo nitsuiteno ankeeto” [Survey
of Preference Parameters at Osaka University]. Retrieved on March 10, 2017 from:
http://www.iser.osaka-
u.ac.jp/survey_data/doc/japan/questionnaire/japanese/2013QuestionnaireJAPAN.pdf
Pearson Inc. 2008. “Consistency of Versant English Test Scores Over Multiple
Administrators.” Unpublished internal manuscript, Pearson Inc.
Rouse, C.E., Krueger, A.B. 2004. “Putting Computerized Instruction to the Test: A
Randomized Evaluation of a ‘Scientifically-Based’ Reading Program,” Economics
of Education Review, 23(4), 323-338.
Sasaki, M. 2011. “Effects of Varying Lengths of Study-Abroad Experiences on Japanese
EFL Students’ L2 Writing Ability and Motivation: A Longitudinal Study,” TESOL
Quarterly, 45(1), 81-105.
Yashima, T. 2009. “International Posture and the Ideal L2 Self in the Japanese EFL
Context.” In Dörnyei, Z. and Ushioda, E. (eds.) Motivation, Language Identity, and
the L2 Self (pp. 144-163). Clevedon: Multilingual Matters.
26
Yashima, T., Zenuk-Nshide, L., Shimizu, K. 2004. “The Influence of Attitudes and Affect
on Willingness to Communicate and Second Language Communication.”
Language Learning, 54, 119-152.
27
Table 1. Timeline
2015 June Baseline survey and Versant test
2015 July-November Online English program for the treatment group
2015 November GTEC English test
2015 December Endline survey and Versant test
2016 January-May Online English program for the control group

28
Table 2. Balance Check Treatment Control Difference
(mean) (mean) p-value for
equality in means
Procrastination (z-score) -0.03 0.03 0.62
Impatiencea 0.5 0.7 0.12
Present bias (1=yes) 0.18 0.19 0.80
Male (1=yes) 0.51 0.50 0.96
Number of books at homeb 2.7 2.3 0.06*
Father’s educationc 3.3 3.2 0.51
Mother’s educationc 2.8 2.8 0.99
English in primary schoold 1.2 1.2 0.41
Been abroad (1=yes) 0.38 0.36 0.70
Own room (1=yes) 0.88 0.83 0.22
Own smartphone (1=yes) 0.96 0.96 0.99
Own PC (1=yes) 0.08 0.12 0.19
Own tablet (1=yes) 0.23 0.16 0.11
Commuting timee 1.2 1.3 0.40
Belongs to sports club (1=yes) 0.63 0.55 0.15
Note: * indicates a 10% level of statistical significance. a. One month discount rate; 0=less than 25%, 1=25-50%, 2=50-75%, 3=over 75%. b. Number of books at home; 0=none, 1=approx. 20, 2=approx. 50, 3=approx. 100, 4=approx. 200. 5=over 300. c. Educational attainment; 0=junior high school, 1=high school, 2=vocational school, 3=two-year college, 4=university, 5=graduate school. d. Started English in primary school; 0=grade 5 or later, 1=grade 3 or 4, 2=grade 1 or 2. e. Commuting time in minutes; 0=20 or less, 1=21-40, 2=41-60, 3=over 61.
29
Table 3. Poisson Model Estimation of Program Utilization
(1) (2) (3) (4) (5) (6) Number of lessons taken in five months All classes Treated classes only Control classes only
Procrastination -0.42*** -0.43*** -0.39** -0.39** -0.83*** -0.84***
[z-score] (-3.87) (-4.08) (-2.16) (-2.14) (-5.75) (-6.36)
Impatience -0.058 -0.086 -0.14 -0.22 0.079 0.12
[0-3] (-0.58) (-0.81) (-0.97) (-1.42) (0.48) (0.84)
Present bias 0.30 0.32 0.46 0.49 0.19 0.21
(1=yes) (0.80) (0.83) (0.97) (0.98) (0.42) (0.34)
Male -0.28 -0.34 -0.23 -0.28 -0.82 -0.74
(1=yes) (-1.03) (-1.16) (-0.64) (-0.73) (-1.11) (-1.03)
English in primary -0.14 -0.12 0.014 0.057 -0.69*** -0.78**
[0-2] (-0.96) (-0.75) (0.14) (0.58) (-2.74) (-2.29)
Been abroad 0.079 0.033 0.11* 0.034 0.18 0.27
(1=yes) (0.43) (0.19) (1.83) (0.58) (0.25) (0.36)
Own room -0.29 -0.30 -0.34 -0.29 -0.52 -0.94
(1=yes) (-0.84) (-0.92) (-0.70) (-0.62) (-0.45) (-0.74)
Own PC -0.16 -0.15 0.33*** 0.26 -2.52*** -2.30***
(1=yes) (-0.47) (-0.48) (4.15) (1.46) (-3.22) (-3.30)
Own smartphone -0.91* -0.99** -1.29** -1.22** 0.95 0.80
(1=yes) (-1.89) (-2.19) (-2.37) (-2.08) (0.44) (0.37)
Own tablet 0.25 0.19 0.062 0.0023 1.26** 1.23*
(1=yes) (0.94) (0.70) (0.37) (0.01) (2.48) (1.91)
Commuting time -0.075 -0.066 -0.0067 0.035 -0.44*** -0.49***
[1-4] (-0.71) (-0.66) (-0.05) (0.31) (-3.71) (-3.91)
Sports club -0.38** -0.28* -0.19 -0.10 -1.29*** -1.29***
(1=yes) (-2.07) (-1.72) (-1.22) (-0.60) (-3.22) (-3.42)
Number of books 0.0016 -0.025 -0.028 -0.056 0.17 0.089
[1-6] (0.02) (-0.34) (-0.35) (-0.79) (1.47) (0.69)
First round class 1.39***
(1=yes) (4.13)
Classroom dummies N Y N Y N Y
N 305 305 152 152 153 153 Note: Estimated coefficients reported. ***, **, and * indicate the 1%, 5%, and 10% levels of statistical significance, respectively. Numbers in parentheses are t-statistics based on standard errors clustered at classroom level.

30
Table 4. Probit Model Estimation of First Program Take-up
(1) (2) (3) (4) (5) (6) = 1 if completed at least one lesson in five months All classes Treated classes only Control classes only
Procrastination -0.43*** -0.44*** -0.53** -0.53** -0.44*** -0.44*** [z-score] (-4.70) (-4.66) (-1.97) (-2.21) (-2.76) (-2.68) Impatience 0.19*** 0.17* 0.14 0.098 0.19* 0.20* [0-3] (2.65) (1.72) (1.20) (0.36) (1.83) (1.83) Present bias 0.036 0.088 -0.045 0.13 0.018 0.00037 (1=yes) (0.16) (0.35) (-0.11) (0.29) (0.05) (0.00) Male -0.61** -0.60** -0.81** -0.62*** -0.60* -0.60* (1=yes) (-2.46) (-2.35) (-2.53) (-2.59) (-1.66) (-1.65) English in primary -0.30*** -0.31*** -0.20** -0.082 -0.39*** -0.42*** [0-2] (-5.14) (-3.98) (-2.13) (-0.42) (-5.16) (-5.02) Been abroad -0.24 -0.27 -0.72 -0.72 -0.058 -0.072 (1=yes) (-0.99) (-1.03) (-1.45) (-1.50) (-0.17) (-0.20) Own room -0.35 -0.45 -1.54*** -1.89*** -0.025 -0.12 (1=yes) (-1.19) (-1.50) (-4.85) (-4.28) (-0.05) (-0.28) Own PC -0.52* -0.62* -0.53** -0.87*** -0.50 -0.49 (1=yes) (-1.93) (-1.79) (-2.23) (-2.59) (-0.79) (-0.76) Own smartphone 0.37 0.54 0 0 0.23 0.22 (1=yes) (0.75) (0.88) (.) (.) (0.25) (0.24) Own tablet 0.25 0.24 0.80 0.89 -0.059 -0.057 (1=yes) (1.33) (1.30) (1.47) (1.60) (-0.36) (-0.31) Commuting time -0.12 -0.035 -0.11 0.18 -0.14 -0.15 [1-4] (-1.26) (-0.38) (-0.60) (1.62) (-1.12) (-1.26) Sports club -0.53*** -0.52*** -0.73*** -0.85** -0.50*** -0.51*** (1=yes) (-7.39) (-6.12) (-2.63) (-2.04) (-4.41) (-4.57) Number of books 0.16** 0.15* 0.31*** 0.36*** 0.026 0.0049 [1-6] (2.08) (1.73) (5.42) (9.01) (0.25) (0.05) First round class 1.94*** (1=yes) (6.55) Classroom dummies N Y N Y N Y N 305 305 152 152 153 153
Note: Estimated coefficients reported. ***, **, and * indicate the 1%, 5%, and 10% levels of statistical significance, respectively. Numbers in parentheses are t-statistics based on standard errors clustered at classroom level.

31
Table 5. Impacts of Skype Program (ITT Estimation)
Panel A: Attitudes (1) (2) (3) (4) (5) (6) (7) (8) (9) (10) (11) (12)
Total Sub1. Inter- cultural orientation
Sub 2. International
vocation
Sub 3. Different customs
Sub 4. Foreign affairs
Willingness to communicate
Treatment 0.57 0.47 0.028 -0.020 0.28*** 0.26* 0.013 -0.011 0.30* 0.23* 0.14 0.077 (1.50) (1.27) (0.15) (-0.11) (4.66) (2.27) (0.09) (-0.08) (2.28) (2.29) (1.84) (0.77)
Baseline outcome 0.78*** 0.69*** 0.72*** 0.42*** 0.58*** 0.65*** (15.23) (12.32) (22.65) (10.12) (8.17) (9.93)
Endline -0.46 -0.23 -0.20** -0.015 -0.0086 -0.24**
(1=yes) (-1.58) (-1.37) (-2.43) (-0.13) (-0.51) (-3.44) Baseline mean in control group
11.3 11.3 4.1 4.1 3.2 3.2 2.4 2.4 1.8 1.8 -0.07 -0.07
N 308 627 309 628 309 628 308 627 309 628 293 610
32
Panel B: English Communicative Abilities (1) (2) (3) (4) (5) (6) (7) (8) (9) (10) (11) (12)
Overall Sub1. Sentence Mastery
Sub 2. Vocabulary
Sub 3. Fluency Sub 4.
Pronunciation GTEC total
GTEC speaking
only Treatment 0.42 0.18 0.17 -0.70 1.25 0.98 0.56 0.28 0.28 0.19 1.16 -0.41 (0.78) (0.31) (0.31) (-0.99) (1.51) (1.01) (0.97) (0.49) (0.57) (0.49) (0.20) (-0.21) Baseline outcome 0.78*** 0.55*** 0.50*** 0.76*** 0.72*** (14.66) (7.21) (4.21) (14.19) (12.41)
Endline 2.22*** 3.25*** 3.51*** 1.52** 0.69** (1=yes) (4.55) (7.11) (4.14) (3.08) (3.12) Baseline mean in control group
30.8 30.8 34.6 34.6 33.8 33.8 26.2 26.2 29.2 29.2 511.2 107.6
N 243 553 243 553 243 553 243 553 243 553 318 317 Note: Estimated coefficients reported. ***, **, and * indicate the 1%, 5%, and 10% levels of statistical significance, respectively. Numbers in parentheses are t-statistics based on standard errors clustered at classroom level. In columns 11 and 12 in Panel B, we only have cross-sectional observation.

33
Table 6. Impacts of Skype Program (LATE Estimation)
Panel A: Attitudes (Total international Posture Score) (1) (2) (3) (4) (5) (6) (7) (8) (9) (10) k=0 k=5 k=10 k=25 k=50
Lesson at lease k times 0.57 0.47 1.10* 0.92 1.74* 1.45 3.90* 3.30 9.53 8.07 (1.50) (1.27) (1.74) (1.37) (1.79) (1.40) (1.70) (1.34) (1.42) (1.13) Baseline outcome 0.78*** 0.78*** 0.77*** 0.80*** 0.80*** (15.23) (15.80) (16.07) (19.09) (19.42) Endline -0.46 -0.46 -0.46 -0.46 -0.46 (1=yes) (-1.58) (-1.58) (-1.58) (-1.58) (-1.58) Baseline mean in control group
11.3 11.3 11.3 11.3 11.3 11.3 11.3 11.3 11.3 11.3
N 308 627 308 627 308 627 308 627 308 627
34
Panel B: English Communicative Abilities (Overall Versant Score) (1) (2) (3) (4) (5) (6) (7) (8) (9) (10)
k=0 k=5 k=10 k=25 k=50
Lesson at lease k times 0.42 0.18 0.77 0.32 1.35 0.56 3.36 1.45 7.66 3.38 (0.78) (0.31) (0.86) (0.31) (0.83) (0.31) (0.87) (0.31) (0.79) (0.31) Baseline outcome 0.78*** 0.77*** 0.77*** 0.78*** 0.79*** (14.66) (16.74) (17.65) (15.24) (13.33)
Endline 2.22*** 2.22*** 2.22*** 2.22*** 2.22*** (1=yes) (4.55) (4.55) (4.55) (4.55) (4.55) Baseline mean in control group
30.8 30.8 30.8 30.8 30.8 30.8 30.8 30.8 30.8 30.8
N 243 553 243 553 243 553 243 553 243 553 Note: Estimated coefficients reported. ***, **, and * indicate the 1%, 5%, and 10% levels of statistical significance, respectively. Numbers in parentheses are t-statistics based on standard errors clustered at classroom level. The Lesson dummy takes the value of one if a student took at least k lessons, and this dummy variable is instrumented with the Treatment dummy.
35
Figure 1. Randomization

36
Figure 2. Daily Change in Number of Students Taking Lessons
37
Figure 3. Distribution of Lessons Taken by a Student over Five Months
Panel A: Treatment Group (July-November, 2015)
Panel B: Control Group (January-May, 2016)