impacts of climate change on historical locust outbreaks ... · impacts of climate change on...
TRANSCRIPT

Impacts of climate change on historical locust outbreaks in China
Ge Yu,1 Huadong Shen,1 and Jian Liu1
Received 31 January 2009; revised 16 April 2009; accepted 4 June 2009; published 17 September 2009.
[1] To probe if greenhouse-effected climate warming strengthens severe locust outbreaksthat would cause continental-scale crop failures in China, we studied their statisticalrelationships in history and examined the impacts of climate change on the long-termlocust outbreaks. According to analysis for interannual time series during the past100 years, the most severe locust outbreak years were in the warm-dry years withwarm-dry summers and warm-wet winters in the Yellow River–Haihe River region,northern China, and warm-wet years with warm-wet springs in the Yangtze River–HuiheRiver region, southern China. Checking wavelet-analyzed variance series, theseinterannual time scale synchronous changes with 2–10 periodicity years were 58–60%among the total locust outbreak years of the past 1000 years. Locust outbreak correlationanalysis with decadal time scale temperature proxy and general circulation model–simulated climate during the past 1000 years showed significant correlations inwarm-winter-half years and in warm-dry May–June and annual means in the northernregion (p < 0.05), where p is probability, and in warm years and warm-dry August–September years in the southern region (p < 0.10), while these decadal time scalesynchronous changes with 20–110 periodicity years were 56–65% of the total locustoutbreak years of the past 1000 years. Historical records on ‘‘drought locust’’ were true, aswe found that the drought of spring-summer season in the northern region caused thehighest regional locust outbreaks, but it is not a sensitive factor for locust outbreaks in thewet-humid Yangtze River region. Although warm winter condition is a key factor forlocust egg survival and preservation, it works well when winter temperatures reachto �10� to �30�C in the northern region but is not a limiting factor for locust survival inthe warm southern region. We found that both interannual and decadal variability ofhigher temperature changes have led to the highest locust outbreaks in the past 1000 years,so as to suggest that greenhouse-effected climate warming would increase the severelocust outbreaks in the area.
Citation: Yu, G., H. Shen, and J. Liu (2009), Impacts of climate change on historical locust outbreaks in China, J. Geophys. Res., 114,
D18104, doi:10.1029/2009JD011833.
1. Introduction
[2] The locust is one of the most serious pests that feedupon crops, eating and gnawing the leaves and stems ofmainly Gramineae plants, one major family of popularChinese foods of cereal, wheat, corn, and rice. High-densitylocusts often occur in summer and autumn in eastern China;for example, one locust outbreak in summer-autumn of1998 had a maximum density of 10,000 locust/m2 andcovered areas of 200 km2 in Hebei Province, 300 km2 inHenan Province [Ren and Tang, 2003], and 450 km2 inShangdong Province [Zhang et al., 2006]. The locust out-breaks in Chinese history have greatly decreased cropoutput, causing serious food shortage and famines; thereforegreat attention has been paid in history and detailed recordscan be found in much historical literature. The earliest
record can be found in The Book of Songs, a book alreadyin circulation in East-Zhou Dynasty (770–476 B.C.), whichhas introduced methods of burning bonfire to lure locusts totheir death and burning grass to destroy their eggs on farmlands [Ni, 1998]. Emperor of Fu Jian (338–385 A.D.) sentthousands of his soldiers to assist locals to erase locusts inYellow River regions in 382 A.D., which was recorded inHistory as a Mirror (published during 1019–1086 A.D.),the first historical annals in China. As locust outbreakscaused serious food shortage and threatened the stabilizationof political power, likely ‘‘long years of locust outbreakscaused the peasant uprising and the destruction of West-Han Dynasty’’ (recorded in History of East-Han Dynasty,a book published circa 25–220 A.D) [Ni, 1998], the firstlaw of locust control in China was issued in 1075 A.D. andthe second in 1182 A.D. by emperors of North-SongDynasty (960–1127 A.D.) [Wu, 1951]. There have beenspecial books describing the locust ecology and controlmethods, for example, Methods of Locust Capture issued in1193 A.D. and Complete Methods of Locust Control pub-lished in 1857 A.D. [Zheng, 1990]. On the basis of the
JOURNAL OF GEOPHYSICAL RESEARCH, VOL. 114, D18104, doi:10.1029/2009JD011833, 2009ClickHere
for
FullArticle
1Nanjing Institute of Geography and Limnology, Chinese Academy ofSciences, Nanjing, China.
Copyright 2009 by the American Geophysical Union.0148-0227/09/2009JD011833$09.00
D18104 1 of 11
historical records, there were 796 disastrous locust out-breaks between 707 B.C. and 1935 A.D. [Chen, 1935],during which smaller locust outbreaks occurred once every2–3 years and severe outbreaks every 7–8 years [Wu et al.,1990].[3] Attention has been paid to causes of locust outbreaks
since 2000 years ago. Lu [1986] has counted the times ofhistorical locust outbreak records with climate causes, froma photocopy of The 25 Dynastic Histories of China [1935].He found that there were 58 records related to temperaturechange and 14 records related to precipitation change in a totalof 261 locust outbreak records since 841 B.C.; particularly,many records directly named the pest as ‘‘drought locust’’ or‘‘drought locust calamity.’’ The historical records revealthat the locust outbreak years often occurred in a warmspring year and/or a year after a warm winter, for example,‘‘A winter season with spring temperature will lead to apotential locust outbreak, and a spring season with summertemperature will cause a locust disaster’’ (recorded in TheBook of Rites, circulation circa 770–476 B.C.) [Ma, 1958],and ‘‘locust eggs would die out in a heavy snow winter’’recorded in Complete Collection of Pictures and Books ofOld and New Times (1650–1741 A.D.) [Zheng, 1990].Modern biology can provide a scientific basis to explainthe phenomenon. The minimum temperature for locustovum growth is 16�C, but adult insects can tolerate up to45�C [Wu et al., 1990], suggesting the pests are warm-temperature-loving species. Locust eggs can survive 15 daysunder �10�C but only 1 day under �25�C, and the adultinsect needs an effective growth degree day of 210 day��C[Wu et al., 1990], suggesting that the changes in winter andannual temperatures are both responsible for locust growth.[4] The locusts are mostly born and grow in floodplains,
lake overbanks, swamps, and coastal lowlands in easternChina. These places are dry lands during low water leveland little rainfall and are submerged during high water leveland heavy rainfall. ‘‘Lake drying makes locust multiply andoutbreak,’’ recorded in An Agricultural Encyclopedia ofMing Dynasty (1562–1633 A.D.), ‘‘changes to low waterlevels in ponds, lakes and rivers lead to locust growthgreatly,’’ recorded in Complete Methods of Locust Control,and ‘‘rainstorms in spring and summer could cause locustdying,’’ recorded in History of Song Dynasty (circa 960–1127 A.D.) have been recognized in Chinese history [Lu,1986]. The records reflected the facts that locust eggs aremultiplied in wet soil but not in a fully submerged place,and locust migration and dispersal need dry conditions, asrainfall restrains wing vibration and flight. Modern bioecol-ogy has proven that the best soil for laying its eggs is thesoil with water content of 10–20%, where locust eggs reachto 200,000–400,000 grain/m2 [Wu et al., 1990]. As a locustegg needs 5–10 days to develop, a continuous 15 days ofsubmergence in water can drown 100% of locust eggs [Wuet al., 1990]. Therefore, in terms of locust bioecology, thelake/river/coast lands above water level are favorable placesfor locusts to develop, while spring and summer dryconditions lead to locust outbreaks.[5] Studies on whether the locust outbreak variability is
consistent with climatic change have been undertaken inChina. Many studies indicated that, on the basis of therecords of the past 50 years, a warm winter year, i.e., higherJanuary temperature than average, a warm-summer-half
year, i.e., higher April–September temperatures than aver-age, and a dry-summer-half year, i.e., lower April–Augustprecipitation than average, normally lead to locust outbreaksin eastern China [Ma, 1958; Zhang and Chen, 1998; Konget al., 2003; Ren and Tang, 2003; Wang et al., 2006; Zhanget al., 2006]. Locust outbreaks with relationship to pastclimate changes were studied by Lu [1986], Zheng [1990],and Zhang and Chen [1998], who found a basis for linkageof locust outbreaks with warm and drought climate inChinese history. Zhang and Chen [1998] have also revealedthat locust outbreaks in northeast China (latitude north to40�N) occurred in winter warm years during the middle ofthe 12th, 13th, and 18th centuries. In terms of the locustoutbreaks forced by decadal time scale climate, Stige et al.[2007] used a temperature proxy and a precipitation proxyto correlate the past 1000-year locust outbreak series. Theprecipitation proxy was reconstructed by tree ring records inthe western mountains of China, and the temperature was asynthesis for whole China as sourced from multiple lineevidence of ice cap records, lake level records, historicaldocuments, etc. [Yang et al., 2002]. Their study has attemp-ted to prove a hypothesis that locust outbreaks were in coldand wet years during the past 1000 years [Stige et al., 2007].[6] Regional studies in China, likely studies for regions
of provinces Liaoning, Hebei, Henan, Shandong, Anhui,and Jiangsu [e.g., Ma, 1958; Kong et al., 2003; Ren andTang, 2003; Wang et al., 2006; Zhang et al., 2006], were oninterannual time scale for the past 50 years, while Stige etal.’s [2007] study was on decadal time scale for the past1000 years. These two types of studies on different timescales have produced contradictory understanding of therelationships between climate character and locust out-breaks: the former believed the highest locust outbreakoccurred in a warm year, while the later related it to coldyears.[7] To do regional and seasonal analysis in both interan-
nual and decadal time scales would resolve the issues. Thisis based on two considerations of different regional climatesin northern and southern China.[8] 1. The relative variability of annual precipitation is
much higher in the northern region (25–50%) than in thesouthern region (15–30%) [Liu et al., 1998], and thevariability is much higher in summer (200 � �15%) thanin winter (70 � �50%) [Wang et al., 2000; Zhong et al.,2007]. Ma [1958], on the basis of 50-year climate gaugingdata, has found that the higher the precipitation variability,the more significant the locust outbreak. This discovery hasbeen proven by more studies later on [e.g., Wu et al., 1990].Thus responses of locust outbreaks to climate could bedifferent from region to region.[9] 2. Winter temperatures are mostly above the freezing
point in the southern region, but mostly below the point inthe northern region. Although locust eggs cannot survivebelow winter temperature of �20�C, there is little chance ofconsecutive occurrence of such a temperature for 5 days inthe southern region (latitudes between 35�N and 28�N).Seasonal temperature as a limiting condition of locustmultiplication would be different between the northernand southern regions.[10] In this paper, to understand the impacts of climate
change on occurrence of the important environmentalevents and to predict the severe locust outbreaks in an
D18104 YU ET AL.: HISTORICAL LOCUST OUTBREAKS IN CHINA
2 of 11
D18104

ultimate aim to avoid a continent-wide food shortage, weapplied both modern and historical records to analyze therelationships of locust outbreaks and climate changes inChina, in which severe locust hazards occur in two majorareas: the middle-lower reaches of the Yellow River andthe Yangtze River (Figure 1). Compared with the past1000-year locust index, we correlated climate data on twotime scales: (1) 150-year-long gauging climate on interan-nual time scale and (2) 1000-year-long reconstructingclimate on decadal time scale; as subsidiary data, simulationresults from a general circulation model (GCM) on bothinterannual and decadal time scales can support the climateproxy. Moreover, spectrum and wavelet analyses are used inthe present study in order to reveal relations of interannualand decadal time scales.
2. Data and Methods
2.1. Locust Data and Climate Data
[11] The major species of locust that often forms majoroutbreaks and causes serious regional crop failures in Chinais Locusta migratoria manilensis. The major area of locustoutbreaks is in eastern China (Figure 1). Because ofdifferent outbreak times and abundance, the area can bedivided into two regions of the middle-lower reaches of theYellow River (including Haihe River) and the middle-lowerreaches of the Yangtze River (including Huaihe River), inthe northern and southern regions of the eastern China,respectively (Figures 1a and 1b). Historical literature fromChina has recorded abundances and areas of the locust
outbreaks (integration in literature [Zhang, 2004]). A Chi-nese historian, S.-C. Ma, has delineated it as an annuallocust index based on the severity and affect area for easternChina [Ma, 1958]. He has separated the area into thenorthern region (the middle-lower reaches of the Yellowand Haihe rivers) and the southern region (the middle-lowerreaches of the Yangtze and Huaihe rivers) (two curves of theannual locust index in Figures 1c and 1d), and has com-bined the two into one of whole China.[12] Although most observations of temperature and/or
precipitation in China were started in 1950 A.D., somestations have gauging records longer than 100 years; BeijingStation is the earliest one, with gauging precipitationrecords started in 1841 A.D. Within the middle-lowerreaches of the Yellow River and Yangtze River in easternChina, there are 17 stations with both temperature andprecipitation records longer than 60 years [Climate DataSection, 1990; Wang, 1994] (see the locations in Figure 1).[13] Before the gauge records, the climate information
could be traced from historical documents, geologicalrecords (e.g., lacustrine sediment, stalagmites, and ice capdeposit), biological remains (e.g., sedimentary pollen andtree rings), and archeological evidence. These climateproxies have been obtained progressively during the past20 years in China, but most of them are qualitative andspatial data. For quantitative and time series data, we foundthat there are annual temperature records from the ice cap ofthe Tibetan Plateau [Thompson et al., 2000], tree ringreconstructed precipitation from the mountains in westernChina [Shao, 2004], a 10-year-interval temperature with the
Figure 1. Map of study areas and information for locust and climate data. (a) The middle-lower reachesof Yellow River (northern region) are marked by a light-blue area for the GCM grid boxes and blue dotsfor the climate gauging stations. (b) The middle-lower reaches of Yangtze River (southern region) aremarked by light pink for the GCM grid boxes and red pluses for the climate gauging stations. Annualindex of locust outbreaks during the past 1000 years for the (c) northern region and (d) southern region(digitized from Ma [1958]), in which coarse lines are 10-year mean series.
D18104 YU ET AL.: HISTORICAL LOCUST OUTBREAKS IN CHINA
3 of 11
D18104

data sources mostly derived from Tibetan and the westernmountains [Yang et al., 2002], and recently completedsynthesis of 10-year-interval temperatures for 10 regionsof China [Wang et al., 2007]. For eastern China, thephenological cold and warm events recorded in historicaldocuments have been used to reconstruct winter half-year(October to March) temperature in 10-year intervals since1500 A.D. and in 30-year intervals for the past 2000 years[Ge et al., 2003]. On the basis of Ge et al.’s data, continuousannual temperature series in a 10-year interval were ana-lyzed [Wang et al., 2007], in which stalagmite data fornorthern China and pollen data for southern China haveoffset the lacks in Ge et al.’s data. The winter half-yeartemperature and annual temperature cover the present studyarea and provide the quantitative and time series dataavailable for us.[14] Currently, monthly climate data of the past 1000 years
are hard to obtain from the proxies but can be provided bypaleoclimate modeling. A few of the past 1000 years ofclimate experiments have been performed by global atmo-sphere-ocean coupled GCMs, for example, HADCM3[Gordon et al., 2000] and ECHO-G [Legutke and Voss,1999]. These climate simulations were driven by 1000-yeartime-varying external forces including solar radiation, vol-canic eruptions, and greenhouse gas concentrations (CO2
and CH4) [Collins et al., 2002; von Storch et al., 2004],which can be used to examine basic features of the past1000 years of climate change. We understand that GCMresults would not be independent materials as climatebaseline. In the present study, we use the 1000-year GCMresults as subsidiary data to support the 1000-year climateproxy (because the climate proxy is 10-year-interval coarsedata, not available for interannual or for seasonal/monthly).Because the ECHO-G simulations have been validated byChinese gauging climate data [Liu et al., 2005; Yu et al.,2007], we know how far both robust and individual featuresof the simulations are in agreement with observed climatechanges; likely ECHO-G has well simulated climatechanges during the Little Ice Age (circa 1650–1850 A.D.)for eastern China. Thus we downscaled the ECHO-G girdeddata for the northern region and the southern region in thepresent study (see grid box in Figure 1).
2.2. Correlation Analysis With Bootstrapping Test andSpectrum Analysis
[15] Linear correlation was analyzed in each pair of theannual locust series and the climate series including monthly,seasonal (DJA for three winter months and June, July, andAugust (JJA) for three summer months), and annual meantemperature/precipitation in turn. We used departures (di)for the locust index, temperature, and precipitation at time i(xi) minus the means (xmean), i.e., di = xi � xmean. Thesignificant level was cut off by statistical confidence interval(CI). For gauging climate data, we checked the frequency ofregional correlation of individual sites, and also examinedthe regional correlation of multiple site means.[16] In order to examine both temperature (Ti) and
precipitation (Pi) related to locust outbreak years, we didmultiple linear regression (MLR)_on between locust timeseries (L) and the two climate variables, i.e., L = a1Ti +a2Pi + b (i is 1, 2, . . . 12 months), where a1 and a2 are towvariable’s slopes, which can indicate the variation directions
with the locust variability. The significant level was testedby F test.[17] In order to deduce uncertainties in the above para-
metric testing, we also use nonparametric testing. Bias-corrected percentile bootstrapping test (B test) [Efron andTibshirani, 1993] was applied in the present study. Corecodes of the bootstrapping programs were from Hesterberget al. [2005]. We did random resamples following theuniform distribution with sample size of N = 1000 for10-year series and N = 10,000 for 1-year series, andaccepted the significant correlations at the test level. Finalresults are overlapping parts of parametric testing (P) andnonparametric testing (NP), equivalent to the logical ANDoperation by using the function of minimum (P, NP).[18] To understand the locust-climate relations between
interannual time scale and decadal time scale, we didspectral analysis and wavelet analysis. Spectral estimationcan describe the distribution over frequency of the power-contained signal that can be buried in a noisy time domainover long periods. Here we used fast Fourier transforms(FFT) to exam the frequency components of signals in1000-year-long locust index and temperature series.[19] Computing the FFT at each time using only the data
within the window would solve the problem in frequencylocalization but would still be dependent on the windowsize used. Wavelet analysis has been attempted to solvethese problems by decomposing a time series into time/frequency space simultaneously [Torrence and Compo,1998]. We applied the wavelet analysis to find the variedperiods in the locust index series and temperature series.The wavelet analysis was computed on the basis of aprogram wavelet.m (C. Torrence and G. P. Compo, http://paos.colorado.edu/research/wavelets).[20] Moreover, the proxy temperature was reconstructed
from multiple lines of evidence, and it mixed more infor-mation. We use principal component analysis (PCA) totransform a number of possibly correlated variables into asmaller number of uncorrelated variables (i.e., principalcomponents). Since the first principal component accountsfor as much of the variability in the temperature data aspossible, we take the greatest variance of temperature tocorrelate with locust index, obtaining significant results.
3. Results
3.1. Past 100 Years
[21] In the northern region, results of each site correlationbetween locust index and monthly temperatures show thatthe higher frequencies of significant positive correlationsare in February, April–June, August–September, and JJA, inwhich frequency of negative correlation is void (Figure 2a).On the basis of the regional mean series from nine stationsof the northern region, the locust series has significantpositive correlations in February–April, July, December,January, and February (DJF), and annual mean (Figure 2c)temperatures (R = +0.26 � +0.36 with 95% CI and B testwith p < 0.05) and in December precipitation (R = +0.74with 95% CI and B test with p < 0.05). Temperatures fromindividual stations and the means reflect that the locustoutbreak was the highest in warm winter, spring-summeryears.
D18104 YU ET AL.: HISTORICAL LOCUST OUTBREAKS IN CHINA
4 of 11
D18104

[22] In the southern region, higher frequency of signifi-cant correlations occurred in April, June, and November–December, in which months there is not negative correlationat all (Figure 2b). This is consistent with correlations fromthe mean climate of eight stations, where significant tem-perature positive correlations occurred in March–May, andannual mean (Figure 2d) (R = +0.26 � +0.33 with 95% CIand B test with p < 0.05). Precipitation analyses show thatthere is no significant positive correlation but there is anegative correlation in January (R = �0.28 with 95% CIand B test with p < 0.05), suggesting that the highest locustoutbreak occurred in warm years with warm spring and dryJanuary in the southern region.[23] Significant multiple correlations (F test and B test
with p < 0.05) between locust index and two climatevariables (temperature and precipitation) were listed inTable 1. Results from the northern region show positiveslope temperatures but negative slope precipitations inMarch–April, July, September, JJA, and annual mean,and both positive slope temperature and precipitation inMay and DJF, suggesting that the highest locust outbreakoccurred in the warm and dry spring-summer years andwarm and wet winter years. This is a similar result to thesingle temperature correlations above but shows a combi-nation relationship between temperature and precipitation,i.e., significant correlations with spring-summer warm anddry years. In the southern region, temperatures and precip-itation in March–April, June, and annual mean have pos-
itive slope correlations with locust index, but January has anegative correlation.
3.2. Past 300 Years
[24] Correlations of the 10-year mean proxy annualtemperature with 10-year mean locust index (Figures 3aand 3b) show a significant positive correlation and pass theB test (p < 0.05) in the northern region (R = +0.60 with 95%CI) and the southern region (R = +0.34 with 90% CI).Correlations of locust index with proxy winter half-yeartemperatures show a significant positive correlation andpass the B test in the northern region (R = +0.49 with95% CI) and the southern region (R = +0.31 with 90% CI).[25] GCM-simulated 10-year mean temperature series
have significant positive correlations with the locust seriesin May–June, September–October, JJA, and annual mean(R = +0.47 � +0.64 with 95% CI and B test with p < 0.05)in the northern region (Figure 3c). When applying 90% CIcutoff, there are positive correlations (R = +0.38 � +0.46)in May, July, September, December, and annual mean(Figure 3d) in the southern region.[26] MLR analysis shows that the significant correlations
occur in May–July and annual mean (p < 0.05) in thenorthern region and in September and December (p < 0.10)in the southern region (Table 1). They have all positivesignificant slopes in temperatures but negative slopes inJune precipitation in the northern region and in Septemberand December precipitation in the southern region.
Figure 2. (a and b) Frequency of monthly temperature correlations and (c and d) comparisons ofregional means of annual temperature with locust index during the past 100 years in northern region(Figures 2a and 2c) and in southern region (Figures 2b and 2d). In legend, P-cor and N-cor are significantpositive and negative correlations at 95% confidence interval (CI), respectively, and No-cor is none ofsignificant correlation. Histograms of B resampling correlations between locust index and annualtemperature were plotted by correlation coefficients (x axis) versus the frequency (y axis) in Figures 2cand 2d.
D18104 YU ET AL.: HISTORICAL LOCUST OUTBREAKS IN CHINA
5 of 11
D18104

3.3. Past 1000 Years
[27] We did not find any significant correlations betweenlocust index and proxy temperature in the 10-year meanseries even at 90% CI level. When using proxy temperaturesfrom 10 regions of China to do the PCA, we found majorchanges of temperatures during the last 1000 years. Vari-ance sums of the first three PCs in both the northern andsouthern regions are greater than 80%, suggesting that wemay ignore �20% local impacts on the temperaturechanges. Correlations between the annual temperature var-iance and locust index show significant positive correlations(95% CI and B test with p < 0.05) in the northern region(R = +0.31) for the last 1000 years, and in the northern region(R = +0.43) and southern region (R = +0.32) for the periodsof years 1000–1500 A.D. (Figure 4). These results suggestthat decadal time scale locust outbreaks were closely linkedwith the temperature changes to warm years.[28] We did not find significant correlations of locust
indexwithGCM-simulatedmonthly temperature/precipitationin the 10-year mean series, whether monocorrelation ormultiple correlations. However, correlations between the10-year mean GCM temperature variance and 10-year mean
locust index show significant positive correlations in May(R = +0.242) in the northern region and in August (R =+0.243) in the southern region (95% CI and B test with p <0.05). Multiple correlations show similar results: that thesignificant warm-dry changes in May and annual mean inthe northern region (F test and B test with p < 0.05) werecorrelated with locust outbreak years (Table 1), while awarm-dry change in August and a warm-wet change inNovember in the southern region only passed test level p <0.10 by F test and B test.[29] Results of FFT analysis show that there are several
cycle years of locust series as the same as the proxytemperature series. Both cycle years above 95% CI nullcontinuum curves are 80, 40, 27, 22, and 21 years in thenorthern region (Figure 5a) and 107, 80, 49, 40, 30, and 20years in southern region (Figure 5b), reflecting that fre-quency of locust outbreaks has synchronous changes withthe temperature in decadal time scale cycles.[30] Examining the 10-year interval cycle years by wave-
let analysis (Figures 5c–5f), we found the significant cycleyears in two regions concentrated in 20 to 110-year perio-dicities, consistent with the FFT analysis. More specifically,wavelet analysis provided a way to test if the locustoutbreak cycles respond to climate change in timing.According to variance series at the 20–110 periodicityyears by wavelet computing, there are five periods thatare significantly matched (95% CI) between locust outbreakyears and temperature changes during 1210–1230, 1280–1310, 1470–1510, 1670–1760, and 1800–1850 A.D. in thenorthern region (gray areas in Figures 5c and 5e). Theseoverlapping periods are 240 years and take 56.2% of thetotal 427 years of locust outbreaks. For the southern region,there are four matched periods during 1040–1130, 1280–1330 and 1490–1520 and 1610–1630 A.D. (gray areas inFigures 5d and 5f). These matched periods are 230 years,totaling 64.6% of the total 356 years of locust outbreaks.[31] We further examined interannual relationships be-
tween locust index and GCM monthly temperatures duringthe past 1000 years. FFT and wavelet analyses show thatthere are significant periods (95% CI) at 2–8 years, at 12–16 years and at approximately 30 years that commonlyoccurred both in the locust series and annual temperatureseries (figures not shown). According to variance series atthe 2- to 10-year periodicity by the wavelet computing,there are eight matched periods with 10 successive yearsbetween locust series and temperature series, during 1444–1472, 1481–1493, 1505–1518, 1582–1592, 1684–1696,1809–1821, 1927–1939, and 1942–1953 A.D. (Figure 4c).These overlapping years are 252 years, totaling 59.7%locust outbreak years. In the southern region, nine matchedperiods with 10 successive years occurred during 1429–1440, 1444–1472, 1481–1493, 1505–1518, 1585–1592,1684–1696, 1809–1821, 1927–1939, and 1942–1956A.D. (Figure 4d). There are 205 matched years, totaling57.6% locust outbreak years.
4. Discussion and Summary
[32] There are 427 locust outbreak years in the total960 years (1000–1959 A.D.) in the northern region, and356 locust outbreak years in the total 954 years (1000–1953 A.D.) in the southern region. Because of differences of
Table 1. Significant Correlations Between Locust Index and
Monthly Climate Based on Gauging Observations From 1873–
1959 A.D. and General Circulation Model Simulations From 1700–
1950 and 1000–1950 A.D.a
Month R2 F ValueCriticalF Value
TemperatureSlope
PrecipitationSlope
Northern Region, 1904–1959, Annual Seriesb
3 0.119 3.571 3.162 (p < 0.05) 0.293 �0.054 0.143 4.407 0.419 �0.0225 0.149 4.629 0.468 0.0167 0.114 3.399 0.521 �0.0039 0.141 4.353 0.587 �0.008DJFc 0.131 3.988 0.305 0.186JJAd 0.112 3.359 0.515 �0.002Annual 0.109 3.231 0.481 �0.005
Southern Region, 1873–1953, Annual Series1 0.097 4.169 3.114 (p < 0.05) �0.161 �0.023 0.119 5.288 0.391 0.0064 0.09 3.877 0.365 0.0026 0.107 4.661 0.367 0.006Annual 0.098 4.219 0.713 0.019
Northern Region, 1700–1950, 10-Year Mean Series5 0.261 4.062 3.422 (p < 0.05) 0.986 0.4746 0.262 4.083 0.984 �0.4237 0.36 6.462 1.163 0.493Annual 0.26 4.039 1.283 0.058
Southern Region, 1700–1950, 10-Year Mean Series9 0.191 2.719 2.549 (p < 0.10) 0.711 �0.58312 0.215 3.157 0.739 �0.747
Northern Region, 1000–1950, 10-Year Mean Series5 0.070 3.484 3.09 (p < 0.10) 0.168 �0.108Annual 0.064 3.191 0.836 �6.144
Southern Region, 1000–1950, 10-Year Mean Series8 0.069 3.422 3.09 (p < 0.10) 0.574 �0.36811 0.071 3.553 0.489 0.156
aThe results are also passed by bootstrapping test.bRegion, period, and series.cDecember, January, and February.dJune, July, and August.
D18104 YU ET AL.: HISTORICAL LOCUST OUTBREAKS IN CHINA
6 of 11
D18104
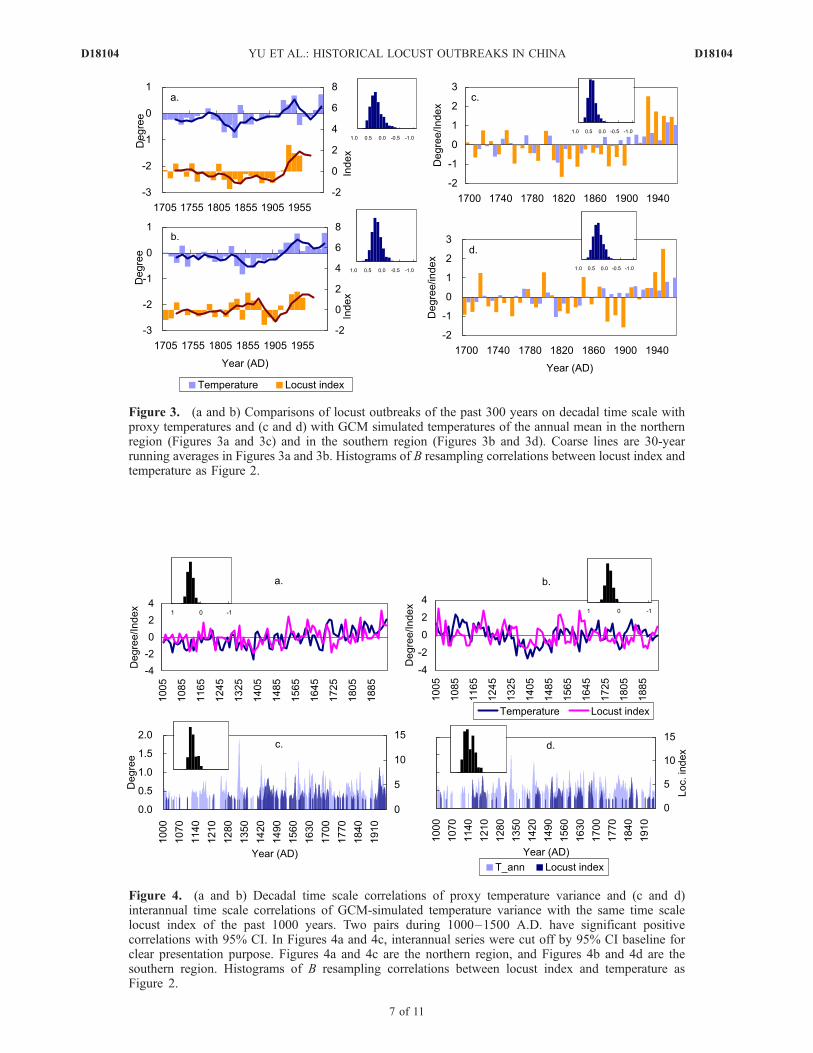
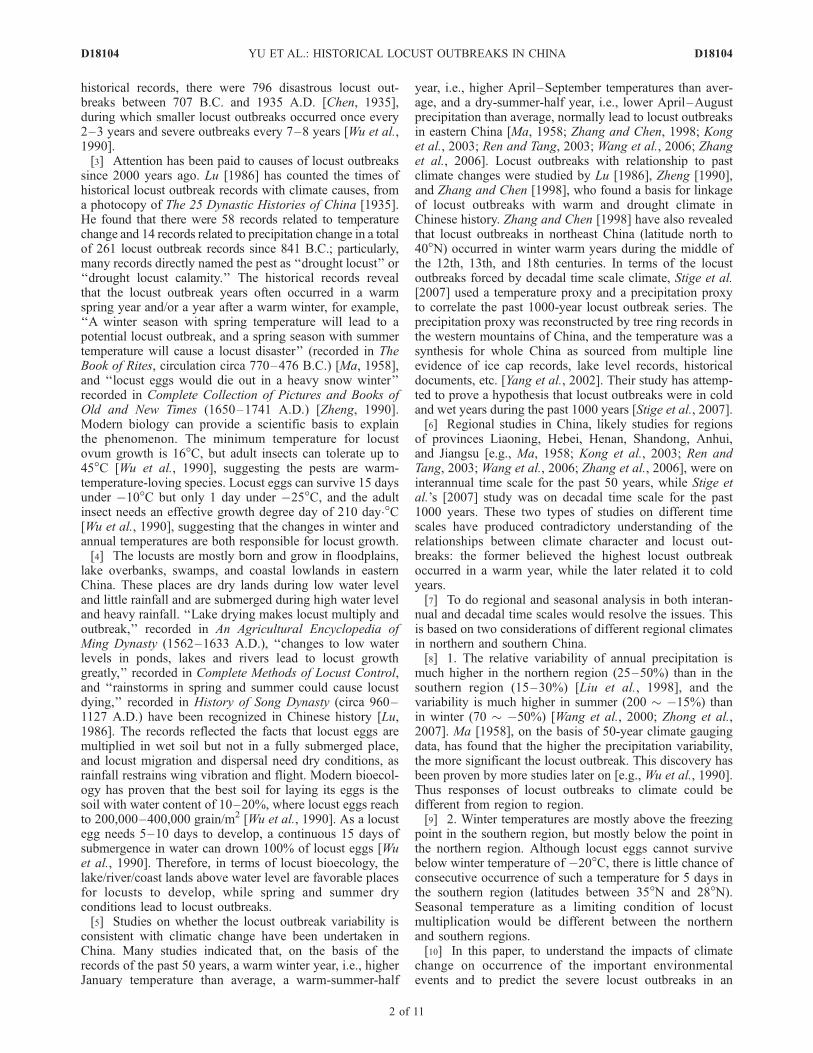
Figure 3. (a and b) Comparisons of locust outbreaks of the past 300 years on decadal time scale withproxy temperatures and (c and d) with GCM simulated temperatures of the annual mean in the northernregion (Figures 3a and 3c) and in the southern region (Figures 3b and 3d). Coarse lines are 30-yearrunning averages in Figures 3a and 3b. Histograms of B resampling correlations between locust index andtemperature as Figure 2.
Figure 4. (a and b) Decadal time scale correlations of proxy temperature variance and (c and d)interannual time scale correlations of GCM-simulated temperature variance with the same time scalelocust index of the past 1000 years. Two pairs during 1000–1500 A.D. have significant positivecorrelations with 95% CI. In Figures 4a and 4c, interannual series were cut off by 95% CI baseline forclear presentation purpose. Figures 4a and 4c are the northern region, and Figures 4b and 4d are thesouthern region. Histograms of B resampling correlations between locust index and temperature asFigure 2.
D18104 YU ET AL.: HISTORICAL LOCUST OUTBREAKS IN CHINA
7 of 11
D18104

data types and time scales in climate series, we did eightpair sets of monocorrelations and multiple correlations withlocust outbreak time series to check climate change impacts.A summary diagram was plotted for the locust outbreakcorrelations with changes in monthly/season/annual meanof temperatures and precipitation (Figure 6). Correlatecoefficients and linear regression slopes in Figure 6 canindicate directions of positive or negative relationships.Although there is some uncertainty in the statistics, wecan obtain more robust features by F test and B test ( p <0.05). In the northern region, locust outbreak yearsresponded to warm year, warm winter, and warm-summer-
half year during the past 300 years in 10-year mean series(Figure 6a), and responded to warm year, warm winter, andwarm March–May, July, and September during the past100 years in interannual series (Figure 6c). Negative Juneprecipitation change during the past 300 years (Figure 6a)and negative March–April, July, September, and annualprecipitation change during the past 100 years (Figure 6c)are significantly correlated with locust outbreak years. In100 year series of the southern region (Figure 6d), locustoutbreak years responding to warm year and warm spring-summer year still stand, except for a colder Januarytemperature response. Dry January and wet spring were
Figure 5. (a and b) Comparison of fast Fourier transform spectral power spectrum of 10-year meanlocust index series and proxy temperature time series, (c and d) wavelet power spectrum contours for theproxy temperature, and (e and f) the locust index. Figures 5a, 5c, and 5e are the northern region, andFigures 5b, 5d, and 5f are the southern region. The wavelet contours were plotted by time series (x axis)versus periodicity year (y axis), in which 95% significance contour is the black dotted line, and the blackarc solid line indicates cone of influence. Anything below the arc is dubious. Gray areas showoverlapping significant periods of locust outbreak years with temperature changes.
D18104 YU ET AL.: HISTORICAL LOCUST OUTBREAKS IN CHINA
8 of 11
D18104

significantly correlated with locust outbreak years. There isless robust feature during the past 300 years, showing awarm-dry summer-autumn linked with locust outbreak inthe southern region (p < 0.10).[33] Generally speaking, the highest locust outbreak years
occurred in warm-wet winter and warm-dry spring-summerin the northern region and warm and wet spring years in thesouthern region. There is less robust feature in the southernregion (p < 0.10), showing a warm-dry summer-autumnlinked with locust outbreak years. We can see that locustoutbreak responding to seasonal climate change on adecadal time scale is generally consistent with that on aninterannual time scale.[34] Without doubt, locust outbreaks were closely linked
with warm winter because with its favorable conditions,locust eggs can be well preserved, and locust outbreakswere strongly linked with warm spring and summer becauseduring it, as an optimum season, locusts can greatly mul-tiply and disperse. In fact, it is true that the locust outbreakfrequency of April–September was 85.8% among the12 months according to 544 historical outbreak records[Zheng, 1990], and a relationship of warm winter and warmspring-summer with severe locust outbreaks has been foundfor a long time in Provinces Henan, Hebei, Shangdong,Anhui, Jiangsu, and Liaoning of eastern China [Ma, 1958;Zhang and Chen, 1998; Zheng, 1990; Kong et al., 2003;Ren and Tang, 2003; Wang et al., 2006; Zhang et al., 2006].Here we confirmed their studies and did more work onmonthly analysis, larger area examinations, and longer timeperiod correlations. Thus we believe that the greenhouse-effected climate warming in the future would strengthen orincrease the locust outbreaks. Actually, locust outbreak
records in the agriculture statistics annals [Statistics AnnalsCommittee of Agriculture in China, 2001, 2002, 2003,2004] show a marked increase since 2000. Sum of thedisastrous area in provinces Shangdong, Hebei, Henan, andLiaoning (all in the northern region) is 19,360, 22,000,18,280, and 19,200 km2 for 2000, 2001, 2002, and 2003,respectively, which were increased 34%–83% compared tothe mean of 1995–1999 [Statistics Annals Committee ofAgriculture in China, 1996, 1997, 1998, 1999, 2000].[35] Study of the relationship of locust outbreaks to
precipitation changes leads us to recognize that precipitationcondition is one important climate factor impacting locustoutbreaks. Our results are consistent with previous studies.Zhang et al. [2006] correlated summer locust outbreaksignificantly with lower June precipitation and autumnlocust outbreak significantly with lower July precipitationin Shangdong Province; lower April precipitation has led tosummer locust outbreaks in Henan Province [Kong et al.,2003], and lower May–June precipitations resulted insummer locust outbreaks in Liaoning Province [Wu et al.,1990].[36] Compared with the northern region, locust outbreaks
with precipitation relationship in the southern region wereless robust (test level at p < 0.10). We think that becauseregional precipitation is much higher in the southern regionthan in the northern region, more locust outbreaks occurredin the northern (427 times) than in the southern region(356 times), as wet conditions greatly restrains locust flyingand dispersing [Ma, 1958; Zheng, 1990]. Thus, historicalrecords on ‘‘drought locust’’ were true, as we found thedrought of spring-summer season in the northern regioncaused the highest regional locust outbreaks, but it is not
Figure 6. Summary diagrams for locust outbreak years significantly correlated with temperature andprecipitation (a) during 1950–1000 A.D. (p < 0.05) in the northern region, (b) during 1950–1000 A.D.( p < 0.05) in the southern region, (c) during 1950–1850 A.D. (p < 0.05) in the northern region, and(d) during 1950–1850 A.D. (p < 0.10) in the southern region. Mono correlation was plotted by thecoefficients marked by dots, squares, and rhombuses for different times, and multiple correlations plottedby the slopes marked by bar.
D18104 YU ET AL.: HISTORICAL LOCUST OUTBREAKS IN CHINA
9 of 11
D18104
obvious in the wet-humid southern region. Hence we thinkthat precipitation change is not a sensitive factor for locustoutbreak in the Yangtze River region.[37] For the negative January temperature correlation in
the southern region, we also think it is a regional feature.There is no record of consecutive 5-day temperatures inJanuary lower than �20�C in this region, where the tem-perature condition would wipe out the locust eggs. Forexample, on the basis of the past 50 years of observationfrom Bengbu Meteorological Station (32.95�N and117.37�E), the monthly mean of minimum January temper-ature is �2.2�C and the monthly minimum is �7.5�C,where it is located near the northern boundary of thesouthern region. Hence, although warm winter conditionis a key factor for locust egg survival and preservation, itworks well when winter temperature reaching to �10 to�30�C in the northern region, while January temperaturealmost above the freezing point in the southern region is nota limiting factor for locust survival.[38] High-resolution climate proxy and GCM modeling
for the past 1000 years are still a challenge for us because ofthe uncertainties [Crowley, 2000; Bauer et al., 2003; Wanget al., 2007]. The locust outbreak index of 1700–1000 A.D.correlated with the temperature proxies or with simulationsdid not show any correlations (R2 < E-2 in the northern andsouthern regions). However, there are obvious relationshipsof locust outbreak with the variability, trends, and periods ofclimate. The decadal time scale series analysis presentedsignificant relationships showing that the highest locustoutbreak years were in warm years commonly in thenorthern and southern regions. However, it shows somedifference in the two regions: the highest locust outbreakyears were in warm-winter-half years with warm-dry Mayin the northern region, but warm-winter-half years withwarm-dry August in the southern region. These synchro-nous changes with 20–110 periodicity years were 56–65%among the total locust outbreak years during the past 1000years.[39] Our decadal time scale series analyses are different
from those of Stige et al. [2007]. They believed the decadalmean locust outbreak is highest during cold and wetperiods. We trust their study method but doubt the datathey used. Outbreaks of the locust caused serious cropfailures mainly in the middle-lower reaches of Yellow Riverand Yangtze River, East Plains, and Coast Plains in low-lands of eastern China. S.-C. Ma concentrated on the areasand deleted some records from the northern–western Chinawhen he developed the index [Ma, 1958]. In the work ofStige et al., only one temperature curve of whole China[Yang et al., 2002] was used to correlate the locust out-breaks. By doing this, they unconsciously enlarged thecovering areas of the locust outbreak. Actually, the recon-structed temperature of the past 1000 years from Yang et al.[2002] used in their study was derived mainly from icecores in the Tibetan Plateau, tree rings in western mountainsof China, and lake sediments also in the Tibetan and otherwestern areas of China, while the historical locust outbreakrecords from the western regions are not available so far. Infact, they correlated the climate of western China withlocust outbreaks of eastern China. Moreover, using oneprecipitation curve of Qinghai (located at �75�E–105�Eand elevation >3000 m above sea level (asl)) to correlate
locust outbreaks in eastern China (�105�E–120�E andelevation <1000 m asl) would diminish the differences ofgeomorphologies between the plateau and the lowlands andupset the rainfall patterns between the western semiaridclimate and the eastern monsoon climate.[40] To prove the above arguments, we did correlations of
10-year mean series of locust index with decadal tempera-ture proxy for all China (10 region means) and easternChina (seven region means) according to geography delin-eation of Wang et al. [2007]. We found no correlations for1000-year series except for 300-year series: the locust indexfrom the northern region is significantly positively correlat-ed (p < 0.05) with temperatures from all China (R = +0.63)and from eastern China (R = +0.68). Locust index from thesouthern region is significantly positively correlated ( p <0.05) with temperatures from all China (R = +0.38) andfrom eastern China (R = +0.40). Relationships betweenwhole China/eastern China climates and locust outbreakindex cannot return negative correlations. These resultsprove that temperature series used by Stige et al. [2007]are from western China, but are not from whole China norfrom eastern China, which are areas the locust outbreakrecords were derived from.[41] Furthermore, observations reveal that outbreaks of
the locust in eastern China normally occur in the seasons ofsummer half year when the locust eggs were preserved inthe previous warm winter seasons [Wu et al., 1990]. Thisrelationship of seasonal variability has been confirmed inthe present study, since our results with 1-year series and10-year mean series were very consistent. Using onlyannual temperature and annual precipitation to undertakecorrelations would ignore the seasonal variability totally,and consequently could hardly draw a true deduction forunderstanding the climate impacts. We would like to em-phasize that, regardless of interannual or decadal time scalesof the data sets, study of such type of environmental eventsshould produce consistent relationships in terms of dynam-ics. In terms of Asian monsoon climatology, a warm year ineastern China is mainly caused by higher winter tempera-ture (variance >50%), and a dry year, caused by lowersummer precipitation (variance 40–65%), and vice versa[Ren, 1992]. These features are also found in longer climateperiod in centennial and millennium time scales [Yu andQin, 1997; Yu et al., 2003]. Thus it is very difficult toimagine that locust outbreak could behave in an oppositeway between interannual time scale and decadal time scale,in terms of mechanisms.[42] We understand that there were some geographical
gaps and blind points to establish the past 1000-year climateseries. It is premature to deduce a conclusion on low-frequency variability by using the above data set with sucha low resolution. By doing this, one can only receive a veryambiguous understanding of the locust dynamics. Nowa-days, high-resolution climate data sets of temperature andprecipitation for the past millennium are ongoing in China.The less-uncertainty data and simulations allow us toreexamine the issues if and how severe disasters of locustoutbreaks respond to greenhouse-effected climate change.These are promising points for future research.
[43] Acknowledgments. Financial support for this work was providedby Key Directional Program of the Knowledge-Innovation Project of the
D18104 YU ET AL.: HISTORICAL LOCUST OUTBREAKS IN CHINA
10 of 11
D18104

Chinese Academy of Sciences: High-resolution lake records and theenvironmental hydrology simulations during the past 3000 years in China(KZCX2-YW-338-2) and by the Nanjing Institute of Geography andLimnology: Data and modeling comparisons for dynamic simulations ofpaleoclimate (CXNIGLAS-2006-07). The authors would like to thank theanonymous reviewers for their insightful comments.
ReferencesBauer, E., M. Claussen, V. Brovkin, and A. Huenerbein (2003), Assessingclimate forcings of the Earth system for the past millennium, Geophys.Res. Lett., 30(6), 1276, doi:10.1029/2002GL016639.
Chen, J. X. (1935), Historical locust records in China (in Chinese), report,Insect Bur. of Zhejiang Prov., Hangzhou, China.
Climate Data Section of Beijing Center of National Meteorology Bureau ofChina (1990), China climate data (in Chinese), report, Beijing.
Collins, M., T. J. Osborn, and S. F. B. Tett (2002), A comparison ofvariability of a climate model with paleotemperature estimates from anetwork of tree-ring density, J. Clim., 15, 1497–1515, doi:10.1175/1520-0442(2002)015<1497:ACOTVO>2.0.CO;2.
Crowley, T. J. (2000), Causes of climate change over the last 1000 years,Science, 289, 270–277, doi:10.1126/science.289.5477.270.
Efron, B., and R. J. Tibshirani (1993), An Introduction to the Bootstrap,Chapman and Hall, New York.
Ge, Q. S., J. Zheng, X. Fang, Z. Man, X. Zhang, P. Zhang, and W.-C. Wang(2003), Winter half-year temperature reconstruction for the middle andlower reaches of the Yellow River and Yangtze River, China, during thepast 2000 years, Holocene, 13(6), 933–940.
Gordon, C., C. Cooper, C. A. Senior, H. Banks, J. M. Gregory, T. C. Johns,J. F. B. Mitchell, and R. A. Wood (2000), The simulation of SST, sea iceextents and ocean heat transports in a version of the Hadley Centrecoupled model without flux adjustments, Clim. Dyn., 16, 147–168,doi:10.1007/s003820050010.
Hesterberg, T. C., D. S. Moore, S. Monaghan, A. Clipson, and R. Epstein(2005), Bootstrap methods and permutation tests, in Introduction to thePractice of Statistics, 5th ed., edited by D. P. Moore and G. P. McCabe,chap. 14, Freeman, San Francisco, Calif. (Available at www.insightful.com/Hesterberg/bootstrap).
Kong, H. J., W. S. Lu, G. Q. Lu, X. D. Wang, and J. J. Wang (2003), Effectof drought and higher temperature on the outbreaks of the Orientalmigratory locust in Henan Province (in Chinese), J. Nanjing Inst.Meteorol., 26, 516–524.
Legutke, S., and R. Voss (1999), The Hamburg atmosphere-ocean coupledcirculation model ECHO-G, Tech. Rep. 18, pp. 1–88, Ger. Clim. Comput.Cent., Hamburg.
Liu, J., H. Storch, X. Chen, E. Zorita, J. Zheng, and S. Wang (2005),Simulated and reconstructed winter temperature in the eastern Chinaduring the last millennium, Chin. Sci. Bull., 50(24), 2872–2877.
Liu, M. G., Y. F. Han, Z. X. Zhang, L. Z. Zhao, and Q. G. Zhan (1998),Precipitation variance of China, in Atlas of Physical Geography of China(in Chinese), p. 43, China Cartogr. Press, Beijing.
Lu, R. J. (1986), Preliminary study on historical locust plagues in China (inChinese), Agric. Archaeology, 1, 311–324.
Ma, S.-C. (1958), The population dynamics of the Oriental migratory locust(Locusta migratoria manilensis) in China (in Chinese), Acta EntomoogicaSin., 8, 1–40.
Ni, G. J. (1998), Plague of locusts and the controlling in Chinese histories(in Chinese), Hist. Educ., 6, 48–51.
Ren, C. G., and T. C. Tang (2003), Analysis of population dynamics andtrends of future outbreaks of the Oriental migratory locust in Hebei (inChinese), Entomological Knowledge, 40(1), 80–82.
Ren, M. E. (Ed.) (1992), Elements of the Physical Geography of China (inChinese), 430 pp., Commer. Press, Beijing.
Shao, X. M. (2004), Treering-recorded precipitation changes for the last1000 years in Delingha region, Qinghai Province, Chin. Sci., D Ser.,34(2), 145–153.
Statistics Annals Committee of Agriculture in China (1996), The StatisticsAnnals of Agriculture in China (in Chinese), China Agric. Press, Beijing.
Statistics Annals Committee of Agriculture in China (1997), The StatisticsAnnals of Agriculture in China (in Chinese), China Agric. Press, Beijing.
Statistics Annals Committee of Agriculture in China (1998), The StatisticsAnnals of Agriculture in China (in Chinese), China Agric. Press, Beijing.
Statistics Annals Committee of Agriculture in China (1999), The StatisticsAnnals of Agriculture in China (in Chinese), China Agric. Press, Beijing.
Statistics Annals Committee of Agriculture in China (2000), The StatisticsAnnals of Agriculture in China (in Chinese), China Agric. Press, Beijing.
Statistics Annals Committee of Agriculture in China (2001), The StatisticsAnnals of Agriculture in China (in Chinese), China Agric. Press, Beijing.
Statistics Annals Committee of Agriculture in China (2002), The StatisticsAnnals of Agriculture in China (in Chinese), China Agric. Press, Beijing.
Statistics Annals Committee of Agriculture in China (2003), The StatisticsAnnals of Agriculture in China (in Chinese), China Agric. Press, Beijing.
Statistics Annals Committee of Agriculture in China (2004), The StatisticsAnnals of Agriculture in China (in Chinese), China Agric. Press, Beijing.
Stige, L. C., K.-S. Chan, Z. Zhang, D. Frank, and N. C. Stenseth (2007),Thousand-year-long Chinese time series reveals climatic forcing ofdecadal locust dynamics, Proc. Natl. Acad. Sci. U. S. A., 104(41),16,188–16,193, doi:10.1073/pnas.0706813104.
Thompson, L. G., T. Yao, E. M. Thompson, M. E. Davis, K. A. Henderson,and P. N. Lin (2000), A high-resolution millennial record of the southAsian monsoon from Himalayan ice cores, Science, 289, 1916–1919,doi:10.1126/science.289.5486.1916.
Torrence, C., and G. P. Compo (1998), A practical guide to wavelet ana-lysis, Bull. Am. Meteorol. Soc., 79(1), 61 – 78, doi:10.1175/1520-0477(1998)079<0061:APGTWA>2.0.CO;2.
von Storch, H., E. Zorita, and J. M. Jones (2004), Reconstructing pastclimate from Noisy data, Science, 306, 679 – 682, doi:10.1126/science.1096109.
Wang, H., S. P. Zhang, and W. Jin (2006), Occurrence regularity andmanagement strategy of Locusta migratoria manilensis (in Chinese),Henan Agric. Sci., 6, 75–78.
Wang, S. W. (1994), Diagnostic studies on the climate change and varia-bility for the period of 1880–1990 (in Chinese), Meteorol. Sinica, 52(3),261–273.
Wang, S. W., D. Y. Gong, J. L. Ye, and Z. H. Chen (2000), Seasonalprecipitation series of eastern China since 1800 and the variability (inChinese), Acta Geogr. Sin., 55(3), 281–293.
Wang, S. W., X. Y. Wen, Y. Luo, W. J. Dong, Z. C. Zhao, andB. Yang (2007), Reconstruction of temperature series of China for the last1000 years, Chin. Sci. Bull., 52(23), 3272–3280, doi:10.1007/s11434-007-0425-4.
Wu, F. Z. (1951), East-Asia-Locust in China (in Chinese), 2 pp., ShanghaiYongxiang Publication, Shanghai, China.
Wu, F. Z., , S. J. Ma, and H. F. Zhu (Eds.) (1990), Oriental migratory locust,in Encyclopedia of Agriculture in China (in Chinese), pp. 73–78, ChinaAgric. Press, Beijing.
Yang, B., A. Braeuning, K. R. Johnson, and S. Yafeng (2002), Generalcharacteristics of temperature variation in China during the last two mil-lennia, Geophys. Res. Lett., 29(9), 1324, doi:10.1029/2001GL014485.
Yu, G., and B. Qin (1997), Holocene temperature and precipitation recon-structions and monsoonal climates in eastern China, Paleoclim. DataModell., 2, 1–32.
Yu, G., B. Xue, J. Liu, and C. Chen (2003), LGM lake records from Chinaand analysis of the climate dynamics, Global Planet. Change, 38, 223–256, doi:10.1016/S0921-8181(02)00257-6.
Yu, G., J. Liu, and B. Xue (2007), Dynamical Paleoclimate Simulations (inChinese), 337 pp., High Educ. Press, Beijing.
Zhang, D. E. (Ed.) (2004), Integrations of China Meteorological Records ofthe Past 3000 Years (in Chinese), 3666 pp., Fenghuang Press, Nanjing,China.
Zhang, D. E., and Y. L. Chen (1998), Paleoclimate inferred from the Chi-nese historical records of the northern boundary of migratory locust (inChinese), Quat. Sci., 1, 12–19.
Zhang, L. S., J. Z. Liu, and Q. N. Liu (2006), Studies on the mechanisms ofyearly severe outbreaks of the Oriental migratory locust in ShandongProvince (in Chinese), China Plant Prot., 26, 41–43.
Zheng, Y. F. (1990), Analysis of locust hazards in history of China (inChinese), Agric. Hist. China, 4, 38–50.
Zhong, Z., Y. J. Hu, and J. Z. Min (2007), Sensitivity of interannual andinterdecadal precipitation variability over China to spatial scale (inChinese), Chin. J. Geophys., 50(5), 1330–1336.
�����������������������J. Liu, H. Shen, and G. Yu, Nanjing Institute of Geography and
Limnology, Chinese Academy of Sciences, 73 East Beijing Road, Nanjing210008, China. ([email protected])
D18104 YU ET AL.: HISTORICAL LOCUST OUTBREAKS IN CHINA
11 of 11
D18104