impacts of hono sources on the photochemistry in mexico … · hono sources performs reasonably...
TRANSCRIPT
Atmos. Chem. Phys., 10, 6551–6567, 2010www.atmos-chem-phys.net/10/6551/2010/doi:10.5194/acp-10-6551-2010© Author(s) 2010. CC Attribution 3.0 License.
AtmosphericChemistry
and Physics
Impacts of HONO sources on the photochemistry in Mexico Cityduring the MCMA-2006/MILAGO Campaign
G. Li 1,2, W. Lei1, M. Zavala1, R. Volkamer3,4, S. Dusanter5, P. Stevens5, and L. T. Molina 1,2
1Molina Center for the Energy and the Environment, La Jolla, CA 92037, USA2Massachusetts Institute of Technology, Cambridge, MA 02139, USA3Department of Chemistry, University of Colorado at Boulder, Boulder, CO 80309, USA4Cooperative Institute for Research in the Environmental Sciences (CIRES), University of Colorado at Boulder, Boulder,CO 80309, USA5Center for Research in Environmental Science, School of Public and Environmental Affairs, and Department of Chemistry,Indiana University, Bloomington, IN 47405, USA
Received: 14 January 2010 – Published in Atmos. Chem. Phys. Discuss.: 11 February 2010Revised: 9 June 2010 – Accepted: 6 July 2010 – Published: 16 July 2010
Abstract. The contribution of HONO sources to the photo-chemistry in Mexico City is investigated during the MCMA-2006/MILAGO Campaign using the WRF-CHEM model.Besides the homogeneous reaction of NO with OH, four ad-ditional HONO sources are considered in the WRF-CHEMmodel: secondary HONO formation from NO2 heteroge-neous reaction with semivolatile organics, NO2 reaction withfreshly emitted soot, NO2 heterogeneous reaction on aerosoland ground surfaces. The WRF-CHEM model with the fiveHONO sources performs reasonably well in tracking theobserved diurnal variation of HONO concentrations. TheHONO sources included are found to significantly improvethe HOx (OH+HO2) simulations during daytime and thepartition of NO/NO2 in the morning. The HONO sourcesalso accelerate the accumulation of O3 concentrations in themorning by about 2 h and subsequently result in a noticeableenhancement of O3 concentrations over the course of the daywith a midday average of about 6 ppb. Furthermore, theseHONO sources play a very important role in the formationof secondary aerosols in the morning. They substantially en-hance the secondary organic aerosol concentrations by a fac-tor of 2 on average in the morning, although they contributeless during the rest of the day. The simulated particle-phasenitrate and ammonium are also substantially enhanced in themorning when the four HONO sources are included, in goodagreement with the measurements. The impact of the HONOsources on the sulfate aerosols is negligible because of the in-efficient conversion of H2SO4 from SO2 reacting with OH.
Correspondence to:G. Li([email protected])
1 Introduction
Nitrous acid (HONO) plays an important role in the photo-chemistry of the troposphere, especially in the polluted ur-ban atmosphere, because HONO is a significant photochem-ical precursor of the hydroxyl radical (OH), the key oxidantin the degradation of most air pollutants (e.g., Jenkin et al.,1988; Calvert et al., 1994; Aumont et al., 2003; Stemmler etal., 2006; Volkamer et al., 2007). Photolysis of HONO bysunlight in the wavelength range from 300 to 405 nm leadsto the production of NO and OH (e.g., Stutz et al., 2000):
HONO+hv → NO+OH (300nm< λ< 405nm) (R1)
Therefore, the formation and photolysis of HONO could en-hance the production of ozone (O3) and other secondary pol-lutants, particularly in the early morning when other OHsources are less important in the polluted atmosphere (Lam-mel and Perner, 1988; Harrison et al., 1996; Kurtenbach etal., 2001).
A wide range of HONO concentrations in the atmospherehave been reported, with maximum at night and minimumduring daytime (Kleffmann et al., 2006). For example, amaximum of 15 ppb was observed in Los Angeles (Winerand Biermann, 1994) and 10 ppb was measured in Milan,Italy (Febo et al., 1996). High values of HONO (100–400 ppt) are also detected during the day in urban areas(e.g., Febo et al., 1996) and rural regions (53–110 ppt) (e.g.,Staffelbach et al., 1997; Zhou et al., 2002; Acker et al.,2005).
The main gas phase source of HONO is the reaction of NOwith OH, which frequently fails to explain the observed high
Published by Copernicus Publications on behalf of the European Geosciences Union.

6552 G. Li et al.: Impacts of HONO sources on the photochemistry in Mexico City
daytime and nighttime HONO concentrations (Aumont et al.,1999; Stafelbach et al., 1997). Recently, gas-phase produc-tion of HONO has been observed during the photolysis ofdifferentortho-nitrophenols (Bejan et al., 2006; Kleffmann,2007), with a noontime HONO production of 100 pptv h−1
in the urban regions. In addition, the gas-phase photolysisof methyl-substituted nitroaromatics is also proposed to pro-duce HONO (Kleffmann, 2007). Although HONO formationmechanism in the atmosphere is still poorly understood atpresent, it is well established that heterogeneous conversionprocesses of nitrogen dioxide (NO2) on different surfaces areinvolved in the troposphere (Febo et al., 1987; Svensson etal., 1987; Saliba et al., 2000; Kleffmann et al., 1998; Lammeland Cape, 1996). In the stratosphere, when the temperatureis below 230 K, heterogeneous reactions of HONO on sulfateaerosols have been observed with an uptake coefficient rang-ing from 0.03 to 0.1, dependent on the sulfuric acid content(Zhang et al., 1996). However, considering the high temper-ature in the troposphere, the heterogeneous loss of HONOon sulfate aerosols cannot constitute a potentially importantHONO sink. Direct emissions from vehicles may also play arole in atmospheric HONO levels, depending on vehicle en-gines and traffic distributions, with a molar emission ratio ofHONO/NOx ranging from 10−4 to 10−2 (Kurtenbach et al.,2001).
Based on the surface measurements of various radical pre-cursors, Winer and Biermann (1994) investigated the relativecontribution of HONO to OH sources, showing that HONOwas a major source of OH during the morning in the pollutedLos Angeles atmosphere. Using observations with Differ-ential Optical Absorption Spectroscopy (DOAS), Alicke etal. (2002, 2003) found that photolysis of HONO producedup to 34% of the total OH formed over 24-h period duringBERLIOZ in Germany. Volkamer et al. (2007) also showedthat photo-induced HONO sources made an important con-tribution to the OH level in the early morning during theMCMA-2003 field campaign in Mexico City.
Modeling results reported in the literature indicate that thecontribution of HONO to the atmospheric photochemistrydepends on multiple conditions, such as NOx concentration,season, etc. In the pioneering modeling study by Harris etal. (1982) using a trajectory model, various levels of HONOwere included in the early morning at the beginning of thesimulations. The initial HONO input was found to remark-ably enhance the production rate of O3 but not significantlyinfluence the maximum O3 yield, except under high NOxconditions. Using a box model, Jenkin et al. (1988) foundthat the photolysis of HONO in the early morning led to a50% increase of OH at 0600 GMT, a 14% increase in thedaily maximum OH and a 16% increase in net photochemi-cal O3 production when a heterogeneous HONO source wasadded. Similar results were also obtained by Kotamarthi etal. (2001) using a box model, showing that HONO formationon aerosols substantially influenced O3, OH, and HO2 con-centrations in the polluted planetary boundary layer (PBL).
Furthermore, employing a photochemical trajectory model,Clapp and Jenkin (2001) suggested that direct emission ofHONO may have an important impact on the level of oxi-dant (O3+NO2), especially under more polluted conditions.Based on the simulations with a chemical transport model,Lei et al. (2004) concluded that heterogeneous conversionof NO2 to HONO on the surfaces of soot aerosol acceler-ated the O3 production by about 1 h in the morning and ledto a noticeable increase of 7 ppb on average in the daytimeO3 level. However, in the simulations performed by Au-mont et al. (1999) using a two-layer box model, the photoly-sis of HONO did not contribute significantly to summertimeO3 concentrations of polluted air masses. Furthermore, Au-mont et al. (2003) conducted simulations with a two-layerbox model to verify the impact of HONO photolysis onthe NOx/HOx/O3 chemistry in the polluted boundary layer.Three HONO sources were added in their simulations, in-cluding direct emissions of HONO, NO2 heterogeneous pro-duction of HONO on the ground surface and the aerosol sur-face. Their simulation results varied with the season: HONOsources were found to slightly influence the NOx/HOx/O3concentration profiles during summer, but the photolysis ofHONO appeared to be a significant source of OH during win-ter.
As an important contributor of OH in the polluted atmo-sphere, HONO sources potentially affect the formation ofsecondary aerosols by enhancing the VOC oxidation due tothe increased OH level. However, few studies have been con-ducted to investigate the impacts of HONO sources on theformation of secondary aerosols in the polluted atmosphere.
During the MCMA-2006 field campaign as part of the MI-LAGRO (Megacity Initiative: Local and Global ResearchObservations) project in March 2006, an extensive data setwas obtained, including highly time-resolved ambient gasphase species and aerosols (Molina et al., 2008; 2010), whichprovides a unique opportunity to investigate the impacts ofHONO sources on the photochemistry in a polluted urbanarea. The objective of the present study is to examine therelative importance of different HONO sources and evaluatetheir contributions to the HOx/NOx/O3 chemistry and sec-ondary aerosols using the WRF-CHEM model based on themeasurements taken during MCMA-2006 field campaign.The WRF-CHEM model and the model configuration are de-scribed in Sect. 2. Results of the modeling experiments andcomparisons are presented in Sect. 3. The discussion andsummary are given in Sect. 4.
2 Model description
2.1 WRF-CHEM Model
The WRF Model (Skamarock et al., 2005) is a next-generation mesoscale numerical weather prediction (NWP)system designed to serve both operational forecasting and
Atmos. Chem. Phys., 10, 6551–6567, 2010 www.atmos-chem-phys.net/10/6551/2010/
G. Li et al.: Impacts of HONO sources on the photochemistry in Mexico City 6553
atmospheric research needs. A detailed description of theWRF model can be found in the WRF web-sitehttp://www.wrf-model.org/index.php.
Additionally, a chemical model is also fully implementedinto the WRF model (WRF-CHEM) (Grell et al., 2005;Tie et al., 2007). Based on the framework of the cur-rent WRF-CHEM model and the available emissions in-ventory in Mexico City (Song et al., 2010), a new flexi-ble gas phase chemical module has been developed and im-plemented into the WRF-CHEM model, which can be uti-lized with different chemical mechanisms, including CBIV,RADM2, and SAPRC. The chemistry is solved by an Eule-rian backward Gauss-Seidel iterative technique with a num-ber of iterations, inherited from NCAR-HANK (Hess et al.,1999). The short-lived species, such as OH and O (1D),are assumed to be in steady state. The solution is iterateduntil all species are within 0.1% of their previous iterativevalues. For the aerosol simulations, the CMAQ/models3(version 4.6) aerosol module developed by US EPA (Envi-ronmental Protection Agency), which is designed to be anefficient and economical depiction of aerosol dynamics inthe atmosphere, has also been incorporated into the WRF-CHEM model (Binkowski and Roselle, 2003). In this aerosolcomponent, the particle size distribution is represented asthe superposition of three lognormal sub-distributions calledmodes. The processes of coagulation, particle growth by theaddition of mass, and new particle formation are included. Inaddition, the wet deposition also follows the method used inthe CMAQ/Models3. Surface deposition of chemical speciesis parameterized following Wesely (1989). The photolysisrates are calculated using the FTUV (Tie et al., 2003; Li et al.,2005). Anthropogenic emissions used in the WRF-CHEMmodel are constructed from the official emissions inventoryfor the MCMA-2006 (Song et al., 2010). Biogenic emissionsare estimated using the MEGAN v2.04 model (Model ofEmissions of Gases and Aerosols from Nature) developed byGuenther et al. (2006, 2007); the on-line biogenic emissionscalculation is turned off. In the present study, the SAPRC 99gas phase chemical mechanism is employed according to theavailable emission inventory in Mexico City.
2.2 Parameterization of HONO Sources
In addition to the homogeneous reaction of NO with OH,four sources of HONO are included: secondary HONO for-mation from NO2 heterogeneous reaction with semivolatileorganics, NO2 reaction with freshly emitted soot, NO2 het-erogeneous reaction on aerosols and ground surface.
With regard to the secondary HONO formation from NO2heterogeneous reaction with semivolatile organics, we fol-low the results of a recent experimental study performed byGutzwiller et al. (2002) and assume that a fraction of 0.023of the NOx emitted is heterogeneously converted to HONO.It is worthy to note that the fraction suggested by Gutzwilleret al. (2002) was obtained from diesel exhaust. It might be
more appropriate to use the value of 244 mg of secondaryHONO formation per kg of diesel fuel burnt as suggestedby Gutzwiller et al. (2002). However, in their experiment,the semivolatile organics in diesel exhaust react with NO2 ontime scales of hours, much longer than the time scale of theNO2 to HONO conversion on freshly soot particles, which isin the order of one minute (Kalberer et al., 1999). Therefore,using the fraction of NOx or diesel fuel burnt to calculate theHONO formation is a highly parameterized method based onthe experiment of Gutzwiller et al. (2002). In Mexico City,diesel vehicles contribute almost all the organic aerosol emis-sions (Zavala et al., 2009) and very high levels of organicaerosols have been observed (Aiken et al., 2009), indicating alarge amount of semivolatile organics are emitted from dieselvehicles, which could participate in the conversion of NO2from other sources, such as gasoline engines and biomassburning. Considering the emission contributions from dieselengines and the variation in the fraction of NO2 in NOx emis-sions in Mexico City, the fraction of 0.023 used in the studyis likely an upper limit for the HONO formation from NO2heterogeneous reaction with semivolatile organics. Further-more, it is necessary to emphasize that further studies needto be conducted to more appropriately parameterize the NO2reaction with semivolatile organics.
Ammann et al. (1998) found an efficient conversion ofNO2 to HONO on suspended soot particles with a reac-tion probability ranging from 1.1×10⁻² to 3.3×10⁻⁴, butthey did not conclude whether the conversion process iscatalytic or not. Subsequently, Kalberer et al. (1999) con-cluded that the NO2 to HONO conversion on soot parti-cles rapidly saturates because of consumption of the reac-tive sites. They suggested an upper limit for HONO for-mation of 1018 HONO molecules mg−1 freshly emitted soot.However, Arens et al. (2001) estimated that the total HONOformation potential of soot particles was about 1.3×10¹⁷
HONO molecules mg−1 of diesel soot, and suggested thatthe reaction between NO2 and diesel soot particles does notprovide a significant secondary HONO source in the atmo-sphere. We employ the value of 1.3×10¹⁷ HONO mg−1 offreshly emitted soot to calculate the conversion of NO2 toHONO based on the black carbon emissions in the WRF-CHEM model, considering that the reaction rate of NO2 withfreshly emitted soot is dramatically reduced after the firstseconds (Kalberer et al., 1999), which is less than the chem-ical integration time step in simulations.
Several heterogeneous reactions on different surfaces in-volving NO2 as a reactant have been proposed as potentialcontributors to HONO formation in the troposphere (Febo etal., 1987; Svensson et al., 1987; Saliba et al., 2000; Kleff-mann et al., 1998; Lammel and Cape, 1996):
2NO2+H2O→ HONO+HNO3 (R2)
NO+NO2+H2O→ 2HONO (R3)
NO+HNO3 → NO2+HONO (R4)
www.atmos-chem-phys.net/10/6551/2010/ Atmos. Chem. Phys., 10, 6551–6567, 2010

6554 G. Li et al.: Impacts of HONO sources on the photochemistry in Mexico City
However, most laboratory studies suggest that the reactionof NO2 to HONO is first order in NO2 concentration, thusthe HONO formation can be parameterized by the followingreactions (Aumont et al., 2003):
NO2 → HONO, ka (R5)
NO2 → HONO, kg (R6)
Where,ka andkg are the first order rate constants for aerosoland ground surface reactions, respectively.
For the reaction on aerosols, the first order rate constantka
is estimated by
ka =1
4vNO2(
S
V)ra (R7)
wherevNO2 is the mean molecular speed of NO2, S/V isthe surface to volume ratio, andra is the reactive uptake co-efficient. We use a low value ofra = 1×10⁻⁶ in the night-time (Aumont et al., 2003) and increase it to 5×10⁻⁶ inthe daytime with the assumption that aerosols are mixed orcovered with organic compounds, humid acids, soot or dust,which dramatically enhance the HONO formation when thesunlight is available (George, 2005; Stemmler et al., 2007;Monge et al., 2010; Ndour et al., 2008). With regard to theNO2 reaction on ground surface, the rate constant is calcu-lated by
kg =1
8vNO2(
S
V)rg (R8)
where rg is the reactive uptake coefficient of ground sur-face. According to tunnel measurements and experimentsby Kurtenbach et al. (2001), we use a value ofrg = 1×10⁻⁶
at the nighttime. Stemmler et al. (2006) showed that NO2is effectively reduced to HONO on light activated surfacescontaining humic acids, soils or selected synthetic aromaticcompounds. The dust and soot particles deposited on theground surface also enhance the HONO production when thesunlight is available (Ndour et al., 2008; Monge et al., 2010).A relatively large uptake coefficient of 2×10⁻⁵ is suggested,with dependence on the light intensity. When the sunlightis available and the light density is less than 400 W m−2, theuptake coefficient is set to 2×10⁻⁵. When the light densityis more than 400 W m−2, the uptake coefficient of 2×10⁻⁵
is scaled by a factor defined as (light density)/400. We usean effective surface of 1.7 m2 per geometric surface in themodel surface layer to calculate the surface to volume ratio(Vogel et al., 2003).
2.3 Model configuration
Two three-day episodes from 24 to 26 and from 27 to 29March 2006 are selected in the present study, representingtypical “O3-Convection South” and “O3-Convection North”meteorological conditions in Mexico City, respectively (de
Fig. 1. WRF-CHEM simulation domain. Black squares representthe RAMA (Mexico City Ambient Air Monitoring Network) sitesand red filled circle is the T0 super site at the Instituto del Petroleo(IMP) laboratories (Mexico, DF).
Foy et al., 2008). The WRF-CHEM model is configured withone grid with spacing of 3 km (99×99 grid points) centered at19.538◦ N and 99◦ E (Fig. 1). Thirty-five vertical levels areused in a stretched vertical grid with spacing ranging from50 m near the surface, to 500 m at 2.5 km Above GroundLevel (AGL) and 1 km above 14 km. The modeling systememploys the microphysics scheme of Lin et al. (1983), theYonsei University (YSU) PBL scheme (Noh et al., 2001),the Noah land-surface model (Chen and Dudhia, 2000), theRRTM longwave radiation parameterization (Mlawer et al.,1997), and a shortwave radiation parameterization (Dudhia,1989). Meteorological initial and boundary conditions arefrom NCEP 1◦×1◦ reanalysis data. Chemical initial andboundary conditions are interpolated from MOZART 3-houtput (Horowitz et al., 2003).
Atmos. Chem. Phys., 10, 6551–6567, 2010 www.atmos-chem-phys.net/10/6551/2010/
G. Li et al.: Impacts of HONO sources on the photochemistry in Mexico City 6555
(LT)
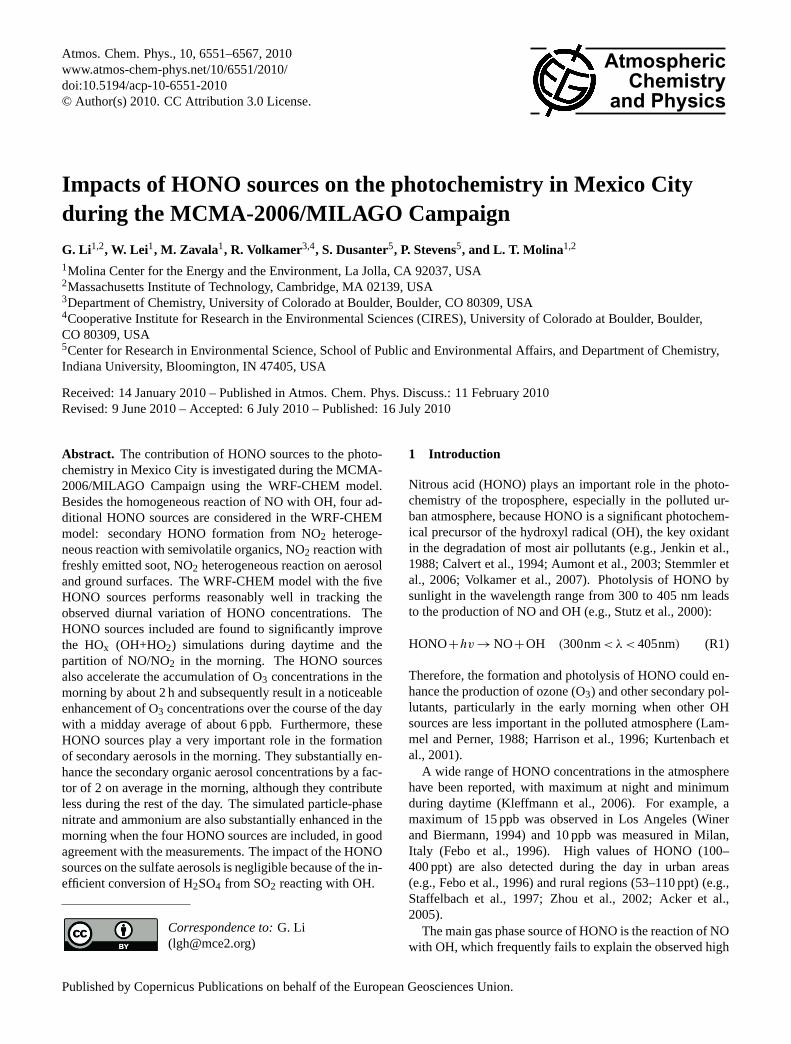
Fig. 2. Comparison of HONO measurements from three LP-DOAS instruments during two field campaigns in the MCMA.(open circles) HONO mean concentration during MCMA-2003from DOAS#2 at 70 m above ground; (solid circles) MCMA-2003mean from DOAS#1 at 18 m above ground; (solid squares withdashed line) reference case: MCMA-2006 mean, excluding datafrom the model period (24–29 Apri), data measured 16 m aboveground; (open squares) mean during the model period (24–29April); (crossed squares) data from 29 April 2006. Also shownon the right scale are ratios of HONO concentrations for data sub-sets: (green line) MCMA-2003 average of two DOAS instruments,divided by reference case; (red line) model period divided by refer-ence case; (black line) 29 April 2006 divided by the reference case.
Two case simulations are performed in this study. In thehomogeneous case (hereafter referred to as H-case), onlythe gas phase reaction of NO with OH is considered as theHONO source. For the enhanced case (hereafter referred toas E-case), the four HONO sources described in Section 2.2are included together with the gas phase reaction. We com-pare the model results from the H-case and E-case with mea-surements obtained at the T0 urban supersite (Table 1). Inaddition, based on the E-case, several experimental studieshave been performed to verify the HONO contribution fromthe photolysis of differentortho-nitrophenols and evaluatethe sensitivity of HONO sources to the input parameters.
3 Results
3.1 HONO measurements
Figure 2 compares diurnal profiles of HONO concentra-tions measured by LP-DOAS during the MCMA-2003 andMCMA-2006 field campaigns. Two LP-DOAS instrumentswere deployed at a mean height of 16 m and 70 m aboveground at CENICA during MCMA-2003 (Volkamer et al.,2007). During MCMA-2006, the LP-DOAS was located atabout 14 m above ground at T0. Mean diurnal profiles are
shown for the entire campaign duration for the two instru-ments from MCMA-2003, and for different data subsets forMCMA-2006. We define the reference case as the mean di-urnal profile calculated from measurements for all MCMA-2006 campaign days except the modeling period. If measure-ments are compared at a comparable mean height of the LP-DOAS light path above ground, the mean HONO diurnal pro-files during MCMA-2003 and the reference case agree within10% at night. Somewhat larger differences are observed dur-ing daytime, with up to 50% lower daytime HONO observedduring MCMA-2003 compared to the reference case. Ver-tical concentration gradients can explain up to 40% lowerHONO at 70 m compared to 16 m above ground at night dur-ing MCMA-2003; this is consistent with HONO formationon urban surfaces as it has been invoked in other studies(Olaguer et al., 2009). The onset of convective vertical mix-ing of air shortly after sunrise quickly reduced any verticalconcentration gradients of HONO in the early morning, andno evidence for vertical gradients was observable 2–3 h aftersunrise during MCMA-2003. Figure 2 shows that on a meanbasis the combination of horizontal and vertical HONO gra-dients can explain a variability of up to 50% in HONO be-tween the reference case and the MCMA-2003 data.
During the period from 24–29 April 2006 HONO was sys-tematically higher than could be explained based on typi-cal concentration gradients. While nighttime HONO agreedreasonably well with that observed in the reference scenario(with the exception of April 29), significantly higher HONOwas observed primarily during daytime. The mean daytimeHONO during 24–29 April was 2–3 times higher than dur-ing the rest of the MCMA-2006 field campaign, and 4–5times higher than during MCMA-2003. Differences wereparticularly large on 29 April when nighttime HONO was 2-3 times higher, and daytime HONO was up to 7 times higherthan observed during the reference scenario. The largest en-hancement in daytime HONO over the reference case wasobserved in the mid-morning, but differences persisted formost of the day. This modeling paper does not attempt toexplain why periods of enhanced daytime HONO are ob-served in the MCMA. Rather, the focus is on the study ofthe role that such periods can play to accelerate the forma-tion of secondary pollutants such as ozone and secondaryaerosol formation within the MCMA. However, it should beemphasized that no events of elevated daytime HONO wereobserved during MCMA-2003 (Volkamer et al., 2007), andfor the most part of MCMA-2006. The frequency with whichevents of enhanced daytime HONO occur within the MCMAis presently not well established.
3.2 HONO simulations
Figure 3 shows the diurnal variation of the modeled HONOconcentrations in the H-case and E-case compared with themeasurement at T0 from 24 to 29 March 2006. In the H-case with only the gas phase reaction as the HONO source,
www.atmos-chem-phys.net/10/6551/2010/ Atmos. Chem. Phys., 10, 6551–6567, 2010

6556 G. Li et al.: Impacts of HONO sources on the photochemistry in Mexico City
Table 1. Species used for comparison with simulations at T0.
Species Instrumentation Institution Reference
Radical speciesOH LIF-FAGE Indiana University Dusanter et al., 2009aHO2 LIF-FAGE Indiana University Dusanter et al., 2009a
Inorganic speciesO3 UV absorption Indiana University Dusanter et al., 2009a
LP-DOAS (DOAS2) MIT, U. of HeidelbergNO Chemiluminescence RAMA Dusanter et al., 2009aNO2 Chemiluminescence RAMA Dusanter et al., 2009a
LP-DOAS (DOAS1) MIT, U. of Heidelberg Merten, 2008LP-DOAS (DOAS2) MIT, U. of Heidelberg Merten, 2008
HNO2 LP-DOAS (DOAS1) MIT, U. of Heidelberg Merten, 2008LP-DOAS (DOAS2) MIT, U. of Heidelberg Merten, 2008
SO2 LP-DOAS (DOAS1) MIT, U. of Heidelberg Merten, 2008LP-DOAS (DOAS2) MIT, U. of Heidelberg Merten, 2008
HNO3 ID-CIMS Texas A&M U. Zheng et al., 2008
AerosolsSulfate
HR-ToF-AMS U. of Colorado Aiken et al., 2009NitrateAmmoniumSOA
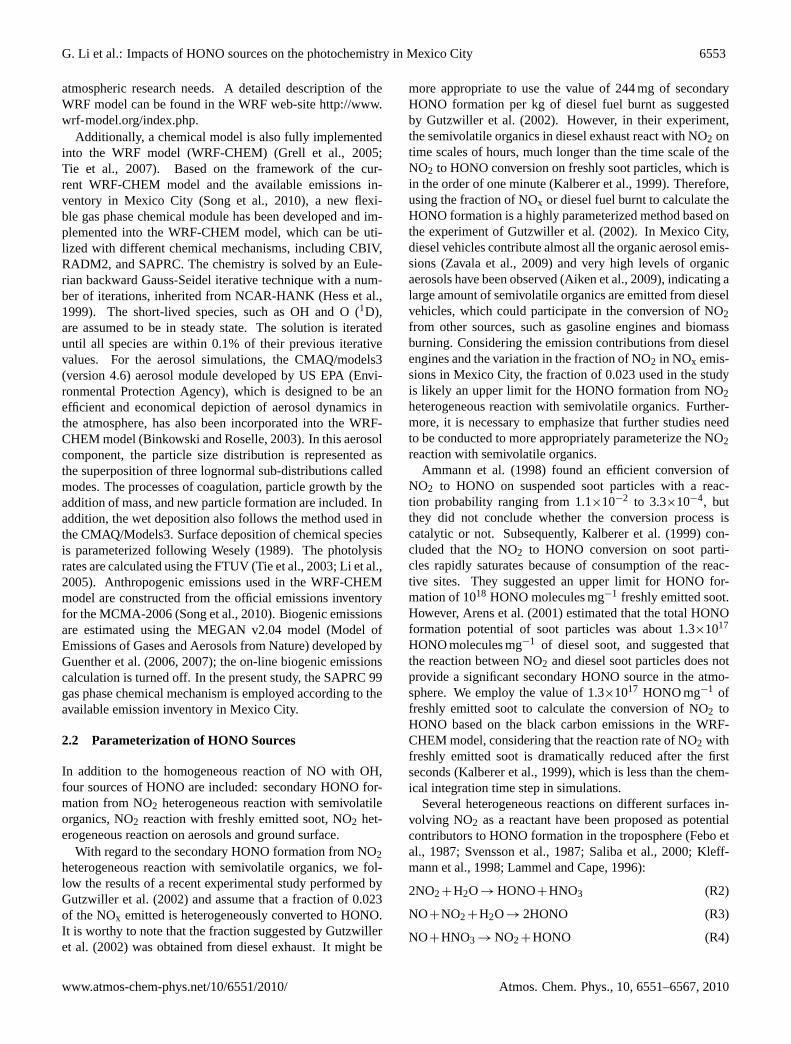
Fig. 3. Simulated and observed HONO at T0 during 24–29 March2006. The black dots denote the observation, and the red and bluelines represent the simulations in the E-case and H-case, respec-tively.
the HONO concentrations are underestimated by a factor of10 on average compared with the observations, particularlyduring nighttime. The simulation results are fairly consistentwith previous studies, which show that the pure gas phasereaction fails to explain the observed high HONO concentra-tions (Aumont et al., 1999; Stafelbach et al., 1997; Vogel etal., 2003). Additionally, the ROx (OH+HO2+RO2) modelingstudy for T0 performed by Dusanter et al. (2009b) using abox model has also demonstrated a systematic underpredic-tion of the measured HONO concentrations during daytimeif only the homogeneous gas-phase reaction is considered as
the HONO source. Moreover, the simulated peak HONOconcentrations in the H-case occur at 09:00 LT (local time),one or two hours later than the observed value.
When the four additional sources of HONO are consid-ered in the E-case, the WRF-CHEM model tracks reasonablywell the HONO diurnal variability compared with the mea-surement. For example, the occurrence of peak HONO con-centrations is well replicated, and the accumulation of night-time HONO concentrations and the rapid falloff of morn-ing HONO concentrations are also reproduced. However,the E-case frequently underestimates the HONO levels dur-ing the afternoon, particularly on 28 and 29 March indicat-ing either unawareness of unknown sources or uncertaintiesfrom meteorological field simulations. For example, Zhou etal. (2002) speculated that the photolysis of HNO3 might con-tribute significantly to the missing daytime HONO sources.In the simulations of Vogel et al. (2003), although the di-rect emission of HONO and the NO2 heterogeneous reactionon aerosol and ground surfaces were included, the simulateddaytime HONO concentrations were also underestimated by30–50% compared with the observations. An artificial pho-tolytic HONO source had to be introduced in order to im-prove the HONO simulations during daytime.
In the present study, a photochemical source of HONOon ground surfaces has been incorporated into the WRF-CHEM model with a relatively large uptake coefficient. Ad-ditionally, in the HONO parameterization, we do not in-clude the HONO production from the photolysis of different
Atmos. Chem. Phys., 10, 6551–6567, 2010 www.atmos-chem-phys.net/10/6551/2010/
G. Li et al.: Impacts of HONO sources on the photochemistry in Mexico City 6557
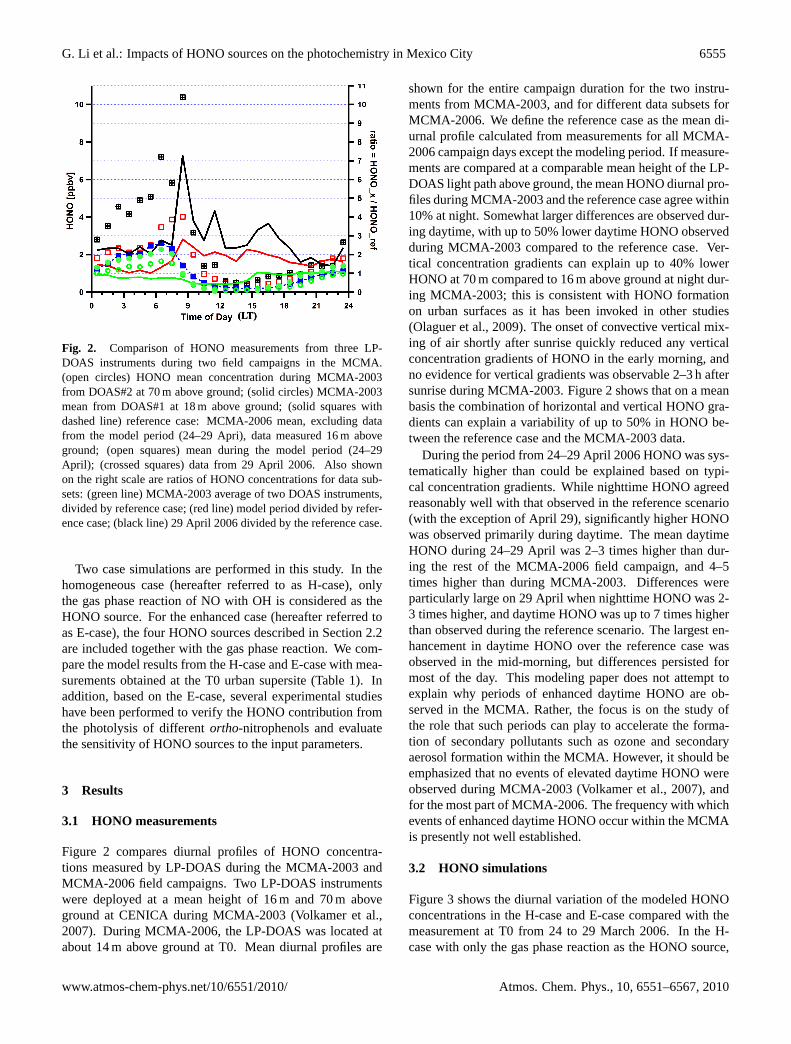
Fig. 4. Simulated and observed photolysis rate of HONO at T0during 24–29 March 2006. The black dots denote the observationand the red represents the simulations in the E-case.
ortho-nitrophenols (Bejan et al., 2006; Kleffmann, 2007),because all nitrophenols are represented by one lumpedspecies (NPHE) in the SAPRC 99 mechanism and the ab-sorption cross section ofortho-nitrophenols is not availableyet. In order to evaluate possible HONO contribution fromthe photolysis of differentortho-nitrophenols, we have con-ducted a sensitivity study in the E-case, assuming that allnitrophenols are photolyzed to form HONO and the photol-ysis frequency is interpolated fromJ[NO2] as suggested byBejan et al. (2006). The study provides an upper limit ofHONO production from the photolysis of differentortho-nitrophenols. The enhancement of HONO concentrationsfrom the photolysis of nitrophenols is less than 3 ppt on aver-age during daytime, which is probably due to the low level ofpredicted nitrophenols (less than 0.3 ppb) in the simulation.Therefore, the photolysis ofortho-nitrophenols is less likelyto be a significant HONO source in Mexico City.
Meteorological conditions play also a key role in air pollu-tion simulations principally through determining the disper-sion or accumulation of pollutant emissions and also influ-encing their lifetime via changing chemical processes (Bei etal., 2008). Convections were active during the period from24 to 29 March (de Foy et al., 2009), which may signifi-cantly influence the HONO simulation in the WRF-CHEMmodel. The frequent cumulus cloud formation and develop-ment remarkably affect the photolysis rates of HONO. Fig-ure 4 presents the comparison of the observed and simulatedphotolysis rates of HONO at T0. The photolysis rates forHONO were directly measured using a spectroradiometer atT0 (Volkamer et al., 2007). The reduction of HONO pho-tolysis rates due to clouds is salient in the afternoon duringthe two episodes, particularly on 28 and 29 March. However,unfortunately, the WRF-CHEM model frequently fails to re-solve the formation and development of cumulus clouds us-ing 3-km horizontal resolution. Therefore, in the afternoon,the WRF-CHEM model often overestimates the HONO pho-tolysis rates, and likely underestimates HONO concentra-
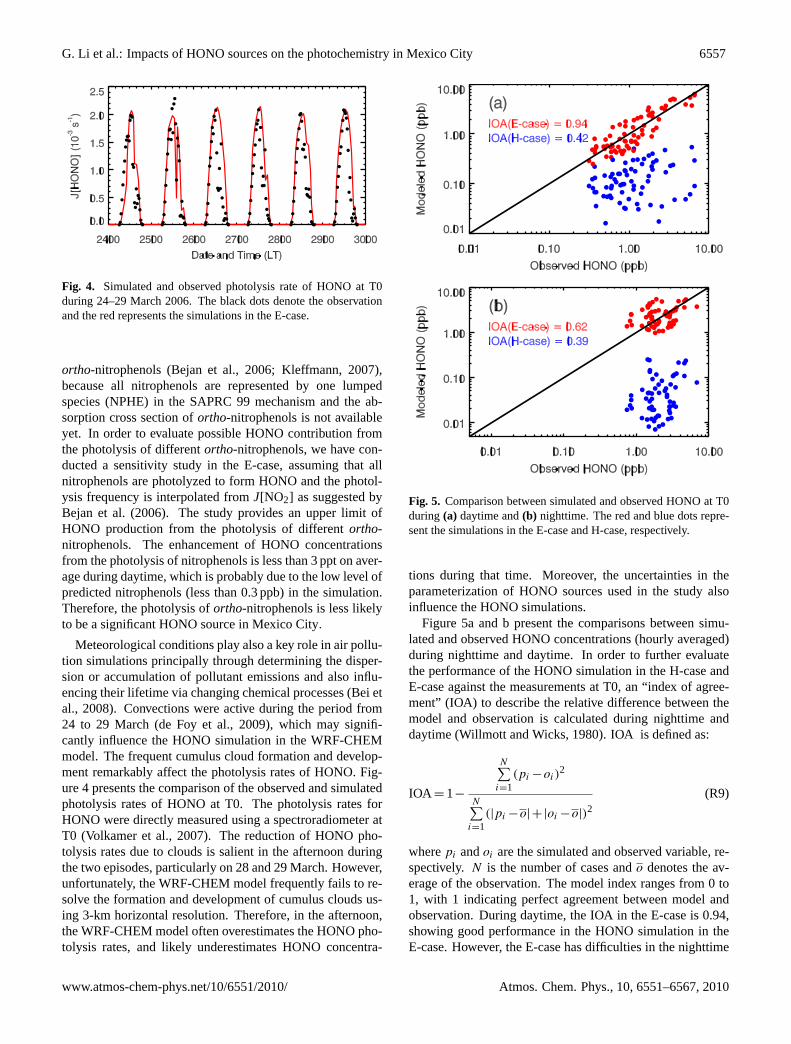
Fig. 5. Comparison between simulated and observed HONO at T0during (a) daytime and(b) nighttime. The red and blue dots repre-sent the simulations in the E-case and H-case, respectively.
tions during that time. Moreover, the uncertainties in theparameterization of HONO sources used in the study alsoinfluence the HONO simulations.
Figure 5a and b present the comparisons between simu-lated and observed HONO concentrations (hourly averaged)during nighttime and daytime. In order to further evaluatethe performance of the HONO simulation in the H-case andE-case against the measurements at T0, an “index of agree-ment” (IOA) to describe the relative difference between themodel and observation is calculated during nighttime anddaytime (Willmott and Wicks, 1980). IOA is defined as:
IOA = 1−
N∑i=1
(pi −oi)2
N∑i=1
(|pi −o|+|oi −o|)2
(R9)
wherepi andoi are the simulated and observed variable, re-spectively. N is the number of cases ando denotes the av-erage of the observation. The model index ranges from 0 to1, with 1 indicating perfect agreement between model andobservation. During daytime, the IOA in the E-case is 0.94,showing good performance in the HONO simulation in theE-case. However, the E-case has difficulties in the nighttime
www.atmos-chem-phys.net/10/6551/2010/ Atmos. Chem. Phys., 10, 6551–6567, 2010

6558 G. Li et al.: Impacts of HONO sources on the photochemistry in Mexico City
HONO simulations, with IOA of 0.62. In contrast, irregard-less of daytime or nighttime, the small IOA in the H-caseshows the failure of the homogeneous source to interpret theobserved high levels of HONO.
The most important HONO source in the E-case isthe secondary HONO formation from NO2 reaction withsemivolatile organics, contributing about 75% of the HONOconcentrations near the ground level during daytime. When alarge reactive uptake coefficient is used during daytime, theground surface also plays an important role in the HONOformation, providing 18% of the HONO concentrations inthe surface level. The contribution from the reaction ofNO2 with the freshly emitted soot is small, less than 2%.The model simulations conducted by Aumont et al. (1999),which considered the deactivation of fresh soot surfaces, alsoshowed that the NO2+soot reaction is not a significant atmo-spheric source of HONO (Arens et al., 2001). The simu-lated maximum aerosol surface to volume ratio (S/V ) ex-ceeds 1.0×10⁻³ m−1, due to the high pollution in MexicoCity. We have used a relatively higher NO2 reaction proba-bility on aerosol surfaces during daytime, but the contribu-tion of HONO at the aerosol surface is still negligible com-pared to the ground surface, which is in good agreement withthe results obtained by Vogel et al. (2003).
Near the ground level, the contribution of HONO from thehomogeneous source in the E-case is about 5% during day-time, which is inconsistent with the results presented by Du-santer et al. (2009b). Using a box model constrained by mea-surements at T0, they calculated the loss rate of HONO fromphotolysis to be 11.4×10⁶ molecule cm−3 s−1 while the pro-duction rate from OH+NO is 6.5×10⁶ molecule cm−3 s−1 onaverage between 08:40 a.m. and 18:40 LT. They concludedthat the homogeneous source accounts for more than 50%of the HONO formation rate during this time period. Inthe WRF-CHEM model, HONO is transported and disperseddue to its relatively long lifetime ranging from half an hour inthe early morning to around 10 min at noontime. Particularly,HONO is efficiently mixed in the PBL by the vertical tur-bulent exchange. The HONO sources of secondary HONOformation from NO2 reaction with semivolatile organics andNO2 reactions with the freshly emitted soot and ground sur-face are all included in the surface level in the WRF-CHEMmodel, hence the three sources play a dominant role in theground level. If the three sources are assumed to be dis-tributed in the PBL, and considering that the simulated meanPBL height between 08:40 and 18:40 LT is about 1.5 km andthe height of the model ground level is about 50 m, the ho-mogeneous source contributes more than 50% to the HONOproduction, comparable to the box model results from Du-santer et al. (2009b).
As the most important HONO source in the surface level,the NO2 reaction with the semivolatile organics is highly pa-rameterized in the simulations, using a fraction of 0.023 ofthe NOx emitted to calculate the HONO formation. Based onthe experiment of Gutzwiller et al. (2002), the semivolatile
organics in diesel exhaust react with NO2 within hours un-der the condition of sufficient water content. Considering themassive emissions of semivolatile organics from diesel ve-hicles in Mexico City and the high relative humidity due toconvective activities during the simulation period, the frac-tion of 0.023 used is reasonable, which is demonstrated bythe comparison of the simulations in the E-case with the ob-servations at T0. However, the parameterization of the NO2reaction with the semivolatile organics in the study might notbe fit for moderately polluted areas where the emissions ofsemivolatile organics are not high enough. Further studiesare needed to directly parameterize the NO2 reaction withsemivolatile organics in models. The uncertainty of the ef-fective surface used in the WRF-CHEM model may alsoconsiderably influence the simulated HONO levels becausethe ground surface plays an important role in the HONO for-mation in the surface layer. In addition, the HONO forma-tion from NO2 reaction with freshly emitted soot remainshighly uncertain, ranging from 1.3×10¹⁷ to 1018 HONOmolecules mg−1 freshly emitted soot and also depending onthe water content (Kalberer et al., 1999; Arens et al., 2001).
We have performed three experimental studies to evaluatethe sensitivities of HONO concentrations to the parameters inthe above three sources based on the E-case. In the first study,we used a fraction of 0.013 of the emitted NOx to parame-terize NO2 reaction with semivolatile organics in the E-case.The simulated HONO concentrations are decreased by about0.67 ppb or 34% on six-day average at T0 when the fractionof the emitted NOx is reduced from 0.023 to 0.013. In thesecond study, when only the effective surface is increased50% in the E-case, the HONO concentrations are increasedby 0.16 ppb or 8% on average at T0, and the simulations inthe afternoon are improved but overestimations frequentlyoccur in the morning. When the value of 1018 HONO mg−1
of freshly emitted soot is used to calculate the conversion ofNO2 to HONO in the E-case, the HONO concentrations areenhanced by about 0.13 ppb or 7% on average at T0, and theNO2-soot reaction become a non-negligible HONO source.
As discussed above, there are large uncertainties in theHONO simulations due to its poorly understood formationmechanisms, especially during daytime. However, the addi-tional sources in the E-case yield fairly good agreement withthe measurement generally. Hence, based on the parameteri-zation, we will evaluate the impact of HONO sources on thephotochemistry in the following section.
3.3 Impacts on HOx/NOx/O3 chemistry
In the polluted urban atmosphere, the major reactions that areresponsible for the O3 formation can be described as follows(Brasseur et al., 1999):
OH+RH→ R+H2O (R10)
R+O2+M → RO2+M (R11)
Atmos. Chem. Phys., 10, 6551–6567, 2010 www.atmos-chem-phys.net/10/6551/2010/

G. Li et al.: Impacts of HONO sources on the photochemistry in Mexico City 6559
RO2+NO→ RO+NO2 (R12)
RO+O2 → HO2+R′
CHO (R13)
HO2+NO→ OH+NO2 (R14)
2(NO2+hv → NO+O) (R15)
2(O+O2+M → O3+M) (R16)
Overall:
RH+4O2+hv → R′
CHO+H2O+2O3 (R17)
where RH represents non-methane hydrocarbons,R′
CHOdenotes carbonyl products, andR
′
designates an organicfragment having one carbon atom fewer than R. The OHplays a key role in the initialization of the O3 formation pro-cess. The most important primary sources of OH in the pol-luted atmosphere includes the reaction of H2O with O(1D)which comes from the photolysis of O3, the reaction of O3with alkenes and biogenic VOCs-like isoprene and monoter-penes, and the photolysis of HONO. When the additionalHONO sources are considered in the WRF-CHEM model,the OH concentration will be increased to further impact theHO2/RO2 concentration, the NO/NO2 partition, and the O3formation.
Due to the variability and uncertainties of observed HOxthe six-day averaged modeled and observed HOx (2-h av-eraged for OH and 1-h averaged for HO2) at T0 are pre-sented in Fig. 6. Although the WRF-CHEM model followswell the variation of OH concentrations, it underestimatesthe OH concentrations in the late morning and early after-noon, regardless of whether the HONO sources are consid-ered. However, when the HONO sources are accounted for,the simulation of OH concentrations in the E-case substan-tially improves compared to the measurement, especially inthe morning. The E-case yields about 86% of the observedOH concentration averaged during the daytime from 08:00 to18:00 LT; but in the H-case, the simulated OH concentrationis only about 52% of the observation on average. In addition,the HONO sources play a dominant role in the OH concen-tration in the morning, consistent with previous model results(Aumont et al., 2003; Vogel et al., 2003). The inclusion ofthe HONO sources in the WRF-CHEM model also increasesthe HO2 concentrations in the E-case, particularly in the earlymorning and late afternoon, but still underestimates the HO2concentration by a factor of 2 during noontime (Fig. 5b). Onaverage, the E-case produces 55% of the observed HO2 con-centration during the daytime from 08:00 to 18:00 LT, butthe H-case only simulates 34% of the observed HO2 concen-tration. Although the E-case simulates the HOx concentra-tions more consistently with the measurements than the H-case, the modeled HO2 concentrations in the E-case remainabout 45% lower than the observations during daytime, indi-cating either missing radical sources or incomplete chemical
Fig. 6. Influence of the HONO sources on the(a) HO and(b) HO2diurnal cycle at T0 averaged during the 24–29 March 2006. Theblack dots correspond to the observations, and the solid red and bluelines are the simulations in the E-case and H-case, respectively.
mechanism (Hofzumahaus et al., 2009). The underestima-tion of VOC concentrations in the model is able to lead tothe underestimation of HO2 concentrations. It would causean underestimation of the reactivity of OH with VOCs whichin turn would result in an underestimation of peroxy radi-cals. Dusanter et al. (2009b) have calculated a median noon-time OH reactivity of 20–22 s−1 due to VOCs at T0 using abox model, whereas the mean noontime OH reactivity in theWRF-CHEM model is around 16 s−1. Sheehy et al. (2008)reported that, during MCMA-2003, the measured OH reac-tivity at noon was about 20–25 s−1, and the MCM box modelexplained around 20 s−1. Volkamer et al. (2007) also showedthat a significant portion of the HOx sources is from photol-ysis of oxygenated VOCs, which may potentially help re-solve the lack of peroxy radicals. In addition, the uncertain-ties from measurements also need to be taken into accountwhen the comparison is performed between simulations andobservations. Dusanter et al. (2009a) have reported that theaccuracy of the HOx measurements is about 18% (1σ ).
The enhancement of HO2 will increase NO2 concentra-tions and decrease NO concentrations by accelerating the
www.atmos-chem-phys.net/10/6551/2010/ Atmos. Chem. Phys., 10, 6551–6567, 2010

6560 G. Li et al.: Impacts of HONO sources on the photochemistry in Mexico City
Fig. 7. Simulated and observed(a) NO and(b), (c) NO2 at T0 dur-ing the 24–29 March, 2006. The black dots denote the observationand the red and blue lines represent the simulations in the E-caseand H-case, respectively. NO2 measurement in (b) is from Chemi-luminescence and (c) is from LP-DOAS.
conversion from NO to NO2 in the polluted atmosphere.When the four HONO sources are considered, in the earlymorning, the WRF-CHEM model performs well in the simu-lation of the NO concentrations compared with the measure-ment at T0 in the E-case; the NO concentrations are also con-siderably reduced compared to that in the H-case (Fig. 7a).However, the WRF-CHEM model overestimates the NO con-centrations in the late morning and afternoon in both the E-case and H-case, which may be caused by the underestima-tion of HO2 concentrations or other reasons, such as PBLevolution and emission temporal variations. Although thepeak NO2 concentrations in the morning are comparable tothe measurements in the E-case in Fig. 7b and c, the occur-rence of the peak NO2 concentrations is about one hour laterthan the observation. Without the HONO sources, the H-case substantially underestimates the peak NO2 concentra-tions from 27 to 29 March. It is worth noting that, on 25and 26 March, the WRF-CHEM model fails to follow theobserved NO2 variation during the nighttime and also signif-icantly overestimates the observation in the early morning,
Fig. 8. Simulated and observed O3 (a) averaged over all RAMAmonitoring sites and(b), (c) at T0 site during the 24–29 March2006. The black dots denote the observation and the red and bluelines represent the simulations in the E-case and H-case, respec-tively. O3 measurement in (b) is from Chemiluminescence and (c)is from LP-DOAS.
which is probably caused by the failure of boundary layersimulations in these two days.
Figure 8a presents the impact of the HONO sources onthe diurnal variation of near-surface O3 concentrations av-eraged over all monitoring sites from 24 to 29 March 2006.Apparently, the additional HONO sources accelerate the ac-cumulation of O3 concentrations in the morning by about2 h generally in the E-case and subsequently result in around7 ppb enhancement averaged from 08:00 to 14:00 LT. How-ever, during the late afternoon when the HONO sources donot play a dominant role in the OH production and the plumeformed in the morning move out of Mexico City, the O3 in-crease in the E-case become negligible. The 6-day middayaverage of O3 enhancement is about 6 ppb, which is compa-rable to the previous CTM study from Lei et al. (2004) inHouston. They included the HONO source from NO2 con-version on the surfaces of soot aerosol in a CTM and foundthat the HONO source speeds up the build-up of morningO3 concentrations by about 1 h and leads to an appreciable
Atmos. Chem. Phys., 10, 6551–6567, 2010 www.atmos-chem-phys.net/10/6551/2010/

G. Li et al.: Impacts of HONO sources on the photochemistry in Mexico City 6561
Fig. 9. Pattern comparison of simulated vs. observed O3 at 14:00 LT over Mexico City in the E-case (left) and H-case (right) during the24–29 March 2006. Colored dots: observations; color contour: simulations.
increase of the O3 concentration over the course of the daywith a midday average of 7 ppb. In addition, both the E-caseand H-case considerably overestimate the O3 concentrationsin the late afternoon, which is attributed to the slow move-ment of the simulated plume and the overestimation of pho-tolysis rates in the afternoon (Fig. 4). Figures 8b and c showthe comparisons of modeled and observed diurnal variationof O3 concentrations at T0. The results are similar to that atambient monitoring sites, except that inclusion of the HONOsources in the WRF-CHEM model improves the simulationsof peak O3 concentrations. Figure 9 displays the spatial dis-tributions of calculated (in color contours) and observed (incolored dots) near surface O3 concentrations at 14:00 LT inthe E-case and H-case, respectively. In general, the simulatedand observed O3 patterns are well matched, but, clearly, thepredicted plumes moves more slowly than the observation.For example, at 14:00 LT on 27th, the observed plume hasmoved to the north of Mexico City, but part of the modeledplume remains stagnant in the center of the city. Further-more, the HONO sources do not alter the O3 pattern, but con-siderably enhance the O3 level in the center of the plumes.
3.4 Impacts on secondary aerosols
3.4.1 Secondary organic aerosols
In the WRF-CHEM model, a traditional 2-product secondaryorganic aerosol (SOA) module is applied to predict theaerosol distribution and variation. The SOA module accountsfor the SOA formation from the oxidation of six primary or-ganic groups (POG): alkanes, alkenes, cresol, high-yield aro-matics, low-yield aromatics, and monoterpenes. Ten semi-volatile, gaseous SOA precursors (hereafter referred to asto SVOC) are produced via these reactions – two each forolefins, monoterpenes, and aromatics, and one each for alka-nes and cresol.
POG+oxidant→ α1SVOC1+α2SVOC2 (R18)
The oxidants mainly include the OH radical, the nitrate rad-ical NO3, and O3. The saturation vapor pressures and mass-based stoichiometric yield coefficients (αi) of semi-volatileprecursors are obtained from either smog chamber exper-iments or from published estimates in cases where smogchamber data are unavailable. The SOA is calculated us-ing the method developed by Schell et al. (2001), which was
www.atmos-chem-phys.net/10/6551/2010/ Atmos. Chem. Phys., 10, 6551–6567, 2010

6562 G. Li et al.: Impacts of HONO sources on the photochemistry in Mexico City
Fig. 10. Simulated submicron SOA and observed submicron OOAat T0 during the 24–29 March 2006. The black dots denote theobservation and the red and blue lines represent the simulations inthe E-case and H-case, respectively.
based on the absorptive partitioning model of Pankow (1994)that was extended by Odum et al. (1996). When the or-ganic gas/aerosol equilibrium has been established, gas andaerosol-phase concentrations of each SVOC are calculatediteratively using a globally convergent variation of Newton’smethod. Therefore, the enhancement of the oxidants willaugment the production of SVOCs, especially in the morn-ing when the VOCs accumulate in the PBL. The increase ofSVOCs is apt to partition more to aerosol phase and furtherescalate the SOA concentrations.
Figure 10 shows the comparison of submicron modeledSOA and observed OOA diurnal variation at T0. In the morn-ing, the SOA concentrations are substantially enhanced in theE-case compared to the H-case, with an increase of more than100% on average. However, during the rest of the day, the en-hancement of the SOA concentrations is not very significant,particularly during nighttime. The observed OOA exhibitsclearly two peaks around 10:00 and 14:00 LT from 25 to 29.The E-case and H-case replicates reasonably well these twopeaks, but the simulated second peak in the afternoon is notobvious in 25 and 28. Although the E-case yields about 40%more SOA than the H-case averaged in the six days, both theE-case and H-case significantly underestimate the observedOOA concentrations. The E-case produces about 13% of theobserved OOA concentrations from the oxidation of anthro-pogenic precursors, consistent with the previous study per-formed by Volkamer et al. (2006). They reported much largeramounts of SOA formed from reactive anthropogenic VOCsin Mexico City than the estimation from a SOA model basedon empirical parameterization of chamber experiments. Inaddition, although the updated aromatic SOA yields from re-cent chamber experiments (Ng et al., 2007) have been em-ployed in a photochemical box model study by Dzepina etal. (2009), the traditional 2-product SOA model still failsto yield sufficient SOA concentrations to match the obser-vations by a factor of 7. Hodzic et al. (2009) also reportedthat less than 15% of the observed SOA within Mexico City
can be explained by the traditional mechanism based on oxi-dation of anthropogenic precursors.
The large discrepancies between the modeled SOA and ob-served OOA concentrations demonstrate that there are othermechanisms that contribute to the SOA formation, in addi-tion to the one used in this study. Robinson et al. (2007)suggested the formation of SOA from primary semivolatileand intermediate volatility species. Dzepina et al. (2009)have shown that the mechanism can help to close the gapin SOA mass between measurements and models in MexicoCity. Additionally, Volkamer et al. (2007) pointed out thatglyoxal is also a source of SOA. In the future study, we willevaluate the contributions of the above mechanisms to theSOA concentrations.
3.4.2 Inorganic aerosols
The inorganic aerosols are predicted in the WRF-CHEMmodel using ISORROPIA Version 1.7 (http://nenes.eas.gatech.edu/ISORROPIA/). ISORROPIA calculates the com-position and phase state of an ammonium-sulfate-nitrate-chloride-sodium-calcium-potassium-magnesium-water inor-ganic aerosol in thermodynamic equilibrium with gas phaseprecursors. The kind of thermodynamic equilibrium is deli-cately dependent on the environmental humidity and temper-ature. In this study, ISORROPIA is mainly utilized to predictthe thermodynamic equilibrium between the ammonium-sulfate-nitrate-water aerosols and their gas phase precursorsof H2SO4-HNO3-NH3-water vapor. Accordingly, the in-crease of the OH level due to the HONO sources will impactthe inorganic aerosols in the WRF-CHEM model throughvarying H2SO4 and HNO3 concentrations.
Figure 11a provides the diurnal variation of HNO3 con-centrations in the E-case and H-case compared with the mea-surements at T0. In the early morning, the E-case and H-casereproduce well the observed slow accumulation of HNO3concentrations from about 0.01 ppb to 1 ppb, but in the af-ternoon, the WRF-CHEM model overestimates the obser-vation, which is partially caused by the slow movement ofthe simulated plume. The impacts of the HONO sources onthe HNO3 concentrations are insignificant in the morning, al-though the enhancement of the OH concentrations due to theHONO sources is supposed to increase the HNO3 concentra-tions in the E-case. These results indicate that there are suf-ficient NH3 to balance the enhanced HNO3 into the aerosolphase through the thermodynamic equilibrium. Figure 11bshows the comparison of NH3 concentrations between the E-case and H-case at T0. Both the E-case and H-case obtainhigh levels of NH3 concentrations in the morning and theNH3 concentrations in the E-case are also decreased com-pared to that in the H-case. Therefore, as shown in Fig. 12,the particle-phase nitrate and ammonium are significantly en-hanced in the E-case compared to that in the H-case in themorning. The observed particle-phase nitrate and ammo-nium show two peaks around 10:00 and 14:00 LT from 25
Atmos. Chem. Phys., 10, 6551–6567, 2010 www.atmos-chem-phys.net/10/6551/2010/

G. Li et al.: Impacts of HONO sources on the photochemistry in Mexico City 6563
Fig. 11. Same as Fig. 8, except for(a) HNO3 and(b) NH3.
to 29 and the concentrations in the first peak are much higherthan those in the second one. When the HONO sources areconsidered in the E-case, the WRF-CHEM model reason-ably well simulates the first peak but remains underestima-tion from 27 to 29 compared to the observation. In addition,the HONO sources cause overestimation of the first peak on25 and 26. The particle-phase nitrate and ammonium areincreased by almost 100% in the E-case compared to the H-case in the morning, but the enhancement is not significantin the afternoon; the slow movement of plumes also resultsin the overestimation of the particle-phase nitrate and ammo-nium in the late afternoon.
The formation of H2SO4 in the atmosphere through the gasphase reaction of SO2 with OH is not efficient due to the slowreaction rate. Therefore, the enhancement of the OH concen-trations due to the HONO sources cannot efficiently convertSO2 into H2SO4 to increase the sulfate aerosols. Figure 13adisplays the diurnal variations of SO2 concentrations in theE-case and H-case compared with the measurement at T0.The impacts of the HONO sources on the SO2 concentra-tions are negligible and the reduction of SO2 concentrationsin the E-case is less than 1% during the daytime on aver-age in comparison with that in the H-case. The WRF-CHEMmodel basically tracks the observed variation of SO2 concen-trations during the daytime, but fails to reproduce the largefluctuations of the observations during the afternoon and atnight. The impacts of the HONO sources on the sulfate atT0 are also negligible, indicating that the gas phase reactionof SO2 with OH plays a minor role in the sulfate formation(Fig. 13b). Other sources, such as the oxidation of SO2 incloud droplets as well as the transport of direct emissionsof sulfate from the Tula industrial complex and the volcano,may play a key role in the sulfate concentrations in MexicoCity (de Foy et al., 2009).
Fig. 12. Same as Fig. 8, except for submicron(a) nitrate and(b)ammonium aerosols.
Fig. 13. Same as Fig. 8, except for(a) SO2 and (b) submicronsulfate aerosols.
4 Conclusions
The present study investigates the contribution of HONOsources to the photochemistry in Mexico City during theMCMA-2006/MILAGO Campaign using the WRF-CHEMmodel. In addition to the gas phase reaction of NO with OH,four additional HONO sources are considered in the WRF-CHEM model, including secondary HONO formation fromNO2 heterogeneous reaction with semivolatile organics, NO2
www.atmos-chem-phys.net/10/6551/2010/ Atmos. Chem. Phys., 10, 6551–6567, 2010

6564 G. Li et al.: Impacts of HONO sources on the photochemistry in Mexico City
reaction with freshly emitted soot, NO2 heterogeneous re-action on aerosol and ground surfaces. When only the gasphase reaction is considered, the WRF-CHEM model fails topredict the high levels of HONO concentrations observed atT0 by a factor of 10, consistent with previous studies. In con-trast, the WRF-CHEM model with the four additional HONOsources performs well in tracking the diurnal variation of theHONO concentrations, although it frequently underestimatesHONO concentrations in the afternoon. Quantification ofthe contribution from individual sources in the ground levelshows that secondary HONO formation from NO2 hetero-geneous reaction with semivolatile organics is the most im-portant sources in Mexico City, providing about 75% of theHONO formation. The NO2 reaction on ground surfaces alsoplays an important role in the HONO formation, with about18% contribution near the surface. The contributions fromthe NO2 reaction with newly emitted soot and heterogeneousreaction on aerosol surfaces is negligible.
Based on the simulations with only the homogeneous reac-tion and with the additional HONO sources, we evaluate theimpacts of the HONO sources on the HOx/NOx/O3 chem-istry and secondary aerosols. When the additional HONOsources are considered, the WRF-CHEM model significantlyincreases the HOx concentration, yielding better agreementwith the measurements than if only the gas phase reac-tion source is considered. Inclusion of additional HONOsources alters the partition of NO/NO2 and converts moreNO into NO2, particularly in the morning. Although theWRF-CHEM model including the five HONO sources can-not improve the simulations of the occurrence of peak NO2concentrations, it performs quite well in modeling the NOvariability compared to the observations at T0. The HONOsources accelerate the accumulation of O3 concentrations av-eraged over all the ambient monitoring sites in the morningby about 2 h and subsequently lead to a noticeable enhance-ment of O3 concentrations over the course of the day witha midday average of about 6 ppb. The WRF-CHEM modelconsiderably overestimates O3 concentrations in the late af-ternoon whether the additional HONO sources are consid-ered or not, which is mainly caused by the slow movementof the simulated plumes and overestimation of the photolysisrates.
The HONO sources also play a very important role in theformation of secondary aerosols in the morning. The HONOsources substantially enhance the SOA concentrations by afactor of 2 on average in the morning, but contribute lessduring the rest of the day. It is worthy to note that the tradi-tional 2-product SOA mechanism fails to predict high levelsof SOA mass comparable to the observations at T0, whichagrees well with the other studies in Mexico City (Volka-mer et al., 2006; Dzepina et al., 2009; Hodzic et al., 2009).The particle-phase nitrate and ammonium are significantlyenhanced in the morning when all five HONO sources areincluded, and agree better with the measurements at T0 com-pared to the results with only gas phase HONO source. Due
to the inefficient conversion of H2SO4 from SO2 reactionwith OH, the impact of the HONO sources to the sulfateaerosols is negligible.
Generally speaking, the HONO sources play an importantrole in the photochemistry in the morning by enhancing theOH concentration in Mexico City. If the air quality in themorning is of much concern in urban regions, it may be nec-essary to include these HONO sources in air quality models.However, except the gas-phase reaction of NO with OH, theother four HONO sources are all associated with NO2, sothe importance of these four HONO sources is dependent onthe NO2 level, i.e., there is a NOx threshold to activate theimportance of these HONO sources.
Furthermore, it is important to emphasize that the modelperiod is not representative of all the MCMA-2006 cam-paign duration, but rather exemplifies the periods with ele-vated daytime HONO observed in the MCMA, and that dur-ing these periods the formation of secondary pollutants hasa particular sensitivity to HONO concentrations. Addition-ally, meteorological conditions also play a key role in de-termining the accumulation or dispersion of HONO (as wellas other species), also influencing its lifetime via changingchemical processes. Therefore, meteorological conditionssignificantly influence the evaluation of the impact of HONOsources on the photochemistry in the polluted urban atmo-sphere.
Acknowledgements.We are indebted to the large number of peopleinvolved in the MILAGRO field campaign as well as those involvedin long-term air quality monitoring and the emissions inventory inthe Mexico City metropolitan area, which made this study possible.This work was supported by the US National Science Foundation’sAtmospheric Chemistry Program (ATM-0528227) and the MolinaCenter for Energy and the Environment. Acknowledgment is alsomade to the National Center for Atmos. Res., which is sponsoredby the National Science Foundation, for the computing time usedin this research.
Edited by: S. Madronich
References
Acker, K., Moller, D., Auel, R., Wieprecht, W., and Kala, D.:Concentrations of nitrous acid, nitric acid, nitrite and nitrate inthe gas and aerosol phase at a site in the emission zone duringESCOMPTE 2001 experiment, Atmos. Res., 74(1–4), 507–524,2005.
Aiken, A. C., Salcedo, D., Cubison, M. J., Huffman, J. A., DeCarlo,P. F., Ulbrich, I. M., Docherty, K. S., Sueper, D., Kimmel, J.R., Worsnop, D. R., Trimborn, A., Northway, M., Stone, E. A.,Schauer, J. J., Volkamer, R. M., Fortner, E., de Foy, B., Wang, J.,Laskin, A., Shutthanandan, V., Zheng, J., Zhang, R., Gaffney, J.,Marley, N. A., Paredes-Miranda, G., Arnott, W. P., Molina, L. T.,Sosa, G., and Jimenez, J. L.: Mexico City aerosol analysis duringMILAGRO using high resolution aerosol mass spectrometry atthe urban supersite (T0) – Part 1: Fine particle composition and
Atmos. Chem. Phys., 10, 6551–6567, 2010 www.atmos-chem-phys.net/10/6551/2010/

G. Li et al.: Impacts of HONO sources on the photochemistry in Mexico City 6565
organic source apportionment, Atmos. Chem. Phys., 9, 6633–6653, doi:10.5194/acp-9-6633-2009, 2009.
Alicke, B., Platt, U., and Stutz, J.: Impact of nitrous acid photolysison the total hydroxyl radical budget during the Limitation of Ox-idant Production/Pianura Padana Produzione di Ozono study inMilan, J. Geophys. Res., 107, 8196, doi:10.1029/2000JD000075,2002.
Alicke, B., Geyer, A., Hofzumahaus, A., Holland, F., Kon-rad, S., Patz, H. W., Schafer, J., Stutz, J., Volz-Thomas, A.,and Platt, U.: OH formation by HONO photolysis duringthe BERLIOZ experiment, J. Geophys. Res., 108(D4), 8274,doi:10.1029/2001JD000579, 2003.
Ammann, M., Kalberer, M., Jost, D. T., Tobler, L., Rossler, E.,Piguet, D., Gaggeler, H. W., and Baltensperger, U.: Heterge-neous production of nitrous acid on soot in polluted air masses,Nature, 395, 157–160, 1998.
Arens, F., Gutzwiller, L., Baltensperger, U., Gaggeler, H. W., andAmmann, M.: Heterogeneous reaction of NO2 on diesel sootparticles, Environ. Sci. Technol., 35, 2191–2199, 2001.
Aumont, B., Chervier, F., and Laval, S.: Contribution of HONOsources to the NOx/HOx/O3 chemistry in the polluted boundarylayer, Atmos. Environ., 37, 487–498, 2003.
Aumont, B., Madronich, S., Ammann, M., Kalberer, M., Baltens-berger, U., Hauglustine, D., and Brocheton, F.: On the reactionof NO2+ soot in the atmosphere, J. Geophys. Res., 104, 1729–1736, 1999.
Bei, N., de Foy, B., Lei, W., Zavala, M., and Molina, L. T.: Using3DVAR data assimilation system to improve ozone simulationsin the Mexico City basin, Atmos. Chem. Phys., 8, 7353–7366,doi:10.5194/acp-8-7353-2008, 2008.
Bejan, I., Aal, Y. A. E., Barnes, I., Benter, T., Bohn, B., Wiesen,P., and Kleffmann, J.: The photolysis of ortho-nitrophenols: anew gas phase source of HONO, Phys. Chem. Chem. Phys., 8,2028–2035, 2006.
Binkowski, F. S. and Roselle, S. J.: Models-3 Commu-nity Multiscale Air Quality (CMAQ) model aerosol com-ponent: 1. Model description, J. Geophys. Res., 4183,doi:10.1029/2001JD001409, 2003.
Brasseur, G. P., Orlando, J. J., and Tyndall, G. S.: Atmosphericchemistry and global change, Oxford University Press, NewYork, USA, 654 pp., 1999.
Calvert, J. G., Yarwood, G., and Dunker, A. M.: An evaluationof the mechanism of nitrous acid formation in the urban atmo-sphere, Res. Chem. Int., 20(3–5), 463–502, 1994.
Chen, F. and Dudia, J.: Coupling an advancedland-surface/hydrology model with the PennState/NCARMM5modelingsystem. Part I: Model descrip-tion and implementation, Mon. Weather Rev., 129, 569–585,2001.
Clapp, L. J. and Jenkin, M.: Analysis of the relationship betweenambient levels of O3, NO2 and NO as a function of NOx in theUK, Atmos. Environ., 35, 6391–6405, 2001.
de Foy, B., Fast, J. D., Paech, S. J., Phillips, D., Walters, J. T.,Coulter, R. L., Martin, T. J., Pekour, M. S., Shaw, W. J., Kasten-deuch, P. P., Marley, N. A., Retama, A., and Molina, L. T.: Basin-scale wind transport during the MILAGRO field campaign andcomparison to climatology using cluster analysis, Atmos. Chem.Phys., 8, 1209–1224, doi:10.5194/acp-8-1209-2008, 2008.
de Foy, B., Krotkov, N. A., Bei, N., Herndon, S. C., Huey, L. G.,
Martnez, A.-P., Ruiz-Surez, L. G., Wood, E. C., Zavala, M., andMolina, L. T.: Hit from both sides: tracking industrial and vol-canic plumes in Mexico City with surface measurements andOMI SO2 retrievals during the MILAGRO field campaign, At-mos. Chem. Phys., 9, 9599–9617, doi:10.5194/acp-9-9599-2009,2009.
Dudhia, J.: Numerical study of convection observed during thewinter monsoon experiment using a mesoscale two-dimensionalmodel, J. Atmos. Sci., 46, 3077–3107, 1989.
Dusanter, S., Vimal, D., Stevens, P. S., Volkamer, R., and Molina,L. T.: Measurements of OH and HO2 concentrations duringthe MCMA-2006 field campaign – Part 1: Deployment of theIndiana University laser-induced fluorescence instrument, At-mos. Chem. Phys., 9, 1665–1685, doi:10.5194/acp-9-1665-2009,2009a.
Dusanter, S., Vimal, D., Stevens, P. S., Volkamer, R., Molina, L.T., Baker, A., Meinardi, S., Blake, D., Sheehy, P., Merten, A.,Zhang, R., Zheng, J., Fortner, E. C., Junkermann, W., Dubey,M., Rahn, T., Eichinger, B., Lewandowski, P., Prueger, J., andHolder, H.: Measurements of OH and HO2 concentrations dur-ing the MCMA-2006 field campaign: Part 2 – Model compar-ison and radical budget, Atmos. Chem. Phys., 9, 6655–6675,doi:10.5194/acp-9-6655-2009, 2009b.
Dzepina, K., Volkamer, R. M., Madronich, S., Tulet, P., Ulbrich,I. M., Zhang, Q., Cappa, C. D., Ziemann, P. J., and Jimenez, J.L.: Evaluation of recently-proposed secondary organic aerosolmodels for a case study in Mexico City, Atmos. Chem. Phys., 9,5681–5709, doi:10.5194/acp-9-5681-2009, 2009.
Febo, A., De Santis, F., Perrino, C., and Liberti, A.: The study ofthe reaction between nitrogen oxides and water vapor by meansof annular denuder tubes, in Tropospheric NOx Chemistry-GasPhase and Multiphase Aspects, CEC Air Pollut. Res. Rep. 9,Nielsen & Cox, Rosklide, Denmark, 61–67, 1987.
Febo, A., Perrino, C., and Allegrini, I.: Measurement of nitrousacid in Milan, Italy, by DOAS and diffusion denuders, Atmos.Environ., 30, 3599–3609, 1996.
Grell, G. A., Peckham, S. E., Schmitz, R., McKeen, S. A., Wilczak,J., and Eder, B.: Fully coupled “online” chemistry within theWRF model, Atmos. Environ., 39, 6957–6975, 2005.
George, C., Strekowski, R. S., Kleffmann, J., Stemmler, K., andBencze, L.: Photoenhanced uptake of gaseous NO2 on solid or-ganic compounds: A photochemical source of HONO?, FaradayDiscuss, 130, 195–210, 2005.
Guenther, A., Karl, T., Harley, P., Wiedinmyer, C., Palmer, P. I.,and Geron, C.: Estimates of global terrestrial isoprene emissionsusing MEGAN (Model of Emissions of Gases and Aerosols fromNature), Atmos. Chem. Phys., 6, 3181–3210, doi:10.5194/acp-6-3181-2006, 2006.
Guenther, A.: Corrigendum to “Estimates of global terrestrialisoprene emissions using MEGAN (Model of Emissions ofGases and Aerosols from Nature)” published in Atmos. Chem.Phys., 6, 3181–3210, 2006, Atmos. Chem. Phys., 7, 4327–4327,doi:10.5194/acp-7-4327-2007, 2007.
Gutzwiller, L., Arens, F., Baltensperger, U., Gaggeler, H. W., andAmmann, M.: Significance of semivolatile diesel exhaust organ-ics for secondary HONO formation, Environ. Sci. Technol., 36,677–682, 2002.
Harris, G. W., Carter, W. P. L., Winer, A. M., Pitts Jr., J. N., Platt, U.,and Perner, D.: Observation of nitrous acid in the Los Angeles
www.atmos-chem-phys.net/10/6551/2010/ Atmos. Chem. Phys., 10, 6551–6567, 2010

6566 G. Li et al.: Impacts of HONO sources on the photochemistry in Mexico City
atmosphere and implications for predictions of ozone-precursorrelationships, Environ. Sci. Technol., 16, 414–419, 1982.
Harrison, R. M., Peak, J. D., and Collins, G. M.: Tropospheric cycleof nitrous acid, J. Geophys. Res., 101, 14429–14439, 1996.
Hess, P. G., Flocke, S., Lamarque, J. F., Barth, M. C., andMadronich, S.: Episodic modeling of the chemical structure ofthe troposphere as revealed during the spring MLOPEX 2 inten-sive, J. Geophys. Res., 105, 26809–26839, 2000.
Hofzumahaus, A., Rohrer, F., Lu, K., Bohn, B., Brauers, T., Chang,C., Fuchs, H., Holland, F., Kita, K., Dondo, Y., Li, X., Lou, S.,Shao, M., Zeng, L., Wahner, A., and Zhang, Y.: Amplified tracegas removal in the troposphere, Science, 324, 1702–1704, 2009.
Horowitz, L. W., Walter, S., Mauzerall, D. L., et al.: A global simu-lation of tropospheric ozone and related tracers: Description andevaluation of MOZART, version 2, J. Geophys. Res., 108(D24),4784, doi:10.1029/2002JD002853, 2003.
Hodzic, A., Jimenez, J. L., Madronich, S., Aiken, A. C., Bessag-net, B., Curci, G., Fast, J., Lamarque, J.-F., Onasch, T. B., Roux,G., Schauer, J. J., Stone, E. A., and Ulbrich, I. M.: Modelingorganic aerosols during MILAGRO: importance of biogenic sec-ondary organic aerosols, Atmos. Chem. Phys., 9, 6949–6981,doi:10.5194/acp-9-6949-2009, 2009.
Jenkin, M. E., Cox, R. A., and Williams, D. J.: Laboratory studies ofthe kinetics of formation of nitrous acid from the thermal reactionof nitrogen dioxide and water vapor, Atmos. Environ., 22, 487–498, 1988.
Kalberer, M., Ammann, M., Arens, F., Gaggeler, H. W., andBaltensperger, U.: Heterogeneous formation of nitrous acid(HONO) on soot aerosol particles, J. Geophys. Res., 104, 13825–13832, 1999.
Kleffmann, J., Becker, K. H., and Wiesen, P.: heterogeneous NO2conversion process on acid surfaces: possible atmospheric impli-cations, Atmos. Environ., 32, 2721–2729, 1998.
Kleffmann, J., Becker, K. H., Lackhoff, M., and Wiesen, P.: Het-erogeneous conversion of NO2 and HONO on carbonaceous sur-faces, Phys. Chem. Phys., 1, 5443–5450, 1999.
Kleffmann, J., Lorzer, J. C., Wiesen, P., Kern, C., Trick, S., Volka-mer, R., Rodenas, M., and Wirtz, K.: Intercomparison of theDOAS and LOPAP techniques for the detection of nitrous acid(HONO), Atmos. Environ., 40, 3640–3652, 2006.
Kleffmann, J.: Daytime sources of nitrous acid (HONO) in the at-mospheric boundary layer, Chem. Phys. Chem., 8, 1137–1144,2007.
Kotamarthi, V. R., Gaffney, J. S., Marley, N. A., and Doskey, P.V.: Heterogeneous NOx chemistry in the polluted PBL, Atmos.Environ., 35, 4489–4498, 2001.
Kurtenbach, R., Becker, K. H., Gomes, J. A. G., Kleffmann, J.,Lorzer, J. C., Spittler, M., Wiesen, P., Ackermann, R., Geyer,A., and Platt, U.: Investigations of emissions and heterogeneousformation of HONO in a road traffic tunnel, Atmos. Environ., 35,3385–3394, 2001.
Lammel, G. and Cape, J. N.: Nitrous acid and nitrite in the atmo-sphere, Chem. Soc. Rev., 25, 361–369, 1996.
Lammel, G. and Perner, D.: The atmospheric aerosols as a sourceof nitrous acid in the polluted troposphere, J. Aerosol Sci., 19,1199–1202.
Li, G., Zhang, R., Fan, J., and Tie, X.: Impacts of black carbonaerosol on photolysis and ozone, J. Geophys. Res., 110, D23206,doi:10.1029/2005JD005898, 2005.
Lei, W., Zhang, R., Tie, X., and Hess, P.:, Chemical characterizationof ozone formation in the Houston-Galveston area, J. Geophys.Res., 109, D12301, doi:10.1029/2003JD004219, 2004.
Lin, Y.-L., Farley, R. D., and Orville, H. D., Bulk parameterizationof the snow field in a cloud model, J, Appl, Meteorol,, 22, 1065–1092, 1983.
Merten, A.: New design of Long path-DOAS instruments based onfibre optics and applications in the study of the urban atmosphere,Thesis, Heidelberg Univ., Germany, 2008.
Mlawer, E. J., Taubman, S. J., Brown, P. D., Iacono, M. J., andClough, S. A.: Radiative transfer for inhomogeneous atmo-sphere: RRTM, a validated correlated-k model for the long-wave,J. Geophys. Res., 102(D14), 16663–16682, 1997.
Molina, L. T., Madronich, S., Gaffney, J. S., and Singh, H. B.:Overview of MILAGRO/INTEX-B Campaign, IGAC Newslet-ter, Issue No. 38, pp. 2–15, 2008.
Molina, L. T., Madronich, S., Gaffney, J. S., Apel, E., de Foy,B., Fast, J., Ferrare, R., Herndon, S., Jimenez, J. L., Lamb,B., Osornio-Vargas, A. R., Russell, P., Schauer, J. J., Stevens,P. S., and Zavala, M.: An overview of the MILAGRO 2006campaign: Mexico City emissions and their transport andtransformation, Atmos. Chem. Phys. Discuss., 10, 7819–7983,doi:10.5194/acpd-10-7819-2010, 2010.
Monge, M. E., D’Anna, B., Mazri, L., Giroir-Fendler, A., Am-mann, M., Donaldson, D. J., and George, C.: Light changes theatmospheric reactivity of soot, Proc. Natl. Acad. Sci., 107, 6605–6609, 2010.
Ndour, M., D’Anna, B., George, C., Ka, O., Balkanski, Y.,Kleffmann, J., Stemmler, K., and Ammann, M.: Photoen-hanced uptake of NO2 on mineral dust: Laboratory experimentsand model simulations, Geophys. Res. Lett., 35(5), L05812,doi:10.1029/2007GL032006, 2008.
Ng, N. L., Kroll, J. H., Chan, A. W. H., Chhabra, P. S., Flagan,R. C., and Seinfeld, J. H.: Secondary organic aerosol formationfrom m-xylene, toluene, and benzene, Atmos. Chem. Phys., 7,3909–3922, doi:10.5194/acp-7-3909-2007, 2007.
Noh, Y., Cheon, W. G., and Raasch, S.: The improvement of the K-profile model for the PBL using LES. Preprints, Int. Workshop ofNext Generation NWP Models, Seoul, South Korea, Laboratoryfor Atmospheric Modeling Research, 65–66, 2001.
Odum, J. R., Hoffman, T., Bowman, F., Collins, D., Flagan, R.C., and Seinfeld, J. H.:, Gas/particle partitioning and secondaryorganic aerosol yields, Environ. Sci. Technol., 30, 2580–2585,1996.
Olaguer, E. P., Rappengluck, B., Lefer, B., Stutz, J., Dibb, J., Grif-fin, R., Brune, W. H., Shauck, M., Buhr, M., Jeffries, H., Vizuete,W., and Pinto, J. P.: Deciphering the Role of Radical Precursorsduring the Second Texas Air Quality Study, J. Air Waste Manage.Assoc., 59, 1258–1277, 2009.
Pankow, J. F.: An absorption model of gas/particle partitioning in-volved in the formation of secondary organic aerosol, Atmos.Environ., 28, 189–193, 1994.
Robinson, A. L., Donahue, N. M., Shrivastava, M. K., Weitkamp, E.A., Sage, A. M., Grieshop, A. P., Lane, T. E., Pandis, S. N., andPierce, J. R.: Rethinking organic aerosols: semivolatile emis-sions and photochemical aging, Science, 315, 1259–1262, 2007.
Saliba, N. J., Mochiba M., and Finlayson-Pitts, B. J.: Laboratorystudies of sources of HONO in polluted urban atmospheres, Geo-phys. Res. Lett., 27, 3229–3232, 2000.
Atmos. Chem. Phys., 10, 6551–6567, 2010 www.atmos-chem-phys.net/10/6551/2010/

G. Li et al.: Impacts of HONO sources on the photochemistry in Mexico City 6567
Schell, B., Ackermann, I. J., Hass, H., Binkowski, F. S., and EbelA.: Modeling the formation of secondary organic aerosol withina comprehensive air quality modeling system, J. Geophys. Res.,106, 28275–28293, 2001.
Svensson, R., Ljungstrom, E., and Lindquist, O.: Kinetics of thereaction between nitrogen dioxide and water vapour, Atmos. En-viron., 21, 1529–1539, 1987.
Skamarock, W. C., Klemp, J. B., Dudhia, J., Gill, D. O., Barker,D. M., Wang, W., and Powers, J. G.: A description of the Ad-vanced Research WRF Version 2, NCAR Tech Notes-468+STR,National Center for Atmos. Res., Boulder, CO, USA, 100 pp.,2005.
Song, J., Lei, W., Bei, N., Zavala, M., de Foy, B., Volkamer, R.,Cardenas, B., Zheng, J., Zhang, R., and Molina, L. T.: Ozoneresponse to emission changes: a modeling study during theMCMA-2006/MILAGRO Campaign, Atmos. Chem. Phys., 10,3827–3846, doi:10.5194/acp-10-3827-2010, 2010.
Staffelbach, T., Neftel, A., and Horowitz, L. W.: Photochemicaloxidant formation over southern Switzerland. 2. Model results,J. Geophys. Res., 102, 23363–23373, 1997.
Sheehy, P. M., Volkamer, R., Molina, L. T., and Molina, M. J.:Oxidative capacity of the Mexico City atmosphere – Part 2: AROx radical cycling perspective, Atmos. Chem. Phys. Discuss.,8, 5359–5412, 2008.
Stemmler, K., Ammann, M., Donders, C., Kleffmann, J., andGeorge, C.: Photosensitized reduction of nitrogen dioxide on hu-mic acid as a source of nitrous acid, Nature, 440, 195–198, 2006.
Stemmler, K., Ndour, M., Elshorbany, Y., Kleffmann, J., D’Anna,B., George, C., Bohn, B., and Ammann, M.: Light induced con-version of nitrogen dioxide into nitrous acid on submicron humicacid aerosol, Atmos. Chem. Phys., 7, 4237–4248, 2007.
Stutz, J., Kim, E. S., Platt, U., Bruno, P., Perrino, C., and Febo, A.:UV-invisible absorption cross section of nitrous acid, J. Geophys.Res., 105(D11), 14585–4592, 2000.
Tie, X., Madronich, S., Walters, S., Zhang, R., Rasch, P.,and Collins, W.: Effect of clouds on photolysis and oxi-dants in the troposphere, J. Geophys. Res., 108(D20), 4642,doi:10.1029/2003JD003659, 2003.
Tie, X., Madronich, S., Li, G., Ying, Z., Zhang, R., Garcia, A. R.,Taylor, L., and Liu, Y.: Characterizations of chemical oxidantsin Mexico City: A regional chemical dynamical model (WRF-Chem) study, Atmos. Environ., 41, 1989–2008, 2007.
Vogel, B., Vogel, H., Kleffmann, J., and Kurtenbach, R.: Measuredand simulated vertical profiles of nitrous acid—Part II. Modelsimulations and indications for a photolytic source, Atmos. Env-iron., 37, 2957–2966, 2003.
Volkamer, R., Jimenez, J. L., San Martini, F., Dzepina, K., Zhang,Q., Salcedo, D., Molina, L. T., Worsnop, D. R., and Molina, M.J.: Secondary organic aerosol formation from anthropogenic airpollution: Rapid and higher than expected, Geophys. Res. Lett.,33(17), L17811, doi:10.1029/2006GL026899, 2006.
Volkamer, R., Sheehy, P. M., Molina, L. T., and Molina, M. J.: Ox-idative capacity of the Mexico City atmosphere – Part 1: A rad-ical source perspective, Atmos. Chem. Phys. Discuss., 7, 5365–5412, doi:10.5194/acpd-7-5365-2007, 2007.
Wesely, M. L.: Parameterization of surface resistance to gaseousdry deposition in regional-scale numerical models, Atmos. Env-iron., 23, 1293–1304, 1989.
Willmott, C. J. and Wicks, D. E.: An empirical method for thespatial interpolation of monthly precipitation within California,Phys. Geogr., 1, 59–73, 1980.
Winer, A. M. and Biermann, H. W.: Long pathlength differen-tial optical absorption spectroscopy (DOAS) measurements ofgaseous HONO, NO2 and HCHO in the California South CoastAir Basin, Res. Chem. Intermed., 20, 423–445, 1994.
Zavala, M., Herndon, S. C., Wood, E. C., Jayne, J. T., Nelson, D.D., Trimborn, A. M., Dunlea, E., Knighton, W. B., Mendoza, A.,Allen, D. T., Kolb, C. E., Molina, M. J., and Molina, L. T.: Com-parison of emissions from on-road sources using a mobile lab-oratory under various driving and operational sampling modes,Atmos. Chem. Phys., 9, 1–14, doi:10.5194/acp-9-1-2009, 2009.
Zhang, R., Leu, M.-T., and Keyser, L. F., Heterogeneous chemistryof HONO on liquid sulfuric acid: A new mechanism of chlorineactivation on stratospheric sulfate aerosols, J. Phys. Chem., 100,339–345, 1996.
Zheng, J., Zhang, R., Fortner, E. C., Volkamer, R. M., Molina, L.,Aiken, A. C., Jimenez, J. L., Gaeggeler, K., Dommen, J., Du-santer, S., Stevens, P. S., and Tie, X., Measurements of HNO3and N2O5 using ion drift-chemical ionization mass spectrometryduring the MILAGRO/MCMA-2006 campaign, Atmos. Chem.Phys., 8, 6823–6838, doi:10.5194/acp-8-6823-2008, 2008.
Zhou, X., Beine, H. J., Honrath, R. E., Fuentes, J. D., Simpson, W.,Shepson, P. B., and Bottenheim, J. W.: Snowpack photochem-ical production of HONO: A major source of OH in the arcticboundary layer in springtime, Geophys. Res. Lett., 28, 4087–4090, 2002.
www.atmos-chem-phys.net/10/6551/2010/ Atmos. Chem. Phys., 10, 6551–6567, 2010