impacts of improved bean varieties on food security in...
TRANSCRIPT
Impacts of Improved Bean Varieties on Food Security in Rwanda
Catherine Larochelle, Virginia Tech, [email protected] Jeffrey Alwang, Virginia Tech, [email protected]
Selected Paper prepared for presentation at the Agricultural & Applied Economics Association’s2014 AAEA Annual Meeting, Minneapolis, MN, July 27-29, 2014.
Copyright 2014 by Catherine Larochelle and Jeffrey Alwang. All rights reserved. Readers may make verbatim copies of this document for non-commercial purposes by any means, provided that
this copyright notice appears on all such copies.

1
Impacts of Improved Bean Varieties on Food Security in Rwanda
Introduction
Common bean (Phaseolus vulgaris) is an important subsistence crop for
smallholding farmers in Rwanda. It is often referred to as the meat of the poor because of
its high protein content and affordability. Beans are also vital sources of micronutrients
such as iron, reducing iron deficiency caused by the lack of diversity in the starch-based
diets of the poor. Rwanda has one of the highest per capita bean consumption in the
world (Kalyebara and Buruchara, 2008), confirming that bean is a key crop for food
security. Beans provide 32 and 65 percent of calories and protein intake in the Rwandan
diet, whereas protein sourced from animal provides only 4 percent of the protein intake
(Asare-Marfo, et al., 2011, CIAT, 2004).
Previous studies have found that nearly all rural households in Rwanda cultivate
beans (Asare-Marfo, et al., 2011, Larochelle, et al., 2013). Beans are grown twice a year
in many farming systems. They are intercropped with banana, cassava, maize, peas, and
others, and grown in different agro-ecological conditions. To accommodate this
environmental diversity, two bean technologies are available to farmers-- bush and
climbing beans. Climbing beans grow vertically, requiring staking material, and are
harvested over a more continuous period compared to bush beans. This vertical growth
property confers climbing beans a yield advantage over bush beans and makes them less
likely to be intercropped.
Rwanda's ability to move from a position off net importer, to self-sufficiency, and
exporters of dry beans is due to the spread of high yielding varieties combined with a

2
shift from bush to climbing bean cultivation. Important research efforts have been
devoted to select, breed, and disseminate new bean varieties that enhance the productivity
and quality of food crops, alleviating poverty and food insecurity. In Rwanda, bean is the
crop that receives the most research attention, followed by sweet potato and banana
(Karangwa, 2007). The bean research program at Rwanda Agriculture Bureau (RAB),
formally Institut des Sciences Agronomiques du Rwanda (ISAR), in collaboration with
international partners such as International Center for Tropical Agriculture (CIAT) and
HarvetPlus, has released nearly 100 bean varieties over the last four decades (PABRA,
2012, RAB, 2012)
Adoption and benefits from improved beans varieties in Rwanda is documented
in Johnson, et al. (2003). According to that source, 15 percent of bean area was planted to
CIAT-related varieties. The yield gain of these varieties over local ones is estimated to
be at 900 kg/ha. This high productivity gain is partially attributed to a shift from bush to
climbing beans in northern Rwanda. This yield gain contributes to an annual incremental
production of 28,888 tons of a gross annual value of US$8.7 million (Johnson, et al.,
2003).
Since adoption and impacts of improved varieties released prior to 1998 are
documented in Johnson, et al. (2003), we focus on bean varieties released from 1998
until 20101
1 Data collection took place in 2011 and no varieties were released in 2011 in both Rwanda and Uganda, making 2010 the obvious upper bound.
. According to Pan-Africa Bean Research Alliance (PABRA) database, 46
improved bean varieties were released in Rwanda between 1998 and 2010. This
represents multiple millions of dollars invested in bean research, but very little is known
about their impacts--whether these improved varieties are widely adopted and their
3
distributional impacts on the poor. Policy makers and donors need information on these
impacts to allocate resources to fruitful lines of research and to strengthen the role of
agricultural research in fighting poverty, hunger, and malnutrition. This study assesses
the impact of improved bean varieties2
International organizations and governments expect improved varieties to
alleviate malnutrition and hunger, but, to date, impact assessment studies have mainly
focused on productivity and aggregate welfare measures. Fewer studies document the
impact of technology adoption on household food security (
on food security among rural households in
Rwanda and Uganda
Kabunga, et al., 2014,
Rusike, et al., 2010, Shiferaw, et al., 2014). Various reasons explain the limited number
of studies on food security. Nutrition is one of the last outcomes to be affected along the
long adoption impact pathway (Chung, 2012). Because of the important lag between
adoption and improvement in nutritional status, one might fail to detect impact.
Moreover, measuring food security, due to its multidimensionality, is challenging and
consensus on the methodology to use is lacking (Barrett, 2010, Coates, 2013). Traditional
approaches to measuring food security such as caloric intake and anthropometric
indicators require extensive and costly data collection. Significant efforts have recently
been devoted to the development and validation of new measures of food security (e.g. at
IFPRI and Tufts University) As a result, a growing numbers of low-cost indicators of
household food security are now available to researchers.
For example, Kabunga, et al. (2014) used the Household Food Insecurity Access
Scale (HFIAS) to assess the impact of tissue culture banana technology on food security
2 This study focuses on bean varieties released since 1998 because adoption and benefits of varieties released prior to 1998 are documented in Johnson, et al. (2003).

4
in Kenya. This measure of food security is based on household's own perception of
access to food and is captured through nine questions reflecting anxiety and uncertainty
about food supply, food quality, and food quantity. The authors found that adoption of
tissue culture technology significant and positively contribute to household farm income,
total income, and food security. Shiferaw, et al. (2014) use food consumption
expenditures and household subjectivity of their food security situation to examine the
impact of improved wheat varieties on rural household food security in Ethiopia.
Household assessment of their food security is based on only one question. The adoption
effect for adopters is a 2.7 percentage point increase in food consumption expenditures. If
non-adopters were to adopt improved wheat varieties, their food consumption
expenditures would raise on average by 4.5 percentage points.
This study adds to the thin literature on food security impacts of technology
adoption by rigorously documenting the linkages between adoption of improved bean
varieties and household dietary diversity. Dietary diversity has been widely used in the
literature as indicators of nutritional adequacy; to our knowledge, this is the first study
using such an indicator within an impact assessment study framework.
Data and descriptive analysis
Data collection and sampling design
This study is based on a major effort3
3 This study was conducted under the Diffusion and Impact of Improved Varieties in Africa (DIIVA) project and targeted crops in Rwanda are beans, potatoes, and sweet potatoes. Collaborators in this study include CIAT, CIP, RAB, and Virginia Tech.
to document bean varietal adoption and its
technological impacts. A nationally representative rural farm household survey was
5
carried in 2011. Data gathered cover the cropping season that ran from March to
July/August 2011, which is locally referred as cropping season B4
Due to the length of the questionnaire, respondents were interviewed twice over
the cropping season. This methodology also helped reduce potential recall bias. Covering
the same season, the first round of data was collected following planting activities while
the second round began after the completion of harvest and marketing. The first visit
prepared respondents for the subsequent one and encouraged the careful keeping of plot-
specific records. In the second round, in addition to complementing the household
survey, a consumption and community questionnaire were administrated. About half of
the households were interviewed about their consumption expenditures. The respondents
– usually the person preparing and cooking the food – were asked to recall household
food consumption over a 7-day period. This includes food purchased, home-produced or
received as a gift or in-kind payment by any household member. The consumption
questionnaire also included questions on food consumed away from home, non-food
expenditure over the last 30 days, and rent, and land expenditure.
. An extensive
household questionnaire collected information on household and housing characteristics;
household production and consumer assets; social networks; farmer knowledge and
adoption of improved bean varieties; production activities including land areas, inputs
used and yields; market access and participation; food security; and access to agricultural
input supplies.
The community questionnaire, administered through focus group interviews,
gathered information on village characteristics, market access, crop prices, and
4 In Rwanda, Season B corresponds to the second harvest of a given year.

6
agriculture practices. It also included questions around issues such as access to extension
specialists, input distributors, the presence of seed distribution programs, seed
availability, cultivar changes, and agro-climatic shocks. One purpose of the community
questionnaire was to collect information that could explain varietal adoption patterns
without affecting our outcomes of interest.
A random stratified sampling procedure combined to probability proportionate to
population method was used to identify the respondents. The first stage consisted of
stratifying the sample based on the country ten major agro-ecological zones. Then,
probability weights were computed for each zone based on total village population.
Eighty villages were randomly sampled based on these population weighted probabilities.
Selected villages are distributed across 27 out of the country 30 districts. The final step
was to randomly select 18 households to be interviewed in each village, giving a total
sample size of 1,440 households5
In order to determine which households to interview for the consumption
questionnaire
.
6
Identifying adopters
, the sample was divided after the first round of data collection into two
groups: adopters and non-adopters of improved varieties. Then, in each village, a
maximum of five households were randomly selected to represent each group. Focusing
only on bean growers interviewed for food consumption expenditures results in a sample
size of 654 households.
5 Out of the total sample size, about 1,300 households produce beans. 6 The full consumption questionnaire took 30–40 minutes to complete, and the choice of only administering the questionnaire to half of the survey was based on time and resource constraints.

7
In order to identify adopters of improved bean varieties, we worked in
collaboration with national (RAB) and international partners (CIAT and HarvestPlus).
Several experts reviewed the list of bean varieties reported by farmers and identified
official and local names--as given by farmers--for improved varieties. A household is
considered to be an adopter if improved varieties were planted for the season under
consideration. Since some farmers cultivate a mixture of varieties for reasons such as risk
mitigation and preferences, adoption can also be measured as a continuum. The
sensitivity and robustness of the results to the definition of adopters is explored in this
study by comparing binary to continuous treatment effects of adoption on food security.
An alternative measure of adoption could be the share of bean area planted with
improved seeds. Due to difficulties in correctly measuring plot size, we consider that the
quantity of improved seeds (in kg) planted over the total quantity of bean seeds planted to
be a more accurate representation of the intensity of adoption. Since farmers in Rwanda
plant bean seeds at similar densities, despite variation in varieties, the share of improved
seeds planted should be a good proxy for the share of bean land under improved varieties.
Descriptive analyses
About 26 percent of bean-producing households in Rwanda are adopters of
improved bean varieties. Among those, 15 percent are considered partial-adopters and 11
percent full-adopters. The density of the share of improved seeds planted for partial
adopters is provided in Figure 1. Fewer households are located at the extremities of the
distribution and the distribution peaks where the share of improved seeds planted ranges
between 50 and 60 percent.

8
Descriptive statistics on household and farm characteristics disaggregated by
adoption status are presented in table 1. None of the variables reflecting household
characteristics is statistically different between adopters and non-adopters. The majority
of households (74 percent) are male-headed and the average age for the household head is
46 years. Twenty-seven percent of household heads have no formal education while 68
and 5 percent, respectively, have achieved some primary and secondary education. The
average household size is 5.17 members and has 0.92 dependents per working-age adult
member. A wealth index 7
When it comes to farm characteristics, some differences are observed between
adopters and non-adopters of improved bean varieties. In terms of farmland owned per
household member, there is no statistically difference between the two groups. However,
the amount of land cropped for adopting households (1.34 ha) is greater than for
households that do not cultivate improved bean varieties (0.9 ha). Similarly, land cropped
per household member is also greater among adopters compared to non-adopters (0.31 vs.
0.20 ha). Livestock ownership in Tropical Livestock Unit (TLU
reveals that household socio-economic status is similar
between adopters and non-adopters.
8
), is 0.95 for adopters
compared to 0.78 for non-adopters; this gap is statistically different at the 10 percent
level. The descriptive statistics suggest that adopters of improved bean varieties might be
more involved in farming activities than non-adopters. However, the count of agricultural
equipment owned per household does not differ significantly by adoption status.
7 The wealth index is estimated using Polychoric PCA and include the following: household ownership of durable goods, housing characteristics, and access to sanitation. (Larochelle et al., 2014) 8 Tropical livestock unit (TLU) is a measure of livestock equivalent. Conversion factors are based of the FAO definition of TLU where the base is the camel, i.e. the camel=1. The 250 kg live weight relevant conversion factors for this analysis are cattle=0.7, pig=0.2, sheep=goat=0.1 and poultry=0.01.

9
Measuring food security
Household food security is assessed based on household diet diversity. More
diverse diets are positively correlated with greater energy intakes, better macro and
micronutrient adequacies, and more favorable anthropometric measures in adults and
children (Arimond, et al., 2010, Hoddinott and Yohannes, 2002, Kennedy, et al., 2011,
Kennedy, et al., 2007, Ruel, 2003, Smith and Subandoro, 2007, Steyn, et al., 2006,
Swindale and Bilinsky, 2006). Diet diversity is usually measured as the count of the
number of food items or food groups consumed over a predetermined period of time
(Ruel, 2003). Measures of dietary diversity based on the number of food groups
consumed, rather than food items, are likely to more accurately reflect the diversity of
macro and micronutrient intakes. Diets consisting of a limited number of food items,
especially starchy staples, can lack the macro and micronutrient adequacy despite
meeting calorie requirements (Kennedy, et al., 2011).
This study uses the Household Dietary Diversity Score (HDDS). HDDS is a
simple and easily administered method and classifies each food item consumed by the
household into twelve different food groups 9
We hypothesize that the adoption of improved beans can lead to greater diet
diversity and improved food security through various channels. First, adoption is
. A food group is counted only once,
regardless of the number of times it was consumed over the last seven days, our reference
period. This means that the HDDS ranges for a minimum of one and to a maximum of
12. A high HDDS reflects a diverse diet and suggests food security while a low HDDS is
indicative of food insecurity.
9 The 12 food groups are: 1.Cereals, 2.Roots and tubers, 3.Vegetables, 4.Fruits, 5.Meat and poultry, 6.Eggs, 7.Fish and seafood, 8.Pulses, legumes and nuts, 9.Milk and milk products, 10.Oil and fats, 11.Sugar and honey, and 12.Spices, condiments, and beverages.

10
expected to have a direct and position impact on farm income. As a result of this income
growth, we expect a shift away from staples and greater consumption of meat, dairy
products, fresh fruits and vegetables. In low-income countries such as Rwanda, a large
share of income is spent on food and food consumption is highly responsive to changes in
income. Thus, food consumption patterns should adjust quickly to income growth by
moving from a staples-based diet and more towards a diverse diet. Moreover, income
increases can enable precautionary savings and allow the household to take steps to
insure itself against food-related shocks (Alwang, et al., 2001). Second, adoption of
improved varieties, through higher yield, can indirectly affect food consumption patterns
and food security through changes in production patterns. This pathway is complex and
depends on factors such as household structure and market orientation. For a household
involved in the bean market as seller, adoption of improved varieties might result in more
land being allocated towards bean production, augmenting the income effect of adoption
on food security. Because of greater bean production due to adoption of improved
varieties, a household might move land away from bean towards a more diverse
production system. This substitution effect is expected to improved food security as
greater agricultural production diversity should lead to greater diet diversity (Jones, et al.,
2014). The direction of changes in production patterns following adoption is unclear, but
the expected effects (either income or substitution) should lead to improved diet and food
security among rural households.
Identifying food secure households
In order to distinguish between different levels of food security, the following cut-
off values are set for the HDDS. Households consuming less than 6 food groups are
11
considered to be food insecure; those consuming 6 to 9 food groups are moderately food
secure; and those consuming more than 9 food groups are food secure10
The mean HDDS in rural Rwanda is 7.36 food groups, with a minimum and
maximum of 3 and 12 food groups. Based on the HDDS benchmarks discussed above, 13
percent of bean-producing households are considered food insecure, 75 percent
moderately food secure, and 12 percent food secure (table 2). Regardless of the adoption
measure considered, HDDS is always significantly greater for adopters compared to non-
adopters. Households that do not cultivate improved bean varieties have a HDDS of 7.24
food groups compared to 7.71 for those adopting improved bean varieties. As a result,
food insecurity is significantly more prevalent among non-adopters (14.67 percent) than
adopters (9.41 percent). Distinguishing between full- and partial-adopters reveals that
full-adopters have greater HDDS than partial-adopters (7.79 vs. 7.64), and both scores are
statistically higher than the average score of non-adopters. There is also a clear
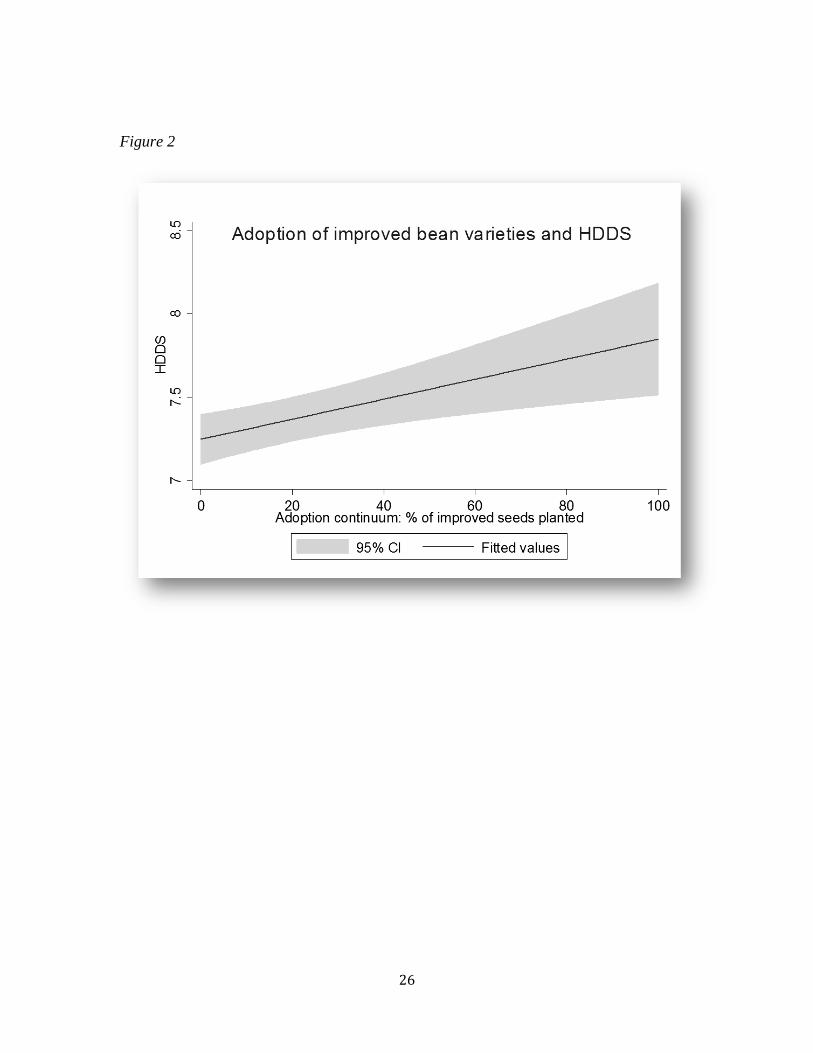
relationship, depicted in Figure 2, between the percent of improved seeds planted, our
continuous measure of adoption, and measured diet diversity. As the share of improved
seeds planted raises, HDDS increases.
.
Econometric framework and estimation strategies
The main challenge in assessing the impact of technological adoption using
observational data is selectivity bias. Selectivity is likely to arise when the technology is
not introduced at random because observable and unobservable factors affecting the
10 There are no set benchmarks for the HDDS. Despite the existence of cut-off values suggested for the Food Consumption Score (World Food Program), caution is appropriate regarding their universal use. The cut-off values must be set in light of the country- specific context, food consumption patterns, and the reference period. Using the cut-off values specified above results in food insecurity statistics similar as those reported by the World Food Program, bringing confidence in our measure of food insecurity(WFP, 2009).

12
adoption decision are likely to be correlated with the outcomes of interest. The magnitude
of the bias depends on the importance of the unobservable factors and their correlations
across decisions and outcomes (de Janvry, et al., 2011). Bias complicates identification of
the treatment effect—the causal impact of adoption on the outcome.
In order to correctly identify the casual impacts of improved varieties on
household food security, the endogenous nature of the adoption decision must be
carefully addressed. Econometric techniques to achieve this include instrumental
variables (IV) and propensity score matching (PSM) methods. PSM controls for
observable factors that simultaneously affect both the adoption decision and outcome of
interest. However, if unobservable variables are also believed to influence the adoption
decision and outcomes of interest, PSM will fail to establish a valid counterfactual (i.e.
the outcome of interest if adopters had not adopted) based on the population of non-
adopters (de Janvry, et al., 2011). Consequently, we use an IV approach, which controls
for observables and unobservables influencing adoption and outcome.
Since food security is measured by the HDDS, a Poisson model is the most
appropriate econometric specification to capture the count nature of the dependent
variable. In order to address the endogeneity of adoption, we resort to a Generalized
Method of Moments (GMM) estimation technique. The basic moment conditions of the
Poisson model, as specified in equation (1.a), do not hold in the presence of endogeneity,
leading to (1.b). If there exist instrumental variables z, such that the basic moment
conditions can be augmented, as in equation (1.c), minimizing these moment conditions
will provide consistent and efficient estimators of the β’s, including the treatment effect
of adopting improved varieties on HDDS (Cameron and Trivedi, 2009).
13
(1.a)
(1.b)
(1.c)
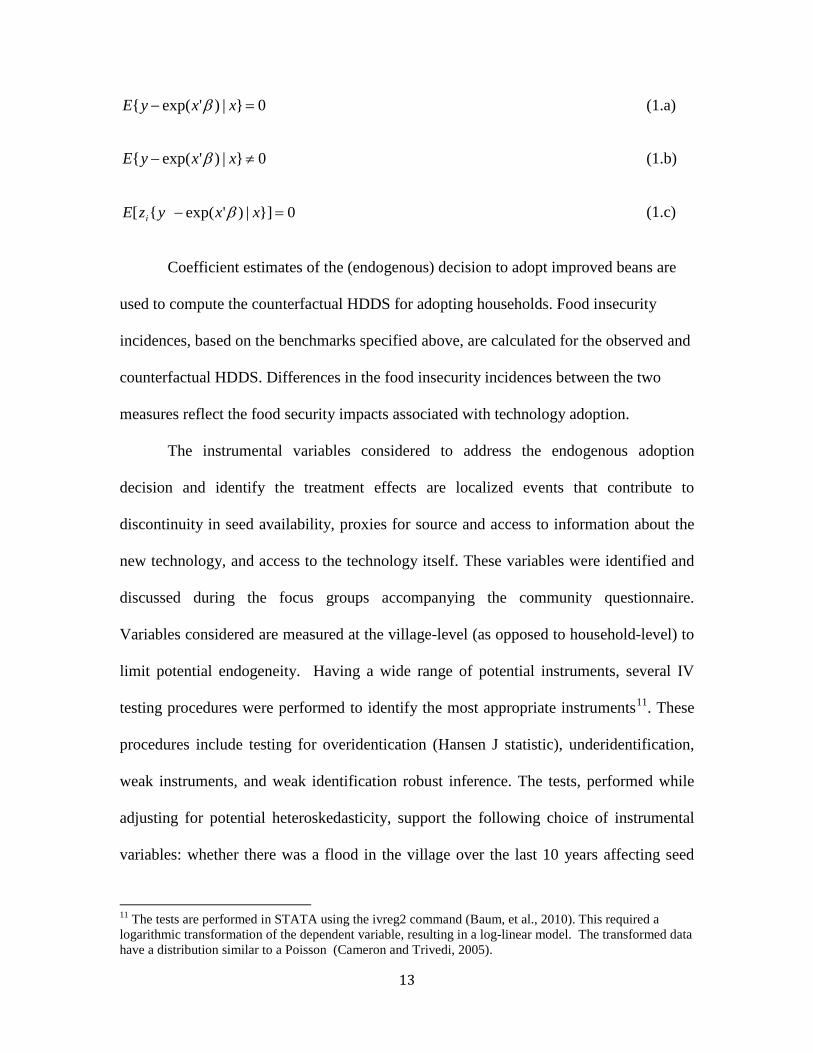
Coefficient estimates of the (endogenous) decision to adopt improved beans are
used to compute the counterfactual HDDS for adopting households. Food insecurity
incidences, based on the benchmarks specified above, are calculated for the observed and
counterfactual HDDS. Differences in the food insecurity incidences between the two
measures reflect the food security impacts associated with technology adoption.
The instrumental variables considered to address the endogenous adoption
decision and identify the treatment effects are localized events that contribute to
discontinuity in seed availability, proxies for source and access to information about the
new technology, and access to the technology itself. These variables were identified and
discussed during the focus groups accompanying the community questionnaire.
Variables considered are measured at the village-level (as opposed to household-level) to
limit potential endogeneity. Having a wide range of potential instruments, several IV
testing procedures were performed to identify the most appropriate instruments11
11 The tests are performed in STATA using the ivreg2 command (
. These
procedures include testing for overidentication (Hansen J statistic), underidentification,
weak instruments, and weak identification robust inference. The tests, performed while
adjusting for potential heteroskedasticity, support the following choice of instrumental
variables: whether there was a flood in the village over the last 10 years affecting seed
Baum, et al., 2010). This required a logarithmic transformation of the dependent variable, resulting in a log-linear model. The transformed data have a distribution similar to a Poisson (Cameron and Trivedi, 2005).
0}|)'exp({ =− xxyE β
0}|)'exp({ ≠− xxyE β
0}]|)'exp({[ =− xxyzE i β
14
availability, the number of households in the village, and existence of market services for
agricultural crops in the village12. Discontinuity in seed availability following a natural
disaster such as droughts or floods might result in households receiving seed aid (where
the seeds distributed under the seed aid program are commonly improved varieties) or
being forced to buy new seeds (instead of the custom of recycling seeds13
Shiferaw, et al. (2008
), favoring
adoption of new seed varieties. There should be no correlation between previous nature
disasters and current food security situation. Living in a highly populated village
facilitates the acquisition of information about agricultural technology and increases the
opportunities to learn from others. Adoption is expected to be facilitated with greater
information about technology. Living in a village where agricultural crops are bought and
sold should facilitate the diffusion of improved seeds. ) found that
availability of seeds positively influences adoption and the intensity of adoption.
However, low transactions costs of acquiring improved seeds should not have a direct
impact on food security other than through their influence on adoption of improved seeds.
Estimation strategies
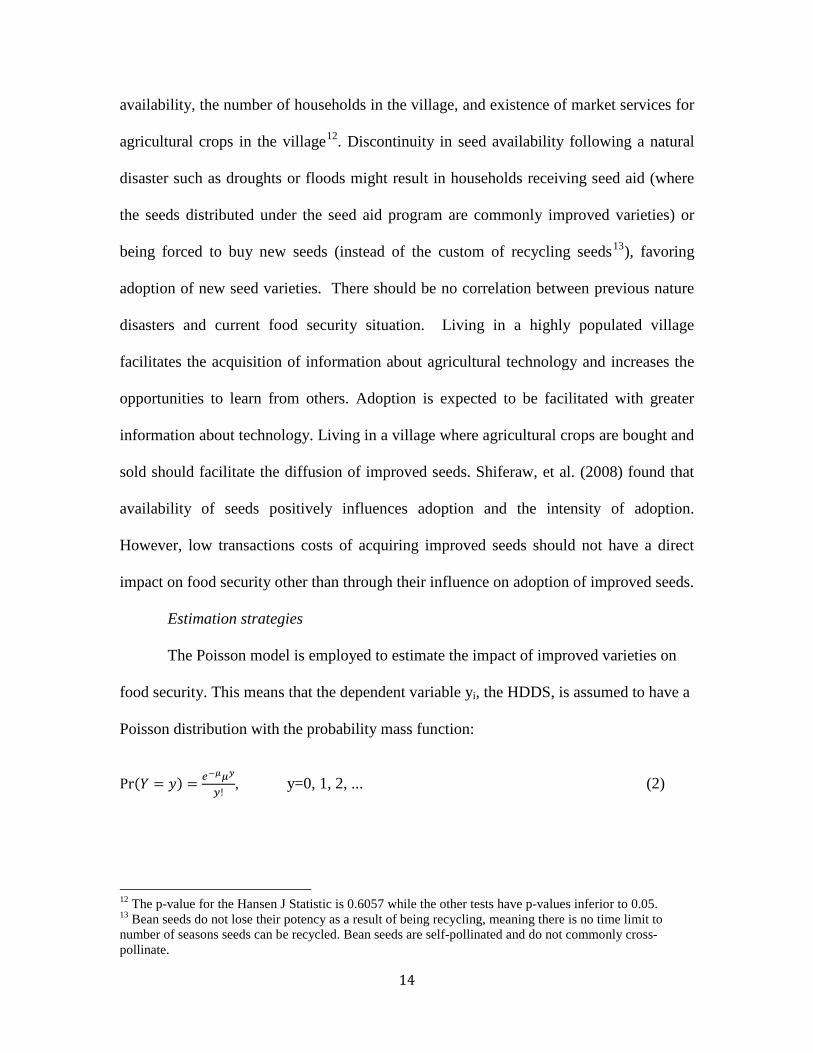
The Poisson model is employed to estimate the impact of improved varieties on
food security. This means that the dependent variable yi, the HDDS, is assumed to have a
Poisson distribution with the probability mass function:
Pr(𝑌 = 𝑦) = 𝑒−𝜇𝜇𝑦
𝑦!, y=0, 1, 2, ... (2)
12 The p-value for the Hansen J Statistic is 0.6057 while the other tests have p-values inferior to 0.05. 13 Bean seeds do not lose their potency as a result of being recycling, meaning there is no time limit to number of seasons seeds can be recycled. Bean seeds are self-pollinated and do not commonly cross-pollinate.

15
Where µ corresponds to the first two moments of the distribution14. For estimation
purposes, the HDDS is re-scaled such that the minimum value is equal to zero15. The
rescaling does not alter the meaning of the food security measure, as it is a categorical
variable and provides the needed Poisson distribution to perform the GMM estimation.
Tests are performed to assess model specification and goodness-of-fit. The results
indicate that Poisson model fits well the data16
Additional explanatory variables assumed to influence household food security
are identified based on the literature. These include household size (expressed in adult
equivalents
. The model is estimated twice, the first
time considering adoption as binary, and a second time, where adoption is measured as
the share of planted seeds that are improved.
17
14 One property of the Poisson distribution is that its expected mean is equal to its expected variance. This is called the equidispersion property (
), wealth (wealth index expressed in quintile, and livestock ownership
expressed in TLU), agricultural productive capacity (farmland owned in ha, and the
number of agricultural tools), and household head characteristics (age, gender, and
education). Household size is expected to influence food security, as consumption
requirements (quantity and diversity) is increasing with the number of household
members. Wealth and agricultural productive capacities are expected to be positively
correlated with household food security. Using a wealth index as opposed to consumption
expenditures as a measure of household socio-economic status has the advantage of
reducing potential endogeneity that could arise from the correlation in measurement
Cameron and Trivedi, 2009). 15 This is accomplished by subtracting three from all observed HDDS. 16 The goodness-of-fit chi-squared test is not statistically significant, indicating that the data fit the Poisson model well (http://www.ats.ucla.edu/stat/stata/dae/poissonreg.htm). The correlation coefficient (0.5) between the observed and predicted values also indicates a good fit. Last, the link test for model specification suggests that the dependent and independent variables are well specified. The predictions squared have no explanatory power (p-value = 0.466) (Cameron and Trivedi, 2009). 17 The composition of adult equivalents is expressed as: 1 + 0.7*(Adult - 1) + 0.5*Children

16
errors between consumption and food expenditures. Dummy variables representing the
10 agro-ecological zones of Rwanda are included to capture differences in production
systems, which are expected to play a role in household food consumption patterns (as
consumption is mainly derived from own production), and thus dietary diversity. When
relevant, squared terms are added to the model to control for potential non-linear effects.
Results
The results of the GMM Poisson are presented in table 3 for both measures of
adoption of improved bean varieties. Results are consistent and robust to alterative
measures of adoption and reveal that adoption has a positive and significant impact on
food security for rural households in Rwanda. Based on the binary measure of adoption,
the HDDS would be about 57 percent (based on a scale from 0-9) lower among adopters
in the absence of improved varieties. Using the continuous adoption measure, HDDS
(based on a scale from 0-9) would be 56 percent higher if households that planted only
improved varieties had not adopted. While estimates for full-adopters are nearly identical
between the two estimation strategies, considering adoption as binary would over-
estimate the treatment effect for partial-adopters. Consequently, the counterfactual HDDS
is slightly lower when computed based on intensity of adoption. The average
counterfactual is 6.91 and 7.02 according to the binary and continuous measure of
adoption compared to the actual 7.36. This means that the percentage of food insecure
household would go up from 13.3 percent to somewhere between 21.1 to 22.9 percent in
the absence of improved bean varieties. Moreover, the share of households considered
food secure would drop from 11.8 percent to around seven percent (table 2).

17
In addition to adoption of improved bean varieties, key variables explaining
variation in HDDS are household size, household head characteristics, and household
socio-economic status 18
Conclusion
. The number of adult equivalent within a household has a
positive and but decreasing impact of HDDS. This result might reflect the greater diet
diversity needs of larger households. The age of the household head has a negative
impact on dietary diversity. An increase of 10 years in the age of the household head
reduces HDDS by about forth percent. The influence of the household head education on
HDDS is relatively large; the HDDS is about 9 and 25 percent higher for households
whose head attended primary and secondary school, respectively, compared to
households whose head has no formal education. This effect is after controlling for other
factors, indicating that education can improve household nutritional status through
channels other than income. Last, wealth is a strong predictor of HDDS and thus
household food security situation. Households belonging to the third, fourth, and fifth
wealth quintiles have HDDS that are on average 15, 18, and 25 percent higher compared
to households that are at the bottom 20 percent of the distribution. These results of
consistent with the notion that food consumption patterns are responsive to changes in
income and that as income raises, households move away from starchy diets and consume
more diverse food groups.
This study makes significant contributions to the literature by documenting the
impact of improved bean varieties on food security among rural households in Rwanda.
Massive investments have been devoted to crop research and bean production in Rwanda
18 Discussion regarding alternative variables is based on the results of the continuous treatment effect model, which are presented in table 3, column 3.
18
is a great example. Collaboration between national and international research institutions
resulted in the released of 46 improved bean varieties between 1998 and 2010. Despite
this impressive research effort, little is known about adoption rates and welfare impacts
of these varieties. This research narrows this gap down by reporting adoption level and
estimating the causal impact of adoption on food security. While agricultural technology
and nutrition outcomes are closely connected, limited number of studies have previously
analyzed food security outcomes within an impact assessment framework. This can be
partially explained by difficulties in measuring food security, lack of consensus regarding
which indicators to use, and costly data collection approaches. Our contribution consists
of using the HDDS, a well-established indicator of individual and household nutritional
status, to evaluate the impact of improved bean varieties on household food security in
Rwanda. Despite that this measure does not encompass all dimensionalities of food
security, such as social acceptability and uncertainty, our research provides evidence that
it is a useful tool to assess food security and deserves consideration in further impact
evaluation studies.
A GMM Poisson model was used to control for the endogeneity of the adoption
decision and identify the treatment effects. Two treatment effects were considered; first
where adoption is measured as in dichotomous way and second, where adoption
represents the share of improved seeds planted. The model performs well and indicates
that the HDDS of adopters would be 1.3 food groups lower, i.e. 6.4 as opposed to 7.7, if
they had not adopted improved bean varieties (continuous treatment effect). Based on an
adoption rate of 26 percent, where 15 percent of households are partial-adopters and 11
percent, full-adopters, the sample counterfactual HDDS is 7.02 compared to the observed
19
7.36 food groups. Consequently, about 22 percent of households would be food insecure
in the absence of improved beans compared to the current 13 percent.
The impacts on food security are likely be more pronounced than those on bean
farm income. This is because adoption of improved varieties influences food
consumption through channels in addition to the farm profitability channel. For example,
some of the new improved varieties have shorter production cycles, which can free up
labor, and allow household members to be engaged in additional income-generating
activities. Higher productivity can also allow households to reallocate resources to other
crops, increasing agricultural production diversity and thus food consumption diversity,
as household food consumption is mainly derived from home production. Contrarily,
higher productivity can lead to an increase in land planted to beans. Gender is another
channel that can influence the impact pathway from adoption to food security. In the case
of Rwanda, bean is mainly a woman's crop. This might contribute to additional food
security impacts as woman might have better control over the income gains from
adoption, and thus, be in a stronger position to influence household nutrition outcomes.
Further research should consider investigating the importance and size of different
channels of influence on household food security.

20
References
Alwang, J., P.B. Siegel, and S.L. Jorgensen. "Vulnerability: a view from different disciplines." Social protection discussion paper series.
Arimond, M., D. Wiesmann, E. Becquey, A. Carriquiry, M.C. Daniels, M. Deitchler, N. Fanou-Fogny, M.L. Joseph, G. Kennedy, Y. Martin-Prevel, and L.E. Torheim. 2010. "Simple Food Group Diversity Indicators Predict Micronutrient Adequacy of Women’s Diets in 5 Diverse, Resource-Poor Settings." The Journal of Nutrition 140(11):2059S-2069S.
Asare-Marfo, D., E. Birol, L. Katsvairo, J.d.A. Manirere, F. Maniriho, and D. Roy. "Farmer Choice of Bean Varieties in Rwanda: Lessons learnt for HarvestPlus Delivery and Marketing Strategies." HarvestPlus.
Barrett, C.B. 2010. "Measuring food insecurity." Science 327(5967):825-828.
Baum, C.F., M.E. Schaffer, and S. Stillman (2010) ivreg2: Stata module for extended instrumental variables/2SLS, GM and AC/HAC, LIM and k-class regression, Stata.
Cameron, A.C., and P.K. Trivedi. 2009. Microeconometrics using stata: Stata Press College Station, TX.
Cameron, A.C., and P.K. Trivedi. 2005. Microeconometrics: methods and applications: Cambridge university press.
Chung, K. "An Introduction to Nutrition-Agriculture Linkages." Michigan State University, Department of Agricultural, Food, and Resource Economics.
CIAT (2004) Enhancing farmers’ access to seed of improved bean varieties in Rwanda, CIAT, pp. 2.
Coates, J. 2013. "Build it back better: deconstructing food security for improved measurement and action." Global Food Security 2(3):188-194.
de Janvry, A., A. Dustan, and E. Sadoulet (2011) Recent advances in impact analysis methods for ex-post impact assessments of agricultural technology: Options for the CGIAR, Consultative Group on International Agricultural Research, Independent Science and Partnership Council pp. 40.
Hoddinott, J., and Y. Yohannes (2002) Dietary diversity as a food security indicator. Washington, DC, IFPRI.
Johnson, N.L., D. Pachico, and C.S. Wortmann (2003) The Impact of CIAT's Gentic Improvement Research on Beans, ed. R.E. Evenson, and D. Gollin. Cambridge, MA, USA, CABI Publishing, pp. 257-274.

21
Jones, A.D., A. Shrinivas, and R. Bezner-Kerr. 2014. "Farm production diversity is associated with greater household dietary diversity in Malawi: Findings from nationally representative data." Food Policy 46:1-12.
Kabunga, N.S., T. Dubois, and M. Qaim. 2014. "Impact of tissue culture banana technology on farm household income and food security in Kenya." Food Policy 45(0):25-34.
Kalyebara, R., and R. Buruchara. "Farm level impacts of improved bean varieties and agronomic technologies in Rwanda." CIAT.
Karangwa, P. "Plant Breeding and Related Biotechnology Capacity, Rwanda." Global Partnership Initiative for Plant Breeding Capacity Building (GIPB).
Kennedy, G., T. Ballard, M.C. Dop, and E. Union. 2011. Guidelines for Measuring Household and Individual Dietary Diversity: Food and Agriculture Organization of the United Nations.
Kennedy, G.L., M.R. Pedro, C. Seghieri, G. Nantel, and I. Brouwer. 2007. "Dietary Diversity Score Is a Useful Indicator of Micronutrient Intake in Non-Breast-Feeding Filipino Children." The Journal of Nutrition 137(2):472-477.
Larochelle, C., J. Alwang, G.W. Norton, E. Katungi, and R.A. Labarta. "Ex-Post Impact of Adopting Improved Bean Varieties on Poverty and Food Security in Uganda and Rwanda."
PABRA (2012) Pan African Bean Research Alliance Kampala, Uganda International Center for Tropical Agriculture (CIAT).
RAB. "Bean Varieties Information Guide 2012."
Ruel, M.T. 2003. "Operationalizing dietary diversity: a review of measurement issues and research priorities." The Journal of Nutrition 133(11):3911S-3926S.
Rusike, J., N.M. Mahungu, S. Jumbo, V.S. Sandifolo, and G. Malindi. 2010. "Estimating impact of cassava research for development approach on productivity, uptake and food security in Malawi." Food Policy 35(2):98-111.
Shiferaw, B., M. Kassie, M. Jaleta, and C. Yirga. 2014. "Adoption of improved wheat varieties and impacts on household food security in Ethiopia." Food Policy 44(0):272-284.
Shiferaw, B.A., T.A. Kebede, and L. You. 2008. "Technology adoption under seed access constraints and the economic impacts of improved pigeonpea varieties in Tanzania." Agricultural Economics 39(3):309-323.
Smith, L.C., and A. Subandoro (2007) Measuring food security using household expenditure surveys. Washington, D.C., IFPRI.
22
Steyn, N., J. Nel, G. Nantel, G. Kennedy, and D. Labadarios. 2006. "Food variety and dietary diversity scores in children: are they good indicators of dietary adequacy?" Public Health Nutrition 9(5):644-650.
Swindale, A., and P. Bilinsky. 2006. Household Dietary Diversity Score (HDDS) for measurement of household food access: Indicator guide (v.2). Washington, D.C: Food and Nutrition Technical Assistance Project, Academy for Educational Development
WFP. "Rwanda Comprehensive Food Security and Vulnerability Analysis and Nutrition Survey." July 2009.

23
Tables
Table 1: Descriptive statistics for adopters and non-adopters of improved bean varieties, Rwanda
Sample Adopters Non-Adopters
mean sd mean sd mean sd Household characteristics HH head gender (1=male) 0.75 0.43 0.78 0.41 0.74 0.44 HH head age 45.68 13.56 45.96 13.15 45.58 13.72 HH head education None 0.26 0.44 0.24 0.43 0.27 0.44
Primary 0.69 0.46 0.72 0.45 0.68 0.47 Secondary & + 0.05 0.21 0.04 0.19 0.05 0.22
HH size 5.22 2.11 5.39 2.18 5.17 2.09 Dependency ratio (dep/adults) 0.92 0.79 0.92 0.85 0.92 0.77 Wealth index -0.13 1.08 -0.08 1.12 -0.15 1.06 Farm characteristics Land own per capita (ha) 0.27 0.66 0.32 0.55 0.25 0.70 Land crop (ha)*** 1.02 1.56 1.34 1.83 0.90 1.44 TLU* 0.82 0.97 0.95 1.19 0.78 0.87 Agricultural tools (number) 8.28 5.64 8.44 5.66 8.23 5.64 Note: *, **, and *** indicate that mean is statistically different at the 10, 5, and 1 percent level between adopters and non-adopters
Table 2: Descriptive statistics of observed and counterfactual HDDS and food security incidence, Rwanda
Observed HDDS Counterfactual HDDS
Non-
Adopters Adopters Sample Adopters (0/1)
% improved seeds
HDDS average 7.24 7.71 7.36 6.91 7.02
% % % % %
Food insecure 14.67 9.41 13.30 22.94 21.10 Moderate food secure 76.65 70.00 74.92 70.64 71.71 Food secure 8.68 20.59 11.77 6.42 7.19

24
Table 3: GMM Poisson results for impact of adoption of improved bean varieties on food security, Rwanda
Adopters (0/1) % of improved seeds
(1) (2) (3) (4)
HDDS (0-9) Coef. Std. Err. Coef. Std. Err. Adoption 0.571** 0.236 0.0056*** 0.002 Adult equivalent (AE) 0.143** 0.053 0.132** 0.054 AE squared -0.016** 0.006 -0.014** 0.006 HH head gender (1=male) -0.046 0.041 -0.049 0.040 HH head age -0.004** 0.002 -0.004** 0.001 HH head education (Base=none) Primary 0.086* 0.045 0.094*** 0.042
Secondary & + 0.263** 0.084 0.248*** 0.068 Land own per capitat (ha) 0.010 0.031 0.016 0.025 TLU -0.012 0.017 0.005 0.013 Agricultural tools (number) 0.004 0.003 0.005 0.003 Wealth index (base = poorest quintile) Quintile 2 0.051 0.051 0.047 0.047
Quintile 3 0.153** 0.062 0.145** 0.058 Quintile 4 0.190** 0.067 0.177** 0.058 Quintile 5 0.231*** 0.056 0.249*** 0.050
Agro-Ecological Zone (Base = 1) 2 -0.064 0.138 -0.087 0.125 3 0.208** 0.087 0.217** 0.087 4 0.141 0.145 0.081 0.119 5 -0.104 0.083 -0.059 0.079 6 0.081 0.140 0.052 0.122 7 -0.058 0.247 -0.083 0.229 8 0.062 0.114 0.041 0.104 9 -0.158 0.149 -0.216* 0.124 10 0.054 0.130 0.030 0.111
Constant 0.962*** 0.227 1.020*** 0.197 Note: * p<0.05; ** p<0.01; *** p<0.001. Standard errors are made heteroskedasticity robust and clustered at the village-level

25
Figures
Figure 1
0.0
05.0
1.0
15.0
2.0
25D
ensi
ty
0 20 40 60 80 100Adoption continuum: % of improved seeds planted
Share of improved seeds planted for partial adopters
26
Figure 2