impairment of pattern separationof ambiguous scenes by
TRANSCRIPT

Systems/Circuits
Impairment of Pattern Separation of Ambiguous Scenes bySingle Units in the CA3 in the Absence of the Dentate Gyrus
Choong-Hee Lee and Inah LeeDepartment of Brain and Cognitive Sciences, Seoul National University, Seoul 08826, South Korea
Theoretical models and experimental evidence have suggested that connections from the dentate gyrus (DG) to CA3 play im-portant roles in representing orthogonal information (i.e., pattern separation) in the hippocampus. However, the effects ofeliminating the DG on neural firing patterns in the CA3 have rarely been tested in a goal-directed memory task that requiresboth the DG and CA3. In this study, selective lesions in the DG were made using colchicine in male Long–Evans rats, andsingle units from the CA3 were recorded as the rats performed visual scene memory tasks. The original scenes used in train-ing were altered during testing by blurring to varying degrees or by using visual masks, resulting in maximal recruitment ofthe DG–CA3 circuits. Compared with controls, the performance of rats with DG lesions was particularly impaired whenblurred scenes were used in the task. In addition, the firing rate modulation associated with visual scenes in these rats wassignificantly reduced in the single units recorded from the CA3 when ambiguous scenes were presented, largely because DG-deprived CA3 cells did not show stepwise, categorical rate changes across varying degrees of scene ambiguity compared withcontrols. These findings suggest that the DG plays key roles not only during the acquisition of scene memories but also dur-ing retrieval when modified visual scenes are processed in conjunction with the CA3 by making the CA3 network respondorthogonally to ambiguous scenes.
Key words: CA3; dentate gyrus; hippocampus; pattern completion; pattern separation; place cell
Significance Statement
Despite the behavioral evidence supporting the role of the dentate gyrus in pattern separation in the hippocampus, the under-lying neural mechanisms are largely unknown. By recording single units from the CA3 in DG-lesioned rats performing avisual scene memory task, we report that the scene-related modulation of neural firing was significantly reduced in the DG-lesion rats compared with controls, especially when the original scene stimuli were ambiguously altered. Our findings suggestthat the dentate gyrus plays an essential role during memory retrieval and performs a critical computation to make categoricalrate modulation occur in the CA3 between different scenes, especially when ambiguity is present in the environment.
IntroductionThe hippocampus plays an essential role in remembering eventsas discrete episodic memories (Eichenbaum, 2000). Computationalmodels have suggested that forming and retrieving distinct memoryrepresentations in the hippocampus require the following two keyprocesses: pattern separation and pattern completion (O’Reilly andMcClelland, 1994; Treves and Rolls, 1994). Pattern separation con-sists of the formation of orthogonal representations despite similarinput patterns, whereas pattern completion consists of the retrieval
of original memory representations when presented with modifiedor ambiguous stimuli. Computational models have suggested thatdifferent subregions of the hippocampus are responsible for patternseparation and completion processes (O’Reilly and McClelland,1994; Treves and Rolls, 1994; Kesner and Rolls, 2015). Specifically,some computational models have emphasized that the dentategyrus (DG) subregion in the hippocampus is critical to the forma-tion of orthogonal representations of events and places in the CA3,the hippocampal structure downstream of the DG. According tothese models, the CA3 is important in recovering the original mem-ory representation (i.e., pattern completion) when slightly modifiedinputs are fed from the cortical areas, mainly due to the recurrentnetwork component in the CA3. It has been hypothesized that twoseemingly opposite computational processes performed in the hip-pocampus are critical in classifying a current environment based onprior original experience.
Experimental evidence using rodents has provided supportfor these computational models (McNaughton et al., 1989;Gilbert et al., 1998, 2001; Lee and Kesner, 2004; Leutgeb et al.,
Received Oct. 31, 2019; revised Mar. 5, 2020; accepted Mar. 10, 2020.Author contributions: C.-H.L. and I.L. designed research; C.-H.L. performed research; C.-H.L. and I.L.
analyzed data; C.-H.L. and I.L. wrote the paper.The authors declare no competing financial interests.This study was supported by the BK211 program (Grant 5286–2014100), the Basic Research Laboratory
Program (Grant 2018R1A4A1025616), and the Brain Research Program (Grants 2019R1A2C2088799,2017M3C7A1029661) through the National Research Foundation of Korea.Correspondence should be addressed to Inah Lee at [email protected]://doi.org/10.1523/JNEUROSCI.2596-19.2020
Copyright © 2020 the authors
3576 • The Journal of Neuroscience, April 29, 2020 • 40(18):3576–3590
2004, 2007; Lee et al., 2004a,b, 2015; Gilbert and Kesner, 2006;Lee and Solivan, 2010; Neunuebel and Knierim, 2014; van Dijkand Fenton, 2018). For example, behavioral studies using ratswith lesions in the DG found significant impairment in memoryretrieval when performing tasks requiring the differentiation ofsimilar locations (Gilbert et al., 2001) or similar object–placepaired associates (Lee and Solivan, 2010). We recently reportedthat DG lesions impair the acquisition of new visual scenes andthat rats with DG lesions were deficient in recognizing visualscenes when the original scenes were altered to make them am-biguous (Ahn and Lee, 2014). These findings indicate that DG isimportant for disambiguating similar experiences. Studies usinghuman subjects have also reported the roles of the hippocampusin pattern separation (Kirwan and Stark, 2007; Bakker et al.,2008; Lacy et al., 2011; Motley and Kirwan, 2012; Brown et al.,2014; Berron et al., 2016). However, these studies provide limitedinformation since the distinction between the DG and CA3 isdifficult to make using the current fMRI techniques. These tech-nical challenges also apply to the electrophysiological characteri-zation of the DG/CA3 areas in pattern separation in nonhumanprimates (Sakon and Suzuki, 2019).
Physiologically, very few granule cells are active duringbehavior in the DG, and those active ones tend to fire only in asingle environment (Danielson et al., 2017; GoodSmith et al.,2017; Senzai and Buzsáki, 2017), suggesting their roles in patternseparation (Nakazawa, 2017). In contrast, electrophysiologicalstudies of the CA3 have yielded evidence for both pattern separa-tion (Leutgeb et al., 2007) and pattern completion (Lee et al.,2004b; Neunuebel and Knierim, 2014). Heterogeneity may bepresent along the transverse axis of the CA3, with the proximaland distal CA3 specialized for pattern separation and patterncompletion, respectively (Lee et al., 2015). Most previous physio-logical studies, however, were conducted using behavioral para-digms that did not require rats to use such computationalprocesses to guide their behavior. Although physiological record-ings were made after the DG became dysfunctional in mnemonictasks in some studies, there was a lack of control over stimulusambiguity (McNaughton et al., 1989; Sasaki et al., 2018; van Dijkand Fenton, 2018). More importantly, these studies did not char-acterize the changes in neural activity in the CA3 that resultedfrom the absence of the DG network.
In the current study, selective lesions were generated in theDG using colchicine, and single units were recorded from theCA3 in animals that had been subjected to a visual scene-basedmemory task involving altered, ambiguous scenes. Comparedwith controls, rats lacking the DG showed significant impair-ment of the rate-modulating capability of single units in the CA3when required to recognize ambiguous visual scenes.
Materials and MethodsSubjectsEight male rats (Long–Evans) weighing 300–400 g were used. Food wasrestricted to maintain the body weight at 85% of free-feeding weight,and water was available ad libitum. All animals were individually housedwith a 12 h light/dark cycle. All animal protocols were approved by theInstitutional Animal Care and Use Committee of the Seoul NationalUniversity.
Behavioral apparatusThe behavioral task was conducted on an elevated, T-shaped linear track(73� 8 cm stem with two 38� 8 cm arms), containing a food well(2.5 cm in diameter, 0.8 cm deep) at the end of each arm (Fig. 1A). Eachfood well was covered by a black, acrylic washer with a silver reflective
sticker attached on the bottom surface to record the moment the rat dis-placed the washer to access the reward with an optic sensor (Autonics)attached to the center of the food well. One of the food wells was baitedduring the intertrial interval while the rat was confined in a start box. Toprevent the rat from locating the baited food well by possible unintendedauditory cues from manipulating the washer on the corresponding side,both washers were adjusted equally during the procedure. A guillotinedoor-operated start box (22.5� 16 � 31.5 cm) was attached to the sideopposite to the stem. Three LCD monitors displaying visual scene stim-uli were installed to surround the arm portions of the T-shaped track.Four optic fiber sensors were inserted along the track at distances fromthe start-box door of 1, 27, 47, and 67 cm to detect the position of theanimal and to control the onset and offset of the scenes. Sensor signalswere sent to a data-acquisition system (Digital Lynx SX, Neuralynx) astransistor–transistor logic (TTL) signals. Custom-written software cre-ated in MATLAB (MathWorks) and Psychtoolbox was used to controlscene stimuli and transmit TTL signals containing trial information tothe data-acquisition system. During the task, the experimental room wasdimly lit with an array of dim LEDs. A camera was attached to the ceilingto record the position and head direction of the rat at a sampling rate of30Hz. The apparatus was surrounded with a black curtain, and whitenoise was played by two speakers (80 dB) during behavioral sessions tomask unwanted environmental noises.
Visual scene memory taskA visual scene memory (VSM) task previously used to show that ratswith DG lesions were impaired in the acquisition of visual scene memoryand in the retrieval of ambiguous scenes (Ahn and Lee, 2014) was usedin the present study. A trial was started by opening the door of the startbox. This opening was detected by the optical sensor, which immediatelytriggered the presentation of the visual scenes on the monitors. The ratran along the track to the end of the stem and had to choose either theleft or right arm, depending on the visual scene, to obtain the foodreward (Fig. 1A). A food well was placed at the end of each arm and wascovered with a black acrylic disk to prevent the animal from using odorto sense a reward. A quarter piece of cereal (Froot Loops, Kellogg’s) washidden in the food well in the arm that was correctly associated with thescene, and the rat retrieved the hidden reward by pushing aside the blackacrylic disk. If the rat chose incorrectly, no reward was provided, and therat was gently guided back to the start box immediately after making theincorrect choice. The intertrial intervals (ITIs) following correct andincorrect choices were set at 10 and 20 s, respectively.
During each ITI, a reward for the next trial was placed in one of thefood wells while the rat was confined to the start box. Four grayscale vis-ual patterns (zebra, pebbles, bamboo, mountains) were used as scenestimuli. The luminance of the visual scenes was equalized to an averageintensity of 103 in Adobe Photoshop. Zebra and bamboo scenes wereassociated with the left food well, whereas pebbles and mountain sceneswere associated with the right food well (Fig. 1B). Rats were trained tocriterion (70% correct choice for each scene on 2 consecutive days), ini-tially with a pair of visual scenes and subsequently with a second pair ofscenes. Training sessions before surgery consisted of 40 trials. The pre-sentation sequence for scenes in a given session was pseudorandomizedso that (1) each scene was presented an equal number of times in every20 trials, and (2) the same food well was not used for reward during fourconsecutive trials. Surgery was performed once the rats had learned bothpairs of scene stimuli to criterion.
SurgeryRats trained to criterion were randomly assigned to the lesion group orthe control group. Rats were placed under deep anesthesia by intraperi-toneal injection of sodium pentobarbital (Nembutal; 65mg/kg), andtheir heads were fixed in a stereotaxic frame (Kopf Instruments).Anesthesia was maintained with 0.5–2% isoflurane mixed with 100% O2
throughout surgery. An incision was made along the midline of the scalpto expose the skull. The stereotaxic adapters were adjusted to place thebregma and lambda on the same horizontal plane. Four small burr holesand one big burr hole were drilled. The small burr holes were usedfor injection, and the large holes for hyperdrive implantation. Either
Lee and Lee · Impaired Pattern Separation in CA3 with DG Lesion J. Neurosci., April 29, 2020 • 40(18):3576–3590 • 3577

colchicine (7mg/ml, 0.2ml/site at 10 ml/h) or saline (0.2ml/site at 10 ml/h) was injected into the dorsal DG at the following coordinates: (1) 2.8mm posterior to the bregma, 61.1 mm lateral to the midline, and 3.7mm ventral from the dura; and (2) 4.0 mm posterior to the bregma,62.3 mm lateral to the midline, and 3.2 mm ventral from the dura.
Colchicine is a neurotoxin that, when injected into the hippocampus,selectively ablates granule cells in the DG, while having a minimal effecton the principal cell layers in the CA1 and CA3 (Walsh et al., 1986;Xavier et al., 1999). Colchicine or saline was injected using a custom-made 10ml glass pipette, with tips at least 8 mm long to minimize dam-age to the overlying cortical regions. At each site, the glass pipette wasmaintained at the injection depth for 2min after infusion to avoid the
possible upward spread of colchicine. Control animals underwent thesame surgical procedures except that artificial CSF (aCSF) was injectedinto the DG. All injections were made by connecting a 10-ml Hamiltonsyringe operated with a microinjection pump (Cole-Parmer).
Once injections were finished, a hyperdrive carrying 24 tetrodes and3 reference electrodes was implanted into each rat to record spikes fromsingle units in the dorsal CA3. The impedance of each tetrode wasadjusted to 100–300 kV (measured in gold solution at 1 kHz with an im-pedance tester) 2 d before surgery. The surgical coordinates for makingthe large burr hole was predetermined to allow the tetrodes to cover arange of 2.5–5 mm posterior to the bregma and 2.5–5 mm lateral to themidline. The hyperdrive was affixed to the skull by applying bone
Ambiguity level0 30 40 50
Ambiguity level0 1 2 30 1 2 3 470
Cor
rect
(%)
5060708090
100
Cor
rect
(%)
5060708090
100
Cor
rect
(%)
5060708090
100* * *
LesionControl
LesionControl
LesionControl
LesionControl
A
D
F GE
B
Left
Right
Left Blurred
Familiar
Right
L0
Zebra Bamboo
Pebble Mountain
L30 L40 L50
L57 R57
L70 R70 R50 R40 R30 R0
Masked
L1 L2 L3
L34 R34
L4 R4 R3 R2 R1 R0
Blurred
Blurred
Masked
Masked
Overlay
Overlay
Familiar
Cor
rect
(%)
50
0
100n.s.
n.s.
n.s.n.s. ***
n.s.
***
C
Left Right
L0
Overlay
L1 L2 L3 R3 R2 R1 R0
Left Right
L0
Ambiguity level
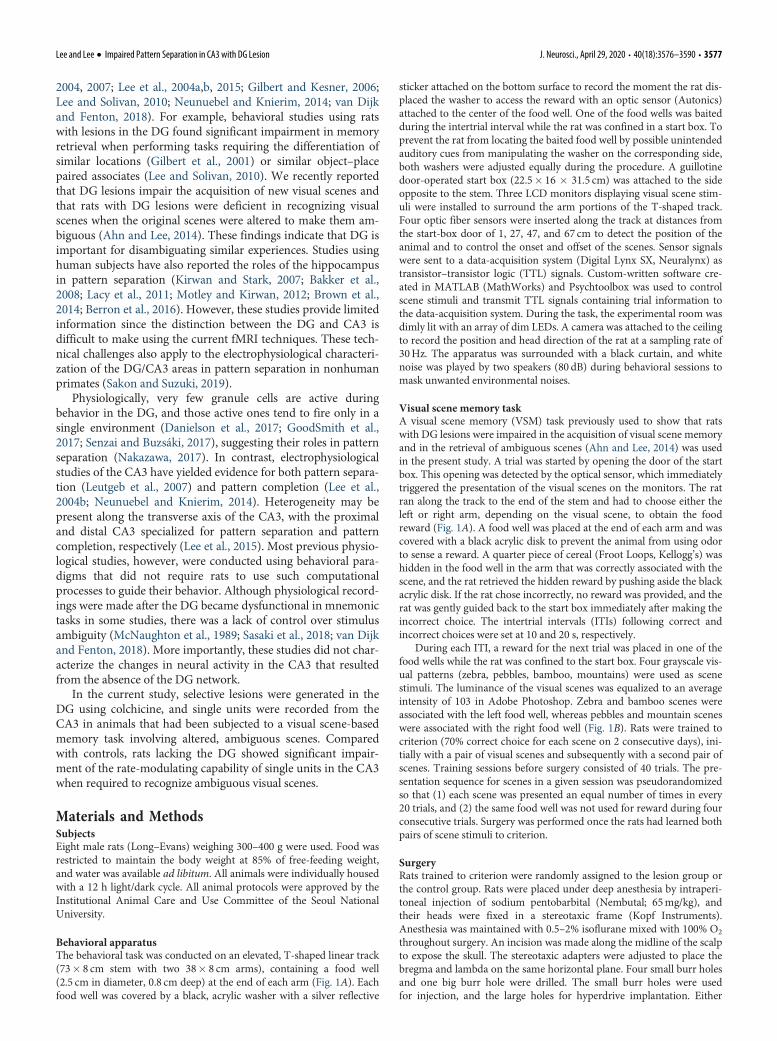
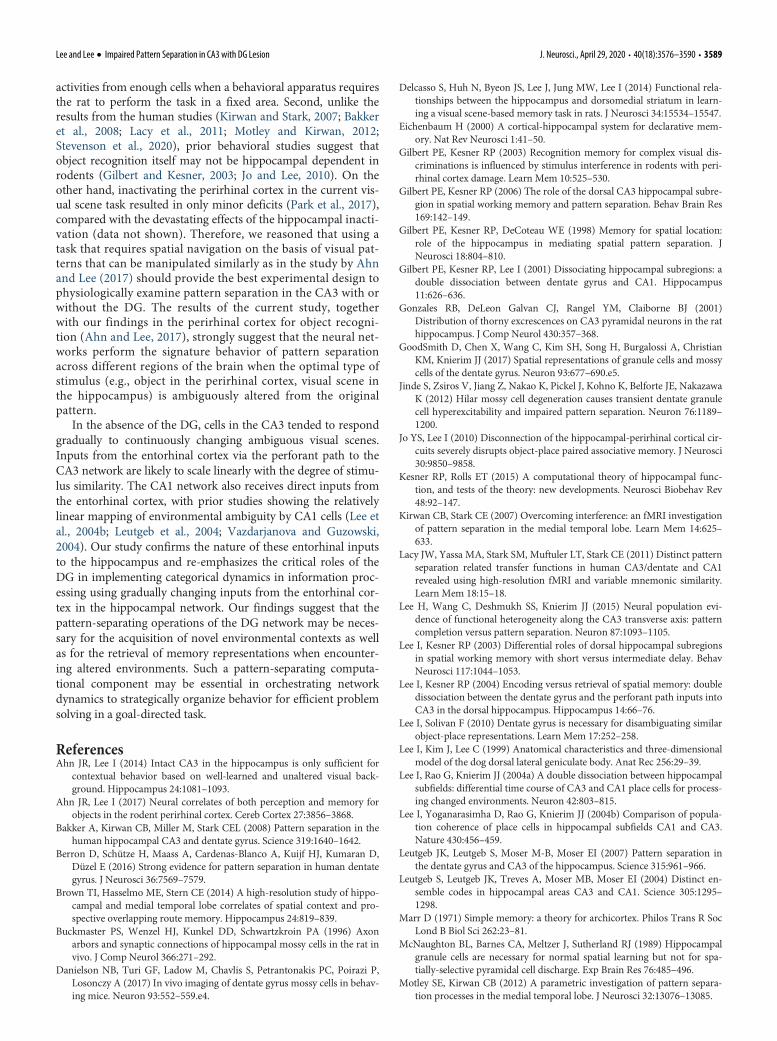
Figure 1. Behavioral paradigm and performance. A, VSM task. B, Four unaltered familiar visual scene stimuli used in Familiar session. C, Top, Blurred session, using 10 Gaussian blurredscenes. Middle, Masked session, using 10 partially occluded scenes. Bottom, Overlay session, using eight partially mixed scenes. In Blurred and Masked sessions, the higher ambiguity levelswere grouped together (L57, R57, L34, and R34) for the electrophysiological analysis to account for a smaller number of correct trials. D, Behavioral performance of the two groups under different sceneconditions. Values are given in mean6 standard error (SE). n.s. not significant, *p, 0.05, **p, 0.01, ***p, 0.001. E, Behavioral performance of the two groups across different ambiguity levels inBlurred sessions. Values are given in mean6 SE. F, Same as E, but in Masked sessions. Values are given in mean6 SE. G, Same as E, but in Overlay sessions. Values are given in mean6 SE.
3578 • J. Neurosci., April 29, 2020 • 40(18):3576–3590 Lee and Lee · Impaired Pattern Separation in CA3 with DG Lesion

cement to its bundle and to multiple skull screws around the bundle.After surgery, rats were orally administered diluted ibuprofen syrup toattenuate pain and cared for in a veterinary intensive care unit for 24 h.The details of these surgical procedures have been described previously(Ahn and Lee, 2014; Delcasso et al., 2014).
Electrophysiological recordingAfter a 5 d recovery period, rats were retrained (;160 trials per sessionusing the same pairs of scenes used before surgery) until they showedstable performance (.75% correct choices for each scene), during whichtetrodes were gradually lowered into target areas. To adjust the tetrodes,the rats were placed on a pedestal in a custom-made aluminum boothoutside the behavioral testing room. Neural signals were transmittedthrough the headstage (HS-36, Neuralynx) and the tether attached to theelectrode interface board (Neuralynx) of the hyperdrive to the data-ac-quisition system. Neural signals were digitized at 32 kHz (filtered at 600–6000Hz) and amplified 1000–10000 times. Tetrodes were lowered dailyby small increments to reach the target areas.
Once the electrophysiological recording session began, all four scenesshown during the training period were presented in a pseudorandom-ized order in a testing session of familiar scenes (Familiar, ;160 trialsper session; Fig. 1B). During the behavioral task, neural signals wererelayed through a slip-ring commutator (Neuralynx) to the data-acquisi-tion system, and an array of green and red LEDs was attached to theheadstage to monitor the position and head direction of the animal usinga digital camera on the ceiling (sampling rate, 30Hz). Once rats per-formed well in familiar sessions for 2 consecutive days, they were sub-jected to a blurred version of the task (Blurred). Each Blurred sessionbegan with 10 trials of an unaltered pair of scenes (zebra and pebblescenes on the first day, and bamboo and mountain scenes on the secondday), followed by presentation of modified versions of the original pairof scenes (30%, 40%, 50%, and 70% Gaussian blurred images) along withthe original scenes (;160 trials per session; Fig. 1C). After 2 d of Blurredsessions, rats were subjected to Overlay sessions for 2 d, followed by aMasked session. Procedures for the Overlay and Masked sessions wereidentical to those of the Blurred sessions, except that visual scene stimuliwere altered in a different manner. For the Overlay sessions, two scenestimuli with different opacity values were mixed together to create a sin-gle visual scene (Fig. 1C, bottom). In the Masked sessions, Gaussianblurred images were replaced by partially occluded images with visualmasks composed of viewing holes of four different diameters (Fig. 1C,middle). This manipulation was intended to create partial cues that mayrequire pattern completion. Once the Masked sessions were completed,rats were subjected to a session with novel scenes for 2 d. The results ofthe Novel scene sessions are not included in the current study.
HistologyOnce all recording sessions were concluded, the rats were subjected to his-tological procedures to assess the extent of the neurotoxic lesions and todetermine the locations of the tetrodes. Rats inhaled overdose of CO2 andtranscardially perfused with a solution of 4% (v/v) formaldehyde in 0.1 M
PBS. The brain was extracted and stored in a 30% sucrose-formalin solu-tion until it sank. The brain was gelatin-coated, again soaked in 30% su-crose-formalin solution, and sectioned at 40mm depth using a freezingmicrotome (model HM 430, Thermo Fisher Scientific). The brain sectionswere mounted and stained with thionin, and photomicrographs of thesesections were taken with a digital camera (Eclipse 80i, Nikon) attached toa microscope at 1� magnification. Brains were reconstructed from thesesections to match the configuration of the tetrodes of the presurgical bun-dle design. The exact locations of tetrodes were determined using the 3Dreconstructed images and physiological depth profiles recorded during thetetrode adjustment period. To examine the integrity of cell layers in theDG and CA3, additional photomicrographs of the brain sections weretaken with a digital slide scanner (MoticEasyScan, Motic) at 40�magnification.
3D volumetryTo evaluate the effect of colchicine infusion, we conducted a 3D volu-metric analysis (Lee et al., 1999; Ahn and Lee, 2014) for the following
hippocampal subregions: CA1, CA3, and DG. Among the thionin-stainedbrain sections acquired, 18 brain sections from 2 to 4 mm posterior tobregma were used for volumetric analysis. In each section, principal celllayers were traced with a color corresponding to one of the hippocampalsubregions. For each subregion, we calculated the percentage voxel indexof individual rats, in which the mean of the number of colored pixelsfrom four control rats was set as 100% (ImageJ, National Institutes ofHealth). For statistical comparison, we performed a two-way ANOVAwith group and subregion as factors, implemented in JMP 11 statisticalsoftware package (SAS Institute). The results of post-hoc t tests comparinggroups and subregions were corrected using a Bonferroni correction pro-cedure for multiple-comparison corrections. To ensure that the recordinglocations between the control and DG-lesion groups were homogeneous,we calculated the relative position of each tetrode by measuring thelength of the CA3 layer; the relative position of 0 denotes the most proxi-mal CA3, whereas 1 denotes the boundary between CA3 and CA2 py-ramidal layers.
Unit isolationSingle units from the dorsal CA3 were isolated manually using custom-written software (WinClust). Various waveform parameters such aspeak and energy were used during the procedure as described previously(Delcasso et al., 2014). Neurons were included in analyses if theyshowed�50 spikes during an outbound journey from the start box tothe food well, if the mean firing rate of the session was,10Hz, and ifthe spatial information score was.0.2 (Table 1).
Data analysisDescription of basic firing propertiesThe amount of spatial information conveyed by a unit was measured byconstructing a linearized firing-rate map (see Fig. 4C). For this purpose,position data from a behavioral session were scaled down by using a binsize of 4 cm2, and a raw spatial rate map was constructed by dividing thenumber of spikes by the duration of a visit for each bin. Spatial informa-tion was computed using the following equation (Skaggs et al., 1993):
Spatial information ¼X
i
pil i
llog2
l i
lbit=spikeð Þ;
where i denotes the bin, pi is the occupancy rate of the ith bin, l i is themean firing rate of the ith bin, and l is the overall mean firing rate. Themean firing rate of a unit was calculated by averaging the firing rates inthe raw rate map. A burst index was defined as the power of autocorrela-tion during the 1–6ms period normalized by the power during the 1–20ms period.
Definition of the boundaries of a place field and its centerA place field was defined as three or more contiguous bins with firingrates.20% of the peak firing rate of the unit. Only CA3 units with both
Table 1. The number of CA3 units included in the analysis after unit sortingand place-field definition
Session Group Complex spiking units Units with intact place field
Familiar Control 58 35DG lesion 84 45Total 142 80
Blurred Control 47 24DG lesion 43 16Total 90 40
Masked Control 84 51DG lesion 61 29Total 145 80
Overlay Control 71 32DG lesion 76 27Total 147 59
The number of CA3 units from each session per group are shown. Complex spiking units were used for com-paring basic firing properties, and the units with intact place fields were used for rate-modulation analysis.
Lee and Lee · Impaired Pattern Separation in CA3 with DG Lesion J. Neurosci., April 29, 2020 • 40(18):3576–3590 • 3579
the start and end bins identified in a linearized firing rate map wereincluded in the analysis for place fields (see Fig. 4C). The mean firingrate used to calculate the rate modulation index was measured onlywithin the boundaries of the place field of the unit.
Rate modulation analysisTo quantify the changes in discharge patterns of single units across dif-ferent scene stimuli, a rate modulation index (RMI) was calculated usingthe mean firing rate of the place field for each condition. To directlycompare the degrees of rate modulation during different sessions, thedifference in firing rate between the left and right response-associatedscene conditions was calculated as:
RMI ¼ jmean FR1ð Þ �mean FR2ð Þmean FR1ð Þ1mean FR2ð Þ j
where FR1 and FR2 denote in-field firing rates of the trials associatedwith the two conditions.
The rate modulation patterns across different levels of visual altera-tions for the scenes in the Blurred, Masked, and Overlay sessions wereevaluated by quantifying the relationships between the mean firing ratesand the levels of manipulations associated with visual scene stimuli, withthese relationships visualized using a tuning curve. Because of a smallernumber of correct trials observed in scene stimuli with higher difficultylevels, the mean firing rates for the last two difficulty levels in the Blurredand Masked sessions were combined (L50 and L70 into L57, R50, andR70 into R57 in the Blurred session; L3 and L4 into L34, R3, and R4 intoR34 in the Masked session). The mean firing rates for eight conditions(two scenes � four ambiguity levels) were normalized from 0 to 1, usingthe following equation:
Normalized FRcond ¼ FRcond �min FR1�8ð Þmax FR1�8ð Þ �min FR1�8ð Þ ;
where Normalized FRcond is the normalized firing rate for a condition(cond), FRcond denotes the mean firing rate for a condition, and min(FR1-8) and max(FR1-8) denote the minimum and maximum valuesamong the eight mean firing rates from each condition, respectively. Forvisualization, normalized firing rates were oriented so that the scene cat-egory associated with the higher firing rates were always on the right-hand side of the graph.
The tuning curve was produced by fitting the data with the followingset of model equations:
Quadratic model: a1 b (scene)1 g (scene)2
and four-parameter sigmoidal model:
F xð Þ ¼ L1ðU � LÞ11 scene
að Þb ;
where L and U are the lower and upper asymptotes, respectively, scenedenotes the level of manipulation for the scene stimulus, and a and bare the inflection point and slope at that point, respectively, of the sig-moidal curve (see Fig. 5A). The quadratic model and sigmoidal modelwere compared using Bayesian information criterion (BIC), where themodel with the lower BIC value was defined as the best one to explainthe unit data (Schwarz, 1978). The model with a better fit was displayedin a solid line along with its coefficient of determination. The two mod-els were compared with each other to identify the single units that exhib-ited a categorical response near the optimal decision point (defined bythe task demand). Specifically, if a unit showed a categorical responseacross different levels of ambiguity, the neural activity should be betterexplained by the sigmoidal model than by the quadratic model (see Fig.5A). However, if a unit exhibited gradual changes, it should be fit betterby the quadratic model than by the sigmoidal model (see Fig. 5B). Theproportions of units better explained by the sigmoidal model were com-pared in the control and DG-lesion groups using x 2 tests for within-ses-sion comparisons and z-score tests for comparing across different
sessions. This analytical strategy was previously used to successfully differ-entiate functional classes of cells in the perirhinal cortex during an objectrecognition task (Ahn and Lee, 2017).
In addition, the linear model and the three-parameter sigmoidalmodel, which are reduced forms of the quadratic model and the sigmoi-dal model, were also used for the scene-tuning curve estimation. The lin-ear model is identical to the quadratic model, except that the third term(g ) was removed. For the three-parameter sigmoidal model, the upperand lower asymptotes were combined as a single parameter.
To assess the tuning curve on a population level, the normalizedmean firing rates of each unit were reoriented based on the sign of theslope of the better fitted model in the individual model fitting results.Reoriented normalized mean firing rates were averaged for each of eightlevels, separately for the control and lesion groups, to produce the popu-lation mean firing rate for each scene category. Estimation of the scene-tuning curve for the population data were performed in the same man-ner as for individual units, as described above.
Experimental design and statistical analysisBehavioral performance from all recording sessions (Familiar, Blurred,Overlay, Masked, and Novel) was analyzed using a three-way repeated-measures ANOVA (group, session type, and day) with the rat identitynested within the group factor, implemented in JMP 11 statistical soft-ware package (SAS Institute). The results of post-hoc t tests for ANOVAtests (Fig. 1D) comparing session type and group were corrected using aBonferroni correction procedure for multiple-comparison corrections.For the Blurred, Overlay, and Masked sessions, a two-way repeated-measures ANOVA (group, ambiguity level) with the rat identity nestedwithin the group factor was used (Fig. 1E–G). The post-hoc t tests forcomparing ambiguity levels and groups were corrected using Bonferronicorrection procedures for multiple comparisons. Unless stated otherwise,differences in unit-firing properties were compared by Kolmogorov–Smirnov tests (K-S test), with the level of statistical significance set at a =0.05, implemented in StatView software package (SAS Institute). x 2 testsfor independence, implemented in JMP 11, was used for comparing theproportions between the groups within a session. z-score tests were used forcomparing two proportions associated with different sessions. A two-wayANOVA (group and session type as factors) were run in JMP 11 to com-pare the difference in the coefficient of determinations (R2) from the sig-moidal model fit. The results of post-hoc t tests for ANOVA (see Fig. 9E)comparing session type and group were corrected using a Bonferroni cor-rection procedure for multiple comparisons.
ResultsLesions in the DG impair the ability of rats to disambiguatevisual scenesFour rats each in the control group and DG-lesion groups werefirst tested with unaltered, familiar visual scenes (Fig. 1B), fol-lowed by the Blurred, Overlay, and Masked sessions (Fig. 1C).Compared with controls, DG lesions affected performance dif-ferently, depending on the type of stimulus manipulations.Three-way repeated-measures ANOVA, with group, sessiontype, and day as factors, revealed a significant main effect of ses-sion type (F(4,53.08) = 11.045, p= 0.001) and a significant interac-tion between group and session type (F(4,53.08) = 4.16, p= 0.005).The main effect for group (F(1,12.21) = 3.61, p=0.081) or day(F(1,53.17) = 0.038, p=0.845) and interaction between group andday (F(1,53.17) = 0.174, p=0.678), session and day (F(4,53.17) = 2.49,p= 0.054), and the three-way interaction (F(4,53.17) = 1.66,p= 0.173) were not significant. When the original scenes wereused as stimuli in the Familiar session, the control and DG-lesion groups performed similarly, ;90% (t(53.27) = 0.09,p= 0.249, Bonferroni-corrected; Fig. 1D, Familiar). However,when visual scenes were made ambiguous in the Blurred session,rats with DG lesions showed a significant reduction in responseaccuracy compared with controls (t(53.27) = �2.68, p= 0.01,
3580 • J. Neurosci., April 29, 2020 • 40(18):3576–3590 Lee and Lee · Impaired Pattern Separation in CA3 with DG Lesion

Bonferroni-corrected post-hoc t test; Fig. 1D, Blurred). In theMasked sessions, both groups showed ;85% accurate responses,with no significant difference between the control and DG-lesiongroups (t(53.27) = �1.42, p=0.35, Bonferroni-corrected post-hoc ttest; Fig. 1D,Masked). Behavioral performance levels were similarbetween two groups during the Overlay sessions (t(53.27) = 1.65,p=0.10, Bonferroni-corrected post-hoc t test; Fig. 1D, Overlay).
The accuracy of choices made by the control and DG-lesiongroups across different ambiguity levels during the Blurred,Masked, and Overlay sessions were compared by two-wayrepeated-measures ANOVA, with group and ambiguity level asfactors. In the Blurred session, the results showed a significantinteraction between group and ambiguity level (F(4,64) = 3.901,p=0.006). Compared with control rats, rats with DG lesionsshowed significant impairment in response accuracy at ambigu-ity levels of �40 (t(68) = �2.22, p=0.015; t(68) = �3.87,p=0.0001; and t(68) = �3.38, p= 0.001, respectively, for 40, 50,and 70 conditions, Bonferroni-corrected post-hoc t test; Fig. 1E),but not at ambiguity levels of ,40 (t(68) = 0.35, p= 0.723; andt(68) = �0.58, p= 0.28, respectively, for 0 and 30 conditions,Bonferroni-corrected post-hoc t test). However, in the Masked
(Fig. 1F) and Overlay (Fig. 1G) sessions, the main effect of ambi-guity level was significant (Masked: F(4,64) = 10.128, p=0.001;Overlay: F(3,43) = 4.746, p=0.01) with no significant group effect(Masked: F(1,68.83) = 0.013, p=0.91; Overlay: F(1,43.18) = 0.003,p=0.956) and no significant interaction effect as well (Masked:F(4,64) = 0.947, p=0.442;Overlay: F(3,43) = 0.178, p=0.911).
These findings strongly suggest that the DG plays an importantrole in recognizing ambiguously blurred versions of the familiarvisual scenes, but not when the visual scenes are unaltered in otherways. Because the performance of the control and lesion groupsdid not differ significantly from each other when the visual sceneswere blurred relatively mildly (i.e., 30%), it is likely that the DGlesions affected visual pattern separation when substantial noise(i.e.,�40% Gaussian blur) was added to the original scene stimuli.
Histological verification of colchicine-induced lesionsInjection of colchicine into the dorsal DG ablated the granulecell layer and the hilar region, while leaving the CA3 pyramidalcell layer relatively intact (Fig. 2A). Compared with the aCSF-injected controls (Fig. 2B; effect of interaction: F(2,12) = 91.08,p= 0.001), the rats with colchicine injection showed almost
B C D
0
20
40
600
10
20
00
10
20
80
100
CA1 CA3 DGSubregion Relative location
Prop
ortio
n of
inta
ct ti
ssue
(%)
Prop
ortio
n of
tetro
des
(%)
****** n.s.
ControlLesionIndividualdata
Control
Lesion
-5
-4
-3
-2
2 2.5 3 3.5 4 4.5 0.2 0.4 0.6 0.8 1
AP (m
m)
ML (mm)
562 553550487
471454425313
LesionControl
A DG lesionControl
-3.00
-3.48
-2.52
*
*
*
Figure 2. Histological verification of DG lesions. A, Examples of thionin-stained sections from the control and DG-lesion groups. For each hippocampal section (4� magnification, left), theDG/hilar area (larger rectangle) was zoomed and shown as a magnified image (10� magnification, middle). The suprapyramidal blade of the DG and the hilar area (smaller rectangle) was fur-ther zoomed to show changes observed in the DG granule cell layer and CA3 pyramidal cell layer (40� magnification, right). Solid and open arrowheads indicate intact and damaged granulecell layers in the control and lesion groups, respectively. Asterisks in the DG-lesion group denote the relatively intact pyramidal cells in the CA3. Scale bars are shown below the sections. APcoordinates (distances from bregma) are given at the left bottom corners of the sections. B, The extent of the lesion in the hippocampal subregions based on 3D volumetry. Proportions of intacttissue in individual rats are shown in colored dots next to the bar graphs. Values are given in mean6 SE. n.s. not significant, ***p, 0.001. C, Distribution of the AP and ML coordinates oftetrodes. Tetrodes from control rats are depicted as open circles, and those of the DG-lesioned rats are as filled circles. Individual rats are shown in different colors. D, Distribution of the relativelocations of the tetrodes in the control and DG-lesion groups. The relative location of 1 denotes the boundary between CA3 and CA2. The black curves denote estimated normal distributions.
Lee and Lee · Impaired Pattern Separation in CA3 with DG Lesion J. Neurosci., April 29, 2020 • 40(18):3576–3590 • 3581
complete damage (;85%, t(15.88) =�18.59, p=0.001, Bonferroni cor-rected) of the DG granule cell layer.The CA1 subregion also showed con-siderable damage (;35%, t(15.88) =�6.90, p= 0.001, Bonferroni cor-rected), but there was no significantdifference between control andlesion groups in the CA3 (t(15.88) =�2.74, p= 0.22, Bonferroni cor-rected). The extent of damageobserved in this study was consistentwith those reported in the previousstudies (McNaughton et al., 1989;Lee and Kesner, 2004; Ahn and Lee,2014; Sasaki et al., 2018).
To assess whether there were anydifferences in tetrode tracks betweentwo groups, we identified antero-poste-rior (AP) and mediolateral (ML) coor-dinates of all of the tetrodes in whichany unit was recorded during the entiresession (Fig. 2C). There was no signifi-cant difference between two groups inboth AP and ML coordinate distribu-tions (AP: x 2
(2) = 6.624, p=0.073, ML:x 2(2) = 1.989, p=0.74, K-S test).
Similarly, there was no significant dif-ference between the two groups in therelative recording locations (x 2
(2) =4.764, p=0.185; Fig. 2D). This resultindicates that the differences found between two groups were unlikelyto be caused by the functional heterogeneity along the proximodistalaxis of the CA3 (Lee et al., 2015).
Basic firing properties were unaffected by DG lesionsDespite the absence of DG inputs, there was no significant differ-ence in raw spike waveforms (Fig. 3A). Spike width (x 2
(2) =5.45 =, p= 0.131, K-S test), burst index (x 2
(2) = 4.29, p= 0.233, K-S test), mean firing rates (x 2
(2) = 3.84, p= 0.293, K-S test), andpeak firing rates (x 2
(2) = 6.61, p=0.073, K-S test) in CA3 unitsrecorded during the Familiar sessions did not differ significantlybetween the lesion and control groups (Fig. 3B). Intact place cellswere observed in the CA3 during the VSM task in both the con-trol group (Fig. 4A) and the DG-lesion group (Fig. 4B), which isconsistent with the previous studies reporting intact spatial selec-tivity of CA3 cells after the DG lesion (McNaughton et al., 1989).
Categorical rate modulation in the CA3 across ambiguousscenes occurs in the control, but not the in the DG-lesiongroupPattern separation is a computational process that reduces theamount of overlap in output patterns using similar input pat-terns (O’Reilly and McClelland, 1994; Treves and Rolls, 1994).To test whether pattern separation occurred in the CA3 for am-biguous visual scenes in the VSM task, the neuronal firing ratesfor ambiguous scenes, including the originals, were calculatedfrom the place fields defined on a linearized rate map (Fig. 4C).For each unit, the firing rates across different scene stimuli werenormalized and the difference (RMI between the firing rates forthe left and right choice-associated scenes) was determined.Although the degree of rate modulation between left and rightscenes was similar in the Familiar session for both groups (z =�0.05, p= 0.960, Mann–Whitney U test; Fig. 4D), and rate mod-ulation was lower in the DG-lesion group when ambiguity wasintroduced in the scene stimuli during the Blurred sessions (z =
�2.04, p=0.041, Mann–Whitney U test). However, the group dif-ferences in rate modulation were not observed during the Masked(z=1.02, p=0.307, Mann–Whitney U test) or Overlay sessions (z =�0.411, p=0.681, Mann–WhitneyU test).
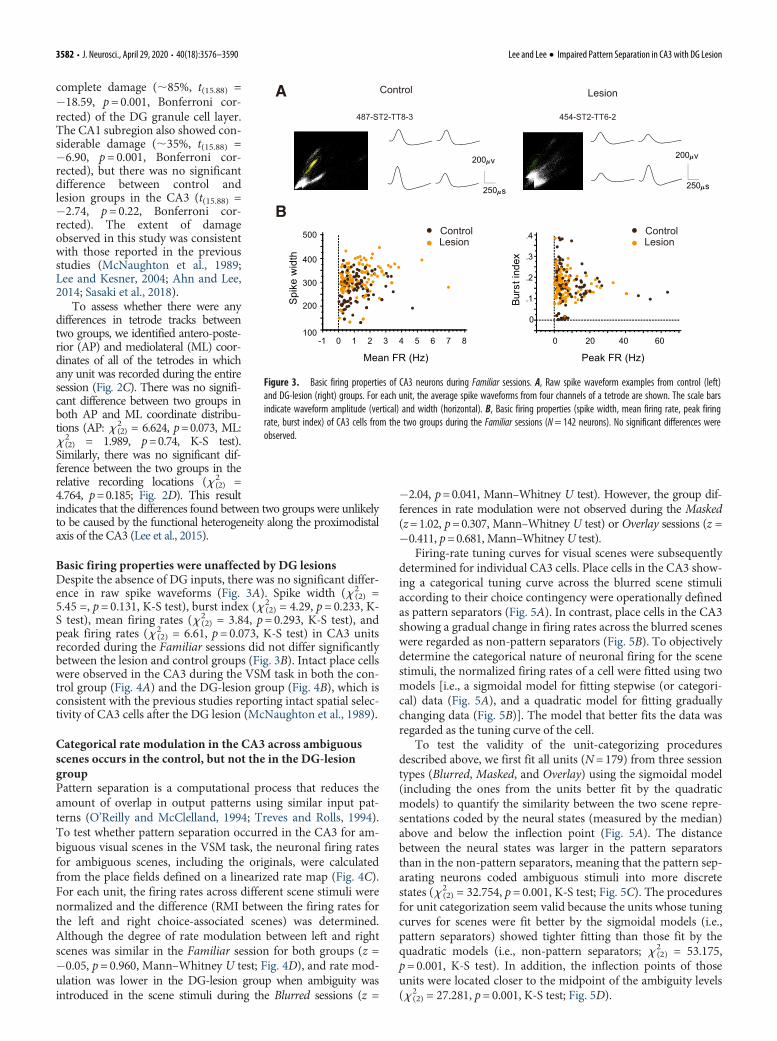
Firing-rate tuning curves for visual scenes were subsequentlydetermined for individual CA3 cells. Place cells in the CA3 show-ing a categorical tuning curve across the blurred scene stimuliaccording to their choice contingency were operationally definedas pattern separators (Fig. 5A). In contrast, place cells in the CA3showing a gradual change in firing rates across the blurred sceneswere regarded as non-pattern separators (Fig. 5B). To objectivelydetermine the categorical nature of neuronal firing for the scenestimuli, the normalized firing rates of a cell were fitted using twomodels [i.e., a sigmoidal model for fitting stepwise (or categori-cal) data (Fig. 5A), and a quadratic model for fitting graduallychanging data (Fig. 5B)]. The model that better fits the data wasregarded as the tuning curve of the cell.
To test the validity of the unit-categorizing proceduresdescribed above, we first fit all units (N=179) from three sessiontypes (Blurred, Masked, and Overlay) using the sigmoidal model(including the ones from the units better fit by the quadraticmodels) to quantify the similarity between the two scene repre-sentations coded by the neural states (measured by the median)above and below the inflection point (Fig. 5A). The distancebetween the neural states was larger in the pattern separatorsthan in the non-pattern separators, meaning that the pattern sep-arating neurons coded ambiguous stimuli into more discretestates (x 2
(2) = 32.754, p= 0.001, K-S test; Fig. 5C). The proceduresfor unit categorization seem valid because the units whose tuningcurves for scenes were fit better by the sigmoidal models (i.e.,pattern separators) showed tighter fitting than those fit by thequadratic models (i.e., non-pattern separators; x 2
(2) = 53.175,p= 0.001, K-S test). In addition, the inflection points of thoseunits were located closer to the midpoint of the ambiguity levels(x 2
(2) = 27.281, p= 0.001, K-S test; Fig. 5D).
B
A
Spik
ew
idth
Mean FR (Hz)
100
200
300
400
500
-1 0 1 2 3 4 5 6 7 8
Lesion
Lesion
Control
Control
0
.1
.2
.3
.4
Burs
tind
ex
0 20 40 60
Peak FR (Hz)
LesionControl
200 v
250 s
487-ST2-TT8-3
200 v
250 s
454-ST2-TT6-2
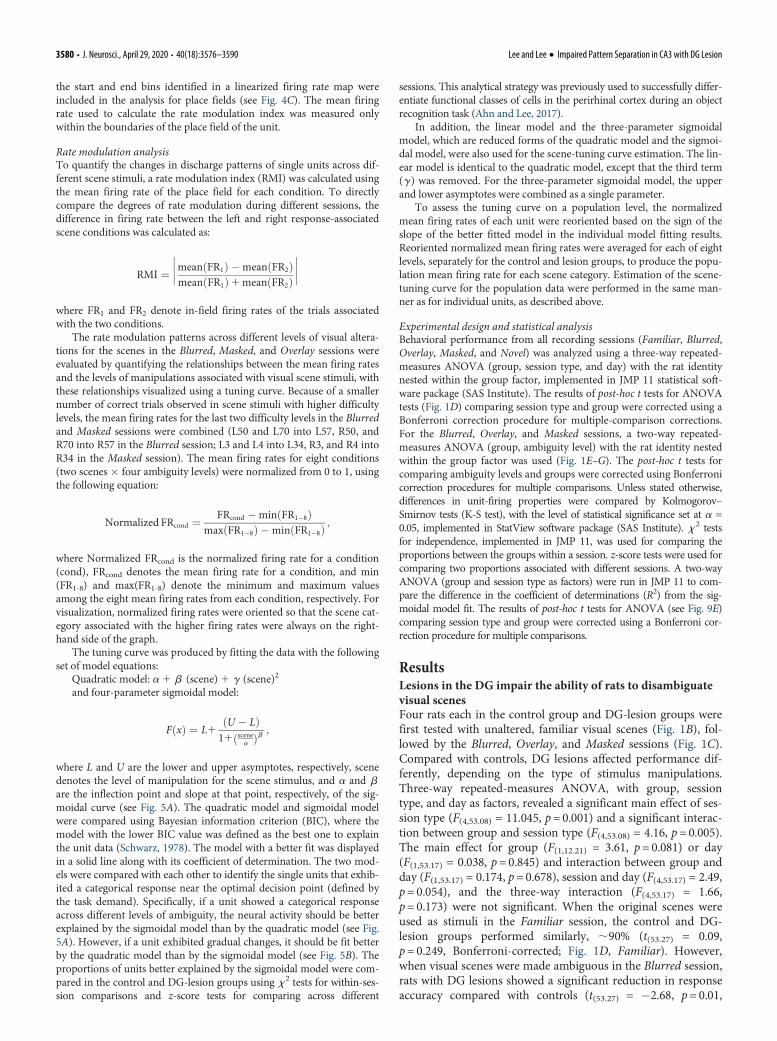
Figure 3. Basic firing properties of CA3 neurons during Familiar sessions. A, Raw spike waveform examples from control (left)and DG-lesion (right) groups. For each unit, the average spike waveforms from four channels of a tetrode are shown. The scale barsindicate waveform amplitude (vertical) and width (horizontal). B, Basic firing properties (spike width, mean firing rate, peak firingrate, burst index) of CA3 cells from the two groups during the Familiar sessions (N= 142 neurons). No significant differences wereobserved.
3582 • J. Neurosci., April 29, 2020 • 40(18):3576–3590 Lee and Lee · Impaired Pattern Separation in CA3 with DG Lesion

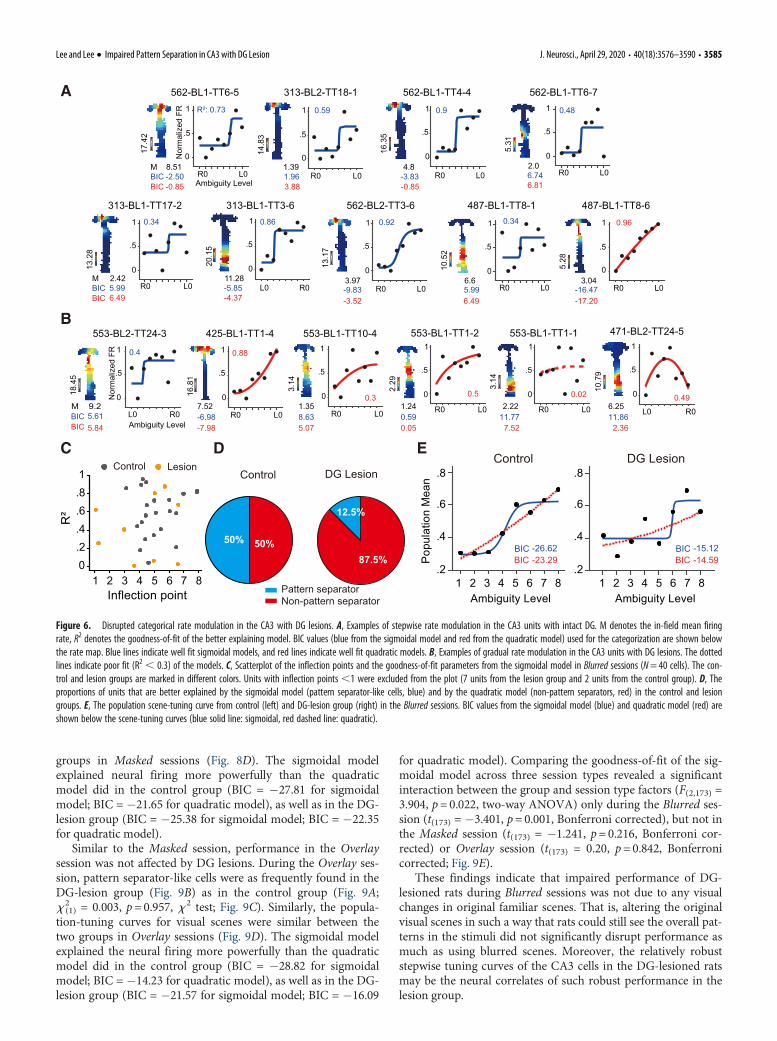
We found that the scene-related firing patterns of the CA3cells in the control group were better fit by the sigmoidal modelthan the quadratic model (Fig. 6A), and vice versa for the lesiongroup (Fig. 6B). That is, pattern separators were more frequentlyfound in the control group than in the lesion group and viceversa for non-pattern separators.
The goodness-of-fit for the sigmoidal model (measured bythe coefficient of determination) was significantly higher on av-erage in the control group (N= 24 cells) than in the lesion group(N=16 cells) in Blurred sessions (x 2
(2) = 9.60, p=0.016, K-S test;Fig. 6C). The inflection points were also distributed closer to theoptimal decision point in the control group than in the lesiongroup (x 2
(2) = 8.817, p, 0.05, K-S test; Fig. 6C). The proportionof pattern separator-like cells was significantly lower in the DG-lesion than in the control group in the Blurred session (x 2
(1) =5.934, p=0.015, x 2 test; Fig. 6D). The attenuation of patternseparator-like activity was also observed at a population level.That is, the population tuning curve for visual scene in the DG-lesion group was similarly explained by the sigmoidal model(BIC = �15.12) and quadratic model (BIC = �14.59), whereasthe sigmoidal model explained the neural firing more powerfullyin the control group (BIC = �26.62 for sigmoidal model; BIC =�23.29 for quadratic model; Fig. 6E). These findings suggest thatthe behavioral impairment observed in rats with DG lesions (Fig.1D,E) may be related to the degradation of discrete memory rep-resentations for similar visual scenes.
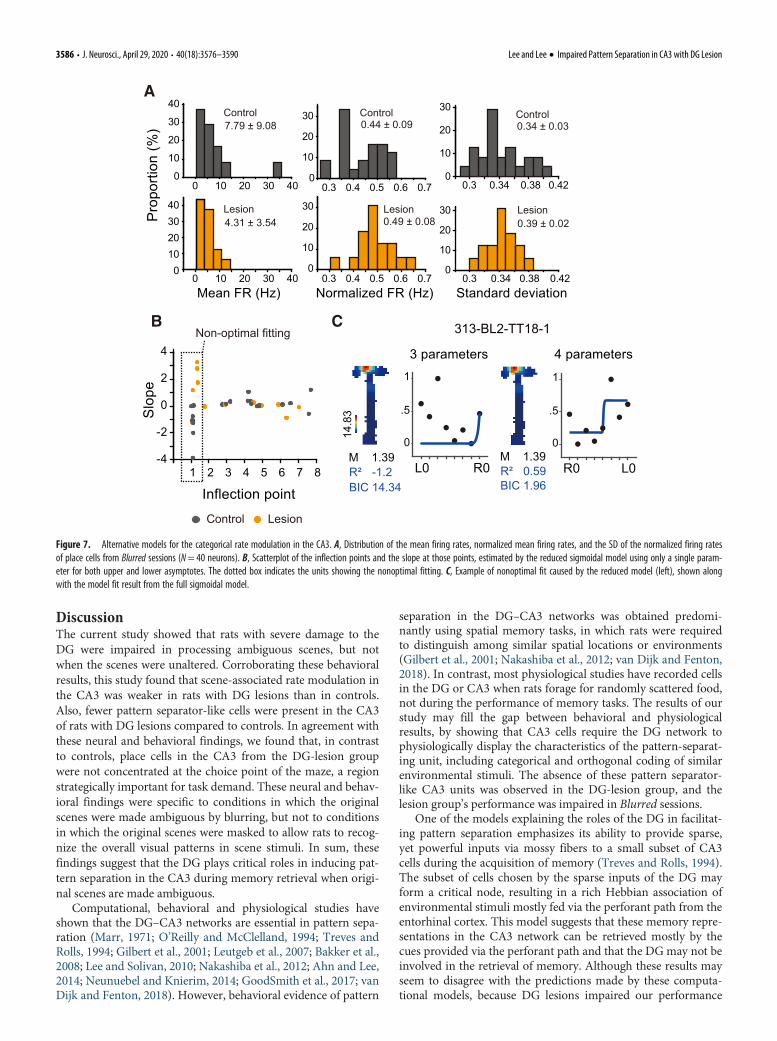
It is unlikely that the above-mentioned differences betweenthe groups were caused by the inherent differences in firing rates
that might be better suited for either model fitting because theplace cells of the two groups in Blurred sessions (N=40 cells)were similar to each other with respect to the in-field mean firingrate (x 2
(2) = 3.267, p= 0.39, K-S test), normalized firing rate(x 2
(2) = 6.667, p=0.071, K-S test), and the SD of the normalizedfiring rate (x 2
(2) = 3.28, p= 0.39, K-S test; Fig. 7A). To equate theparameters between the models, we also tried a reduced sigmoi-dal model and a linear model to estimate the scene-tuning curve.The reduced sigmoidal model was intended to match the num-ber of parameters to that of the quadratic model. However, con-solidating the upper and lower asymptotes to one parameterresulted in nonoptimal fitting results in multiple units (Fig. 7B).For example, when estimating the scene-tuning curve of a unit,the reduced model showed the inflection point near the firstlevel, followed by a steep negative slope, which clearly deviatedfrom the scene stimuli-associated firing rates (Fig. 7C).
Categorical firing patterns in the CA3 for visually masked ormixed scene stimuli are not affected by DG lesionsTo determine whether changes in the visual scene could causethe degradation of rate modulation in the CA3 after DG lesions,data from the Masked sessions, in which visual scenes were par-tially occluded but the patterns were still visible, were analyzed.The performance of the two groups did not differ significantlyduring the Masked sessions (Fig. 1B,F), suggesting that partialocclusion of the visual scene does not affect pattern separation inthe CA3 as much as does blurring of the scene.
C
In-field: Hz/bin > 20% Peak Hz
Choicepoint
Bin size4 cm
Stem
Goa
l arm
C
D
Blurred Masked OverlayFamiliar
RM
I LR
0
.1
.2
.3 *n.s. n.s.
n.s.
A B DG lesionControl
0
21.65
562-ST2-TT6-8
10.96 (Hz)
553-ST2-TT24-7
0.97 (Hz)0
1.57
0
3.99
313-ST1-TT11-3
2.17 (Hz)0
1.67
487-ST1-TT8-4
0.91 (Hz)
0
3.63
487-ST1-TT8-3
1.62 (Hz)0
15.65
487-ST2-TT8-1
7.84 (Hz) 0
22.56
313-ST2-TT18-4
4.75 (Hz)
0
9.06
425-ST1-TT1-8
5.61 (Hz)
0
7.11
454-ST2-TT6-2
4.59 (Hz)
0
6.88
553-ST1-TT9-10
3.52 (Hz)
0
1.47
553-ST1-TT12-8
1.05 (Hz)0
25.57
471-ST2-TT24-4
15.21 (Hz)
Control Lesion
Figure 4. Scene-dependent rate modulation in the CA3 units. A, Examples of spatial firing patterns of CA3 units with intact DG. Cell identities are marked on top of the unit examples, whichdenote information about the rat, session, tetrode, and cluster identity of each unit in that order. Numbers on the top of the color bar indicate a peak firing rate. In-field mean firing rates are shownbelow each spatial firing rate map. Black dots indicate the center of mass of the place field. B, Examples of spatial firing patterns of CA3 units from rats with DG lesions. C, Illustration of the lineari-zation process of a CA3 place field. The choice point was defined as the bin in which the trajectories for the left and right trials differed significantly for at least two consecutive bins. D, Rate modula-tion index (RMI) between the left and right response-associated scenes in the Familiar, Blurred, Masked, and Overlay sessions. Values are given in the mean6 SE. n.s. not significant, *p, 0.05.
Lee and Lee · Impaired Pattern Separation in CA3 with DG Lesion J. Neurosci., April 29, 2020 • 40(18):3576–3590 • 3583
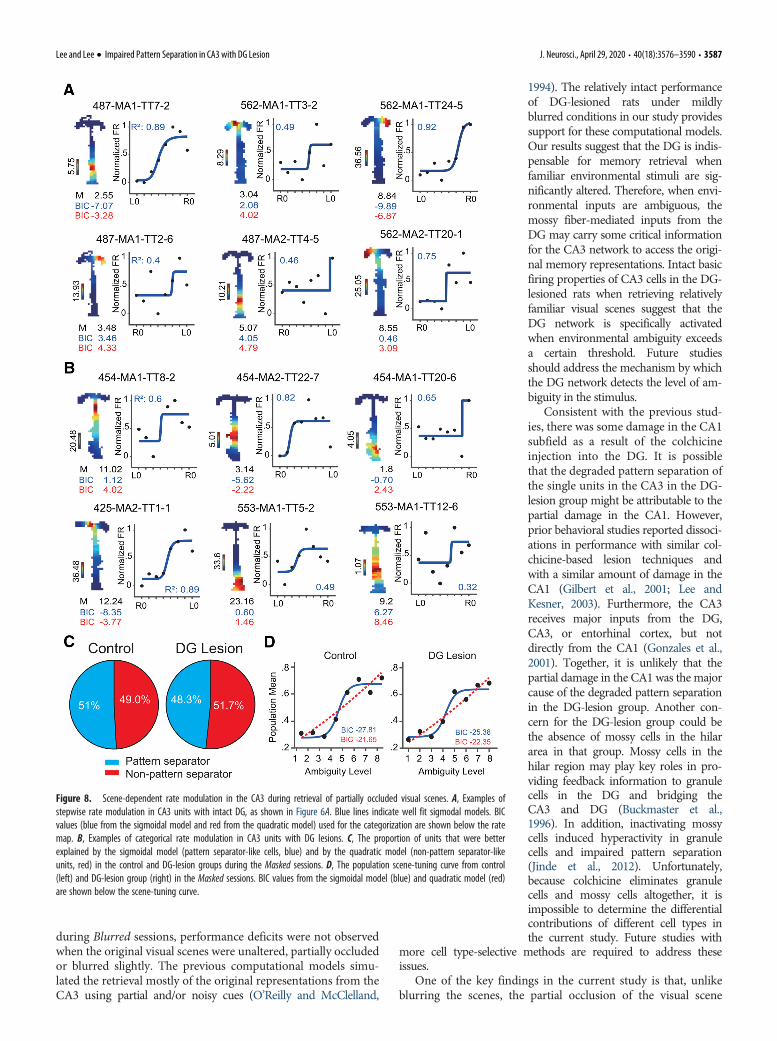
Consistent with these behavioral results, the pattern separa-tor-like cells were equally abundant in the DG-lesion (Fig. 8B)and control (Fig. 8A) groups during the Masked sessions (x 2
(1) =0.004, p= 0.949, x 2 test). Similarly, the percentages of patternseparator-like (44.8%) and non-pattern separator-like (55.2%)cells were similar in the DG-lesion group (z = �0.79, p=0.429,z-score test; Fig. 8C). In addition, the proportion of pattern
separator-like cells in the CA3 of the DG-lesion group duringMasked sessions (44.8%) was similar to that of the control group(50.9%) in the Masked (z = �0.53, p=0.596, z-score test) andBlurred (z = �0.37, p = 0. 703, z-score test) sessions, but was sig-nificantly higher than that of the DG-lesion group duringBlurred sessions (z=1.75, p= 0.04, z-score test). The populationtuning curves for visual scenes were similar between the two
A
B
R0R30R40R57L57L40L30L0
Ambiguity Level
Nor
mal
ized
FR
L
Inflection point (α)
slope (β)
R0R30R40R57L57L40L30L0Ambiguity Level
Nor
mal
ized
FR
Pattern separator
Non-pattern separator
U Neural state 1
Neuralstate 2
C
Patternseparator
Non-patternseparator
Stat
e di
stan
ce
0
.2
.4
.6***
D
R²
Pattern separatorNon-pattern separator
0 5 10Units (%)0
10
20
Uni
ts (%
)
Distance of inflection point from ambiguity midpoint
0
1
.8
.2
.4
.6
0 1 2 3 4
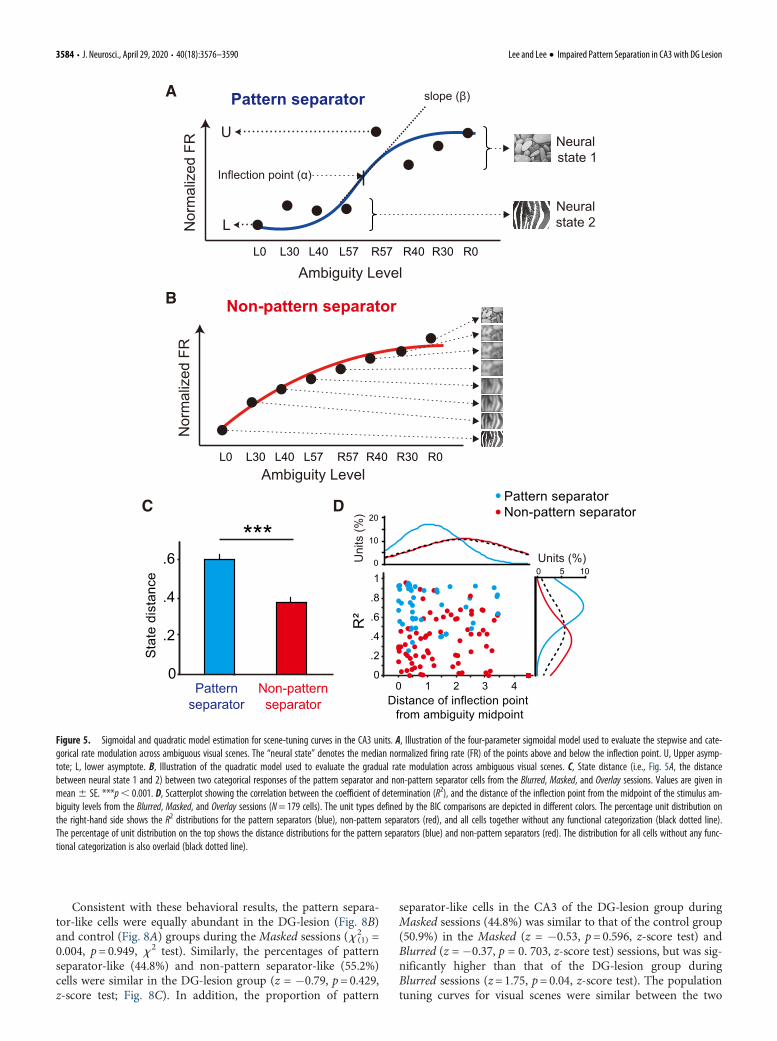
Figure 5. Sigmoidal and quadratic model estimation for scene-tuning curves in the CA3 units. A, Illustration of the four-parameter sigmoidal model used to evaluate the stepwise and cate-gorical rate modulation across ambiguous visual scenes. The “neural state” denotes the median normalized firing rate (FR) of the points above and below the inflection point. U, Upper asymp-tote; L, lower asymptote. B, Illustration of the quadratic model used to evaluate the gradual rate modulation across ambiguous visual scenes. C, State distance (i.e., Fig. 5A, the distancebetween neural state 1 and 2) between two categorical responses of the pattern separator and non-pattern separator cells from the Blurred, Masked, and Overlay sessions. Values are given inmean6 SE. ***p, 0.001. D, Scatterplot showing the correlation between the coefficient of determination (R2), and the distance of the inflection point from the midpoint of the stimulus am-biguity levels from the Blurred, Masked, and Overlay sessions (N= 179 cells). The unit types defined by the BIC comparisons are depicted in different colors. The percentage unit distribution onthe right-hand side shows the R2 distributions for the pattern separators (blue), non-pattern separators (red), and all cells together without any functional categorization (black dotted line).The percentage of unit distribution on the top shows the distance distributions for the pattern separators (blue) and non-pattern separators (red). The distribution for all cells without any func-tional categorization is also overlaid (black dotted line).
3584 • J. Neurosci., April 29, 2020 • 40(18):3576–3590 Lee and Lee · Impaired Pattern Separation in CA3 with DG Lesion
groups in Masked sessions (Fig. 8D). The sigmoidal modelexplained neural firing more powerfully than the quadraticmodel did in the control group (BIC = �27.81 for sigmoidalmodel; BIC = �21.65 for quadratic model), as well as in the DG-lesion group (BIC = �25.38 for sigmoidal model; BIC = �22.35for quadratic model).
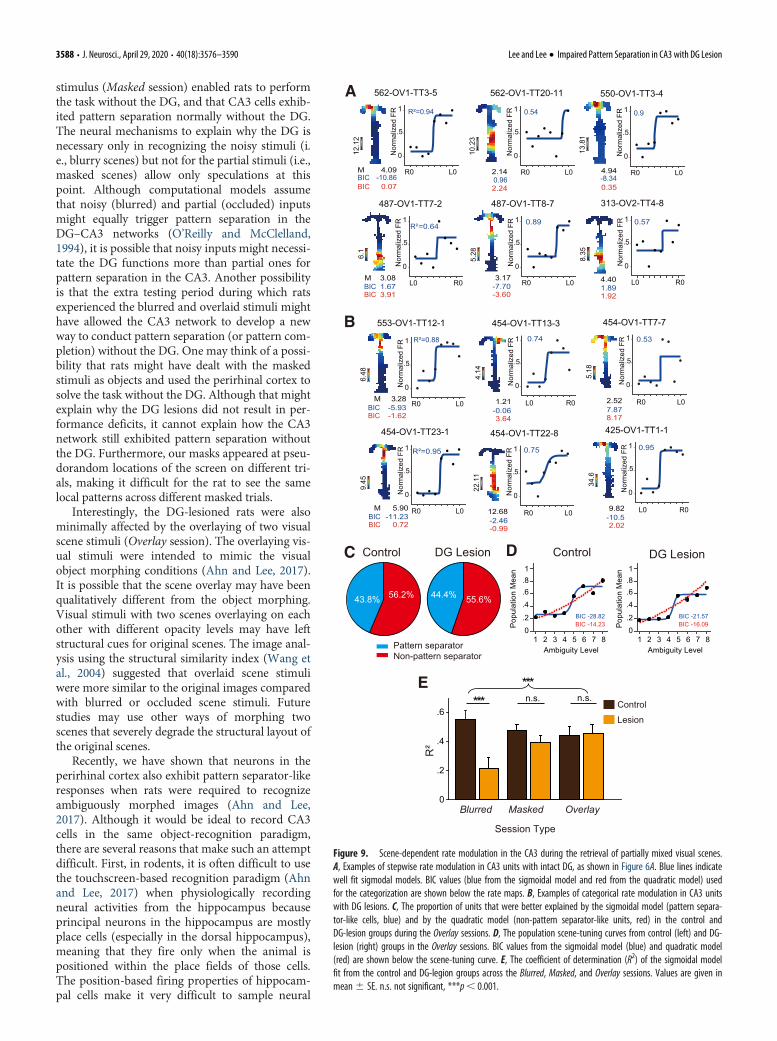
Similar to the Masked session, performance in the Overlaysession was not affected by DG lesions. During the Overlay ses-sion, pattern separator-like cells were as frequently found in theDG-lesion group (Fig. 9B) as in the control group (Fig. 9A;x 2(1) = 0.003, p=0.957, x 2 test; Fig. 9C). Similarly, the popula-
tion-tuning curves for visual scenes were similar between thetwo groups in Overlay sessions (Fig. 9D). The sigmoidal modelexplained the neural firing more powerfully than the quadraticmodel did in the control group (BIC = �28.82 for sigmoidalmodel; BIC = �14.23 for quadratic model), as well as in the DG-lesion group (BIC = �21.57 for sigmoidal model; BIC = �16.09
for quadratic model). Comparing the goodness-of-fit of the sig-moidal model across three session types revealed a significantinteraction between the group and session type factors (F(2,173) =3.904, p=0.022, two-way ANOVA) only during the Blurred ses-sion (t(173) = �3.401, p=0.001, Bonferroni corrected), but not inthe Masked session (t(173) = �1.241, p=0.216, Bonferroni cor-rected) or Overlay session (t(173) = 0.20, p=0.842, Bonferronicorrected; Fig. 9E).
These findings indicate that impaired performance of DG-lesioned rats during Blurred sessions was not due to any visualchanges in original familiar scenes. That is, altering the originalvisual scenes in such a way that rats could still see the overall pat-terns in the stimuli did not significantly disrupt performance asmuch as using blurred scenes. Moreover, the relatively robuststepwise tuning curves of the CA3 cells in the DG-lesioned ratsmay be the neural correlates of such robust performance in thelesion group.
C ED
Pattern separatorNon-pattern separator
DG LesionControl
50% 50%87.5%
R²
Inflection point
LesionControl
0.2.4.6.81
1 2 3 4 5 6 7 8
DG LesionControl
1 2 3 4 5 6 7 8
.8
.6
.4
.2
.8
.6
.4
.2
Popu
latio
n M
ean
BIC -26.62BIC -23.29
BICBIC
-15.12 -14.59
Ambiguity Level Ambiguity Level1 2 3 4 5 6 7 8
A
17.4
2
562-BL1-TT6-5
M 8.51BIC
BICBIC
BIC -2.50
R²: 0.73
-0.85 3.88 -0.85
14.8
3
313-BL2-TT18-1
1.39 1.96
0.59
16.3
5
562-BL1-TT4-4
4.8 -3.83
0.9
R0 L0
R0L0
R0 L0 R0R0 L0
0
.5
1
0
.5
1
0
.5
1
0
.5
1
R0 L0 R0 L0R0 L0 R0 L0
0
.5
1
Nor
mal
ized
FR
0
.5
1
6.49 -4.37
13.1
7
562-BL2-TT3-6
3.97 -9.83
0.92
-3.52 6.49 -17.20
0.96
13.2
8
313-BL1-TT17-2
M 2.42 5.99
0.34
20.1
5313-BL1-TT3-6
11.28 -5.85
0.86
0
.5
1
0
.5
1
10.5
2
487-BL1-TT8-1
6.6 5.99
0.34
5.28
487-BL1-TT8-6
3.04 -16.47
0
.5
1
R0 L0
5.31
562-BL1-TT6-7
2.0 6.74
0.48
6.81Ambiguity Level
B
18.4
5
553-BL2-TT24-3
M 9.2R0L0 R0 L0 R0 L0R0 L0
0
.5
1
0
.5
1
Nor
mal
ized
FR
0
.5
1
0
.5
1
2.29
553-BL1-TT1-2
1.240.590.05
0.5
7.52
0.02
2.36
0.49
R0 L0
0
.5
1
3.14
553-BL1-TT10-4
1.358.63
3.14
553-BL1-TT1-1
2.2211.77
16.8
1
425-BL1-TT1-4
7.52-6.98-7.98
0.88
5.07
0.3
BICBIC
5.61
0.4
5.84 Ambiguity LevelL0 R0
0
.5
1
10.7
9
471-BL2-TT24-5
6.2511.86
12.5%
Figure 6. Disrupted categorical rate modulation in the CA3 with DG lesions. A, Examples of stepwise rate modulation in the CA3 units with intact DG. M denotes the in-field mean firingrate, R2 denotes the goodness-of-fit of the better explaining model. BIC values (blue from the sigmoidal model and red from the quadratic model) used for the categorization are shown belowthe rate map. Blue lines indicate well fit sigmoidal models, and red lines indicate well fit quadratic models. B, Examples of gradual rate modulation in the CA3 units with DG lesions. The dottedlines indicate poor fit (R2 , 0.3) of the models. C, Scatterplot of the inflection points and the goodness-of-fit parameters from the sigmoidal model in Blurred sessions (N= 40 cells). The con-trol and lesion groups are marked in different colors. Units with inflection points,1 were excluded from the plot (7 units from the lesion group and 2 units from the control group). D, Theproportions of units that are better explained by the sigmoidal model (pattern separator-like cells, blue) and by the quadratic model (non-pattern separators, red) in the control and lesiongroups. E, The population scene-tuning curve from control (left) and DG-lesion group (right) in the Blurred sessions. BIC values from the sigmoidal model (blue) and quadratic model (red) areshown below the scene-tuning curves (blue solid line: sigmoidal, red dashed line: quadratic).
Lee and Lee · Impaired Pattern Separation in CA3 with DG Lesion J. Neurosci., April 29, 2020 • 40(18):3576–3590 • 3585
DiscussionThe current study showed that rats with severe damage to theDG were impaired in processing ambiguous scenes, but notwhen the scenes were unaltered. Corroborating these behavioralresults, this study found that scene-associated rate modulation inthe CA3 was weaker in rats with DG lesions than in controls.Also, fewer pattern separator-like cells were present in the CA3of rats with DG lesions compared to controls. In agreement withthese neural and behavioral findings, we found that, in contrastto controls, place cells in the CA3 from the DG-lesion groupwere not concentrated at the choice point of the maze, a regionstrategically important for task demand. These neural and behav-ioral findings were specific to conditions in which the originalscenes were made ambiguous by blurring, but not to conditionsin which the original scenes were masked to allow rats to recog-nize the overall visual patterns in scene stimuli. In sum, thesefindings suggest that the DG plays critical roles in inducing pat-tern separation in the CA3 during memory retrieval when origi-nal scenes are made ambiguous.
Computational, behavioral and physiological studies haveshown that the DG–CA3 networks are essential in pattern sepa-ration (Marr, 1971; O’Reilly and McClelland, 1994; Treves andRolls, 1994; Gilbert et al., 2001; Leutgeb et al., 2007; Bakker et al.,2008; Lee and Solivan, 2010; Nakashiba et al., 2012; Ahn and Lee,2014; Neunuebel and Knierim, 2014; GoodSmith et al., 2017; vanDijk and Fenton, 2018). However, behavioral evidence of pattern
separation in the DG–CA3 networks was obtained predomi-nantly using spatial memory tasks, in which rats were requiredto distinguish among similar spatial locations or environments(Gilbert et al., 2001; Nakashiba et al., 2012; van Dijk and Fenton,2018). In contrast, most physiological studies have recorded cellsin the DG or CA3 when rats forage for randomly scattered food,not during the performance of memory tasks. The results of ourstudy may fill the gap between behavioral and physiologicalresults, by showing that CA3 cells require the DG network tophysiologically display the characteristics of the pattern-separat-ing unit, including categorical and orthogonal coding of similarenvironmental stimuli. The absence of these pattern separator-like CA3 units was observed in the DG-lesion group, and thelesion group’s performance was impaired in Blurred sessions.
One of the models explaining the roles of the DG in facilitat-ing pattern separation emphasizes its ability to provide sparse,yet powerful inputs via mossy fibers to a small subset of CA3cells during the acquisition of memory (Treves and Rolls, 1994).The subset of cells chosen by the sparse inputs of the DG mayform a critical node, resulting in a rich Hebbian association ofenvironmental stimuli mostly fed via the perforant path from theentorhinal cortex. This model suggests that these memory repre-sentations in the CA3 network can be retrieved mostly by thecues provided via the perforant path and that the DG may not beinvolved in the retrieval of memory. Although these results mayseem to disagree with the predictions made by these computa-tional models, because DG lesions impaired our performance
A
CB
Mean FR (Hz) Normalized FR (Hz) Standard deviation
40
40
Lesion
Control7.79 ± 9.08
Prop
ortio
n (%
)0
10
20
30
40
0 10 20 30
010203040
0 10 20 30
4.31 ± 3.54Lesion
Control0.44 ± 0.09
0.49 ± 0.08
0
10
20
30
0.3 0.4 0.5 0.6 0.7
0.3 0.4 0.5 0.6 0.70
10
20
30 Lesion
Control0.34 ± 0.03
0.39 ± 0.02
0
10
20
30
0.3 0.34 0.38 0.42
0.3 0.34 0.38 0.420
10
20
30
-4
-2
0
2
4
1 2 3 4 5 6 7 8
Slop
e
Inflection point
3 parameters 4 parameters
LesionControl
Non-optimal fitting
R²M 1.39
0.59BIC 1.96
R0 L0
0
.5
1
313-BL2-TT18-1
R²
14.8
3
M 1.39 -1.2
BIC 14.34L0 R0
0
.5
1
Figure 7. Alternative models for the categorical rate modulation in the CA3. A, Distribution of the mean firing rates, normalized mean firing rates, and the SD of the normalized firing ratesof place cells from Blurred sessions (N= 40 neurons). B, Scatterplot of the inflection points and the slope at those points, estimated by the reduced sigmoidal model using only a single param-eter for both upper and lower asymptotes. The dotted box indicates the units showing the nonoptimal fitting. C, Example of nonoptimal fit caused by the reduced model (left), shown alongwith the model fit result from the full sigmoidal model.
3586 • J. Neurosci., April 29, 2020 • 40(18):3576–3590 Lee and Lee · Impaired Pattern Separation in CA3 with DG Lesion
during Blurred sessions, performance deficits were not observedwhen the original visual scenes were unaltered, partially occludedor blurred slightly. The previous computational models simu-lated the retrieval mostly of the original representations from theCA3 using partial and/or noisy cues (O’Reilly and McClelland,
1994). The relatively intact performanceof DG-lesioned rats under mildlyblurred conditions in our study providessupport for these computational models.Our results suggest that the DG is indis-pensable for memory retrieval whenfamiliar environmental stimuli are sig-nificantly altered. Therefore, when envi-ronmental inputs are ambiguous, themossy fiber-mediated inputs from theDG may carry some critical informationfor the CA3 network to access the origi-nal memory representations. Intact basicfiring properties of CA3 cells in the DG-lesioned rats when retrieving relativelyfamiliar visual scenes suggest that theDG network is specifically activatedwhen environmental ambiguity exceedsa certain threshold. Future studiesshould address the mechanism by whichthe DG network detects the level of am-biguity in the stimulus.
Consistent with the previous stud-ies, there was some damage in the CA1subfield as a result of the colchicineinjection into the DG. It is possiblethat the degraded pattern separation ofthe single units in the CA3 in the DG-lesion group might be attributable to thepartial damage in the CA1. However,prior behavioral studies reported dissoci-ations in performance with similar col-chicine-based lesion techniques andwith a similar amount of damage in theCA1 (Gilbert et al., 2001; Lee andKesner, 2003). Furthermore, the CA3receives major inputs from the DG,CA3, or entorhinal cortex, but notdirectly from the CA1 (Gonzales et al.,2001). Together, it is unlikely that thepartial damage in the CA1 was the majorcause of the degraded pattern separationin the DG-lesion group. Another con-cern for the DG-lesion group could bethe absence of mossy cells in the hilararea in that group. Mossy cells in thehilar region may play key roles in pro-viding feedback information to granulecells in the DG and bridging theCA3 and DG (Buckmaster et al.,1996). In addition, inactivating mossycells induced hyperactivity in granulecells and impaired pattern separation(Jinde et al., 2012). Unfortunately,because colchicine eliminates granulecells and mossy cells altogether, it isimpossible to determine the differentialcontributions of different cell types inthe current study. Future studies with
more cell type-selective methods are required to address theseissues.
One of the key findings in the current study is that, unlikeblurring the scenes, the partial occlusion of the visual scene
Figure 8. Scene-dependent rate modulation in the CA3 during retrieval of partially occluded visual scenes. A, Examples ofstepwise rate modulation in CA3 units with intact DG, as shown in Figure 6A. Blue lines indicate well fit sigmodal models. BICvalues (blue from the sigmoidal model and red from the quadratic model) used for the categorization are shown below the ratemap. B, Examples of categorical rate modulation in CA3 units with DG lesions. C, The proportion of units that were betterexplained by the sigmoidal model (pattern separator-like cells, blue) and by the quadratic model (non-pattern separator-likeunits, red) in the control and DG-lesion groups during the Masked sessions. D, The population scene-tuning curve from control(left) and DG-lesion group (right) in the Masked sessions. BIC values from the sigmoidal model (blue) and quadratic model (red)are shown below the scene-tuning curve.
Lee and Lee · Impaired Pattern Separation in CA3 with DG Lesion J. Neurosci., April 29, 2020 • 40(18):3576–3590 • 3587
stimulus (Masked session) enabled rats to performthe task without the DG, and that CA3 cells exhib-ited pattern separation normally without the DG.The neural mechanisms to explain why the DG isnecessary only in recognizing the noisy stimuli (i.e., blurry scenes) but not for the partial stimuli (i.e.,masked scenes) allow only speculations at thispoint. Although computational models assumethat noisy (blurred) and partial (occluded) inputsmight equally trigger pattern separation in theDG–CA3 networks (O’Reilly and McClelland,1994), it is possible that noisy inputs might necessi-tate the DG functions more than partial ones forpattern separation in the CA3. Another possibilityis that the extra testing period during which ratsexperienced the blurred and overlaid stimuli mighthave allowed the CA3 network to develop a newway to conduct pattern separation (or pattern com-pletion) without the DG. One may think of a possi-bility that rats might have dealt with the maskedstimuli as objects and used the perirhinal cortex tosolve the task without the DG. Although that mightexplain why the DG lesions did not result in per-formance deficits, it cannot explain how the CA3network still exhibited pattern separation withoutthe DG. Furthermore, our masks appeared at pseu-dorandom locations of the screen on different tri-als, making it difficult for the rat to see the samelocal patterns across different masked trials.
Interestingly, the DG-lesioned rats were alsominimally affected by the overlaying of two visualscene stimuli (Overlay session). The overlaying vis-ual stimuli were intended to mimic the visualobject morphing conditions (Ahn and Lee, 2017).It is possible that the scene overlay may have beenqualitatively different from the object morphing.Visual stimuli with two scenes overlaying on eachother with different opacity levels may have leftstructural cues for original scenes. The image anal-ysis using the structural similarity index (Wang etal., 2004) suggested that overlaid scene stimuliwere more similar to the original images comparedwith blurred or occluded scene stimuli. Futurestudies may use other ways of morphing twoscenes that severely degrade the structural layout ofthe original scenes.
Recently, we have shown that neurons in theperirhinal cortex also exhibit pattern separator-likeresponses when rats were required to recognizeambiguously morphed images (Ahn and Lee,2017). Although it would be ideal to record CA3cells in the same object-recognition paradigm,there are several reasons that make such an attemptdifficult. First, in rodents, it is often difficult to usethe touchscreen-based recognition paradigm (Ahnand Lee, 2017) when physiologically recordingneural activities from the hippocampus becauseprincipal neurons in the hippocampus are mostlyplace cells (especially in the dorsal hippocampus),meaning that they fire only when the animal ispositioned within the place fields of those cells.The position-based firing properties of hippocam-pal cells make it very difficult to sample neural
C
A
Control DG Lesion Control DG Lesion
B
E
Pattern separatorNon-pattern separator
44.4% 55.6%56.2%43.8%
6.1
487-OV1-TT7-2
M 3.08BIC 1.67
R² =0.64 0.89 0.57
BIC 3.91R0L0
0
.5
1
Nor
mal
ized
FR
5.28
487-OV1-TT8-7
3.17
BIC
-7.70
BIC
-3.60L0R0
0
.5
1
Nor
mal
ized
FR
8.35
313-OV2-TT4-8
4.40 1.89 1.92
R0L0
0
.5
1
Nor
mal
ized
FR
12.1
2
562-OV1-TT3-5
4.09M
0.07
L0R0
0
.5
1
Nor
mal
ized
FR R²=0.94
BIC -10.86BIC
10.2
3
562-OV1-TT20-11
2.14
2.24
L0R0
0
.5
1
Nor
mal
ized
FR 0.54
0.96
13.8
1
550-OV1-TT3-4
4.94
0.35
L0R0
0
.5
1
Nor
mal
ized
FR 0.9
-8.34
6.48
553-OV1-TT12-1
M 3.28
M
L0R0
0
.5
1
Nor
mal
ized
FR
BIC -5.93
R²=0.88
BIC -1.62
R²=0.95
9.45
454-OV1-TT23-1
5.90 -11.23
0.72
L0R0
0
.5
1
Nor
mal
ized
FR
22.1
1
454-OV1-TT22-8
12.68 L0R0
0
.5
1
Nor
mal
ized
FR
-2.46 -0.99
0.75
0.74
4.14
454-OV1-TT13-3
1.21 R0L0
0
.5
1
Nor
mal
ized
FR
-0.06 3.64
5.18
454-OV1-TT7-7
2.52 L0R0
0
.5
1
Nor
mal
ized
FR
7.87 8.17
0.53
34.6
425-OV1-TT1-1
9.82 R0L0
0
.5
1
Nor
mal
ized
FR
-10.5 2.02
0.95
**
R²
0
.2
.4
.6LesionControl
Blurred Masked Overlay
n.s. n.s.****
Session Type
D
Popu
latio
n M
ean
BICBIC
-21.57 -16.09
1 2 3 4 5 6 7 8Ambiguity Level
BIC -28.82BIC -14.23
1 2 3 4 5 6 7 8Ambiguity Level
.81
.6
.4
.20
.81
.6
.4
.20Po
pula
tion
Mea
n
Figure 9. Scene-dependent rate modulation in the CA3 during the retrieval of partially mixed visual scenes.A, Examples of stepwise rate modulation in CA3 units with intact DG, as shown in Figure 6A. Blue lines indicatewell fit sigmodal models. BIC values (blue from the sigmoidal model and red from the quadratic model) usedfor the categorization are shown below the rate maps. B, Examples of categorical rate modulation in CA3 unitswith DG lesions. C, The proportion of units that were better explained by the sigmoidal model (pattern separa-tor-like cells, blue) and by the quadratic model (non-pattern separator-like units, red) in the control andDG-lesion groups during the Overlay sessions. D, The population scene-tuning curves from control (left) and DG-lesion (right) groups in the Overlay sessions. BIC values from the sigmoidal model (blue) and quadratic model(red) are shown below the scene-tuning curve. E, The coefficient of determination (R2) of the sigmoidal modelfit from the control and DG-legion groups across the Blurred, Masked, and Overlay sessions. Values are given inmean6 SE. n.s. not significant, ***p, 0.001.
3588 • J. Neurosci., April 29, 2020 • 40(18):3576–3590 Lee and Lee · Impaired Pattern Separation in CA3 with DG Lesion
activities from enough cells when a behavioral apparatus requiresthe rat to perform the task in a fixed area. Second, unlike theresults from the human studies (Kirwan and Stark, 2007; Bakkeret al., 2008; Lacy et al., 2011; Motley and Kirwan, 2012;Stevenson et al., 2020), prior behavioral studies suggest thatobject recognition itself may not be hippocampal dependent inrodents (Gilbert and Kesner, 2003; Jo and Lee, 2010). On theother hand, inactivating the perirhinal cortex in the current vis-ual scene task resulted in only minor deficits (Park et al., 2017),compared with the devastating effects of the hippocampal inacti-vation (data not shown). Therefore, we reasoned that using atask that requires spatial navigation on the basis of visual pat-terns that can be manipulated similarly as in the study by Ahnand Lee (2017) should provide the best experimental design tophysiologically examine pattern separation in the CA3 with orwithout the DG. The results of the current study, togetherwith our findings in the perirhinal cortex for object recogni-tion (Ahn and Lee, 2017), strongly suggest that the neural net-works perform the signature behavior of pattern separationacross different regions of the brain when the optimal type ofstimulus (e.g., object in the perirhinal cortex, visual scene inthe hippocampus) is ambiguously altered from the originalpattern.
In the absence of the DG, cells in the CA3 tended to respondgradually to continuously changing ambiguous visual scenes.Inputs from the entorhinal cortex via the perforant path to theCA3 network are likely to scale linearly with the degree of stimu-lus similarity. The CA1 network also receives direct inputs fromthe entorhinal cortex, with prior studies showing the relativelylinear mapping of environmental ambiguity by CA1 cells (Lee etal., 2004b; Leutgeb et al., 2004; Vazdarjanova and Guzowski,2004). Our study confirms the nature of these entorhinal inputsto the hippocampus and re-emphasizes the critical roles of theDG in implementing categorical dynamics in information proc-essing using gradually changing inputs from the entorhinal cor-tex in the hippocampal network. Our findings suggest that thepattern-separating operations of the DG network may be neces-sary for the acquisition of novel environmental contexts as wellas for the retrieval of memory representations when encounter-ing altered environments. Such a pattern-separating computa-tional component may be essential in orchestrating networkdynamics to strategically organize behavior for efficient problemsolving in a goal-directed task.
ReferencesAhn JR, Lee I (2014) Intact CA3 in the hippocampus is only sufficient for
contextual behavior based on well-learned and unaltered visual back-ground. Hippocampus 24:1081–1093.
Ahn JR, Lee I (2017) Neural correlates of both perception and memory forobjects in the rodent perirhinal cortex. Cereb Cortex 27:3856–3868.
Bakker A, Kirwan CB, Miller M, Stark CEL (2008) Pattern separation in thehuman hippocampal CA3 and dentate gyrus. Science 319:1640–1642.
Berron D, Schütze H, Maass A, Cardenas-Blanco A, Kuijf HJ, Kumaran D,Düzel E (2016) Strong evidence for pattern separation in human dentategyrus. J Neurosci 36:7569–7579.
Brown TI, Hasselmo ME, Stern CE (2014) A high-resolution study of hippo-campal and medial temporal lobe correlates of spatial context and pro-spective overlapping route memory. Hippocampus 24:819–839.
Buckmaster PS, Wenzel HJ, Kunkel DD, Schwartzkroin PA (1996) Axonarbors and synaptic connections of hippocampal mossy cells in the rat invivo. J Comp Neurol 366:271–292.
Danielson NB, Turi GF, Ladow M, Chavlis S, Petrantonakis PC, Poirazi P,Losonczy A (2017) In vivo imaging of dentate gyrus mossy cells in behav-ing mice. Neuron 93:552–559.e4.
Delcasso S, Huh N, Byeon JS, Lee J, Jung MW, Lee I (2014) Functional rela-tionships between the hippocampus and dorsomedial striatum in learn-ing a visual scene-based memory task in rats. J Neurosci 34:15534–15547.
Eichenbaum H (2000) A cortical-hippocampal system for declarative mem-ory. Nat Rev Neurosci 1:41–50.
Gilbert PE, Kesner RP (2003) Recognition memory for complex visual dis-criminations is influenced by stimulus interference in rodents with peri-rhinal cortex damage. Learn Mem 10:525–530.
Gilbert PE, Kesner RP (2006) The role of the dorsal CA3 hippocampal subre-gion in spatial working memory and pattern separation. Behav Brain Res169:142–149.
Gilbert PE, Kesner RP, DeCoteau WE (1998) Memory for spatial location:role of the hippocampus in mediating spatial pattern separation. JNeurosci 18:804–810.
Gilbert PE, Kesner RP, Lee I (2001) Dissociating hippocampal subregions: adouble dissociation between dentate gyrus and CA1. Hippocampus11:626–636.
Gonzales RB, DeLeon Galvan CJ, Rangel YM, Claiborne BJ (2001)Distribution of thorny excrescences on CA3 pyramidal neurons in the rathippocampus. J Comp Neurol 430:357–368.
GoodSmith D, Chen X, Wang C, Kim SH, Song H, Burgalossi A, ChristianKM, Knierim JJ (2017) Spatial representations of granule cells and mossycells of the dentate gyrus. Neuron 93:677–690.e5.
Jinde S, Zsiros V, Jiang Z, Nakao K, Pickel J, Kohno K, Belforte JE, NakazawaK (2012) Hilar mossy cell degeneration causes transient dentate granulecell hyperexcitability and impaired pattern separation. Neuron 76:1189–1200.
Jo YS, Lee I (2010) Disconnection of the hippocampal-perirhinal cortical cir-cuits severely disrupts object-place paired associative memory. J Neurosci30:9850–9858.
Kesner RP, Rolls ET (2015) A computational theory of hippocampal func-tion, and tests of the theory: new developments. Neurosci Biobehav Rev48:92–147.
Kirwan CB, Stark CE (2007) Overcoming interference: an fMRI investigationof pattern separation in the medial temporal lobe. Learn Mem 14:625–633.
Lacy JW, Yassa MA, Stark SM, Muftuler LT, Stark CE (2011) Distinct patternseparation related transfer functions in human CA3/dentate and CA1revealed using high-resolution fMRI and variable mnemonic similarity.Learn Mem 18:15–18.
Lee H, Wang C, Deshmukh SS, Knierim JJ (2015) Neural population evi-dence of functional heterogeneity along the CA3 transverse axis: patterncompletion versus pattern separation. Neuron 87:1093–1105.
Lee I, Kesner RP (2003) Differential roles of dorsal hippocampal subregionsin spatial working memory with short versus intermediate delay. BehavNeurosci 117:1044–1053.
Lee I, Kesner RP (2004) Encoding versus retrieval of spatial memory: doubledissociation between the dentate gyrus and the perforant path inputs intoCA3 in the dorsal hippocampus. Hippocampus 14:66–76.
Lee I, Solivan F (2010) Dentate gyrus is necessary for disambiguating similarobject-place representations. Learn Mem 17:252–258.
Lee I, Kim J, Lee C (1999) Anatomical characteristics and three-dimensionalmodel of the dog dorsal lateral geniculate body. Anat Rec 256:29–39.
Lee I, Rao G, Knierim JJ (2004a) A double dissociation between hippocampalsubfields: differential time course of CA3 and CA1 place cells for process-ing changed environments. Neuron 42:803–815.
Lee I, Yoganarasimha D, Rao G, Knierim JJ (2004b) Comparison of popula-tion coherence of place cells in hippocampal subfields CA1 and CA3.Nature 430:456–459.
Leutgeb JK, Leutgeb S, Moser M-B, Moser EI (2007) Pattern separation inthe dentate gyrus and CA3 of the hippocampus. Science 315:961–966.
Leutgeb S, Leutgeb JK, Treves A, Moser MB, Moser EI (2004) Distinct en-semble codes in hippocampal areas CA3 and CA1. Science 305:1295–1298.
Marr D (1971) Simple memory: a theory for archicortex. Philos Trans R SocLond B Biol Sci 262:23–81.
McNaughton BL, Barnes CA, Meltzer J, Sutherland RJ (1989) Hippocampalgranule cells are necessary for normal spatial learning but not for spa-tially-selective pyramidal cell discharge. Exp Brain Res 76:485–496.
Motley SE, Kirwan CB (2012) A parametric investigation of pattern separa-tion processes in the medial temporal lobe. J Neurosci 32:13076–13085.
Lee and Lee · Impaired Pattern Separation in CA3 with DG Lesion J. Neurosci., April 29, 2020 • 40(18):3576–3590 • 3589
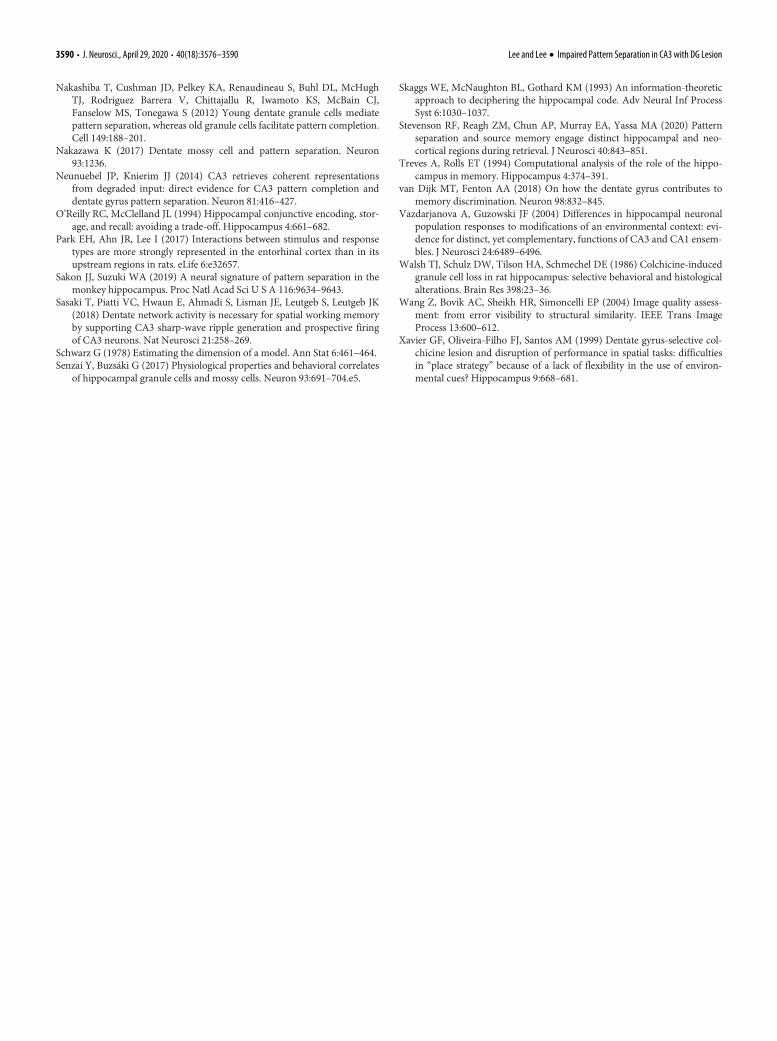
Nakashiba T, Cushman JD, Pelkey KA, Renaudineau S, Buhl DL, McHughTJ, Rodriguez Barrera V, Chittajallu R, Iwamoto KS, McBain CJ,Fanselow MS, Tonegawa S (2012) Young dentate granule cells mediatepattern separation, whereas old granule cells facilitate pattern completion.Cell 149:188–201.
Nakazawa K (2017) Dentate mossy cell and pattern separation. Neuron93:1236.
Neunuebel JP, Knierim JJ (2014) CA3 retrieves coherent representationsfrom degraded input: direct evidence for CA3 pattern completion anddentate gyrus pattern separation. Neuron 81:416–427.
O’Reilly RC, McClelland JL (1994) Hippocampal conjunctive encoding, stor-age, and recall: avoiding a trade-off. Hippocampus 4:661–682.
Park EH, Ahn JR, Lee I (2017) Interactions between stimulus and responsetypes are more strongly represented in the entorhinal cortex than in itsupstream regions in rats. eLife 6:e32657.
Sakon JJ, Suzuki WA (2019) A neural signature of pattern separation in themonkey hippocampus. Proc Natl Acad Sci U S A 116:9634–9643.
Sasaki T, Piatti VC, Hwaun E, Ahmadi S, Lisman JE, Leutgeb S, Leutgeb JK(2018) Dentate network activity is necessary for spatial working memoryby supporting CA3 sharp-wave ripple generation and prospective firingof CA3 neurons. Nat Neurosci 21:258–269.
Schwarz G (1978) Estimating the dimension of a model. Ann Stat 6:461–464.Senzai Y, Buzsáki G (2017) Physiological properties and behavioral correlates
of hippocampal granule cells and mossy cells. Neuron 93:691–704.e5.
Skaggs WE, McNaughton BL, Gothard KM (1993) An information-theoreticapproach to deciphering the hippocampal code. Adv Neural Inf ProcessSyst 6:1030–1037.
Stevenson RF, Reagh ZM, Chun AP, Murray EA, Yassa MA (2020) Patternseparation and source memory engage distinct hippocampal and neo-cortical regions during retrieval. J Neurosci 40:843–851.
Treves A, Rolls ET (1994) Computational analysis of the role of the hippo-campus in memory. Hippocampus 4:374–391.
van Dijk MT, Fenton AA (2018) On how the dentate gyrus contributes tomemory discrimination. Neuron 98:832–845.
Vazdarjanova A, Guzowski JF (2004) Differences in hippocampal neuronalpopulation responses to modifications of an environmental context: evi-dence for distinct, yet complementary, functions of CA3 and CA1 ensem-bles. J Neurosci 24:6489–6496.
Walsh TJ, Schulz DW, Tilson HA, Schmechel DE (1986) Colchicine-inducedgranule cell loss in rat hippocampus: selective behavioral and histologicalalterations. Brain Res 398:23–36.
Wang Z, Bovik AC, Sheikh HR, Simoncelli EP (2004) Image quality assess-ment: from error visibility to structural similarity. IEEE Trans ImageProcess 13:600–612.
Xavier GF, Oliveira-Filho FJ, Santos AM (1999) Dentate gyrus-selective col-chicine lesion and disruption of performance in spatial tasks: difficultiesin “place strategy” because of a lack of flexibility in the use of environ-mental cues? Hippocampus 9:668–681.
3590 • J. Neurosci., April 29, 2020 • 40(18):3576–3590 Lee and Lee · Impaired Pattern Separation in CA3 with DG Lesion