impediments to fair housing report - cityofsalem.net · impediments to fair housing choice are...
TRANSCRIPT

1
ANALYSIS OF IMPEDIMENTS TO FAIR
HOUSING City of Salem CDBG
City of Salem/Keizer HOME Consortium
September 2014
Contact: City of Salem Urban Development Department 350 Commercial Street NE Salem, OR 97301

2
INTRODUCTION AND GENERAL SUMMARY
ASSESSMENT OF THE IMPEDIMENTS TO FAIR HOUSING In order to continue receiving federal funds for housing and community development activities in Salem and Keizer, the City of Salem is required by the U.S. Department of Housing and Urban Development (HUD) to prepare a Housing and Community Development Consolidated Plan (Consolidated Plan). The Consolidated Plan describes strategies, priorities, and proposed actions including activities taken to Affirmatively Further Fair Housing. In order to Affirmatively Further Fair Housing, HUD requires jurisdictions that receive federal funds to prepare an Analysis of Impediments to Fair Housing Choice and develop strategies to overcome the effects of identified impediments.
Impediments to Fair Housing Choice are defined as any actions, omissions, or decisions taken because of protected class status that have an effect of restricting housing choice or the availability of housing choice. The federally protected classes are race, color, religion, sex, disability, familial status, or national origin. The state of Oregon adds the following classes as protected classes within the state of Oregon: marital status, source of income, sexual orientation including gender identity, honorably discharged veterans/military status (WA) and domestic violence. At a local level, age is added. The Analysis reviews the entitlement community’s laws, regulations, administrative procedures, and practices. It assesses how laws affect the location, availability, and accessibility of housing while considering conditions, both public and private, affecting fair housing choice for all protected classes within the jurisdiction.
City of Salem recognizes that there are many obstacles that prevent residents from attaining or retaining housing. The costs of housing or incentives to develop, maintain, or improve housing in Salem and Keizer are affected by both public and private sector policies. Public policies include taxation of land and other property, land use regulations, zoning ordinances, building codes, fees, and urban growth boundaries. Private sector policies include the tightening of lending standards, unfair lending practices, housing discrimination, and other issues that directly or indirectly affect an individual’s housing choice.
Funding and Services The Federal Programs Division of the City of Salem Urban Development Department administers the federal allocations of Community Development Block Grant (CDBG) for Salem and HOME Investment Partnerships Program (HOME) funds for both Salem and Keizer. CDBG and HOME funds are provided by HUD to fund housing activities, community development projects, public improvements and public services for the benefit of low- and moderate-income individuals, families, and neighborhoods. In 2012, staff of the Urban Development Department-Federal Programs Division attended a Fair Housing class.

3
FAIR HOUSING LAWS Title VIII of the Civil Right Act outlaws discrimination in regards to access to housing resources. Also known as the Fair Housing Act, the act currently encompasses federally-protected classes including:
Race Color Religion National Origin Sex Disability (added in 1988) Familial Status (having children under 18 in a household, including pregnant women)
(added in 1988)
The Fair Housing Act outlaws discrimination in the sale, rental, and financing of housing based on the protected classes listed above.
The state of Oregon adds the following classes as protected classes within the state of Oregon:
Marital status
Source of income
Sexual orientation including gender identity
Honorably discharged veterans/military status (WA)
Domestic violence.
Salem’s Revised Code Chapter 97 (Human Rights), in addition to the above stated protected classes, ensures that age and domestic partnership are protected against housing discrimination.
CONDUCT OF THE ANALYSIS This Analysis of Impediments to Fair Housing builds on the Impediments Analysis completed in September 2014. It considers information, strategies, and goals contained in the 2015-2019 Housing and Community Development Consolidated Plan. City of Salem Urban Development Department staff reviewed several documents and information during the development of this analysis. Information from the following agencies was included in the analysis:
Fair Housing Council of Oregon (FHCO) Mid-Willamette Valley Council of Government Salem Human Rights and the Human Rights & Relation Advisory Commission Salem Housing Authority United States Census Bureau United States Department of Housing and Urban Development (HUD) Salem Area Transit City-data.com Salem Community Development Department-Planning Division Oregon Labor trends City of Salem Urban Development Mid-Willamette Valley Community Action Agency (Continuum of Care documentation)

4
SUMMARY OF IMPEDIMENTS IDENTIFIED Impediments to fair housing are affected by both the public and private sector in Salem and Keizer. Fair housing programs and practices, especially in recent years, have gone a long way toward addressing many actual and potential impediments in the area. A summary of identified Impediments and recommendations are discussed below.
Impediment: Fees and Charges In the City of Salem’s Organizational/Business Survey, 75% of respondents stated that the primary barrier to their clients accessing affordable housing were fees and charges. Some of the reasons that this is a barrier for their clients include: inability to qualify for jobs with adequate salaries (full-time, permanent), lack of income, increase in rental application fees, and coming up with move-in costs (i.e. deposit and first month’s rent). This is consistent with the overwhelming response to the Organizational/Business Survey, the Housing and Community Needs Survey, and documentation from other reports such as the Housing Needs Assessment (Mid-Willamette Valley Council of Governments, City of Salem) stating that the highest priority for the next five years is funding of job training programs and job creation projects so that persons are able to pay the fees associated with housing.
Impediment: Limitations In the City of Salem’s Organizational/Business Survey, 50% of respondents indicated that the primary barriers to their clients accessing affordable housing are limitations. The three primary limitations listed in the survey response were criminal record, negative rental history, and alcohol and drug issues. Additionally, through this analysis, it appears there is a significant limitation for persons with disabilities. As indicated in the fair housing complaints, this population reports more frequently violations of fair housing. Disabilities may also limit the number of units that the person can live in due to accessibility requirements and the costs associated to make reasonable accommodations. Other limitations listed included: limited English proficiency, lack of culturally appropriate services, gender status (transgendered), fair market rent (FMR), cycle of abuse and poverty, and mental illness.
Impediment: Limited Availability In responses to the City of Salem’s Organizational/Business Survey, Limited Availability was the third most frequently reported barrier for their clients accessing affordable housing. The reasons listed for limited availability included the following: lack of affordable units for persons with disabilities, limited funding, lack of affordable housing in desirable areas, long wait lists, and policies affecting return on residential investment. The need for additional affordable housing was also indicated in the Housing Needs Analysis (Mid-Willamette Valley Council of Governments and the City of Salem). The overwhelming type indicated through these analyses and national housing analyses are “aging in place” units. “Aging in place” units would meet the needs of all populations including the elderly and the disabled, and ensure lower vacancy rates.
5
Other Impediments The 2014 Impediments analysis identified numerous barriers to fair housing in Salem and Keizer. Several barriers to affordable housing were also identified in the Consolidated Plan to be problems intensifying the lack of access and availability to fair housing choices. Some of the barriers to affordable housing include:
Job Training and Higher Education Job Creation Lack of “Aging in Place” units Lack of 1-2 bedroom Units Lack of coordinated housing (integrated self-sufficiency programs)
BACKGROUND DATA
Demographics Information Salem, the capital city of Oregon and its third largest city, lies in the center of the lush Willamette River Valley, 47 miles from Portland. Salem is a city of over 47 square miles, located an hour from the Cascade Mountains to the east and an hour from the Pacific Ocean beaches to the west. Salem’s current population is 157,770 (2013).1 Real GMP Growth Rates for Salem 2014 are 1.0. The unemployment rate is 7.5 according to the U.S. Conference of Mayors U.S. Metro Economies publication. Presently, at a population of 36,295, Keizer is the 14th largest City in Oregon. It is nestled in the center of the Willamette Valley and is recognized as the “Iris Capital of the World.” The City is bordered on the western edge by the Willamette River, southern edge by the city of Salem, eastern edge by Interstate 5, and the northern edge by rural portions of Marion County. In the 1990’s, the City experienced a rapid amount of new residential building and growth, establishing Keizer as one of the fastest growing cities in Oregon. In spite of this growth, the community continues to preserve its small-town pride by supporting the largest volunteer little league organization in Oregon and community-wide events, such as the Keizer Iris Festival and the annual Miracle of Christmas lighting display. Opening for the first season in 1997, the Keizer Stadium is home to the Volcanoes, a minor league baseball team affiliated with the San Francisco Giants. 2 Population The rapid increase in population growth experienced in Keizer and Salem is due to net migration into the area. Major industries in the Mid-Willamette Valley region, including agriculture, food & beverage products, metals, machinery and equipment, forest products, specialty materials manufacturing (e.g. fertilizer mixing, plastic products, and fabric coating), and traded sector services (e.g. office administrative services, higher education, and state and local non-education), have a competitive advantage as evidenced in the Mid-Willamette Valley Council of Governments Comprehensive Economic Development Strategy (CEDS). Salem alone witnessed an increased population growth of 36.6% from 1990 to 2005. Between 2000 and 2010, the
1 This discussion is taken from the welcome page on cityofsalem.net 2 This discussion is taken from Keizer.org

6
population grew by 12.9% in Salem while Keizer witnessed an increase of 13.3% in its population. Between 2012 and 2013, Marion County experienced a 0.7% increase in population and Polk County experienced a 0.6% population increase according to Portland State University’s Population Estimates for Oregon and Counties. The total population estimate for Salem-Keizer in 2013 was 194,565. Salem’s population alone was 157,770. The Median age of residents in Salem and Keizer stands at 34.5 years and 35.7 years respectively, compared to 38.4 years for the entire state of Oregon.
Table 1 Population Total: 2000 and 2010
Population Totals: Salem and Keizer, 2000 and 2010
Salem Keizer
2000 2010 % Change 2000 2010 % Change
Population 136,924 154,637 12.9% 32,203 36,478 13.3%
Families 32,326 36,261 12.1% 8,642 9.498 9.9%
Households 50,676 57,290 13.1% 12,110 13,703 13.2% Source: U.S Census Bureau, 2010 Census, Summary File 1; 2000 Census, Summary File 1. Tabulated by Population Research Center, Portland State University.
Racial and Ethnic Composition A majority of Salem and Keizer residents are white although data shows a 1.2 and 4.5 percentage decline in that population between 2005 and 2010 for the two cities respectively. The increasing numbers of minorities in the Salem/Keizer area suggests that the jurisdiction is expected to have greater responsibilities serving low- and moderate income individuals and an opportunity to reach out to minority groups and communities.
Table 2 Population by Race and Ethnicity, 2010
Race Salem Keizer Oregon
White 79% 82.5% 83.6%
Black/African American 1.5% 0.8% 1.8%
American Indian and Alaskan Native 1.5% 1.3% 1.4%
Asian 2.7% 1.6% 3.7%
Native Hawaiian and Pacific Islander 0.9% 0.6% 0.3%
Some other race 10.1.% 9.0% 5.3%
Two or more race 2.8% 4.1% 3.8%
Total 100% 100% 100% Hispanic or Latino (of any race) 20.3% 18.3% 11.7%
Sources: U.S. Census Bureau, 2010 Census, Summary File 1; 2000 Census, Summary File1. Tabulated by Population Research Center, Portland State University.
7
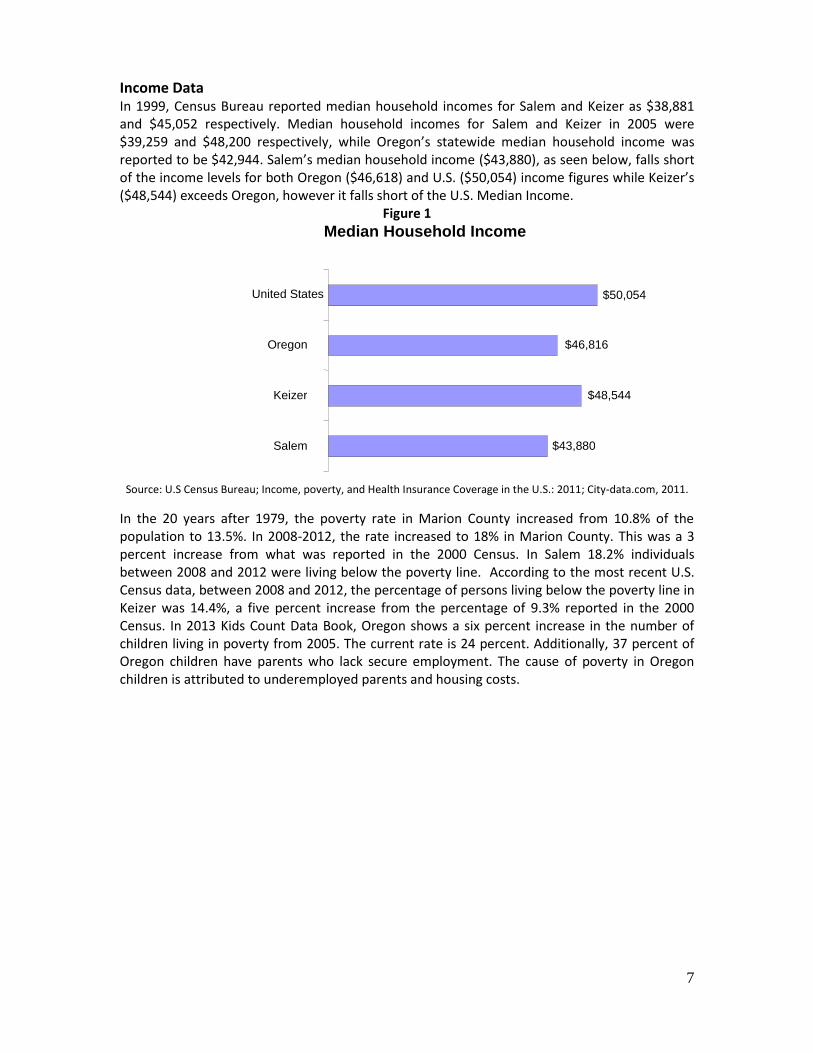
Income Data In 1999, Census Bureau reported median household incomes for Salem and Keizer as $38,881 and $45,052 respectively. Median household incomes for Salem and Keizer in 2005 were $39,259 and $48,200 respectively, while Oregon’s statewide median household income was reported to be $42,944. Salem’s median household income ($43,880), as seen below, falls short of the income levels for both Oregon ($46,618) and U.S. ($50,054) income figures while Keizer’s ($48,544) exceeds Oregon, however it falls short of the U.S. Median Income.
Figure 1
Source: U.S Census Bureau; Income, poverty, and Health Insurance Coverage in the U.S.: 2011; City-data.com, 2011.
In the 20 years after 1979, the poverty rate in Marion County increased from 10.8% of the population to 13.5%. In 2008-2012, the rate increased to 18% in Marion County. This was a 3 percent increase from what was reported in the 2000 Census. In Salem 18.2% individuals between 2008 and 2012 were living below the poverty line. According to the most recent U.S. Census data, between 2008 and 2012, the percentage of persons living below the poverty line in Keizer was 14.4%, a five percent increase from the percentage of 9.3% reported in the 2000 Census. In 2013 Kids Count Data Book, Oregon shows a six percent increase in the number of children living in poverty from 2005. The current rate is 24 percent. Additionally, 37 percent of Oregon children have parents who lack secure employment. The cause of poverty in Oregon children is attributed to underemployed parents and housing costs.
Median Household Income
$43,880
$48,544
$46,816
$50,054
Salem
Keizer
Oregon
United States

8
Table 3 Household Income: Salem and Keizer 2005-2007 and 2008-2012
Salem Keizer
2005-2007 2008-2012 2005-2007 2008-2012
Income No. % No. % No. % No. %
Less than $10,000 3,892 7.1 4,696 8.1 773 5.7 632 4.6
$10,000-$14,999 3,409 6.2 3,519 6.1 823 6.0 755 5.5
$15,000-$24,999 7,621 13.9 6,575 11.4 1,332 9.7 1,291 9.4
$25,000-$34,499 7,806 14.2 6,966 12 1,524 11.2 2,019 14.7
$35,000-$49,999 8,779 16.0 9,921 17.1 2,115 15.5 1,854 13.5
$50,000-$74,999 10,877 19.8 10,667 18.4 2,983 21.8 3,077 22.4
$75,000-$99,999 5,474 10.0 6,820 11.8 2,267 16.6 1,909 13.9
$100,000-$149,999 5,028 9.2 5,904 10.2 1,317 9.6 1,415 10.3
$150,000 or more 2,059 3.6 2,844 4.9 529 3.8 563 4.1
Total 54,946 100 57,912 100 13,663 100 13,740 100
Median Household Income $42,050 $51,617 $51,708
Source: American Community Survey 2005-2007 and 2008-2012.
Employment Management, professional, and related occupations comprise the largest areas of employment for the civilian population 16 years of age and above in Salem and Keizer according to the ACS 2008-2012 data. Sales and office occupations follow closely in both cities while natural resources, construction, and maintenance occupations jobs have the least individuals in the labor force according to the ACS 2008-2012 data. The Bureau of Labor Statistics for Salem indicated the largest numbers of employees are in trade, transportation, and utilities with education and health services close behind. The total number of employed population 16 years and over for Salem from 2008-2012 was 65,191, for Keizer it was 16,392, and for the state of Oregon it was 1,743,524.
Table 4 Employment in Salem: March 2014
Type of Occupation Employees
Mining and Logging 1,001
Construction 6,500
Manufacturing 10,800
Trade, Transportation, and Utilities 23,800
Information 1,000
Financial Activities 7,100
Professional and Business Services 12,300
Education and Health Services 23,500
Leisure and Hospitality 13,100
Other Services 5,000
Government 41,000 Sources: Bureau of Labor Statistics-Salem, OR.

9
Table 5 Occupation: Civilian Employed Population 16 years and Over
Type of Occupation Employees
Salem Keizer Oregon
Management, business, science and arts occupations
23,084 5,389 627,719
Service occupations 12,316 3,130 315,529
Sales and office occupations 16,586 4,491 426,554
Natural resources, construction, and maintenance occupations
5,920 1,530 164,625
Production, transportation, and material moving occupations
7,285 1,852 209,097
Total 65,191 16,392 1,743,524 Source: U.S Census Bureau, American Community Survey 5-Year Estimate, 2008-2012.
Oregon Employment Department reported that Oregon’s unemployment rate for March 2014 was 6.9% and the U.S. rate was 6.7%. In April 2014, the Salem Metropolitan Statistical Area (MSA) unemployment rate was 7.1% with the U.S. rate at 5.9% according to the U.S Department of Labor’s Bureau of Labor Statistics. Major employers in Salem are shown in Table 5 below. The State of Oregon is the largest employer with 21,000 employees, with Salem-Keizer School District and Salem Hospital following.
Table 6 Salem Largest Employers
Employer Employees
State of Oregon 21,000
Salem-Keizer School District 4,638
Salem Hospital 3,900
Chemeketa Community College 1,651
Marion County 1,487
Federal Government 1,400
City of Salem 1,312
Norpac Foods Incorporated 1,097
Kaiser Permanente 1,048
State Accident Insurance Fund 837 Source: City of Salem, Oregon Comprehensive Annual Financial Report (CAFR) 2012.
Women-Owned business as a percentage of all firms in Oregon is growing. Census data from 2007 shows that 29.8% of businesses in Oregon are owned by women, 27.6% of businesses in Salem are owned by women while 32.3% of all businesses are owned by women in Keizer. The Oregon Business Development Department currently reports that there are 1,268 certified Women Business Enterprises in Oregon.

10
Employment levels and trends especially for women are important benchmarks for fair housing analysis. Higher levels of employed women increase homeownership ratesand stable households, and assist in lowering fair housing discrimination. Transportation The cities of Salem and Keizer are served by the Cherriots public transportation system. Even though Cherriots administers the alternative rideshare program with carpools, vanpools etc., a large percentage of residents in both cities drive alone to their work places. According to the U.S. Census Bureau, ACS 2007-2011, 74% of individuals commuting to work drove alone in Salem compared to 77% in Keizer and 71% in Oregon. Between 2007 and 2011, 74% of individuals commuting to work drove alone in Salem while 13% carpooled. A total of 2% of individuals commuting to work in Salem used the public transit system, while 4 % walked to work. In Keizer, 77% of individuals commuting to work drove alone while 13% carpooled. The public transit system was patronized by 14% of commuters in Keizer while 1% of commuters walked to their work places. Cherriots operates Monday through Friday on a fixed route service in the Salem-Keizer area with easy connections to Wilsonville and Grand Ronde. Cherriots also oversees Chemeketa Area Regional Transportation System (CARTS) that provides daily service to rural Marion and Polk counties. The RED Line is another service provided by Cherriots. The RED Line is a shopper shuttle and dial-a-ride service for seniors and people with disabilities. There was a decline in transit ridership to workplaces from 5.2% and 3.3% in 1980 and 2000 respectively, to 2.4% in 2005 and in 2007-2011 public transit ridership was 2%. A similar trend was seen in Keizer with transit ridership falling by 5% between 1980 and 2000. Currently, Keizer shows 14% utilizing public transportation. The goals identified in the Salem-Keizer Transit Long-Range Regional Transit Plan October 2013 include: grow service levels significantly but reasonably, balance the goal of highly productive transit service against demands for broad geographic coverage, long operating hours and seven day a week service, and to facilitate development of regional public transit services.
Table 7 Modal Splits for Home to Work Travel: Salem/Keizer Work Area
2007-2011 5-year estimates
Commuting to Work
Salem Keizer Oregon
Population % Population % Population %
Drove Alone 47,978 74 12,261 77 1,230,834 71
Carpooled: Car, truck, or van
8,531 13 2,195 13 181,410 10
Public Transportation (excluding Taxi)
1,341 2 233 14 72,130 4
Walked 2,592 4 161 1 66,934 4
Taxi, motorcycle, bicycle, or other means
1,400 2 357 2 54,676 3
Worked at Home 2,642 4 704 4 107,356 6 Source: U.S Census Bureau, American Community Survey 2007-2011.

11
Housing According to the 2010-2012 American Community Survey data, there were 61,313 housing units in Salem, 14,539 housing units in Keizer, and 1,679,365 housing units in Oregon. A total of 64.7% of the housing units in Salem were constructed between 1970 and 2009 while 76.8% of all housing units in Keizer and 63.9% of all housing units in Oregon were built during that same period. High construction rates of multiple family housing in the 1990’s, as mentioned in the 2003 Impediments analysis, has assisted in meeting rental demand in both Salem and Keizer. The Federal Programs Division of the City of Salem Urban Development Department is committed to assisting low- and moderate-income residents of Salem and Keizer in obtaining clean, safe, and affordable housing. The City of Salem identified a total of 22,583 homes as having the potential for lead-based hazards during the preparation of the 2007 Analysis of Impediments to Fair Housing. It is estimated that 9,777 of those homes are inhabited by low- and moderate-income families. According to the Code of Federal Regulation 24 CFR Part 35, any housing rehabilitation project involving houses constructed prior to 1978, and receiving $5,000 or more in Federal funding, shall be tested for lead-based paint. Projects receiving more than $5,000 in federal funding shall have all identified lead-based paint hazards mitigated or abated. The City has established a policy that all housing rehabilitation projects subject to 24 CFR Part 35 shall utilize abatement methods.
A majority of housing in Salem and Keizer are single-family detached units (See table 7). Almost the same numbers of people are living in single family detached units in Keizer (60.5%) as in Salem (60.6%). This is in line with the State of Oregon statistics of 63.8% of Oregonians are living in single family detached units. Census data indicates that more people were living in mobile homes and trailers during 2010-2012 than in 2005-2007 in both Salem and Keizer. The average household size for the state of Oregon is 2.55 for owner-occupied units and 2.43 for renter-occupied units compared to 2.64 for owner-occupied units and 2.49 for renter-occupied units for Salem and 2.67 for owner-occupied units and 2.54 for renter-occupied units in Keizer.
Table 8 Selected Housing Occupancy Characteristics
Salem Keizer Oregon
2005-2007 2010-2012 2005-2007 2010-2012 2010-2012
Units in Structure # % # % # % # % # %
1 unit, detached 34,756 59.0 37,171 60.6 9,045 64.5 8,798 60.5 1,070823 63.8
1 unit, attached N/A N/A 3,399 5.5 N/A N/A 1,087 7.5 74,873 4.5
2 to 4 5,447 9.3 4,436 7.2 1,708 12.1 1,279 8.8 121,083 7.2
5 to 9 5,726 9.7 3,817 6.2 1,159 8.3 919 6.3 73,850 4.4
10 or more 7,813 13.3 9,016 14.7 820 5.8 1,777 7.2 195,662 11.7
Mobile home, trailer 2,852 4.8 3,450 5.6 565 4.0 679 4.7 138,401 8.2
Boat, RV, van, etc. 83 0.1 27 0 0 0.0 0 0 4,673 0.3
Total 58,922 100 61,316 100 14,013 100 14,539 100 1,679,365 100 Source: U.S Census Bureau 2010; American Community Survey 2010-2012 3-year Estimates.

12
According to Zillow, the cost of single-family housing had decreased in Salem by 0.9% from 2011-2012. In 2014 Zillow stated that the home values in Salem had gone up 7.7% in the last year and are predicted to rise another 4.5% within the next year. This will impact the ability of low-income families to become homeowners and limit their opportunity to create wealth.
The data in Table 9 indicates an increase in homeownership for Asian/Pacific Islander and Hispanic populations from 2000-2010 and a decrease in homeownership for Non-Hispanic White, Black, and American Indian. The decrease in homeownership among the majority of populations could be attributed to the housing market crash over the last few years. From July of 2012 - June of 2013, Federal Pograms received approximately fifty subordination requests for second liens associated with the refinance of properties under the HARP Act. These homeowners had received federal assistance either in the purchase or rehab of the property. The refinances were requested to reduce the monthly mortgage payments for the homeowner when the Loan to Value was greater than 80%. Additionally, there have been five reduced payoff requests for the same types of loans submitted to Federal Programs for properties in Short Sale status submitted between April 2013 and June 2014.
Table 9-Housing Opportunities: Homeownership Rate by Race/Ethnicity
Race 2000 2010 2000-2010
% % % Change
Non-Hispanic White 67.6 66.5 -1.1
Black 36.8 35.7 -1.1
American Indian 46.8 45.6 -1.2
Asian/Pacific Islander 53.2 54.6 1.4
Hispanic 37 40.8 3.8 Sourcediversitydata.org 2000-2010
Cost of Housing A total of 343 new single-family construction building permits were issued in Salem between 06/18/2013-06/17/2014. Forty-six construction building permits were issued in Keizer from 06/01/2013-05/31/2014. Estimated median house/condominium values reported in the 2010-2012 American Community Survey for Salem, Keizer, and Oregon were $186,400, $200,300 and $233,900 respectively. More than 22,677 housing units in Salem, 5,951 housing units in Keizer, and 643,213 housing units in Oregon had mortgages. A total of 14,784 housing units in Salem had monthly mortgage payments between $1,000 and $1,999. In Keizer, 4,178 housing units had mortgage payments between $1,000 and $1,999. In Oregon, 358,085 housing units had mortgage payments between $1,000 and $1,999. More than 9,128, 2,261, and 289,519 housing units in Salem, Keizer, and Oregon respectively were with no mortgage payments. Median gross monthly rent was $776, $799, and $855 for Salem, Keizer, and Oregon respectively as reported in the 2010-2012 American Community Survey.
According to the National Low Income Housing Coalition (NLIHC), the Fair Market Rent for a two bedroom apartment in the Salem Metropolitan Statistical Area (MSA) is $756. In order to afford this level of rent and utilities without paying more than 30% of income on housing, a household must earn $2,520 monthly or $30,240 annually. A resident working 52 weeks per year and 40 hours a week must earn a housing wage of $14.54 an hour to be able to afford decent housing. A minimum wage worker earning $8.95 an hour must maintain 1.6 full time jobs in order to afford Fair Market Rent in the Salem MSA.

13
Tenure In 2010, 61.0% of occupied housing units in Keizer were owner-occupied. A total of 55.7% of occupied housing was owner-occupied in Salem. The state of Oregon reported that 62.2% of occupied housing was owner-occupied. Vacant housing unit rates stood at 6.5% in Salem, 5.1% in Keizer, and 9.3% for Oregon (See Table 9). The average household size of owner-occupied units was 2.66 persons in Keizer, 2.6 persons in Salem, and 2.53 for Oregon.
Table 10-Housing Tenure by Occupied Housing Units
Salem 2010 Keizer 2010 Oregon 2010
Occupied Housing Units
57,290 13,703 1,518,938
Owner Occupied 31,904 8,363 944,485
Renter Occupied 25,386 5,340 574,453
Vacant Housing Units 6.5% 5.1% 9.3% Source: U.S. Census Bureau, 2010 Census, Summary File 1; 2000 Census, Summary File 1. Tabulated by Population
Research Center, Portland State University.
Evaluation of Jurisdiction’s Current Fair Housing Profile: Human Rights and Relation Advisory Commission Individual Discrimination Complaint Process
The City of Salem Human Rights and Relation Commission (HRRAC) was created in 1964 by the City Council to respond to concerns of the treatment of minority residents of Salem. The Salem Non-Discrimination Code-Salem Revised Code (SRC Chapters 8 and 97) establishes the Commission and describes the definition, offenses, and administration/enforcement of the City’s local law.
Under City of Salem Revised Code Chapter 8.010, the HRRAC is empowered to take action on alleged acts of discrimination in employment, housing and public accommodation in the City of Salem. Chapter 97 specifically prohibits discrimination on the basis of an individuals’ race, color, religion, national origin, sex, age, marital status, disability, familial status, domestic partnership, sexual orientation, gender identity, and source of income.
Persons who have been discriminated against under the provisions of the Federal Fair Housing Act have the right to file an administrative complaint with HUD and the Oregon Bureau of Labor and Industry (BOLI). The complaint must be filed within one year of the alleged discriminatory activity. The investigating agency will determine where there is “reasonable cause” to believe discrimination has taken place and proceed as required. The Oregon Comprehensive Housing Manual, developed with the assistance of a HUD grant, provides additional details.
People experiencing discrimination or harassment or who have other human rights concerns are able to contact the HRRAC by phone, by sending letters, filing complaint on-line, dropping by the office during business hours, or visiting the Commission during one of the Commission’s monthly general meetings. Commissioners and/or staff determine if the complaint has a reasonable basis under Salem ordinance or other law. This depends on whether the act:
Was discriminatory if it occurred
Occurred in Salem
Was unlawful
Was significant to human relations
Occurred within the last twelve months

14
The HRRAC is empowered to seek informal resolution of a complaint through fact-finding, mediation, and discussion with all parties to the complaint. The HRRAC attempts to accomplish this settlement in a quick and efficient manner. Complaints through state or federal agencies can be more lengthy and complicated but may be appropriate where the complainant seeks more than an informal resolution.

15
Steps in Complaint Resolution Two avenues are available to consider in resolving discrimination cases that come to the Commission.
The first avenue involves complaints except those that are against the City of Salem. The second works solely with discrimination complaints that are against the City.
According to the HRRAC individual discrimination complaint process, in the event there are complaints against the City, prescribed administrative processes must be exhausted first. These are mainly involving complaints related to police action or employer-employee cases. If Commissioners receive complaints against the City, they contact staff to assist with the appropriate next steps. For all other complaints brought to the Commission, the following steps apply:
Step 1.
When staff or a Commissioner receives a complaint, an intake form is completed immediately. This form includes:
Date and time of the complaint intake and the name of the person completing the form Name, address, and phone (if available) of the individual seeking assistance Name, address, and phone of the respondent Description of concern, including date and location
Whenever possible and applicable, individuals seeking assistance are urged to submit information in writing. Individuals can also submit this information on-line through the Commission’s website (www.cityofsalem.net/~scserv/HRRAC/complaint_form.htm).
Step 2. In special cases where the role of a Commissioner is necessary, either staff or the Chair may request assistance from a Commissioner or from a community member.
Step 3. By the seventh working day following the intake, a return contact is made with the individual seeking assistance and an interview arranged, either by phone or in person. The Commissioner and/or staff will discuss options with the individual and determine a proposed course of action. Guidelines for Commissioners And Or Staff - Intake and Initial Processing: After hearing and taking notes of important points described in the problem, staff and/or the Commissioner work with the individual to determine appropriate resolution options. It may be determined quickly that the complaint either does not fall under the jurisdiction of the Commission or needs to be referred to another agency or organization.
16
After the interview, a one-page statement of concern is written outlining the issues in the complaint. This statement details the issues discussed in the interview. The statement includes the options chosen for resolution and any referrals given. If the complaint is closed without further action, the statement serves as a record of the Commission's response to the situation.
Step 4. Within seven working days of the interview and as appropriate, contact is made with the respondent(s). In cases where a Commissioner is assigned to work on a complaint, if contact cannot be made with the complainant within seven days, staff will meet with the Commissioner to discuss the case. The Commissioner and/or staff discuss the complaint with the respondent and outline the desired outcomes as determined in the initial interview. From this, the Commissioner determines what recommendations may be helpful to achieve resolution. If the respondent is willing and it is appropriate to the case, a meeting should be arranged between the parties in the case. In cases where the individual seeking assistance is or was a client or employee of the respondent, a release of information may be obtained. The respondent may give information contradicting the claims in the complaint. Additional fact-finding may be needed to determine action. Guidelines for Commissioners and/or Staff - Resolution Options: Referral: The nature of the situation may make it appropriate for referral to another agency or group. In some cases, the Commissioner and/or staff may make the initial contact and explain the situation to the referral, and provide other assistance as appropriate. With complaints against law enforcement, the Commission has agreed to help facilitate community members’ access to internal complaint processes. Conciliation: If the complaint is appropriate for resolution by the Commission, the Commissioner and/or staff, after consultation with one another, will attempt conciliation in the most informal manner available. First contact can be made by telephone to the respondent to attempt resolution. The Commissioner and/or staff should explain the situation to the respondent and ask for their response to the situation. The manner of conciliation will vary according to the issues in the complaint. An apology, an agreement to stop the offending behavior or to have employees attend training to correct behavior, could be part of the conciliation. The Commissioner and/or staff, after consultation with one another, may request a mediated meeting between the person seeking assistance and the respondent to discuss the situation. If a resolution cannot be reached, or if at any time a request is made, the complaint can be referred to another agency or legal counsel. Financial resources for legal assistance are not provided. At this time, it is considered closed by the Commission but can still be monitored to learn the ultimate outcome. Correspondence/Contacts: All correspondence regarding the complaint between individuals seeking help, and respondents, are either mailed on City letterhead or emailed by staff.

17
Step 5. When the case is successfully conciliated, it is considered closed. The case will also be considered closed if it is successfully referred to another agency. If an agreement is reached, where appropriate, the Commission prepares a written statement of agreement for both parties. Once the case is closed, Commissioners complete the Discrimination Complaint Case Form and/or provide staff this information to include in the complaint file.
Step 6. After a case is closed, as appropriate, staff follows up with participants for feedback and to determine how to improve services to complainants in future cases. A Case Closing Survey may be used to gather this information. In some cases, the participants may not be satisfied with the result of the Commission's work. Staff and the Commission can then determine further steps that could be taken as a way of improving the process.
Step 7. In appropriate cases, after a case is closed, the Commission Chair and staff will evaluate the handling of the complaint and the overall complaint process. The Case Review form is a two-sided format designed as a self-evaluation tool for the Commissioner involved in the case. The Commission schedules an annual evaluation of its complaint process and case resolution. Fair Housing Complaint Statistics The Salem Human Rights and Relations Commission provided the fair housing complaint data used in this analysis. Complaint diversity categories provided below covers 2012 and 2013 calendar years.
Table 11 City of Salem: Complaint Diversity Categories by Class
Cases by Protected Classes Number
Race/National Origin 1
Age 0
Disability 4
Religion 0
Gender Identity 0
Familial Status 0
Sexual Orientation 0
Source of Income 0
Other 20
Total 25
Source: Salem Human Rights and Relation Commission

18
Housing related complaint summaries identified from July 2009 to 2013 showed that 48 contacts were made to the Human Rights and Relations Commission.
Number of Complaints received related to Housing: 2009: 11
2010: 8 2011: 4 2012: 9 2013: 16
Table 12 Fair Housing Council of Oregon Complaints: Salem
Cases by Protected Classes Number
Race/National Origin 6
Age 1
Disability 28
Religion 0
Gender Identity 0
Familial Status 7
Sexual Orientation 3
Source of Income 3
Other 5
Total 53
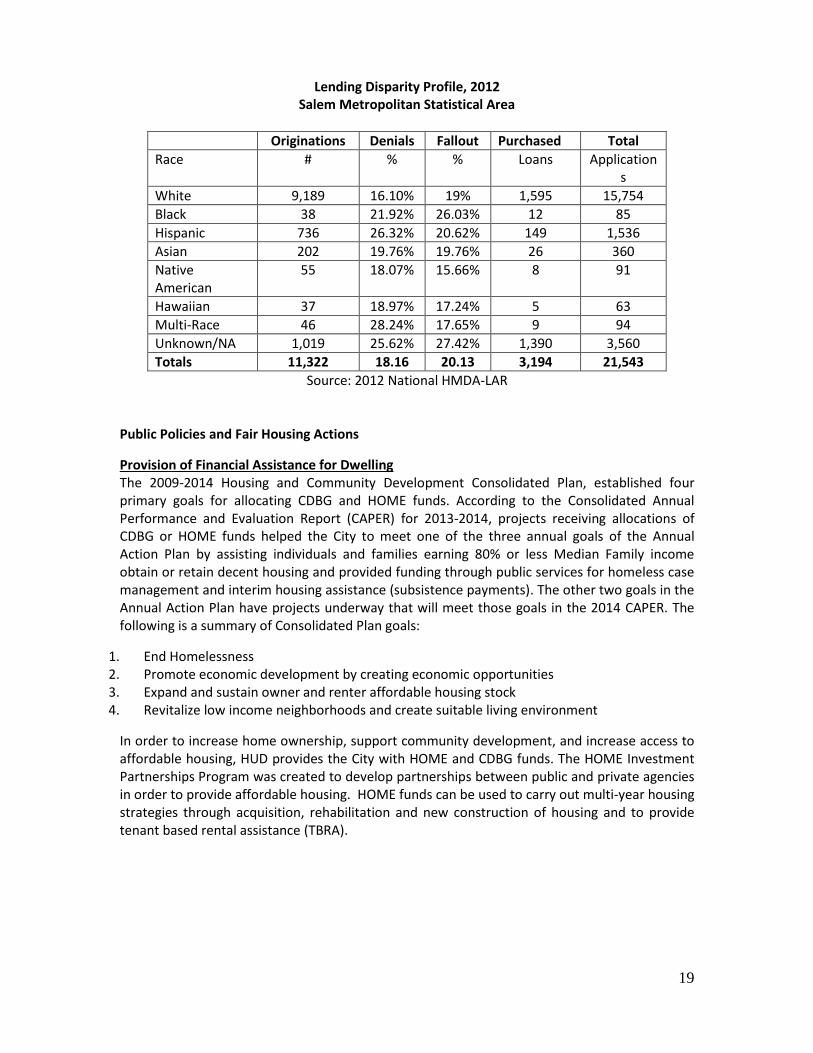
The data in the two tables above is consistent in showing that the greatest discrimination is against those with disabilities for Salem, Oregon. Home Mortgage Disclosure Act (HMDA) Analysis According to a report prepared by the Urban Institute for the U.S. Department of Housing and Urban Development (HUD), minorities seeking to buy homes continue to face discrimination from mortgage lending institutions. “Not all Americans enjoy equal access to the benefits of homeownership, in part because of unequal access to capital." The 2006 urban institute report acknowledges, "minorities are less likely than whites to obtain mortgage financing and, if successful in obtaining a mortgage, tend to receive less generous loan amounts and terms."3 In 1975, the U.S. Congress voted to create the HMDA and the Federal Financial Institution Examination Council (FFIEC) to track and disclose information on lending patterns. HMDA data particularly covers home purchases and home improvements loans and includes information on race, ethnicity and income of applicants which allows for an analysis of lending disparity practices. Table 13 below shows the lending disparity profile for Salem Metropolitan Statistical Area (MSA). In this 2012 review, the percentage of refinanced loans were 72.14%. This number is congruent with Federal Program’s experience over the past 2-3 years. There has been a significant increase in requests for subordinations of existing loans (i.e. single family rehabilitation loans, down payment assistance loans, and public works sewer improvement loans).
Table 13
3 Discussion from HUD fair lending Studies-Mortgage Lending Discrimination in America
19
Lending Disparity Profile, 2012 Salem Metropolitan Statistical Area
Originations Denials Fallout Purchased Total
Race # % % Loans Applications
White 9,189 16.10% 19% 1,595 15,754
Black 38 21.92% 26.03% 12 85
Hispanic 736 26.32% 20.62% 149 1,536
Asian 202 19.76% 19.76% 26 360
Native American
55 18.07% 15.66% 8 91
Hawaiian 37 18.97% 17.24% 5 63
Multi-Race 46 28.24% 17.65% 9 94
Unknown/NA 1,019 25.62% 27.42% 1,390 3,560
Totals 11,322 18.16 20.13 3,194 21,543
Source: 2012 National HMDA-LAR
Public Policies and Fair Housing Actions
Provision of Financial Assistance for Dwelling The 2009-2014 Housing and Community Development Consolidated Plan, established four primary goals for allocating CDBG and HOME funds. According to the Consolidated Annual Performance and Evaluation Report (CAPER) for 2013-2014, projects receiving allocations of CDBG or HOME funds helped the City to meet one of the three annual goals of the Annual Action Plan by assisting individuals and families earning 80% or less Median Family income obtain or retain decent housing and provided funding through public services for homeless case management and interim housing assistance (subsistence payments). The other two goals in the Annual Action Plan have projects underway that will meet those goals in the 2014 CAPER. The following is a summary of Consolidated Plan goals:
1. End Homelessness 2. Promote economic development by creating economic opportunities 3. Expand and sustain owner and renter affordable housing stock 4. Revitalize low income neighborhoods and create suitable living environment
In order to increase home ownership, support community development, and increase access to affordable housing, HUD provides the City with HOME and CDBG funds. The HOME Investment Partnerships Program was created to develop partnerships between public and private agencies in order to provide affordable housing. HOME funds can be used to carry out multi-year housing strategies through acquisition, rehabilitation and new construction of housing and to provide tenant based rental assistance (TBRA).

20
The Community Development Block Grant (CDBG) program consolidates several categorical grants such as urban renewal, neighborhood development and model cities into a single block grant program. The primary objective of CDBG, apart from providing affordable housing to low and moderate income persons, is to develop a strong community through the provision of:
Decent housing Suitable living environments and Expanded economic opportunities
Table 14
2013-2014 Table of assistance to racial and ethnic populations by source of funds
Describe the families assisted (including the racial and ethnic status of families assisted)
CDBG HOME
Race
White 2,949 242
Black or African American 63 30
Asian 12 2
American Indian or American Native 35 22
Native Hawaiian or Other Pacific Islander 43 2
Ethnicity
Hispanic 441 64
Not Hispanic 2,661 234
Total 3,102 298
Source: City of Salem 2013 Consolidated Annual Performance and Evaluation Report (CAPER).
The Federal Programs Section administers the City’s federal allocation of CDBG and HOME programs. The2013-2014 loan and grants impacts include the following:
Table 15: Accomplishments for the Program Year 2013 Annual Goals
Goal Category Funding Source
Amount Expended
Outcome Indicator
Outcome Expected
Actual Unit of Measure
Percent Complete
1 Ending Homelessness
CDBG $362,973 Public Service Activities (Housing and Non-Housing)/ Public Facility
2,554 served
3,128 served
Persons Assisted
122%
2 Economic Development
CDBG $303,320 Businesses Assisted/Jobs
67 served
56 served
Businesses Assisted
83%
3 Affordable Housing
HOME $1,612,519 Tenant Based Rental Housing
422 served
222 served
Households Assisted
52%
Source: City of Salem 2013 Consolidated Annual Performance and Evaluation Report (CAPER).

21
CONCLUSIONS AND RECOMMENDATION Conclusions drawn from data gathered in this AI report suggest that:
Additional cost and requirements make both the rental and owner housing markets unavailable to low/moderate income persons
Job training and creation will lead to a major reduction in barriers to affordable housing across protected classes by providing personal resources for housing
Discriminatory and unfair lending practices are impediments to fair housing in Salem and Keizer
Language and cultural differences are impediments to fair housing Increasing resources for fair housing programs and activities will promote access to
affordable housing Expanding affordable housing through projects including “aging in place” units will
resolve barriers for various groups including those with disabilities while providing a foundation for versatile housing
RECOMMENDATIONS In addition to various strategies mentioned earlier in this report, the cities of Salem and Keizer remain committed to assisting residents in obtaining and retaining decent, safe, affordable housing. Salem and Keizer should continue to partner with non-profit organizations, the Salem Housing Authority, Community Housing Development Organizations (CHDO’s), Fair Housing Council of Oregon, and other government agencies to further improvement towards fair housing. To promote community and economic development, eliminate homelessness, provide affordable housing, and revitalize neighborhoods, it important that the jurisdiction focuses its attention on removing barriers that impede fair housing. The following activities are intended to steer the City towards achieving fair housing goals:
Continue funding for programs such as TBRA, multi-family rental rehabilitation, and self-sufficiency programs related to housing to bridge the financial gap for LMI households
Encourage job training programs for LMI persons to increase their ability to be sustainable in housing
Encourage job creation to provide jobs for LMI persons (with increased services to special populations including the disabled, veterans, and victims of domestic violence) to increase their ability to be sustainable in housing
Supporting fair housing education for consumers, lenders, real estate agents, landlords, and all individuals providing housing services
Supply community education tools to non-English speaking residents in both cities Make available, information regarding federal housing assistance programs and
resources Encourage the production of additional housing, including units for “aging in place” to
increase greater choice Target communities with high percentages of low- and moderate incomes persons with
funding for affordable housing