implementation evaluation of the business process services incentive scheme … · 2016-08-10 ·...
TRANSCRIPT

Implementation Evaluation of the
Business Process Services Incentive
Scheme Programme
Final report
16 May 2013

ii
Document Reference: Genesis Analytics, BPS Incentive Scheme Implementation Evaluation report
Date: 16 May 2013
Contact Information
Genesis Analytics (Pty) Ltd
Office 3, 50 Sixth Road
Hyde Park, 2196, Johannesburg
South Africa
Post to: PO Box 413431, Craighall, 2024
Johannesburg, South Africa
Tel: +2711 994 7000
Fax: +2711 994 7099
www.genesis-analytics.com
Authors
Genesis Analytics
Contact person
Alyna Wyatt
(+27) 11 994 7000
iii
Table of Contents
LIST OF ACRONYMS ..........................................................................................................................VIII
EXECUTIVE SUMMARY .......................................................................................................................IX
INTRODUCTION ....................................................................................................................................IX
EVALUATION APPROACH AND METHODOLOGY .............................................................................IX
FINDINGS ...............................................................................................................................................X
ANALYSIS AND RECOMMENDATIONS ..............................................................................................XI
1. INTRODUCTION ......................................................................................................................... 1
1.1. THE TERMS OF REFERENCE .................................................................................................. 1
1.2. OBJECTIVES OF THE IMPLEMENTATION EVALUATION ...................................................... 1
1.3. EVALUATION CRITERIA ............................................................................................................ 2
2. OVERVIEW OF THE OUTSOURCING AND OFFSHORING INDUSTRY ................................. 3
2.1. GLOBAL OVERVIEW ................................................................................................................. 3
2.1.1. KEY SOURCE MARKETS ...................................................................................................... 4
2.1.2. MAIN SERVICE MARKETS .................................................................................................... 5
2.2. SOUTH AFRICA‟S OUTSOURCING INDUSTRY ....................................................................... 6
2.2.1. SOUTH AFRICA‟S VALUE PROPOSITION ........................................................................... 8
2.2.2. BPO&O INCENTIVE SCHEME ............................................................................................. 10
2.2.3. THE BPS INCENTIVE SCHEME .......................................................................................... 11
2.2.4. OVERVIEW OF BPS INCENTIVE SCHEME PARTICIPANTS ............................................ 12
3. METHODOLOGY ...................................................................................................................... 14
3.1. ANALYTICAL FRAMEWORK ................................................................................................... 14
3.2. DOCUMENT AND LITERATURE REVIEW .............................................................................. 15
3.3. DATA ANALYSIS ...................................................................................................................... 15
3.4. INTERVIEW PROCESS ............................................................................................................ 15
3.5. COST-COMPETITIVENESS ANALYSIS .................................................................................. 16
3.6. LIMITATIONS OF METHODOLOGY AND SCOPE OF RESEARCH ....................................... 17
3.6.1. LIMITATIONS ........................................................................................................................ 17
3.6.2. SCOPE OF THE RESEARCH .............................................................................................. 18

iv
4. FINDINGS ................................................................................................................................. 19
4.1. EFFICIENCY ............................................................................................................................. 19
4.1.1. ADMINISTRATION AND COMMUNICATION OF THE BPS INCENTIVE SCHEME .......... 19
4.1.2. PROMOTION OF SOUTH AFRICA‟S BPS INCENTIVE SCHEME ...................................... 22
4.2. RELEVANCE............................................................................................................................. 24
4.2.1. DESIGN OF THE INCENTIVE .............................................................................................. 24
4.2.2. INVESTMENT DECISIONS .................................................................................................. 28
4.2.3. COST-COMPETITIVENESS ................................................................................................. 30
4.2.4. LINKS TO NATIONAL DEVELOPMENTAL OBJECTIVES .................................................. 33
4.3. ACHIEVEMENT ........................................................................................................................ 34
4.3.1. JOBS CREATION OBJECTIVE ............................................................................................ 34
NUMBER OF JOBS CREATED ............................................................................................................ 34
JOBS CREATED VS. DTI TARGET ..................................................................................................... 35
JOBS CREATED VS. COMPANIES PROJECTIONS .......................................................................... 36
4.3.2. FDI ATTRACTION OBJECTIVE ........................................................................................... 37
4.3.3. PERCEPTIONS OF THE INCENTIVE SCHEME ................................................................. 39
4.3.4. PERCEPTIONS OF THE BPS INDUSTRY .......................................................................... 40
4.3.5. INCENTIVE TAKE-UP .......................................................................................................... 42
4.4. SUSTAINABILITY ..................................................................................................................... 42
4.4.1. THE SKILLS POOL ............................................................................................................... 42
4.4.2. THE FUTURE OF THE INCENTIVE SCHEME .................................................................... 43
4.4.3. BPS INDUSTRY SUSTAINABILITY...................................................................................... 44
4.5. ADDITIONALITY ....................................................................................................................... 45
4.5.1. SUSTAINABLE EMPLOYMENT ........................................................................................... 45
5. ANALYSIS AND RECOMMENDATIONS ................................................................................. 47
5.1. BPS INCENTIVE SCHEME ANALYSIS .................................................................................... 47
5.1.1. ARE THE OBJECTIVES OF THE PROGRAMME BEING ACHIEVED? .............................. 47
5.1.2. IS THE DESIGN OF THE INCENTIVE PROGRAMME SUPPORTING THE ACHIEVEMENT
OF PROGRAMME OBJECTIVES? ....................................................................................................... 49
DESIGN OF THE INCENTIVE SCHEME ............................................................................................. 49
v
BPS INCENTIVE SCHEME THEORY OF CHANGE ............................................................................ 50
INSTITUTIONAL STRUCTURE ............................................................................................................ 52
5.1.3. WHAT IS THE CURRENT RATE OF JOB CREATION THROUGH THE BPS INCENTIVE
SCHEME? ............................................................................................................................................. 53
5.1.4. HOW COMPETITIVE AND COST-EFFECTIVE IS SOUTH AFRICA‟S BPS INCENTIVE
PROGRAMME? .................................................................................................................................... 53
COST COMPETITIVENESS AND COST-EFFECTIVENESS .............................................................. 53
THE FUTURE OF THE INCENTIVE SCHEME .................................................................................... 54
PROMOTION OF THE INCENTIVE SCHEME ..................................................................................... 54
5.2. BROADER INDUSTRY ANALYSIS .......................................................................................... 55
FACTORS INFLUENCING THE SUCCESS OF THE BPS SECTOR .................................................. 55
BARRIERS TO GROWING THE BPS SECTOR .................................................................................. 56
SUSTAINING AND UP-SCALING THE BPS SECTOR POST THE INCENTIVE PERIOD.................. 56
6. PRIORITY CONSIDERATIONS ................................................................................................ 58
7. APPENDIX ................................................................................................................................ 60
7.1. ANNEX A ................................................................................................................................... 60
7.2. ANNEX B ................................................................................................................................... 65
7.3. ANNEX C .................................................................................................................................. 75
List of Figures
Figure 1: Global BPO market size, 2006 - 2010 ..................................................................................... 3
Figure 2: Global market share of ITO/BPO service providers, BRICS and non-BRICS, 2012 ............... 5
Figure 3: South Africa's value proposition .............................................................................................. 8
Figure 4: BPS Incentive payment design .............................................................................................. 11
Figure 5: Split of projects by service type ............................................................................................. 13
Figure 6: Approximate duration of application and claims process ...................................................... 20
Figure 7: Efficiency of responses to general queries and dispute management .................................. 21
Figure 8: Does the promotion of the South African BPS industry within South Africa include specific
information related to the BPS incentive scheme? ............................................................................... 22
Figure 9: How attractive is the South African BPS incentive scheme compared to other outsourcing
incentives schemes? ............................................................................................................................. 23
vi
Figure 10: Interviewee responses when asked whether a graded or tiered incentive scheme should be
implemented .......................................................................................................................................... 25
Figure 11: To what extent does the BPS incentive scheme accommodate firms across different
segments and at various stages of growth? ......................................................................................... 26
Figure 12: Number of jobs created by companies, by companies‟ response to the flexibility of the
incentive scheme across different segments and different stages of growth ....................................... 26
Figure 13: To what extent does the BPS incentive scheme provide flexibility around reviewing
projected and actual outcomes? ........................................................................................................... 27
Figure 14: Does the BPS incentive as it is currently designed strongly influence your company's
growth strategies and investment decisions? ....................................................................................... 29
Figure 15: Key investment criteria ........................................................................................................ 29
Figure 16: Average annualized per FTE incentive for contact centre services, 2010, 2012; US$ ....... 30
Figure 17: Average annualized per FTE incentive for financial services, 2010, 2012; US$ ................. 31
Figure 18: Pre and Post-incentive cost-gap, 2012 ................................................................................ 32
Figure 19: Reduction in cost gap from 2010 - 2012 .............................................................................. 33
Figure 20: Jobs created per financial year ............................................................................................ 35
Figure 21: Maximum allowance of jobs and actual jobs created .......................................................... 36
Figure 22: Companies‟ job projections and actual job creation ............................................................ 37
Figure 23: Estimated projected and actual investment figures, R million ............................................. 39
Figure 24: Weaknesses of the BPS incentive ....................................................................................... 39
Figure 25: Positive attributes of South Africa outsourcing industry ...................................................... 40
Figure 26: Areas of concern in South Africa's outsourcing industry ..................................................... 41
Figure 27: Perceptions on the quality of the skills pool ......................................................................... 43
Figure 28: Cost Gap of India, South Africa and Poland ........................................................................ 44
Figure 29: Percentage of job contracts, of those qualifying for the BPS incentive, which are for longer
than 12 months ..................................................................................................................................... 45
Figure 30: Annual attrition rates ............................................................................................................ 46
Figure 31: Responses regarding the planned continuation of currently incentivised projects beyond
the incentive period ............................................................................................................................... 46
Figure 32: Proposed Results chain ....................................................................................................... 51
Figure 33: SA's incentive competitiveness should incentives be extended to 5 year period................ 75

vii
List of Tables
Table 1: Back-office functions ................................................................................................................. 4
Table 2: Key BPO/ITO service markets by region .................................................................................. 5
Table 3: Distribution of projects by province and service type .............................................................. 13
Table 4: Number of indicators used per evaluation criterion ................................................................ 14
Table 5: Sample indicator and scale ..................................................................................................... 14
Table 6: The perceptions of administration efficiency of the application and claims processes .......... 19
Table 7: Indicators for impact of incentives on investment decisions ................................................... 28
Table 8: Projected investment for 2011/2012 and 2012/2013 .............................................................. 38
Table 9: BPS incentive scheme budget ................................................................................................ 42
Table 10: List of documents, data and information sources reviewed .................................................. 60
Table 11: Stakeholders included in the qualitative research process ................................................... 63
„

viii
LIST OF ACRONYMS
ASGI-SA – Accelerated Shared Growth Initiative – South Africa
BPO - Business Process Outsourcing
BPO&O – Business Process Outsourcing and Off-shoring
BPS – Business Process Services
BPeSA – Business Process enabling South Africa
BRICS – Brazil, Russia, India, China and South Africa
DAC - Development Assistance Community
DHA – Department of Home Affairs
DPME – Department of Performance Monitoring and Evaluation
DoL – Department of Labour
dti – Department of Trade and Industry
FAO – Finance and Accounting Outsourcing
FDI – Foreign Direct Investment
FTE – Full Time Equivalent
GAS – Government Assistance Support
HDSA – Historically disadvantaged South Africans
HR – Human Resources
IDAD- Incentive Development Administration Division
ITO – Information Technology Outsourcing
KPO – Knowledge Process Outsourcing
LPO – Legal Process Outsourcing
MTEF – Medium Term Expenditure Framework
NEPF - National Evaluation Policy Framework
TOR – Terms of Reference
USA – United States of America
UK – United Kingdom

ix
EXECUTIVE SUMMARY
INTRODUCTION
The Business Process Services (BPS) incentive scheme was launched by the Department of Trade
and Industry (the dti) in 2011 to enhance and contribute to South Africa‟s value proposition as a world
class outsourcing destination for international investors and service providers. The Department of
Performance Monitoring and Evaluation (DPME), as part of its mandate under the National Evaluation
Plan Framework (NEPF), and in partnership with the dti, issued a Terms of Reference (TOR) in
August 2012 to undertake an implementation evaluation of the BPS incentive scheme. The purpose of
the evaluation was to investigate the extent to which the BPS incentive scheme is achieving its main
objectives of job creation and attracting foreign direct investment (FDI). The evaluation covered the
incentive scheme from its inception in January 2011 until December 2012.
The evaluation assessed the efficiency, effectiveness, impact and sustainability of the design and
implementation of the BPS incentive scheme, and sought to identify any barriers inhibiting the
achievement of its objectives. The information gathered has enabled an assessment of the strengths
and weaknesses of the BPS incentive scheme as well as the formulation of corresponding
recommendations for improvement. The dti must determine the feasibility of each recommendation
based on its strategy in relation to the sector, the resources available to it and the anticipated value
for money of the associated benefits.
EVALUATION APPROACH AND METHODOLOGY
The evaluation adopted the standard Development Assistance Community (DAC)1 evaluation criteria,
and adjusted these for the particular assignment. It used a total of 26 indicators to measure the
following five evaluation criteria: Efficiency, Relevance, Achievement, Sustainability and Additionality.2
In order to maintain an objective and standardised approach to assessing the indicators, qualitative
responses were coded into a quantitative scale, where possible, to ensure that the indicators could be
aggregated in order to provide measurable findings. A multi-method approach was undertaken to
collect data for each of the indicators. This involved document review, data analysis, stakeholder
interviews, and a cost-competitiveness analysis.
Data collection involved a desktop review of the available project documentation; the collection of
data on projected and actual jobs created; projected and reported investment in the industry
associated with the incentive; an analysis of the cost-competitiveness of South Africa‟s BPS incentive
scheme compared with key competitors; and 29 interviews conducted with a variety of stakeholders,
including service providers and investors active in the industry, relevant government department
personnel, and industry body representatives.
1 The OECD‟s DAC (Development Assistance Community) criteria provide a useful framework for evaluating developmental
assistance. This framework is globally recognised and is used by the majority of development assistance organisations, thus enabling comparison between programmes. More information is available at http://www.oecd.org/dac/evaluationofdevelopmentprogrammes/daccriteriaforevaluatingdevelopmentassistance.htm. 2 Additionality is not included in the DAC criteria, but it was included in this evaluation because, to be effective, incentives
should be associated with additionality in the sense that the activities they catalyse would not have happened without them.

x
FINDINGS
The findings of the qualitative and quantitative research processes are presented under the five
evaluation criteria, and may be summarised as follows:
Efficiency The efficiency of the scheme assessed the administrative processes which underpin the
scheme and the promotion of the incentive scheme to local service providers and captive operators.
In general, the administration of the incentive scheme was assessed as being efficient. An
overwhelming majority (88%) of respondents described the communication and explanation of the
details of the scheme during the application process as being efficient, and the information received
as sufficient for promoting timely and informed decision-making. It was noted that the paper-based
application and claim process can be improved, and that in some instances the administrative team is
not able to respond to technical queries. Only a quarter (25%) of participants reported that they had
been exposed to any promotion of the BPS incentive scheme within South Africa.
Relevance The relevance criterion examined the design and flexibility of the incentive scheme, the
cost-competitiveness of the scheme and its links to national development goals. Of all respondents,
52% were of the opinion that the incentive scheme should be designed in such a way that the amount
of incentive received is graded by the type of service provided or the agent skill level. In addition, 52%
of respondents noted that the BPS incentive has a positive influence on their investment decisions.
Those who indicated that the incentive scheme does not directly influence their investment decisions
were mainly captive operators who were operating in South Africa to serve their offshore clients, or
service providers who are based in South Africa. In these cases, the incentive scheme impacts the
investment decisions of their investors, but does not directly impact the service providers‟ planning.
Achievement The achievement of the scheme is related to its success in meeting its FDI and job
creation targets, as well as to industry participant perceptions of the incentive scheme and of the
competitiveness of the South African BPS industry as a whole. No targets are set for job creation or
FDI. In the case of job creation, the maximum number of jobs that can potentially be sustained by the
scheme as derived from annual MTEF-linked budget allocations (made by the National Treasury) is
used as a guide for job creation.3 This budget allocation is based on an assessment of the actual
disbursement performance of the scheme in the previous year. This figure can be revised upwards,
through a formal virement process, should the number of incentive grants and jobs to be created
exceed the budget allocation. To date this process of upward revision has not been pursued by the
scheme‟s administrators, with available budget directing operational activities. Since the start of the
incentive scheme, 3,807 jobs have been created/supported4; which is 83% of the 4,563 jobs that the
programme could potentially have supported to date based on MTEF budget allocations. The actual
jobs created are also substantially less than the 11,597 projected by companies when submitting their
incentive
FDI is not clearly defined, nor is FDI data consistently captured or audited. Instead, data on total
investment is provided by firms as part of their claim documentation. Reported investment to date is
approximately R2.7 billion, which refers primarily to operational expenditure. This reported value
meets, and in fact slightly exceeds, the investment value projected by the scheme for the same
period.
3 In the first two years of the scheme, the average pay-out per job created/sustained is R40,000
4 The majority of new jobs that result from the incentive scheme are associated with investments that would not have happened
without it. This is categorised as direct job creation. Unavoidably, certain investments that make use of the incentives would have happened anyway. These jobs are not directly created by the scheme but are supported by it.
xi
In neither case exists an acceptable basis for targeting and managing an important incentive
programme in a priority sector. Current „measures‟ do not contribute to a pro-active approach to the
scheme‟s implementation, nor do they assist in the definition of forward-looking targets for job creation
and the attraction of foreign investment. In the absence of such targets, it is difficult to design and
operate an effective performance management system.
64% of respondents stated that the strength of the incentive scheme related to its impact on reducing
the cost of operations in SA. Skills were noted as one of the main areas of concern in the industry and
36% of respondents noted that the incentive scheme does not adequately deal with this issue.
Sustainability There is significant market uncertainty around the future of the incentive scheme. The
current incentive programme is scheduled to end in the 2014/2015 financial year. The survey
revealed that 100% of respondents had received no communication from the government regarding
the future of the scheme, resulting in increasing uncertainty among operators. The majority of
respondents also noted that, unless the level of skills increases commensurately with industry growth,
the current skills pool will not be sufficient to meet the industry‟s demands or to enable sustained
sector investment and growth. The incentive is one component of the government‟s strategy to
enhance the BPS sector. On its own, in the absence of a complementary focus on overcoming SA‟s
skills gap, it will have a limited impact on deepening the value base of the industry and helping to
realise South Africa‟s long term competitive advantage in this market, which lies in higher value BPS
services and functions.
Additionality This criterion assesses the role of the incentive in directly catalysing investment and
jobs; and the extent to which the jobs created and investment made in the BPS industry would (not)
have gone ahead without the incentive scheme. About 50% of firms stated that their investment in the
industry was strongly influenced by the presence of incentives, which implies that the incentive
scheme has indeed catalysed significant additional activity and investment and has resulted in job
creation and investment that would not have occurred otherwise.
ANALYSIS AND RECOMMENDATIONS
The implementation review provided the evaluation team with sufficient information to inform
recommendations to improve both the operation of the programme and consequently, its prospects
for long-term success. In addition to an assessment of the five standard evaluation criteria discussed
above, the analysis and recommendations respond to the seven specific evaluation questions
highlighted in the TOR. These are split between those which are specific to the incentive scheme, and
those which are of broader relevance to the BPS industry as a whole. The recommendations for
improvement of the scheme range from those covering high level strategic issues relating to the
design and future focus of the scheme, to those aimed at addressing some of the scheme‟s more
detailed operational aspects. A full elaboration of the recommendations is provided in the main body
of the report, with a summary provided in relation to each question below:
1. Are the objectives of the programme being achieved?
There is no forward-looking target set for job creation or FDI. Assessing the performance of the BPS
incentive scheme in relation to job creation is limited to a comparison of jobs created in relation to the
maximum allocation made possible each year by the Treasury in relation to the dti’s MTEF budget.
Currently, budget allocation is a backward-looking measure, based on the scheme‟s past
performance. This means of operational planning is not conducive to proactive, opportunity-led and
incentive-driven management of the scheme. It does not create an impetus on behalf of the scheme‟s
managers to increase the number of jobs generated by the scheme, or lay the basis for an effective
performance management system.
xii
Similarly, it is not stipulated as a part of the scheme‟s objectives exactly how much FDI the scheme is
expected to attract, nor is actual FDI systematically reported. In certain instances it is reported and
recorded as a cumulative value over the life of a particular project, and in others it measures annual
figures relevant to a particular claim period. No assessment can be made therefore as to whether the
value of FDI is meeting expectations at the time the scheme was initiated.
In order to maximise the effectiveness of the scheme and to facilitate accurate measurement of its
success clear targets for both job creation and FDI must be set. .
Recommendations:
A policy target needs to be set for both jobs created and FDI attracted via the scheme.
Although the incentive scheme is already mid-stream in its term, it is essential that
appropriately researched, targets are set for the remainder of the incentive scheme‟s
duration.
In the current context of no policy target, the dti should aim to achieve a higher jobs
created/sustained figure than implied by the MTEF budget. The necessary arrangements
must be made with the Treasury to ensure support of these targets and to ensure that future
budget allocations are not based purely on past performance. Improved performance will in
turn encourage higher budget provisions for future years of the scheme.
Firms must be encouraged to more accurately project how many jobs they expect to create,
thus ensuring a closer alignment between projected and actual jobs. An additional incentive,
in the form of a financial reward, might be provided to firms that create 90% or more of the
jobs they have projected to create. This should be calculated as a percentage of their
projected jobs, as opposed to jobs created, so as to prevent firms from deliberately under-
projecting their jobs numbers to access the bonus incentive.
Any relevant investment sustained must be accurately and consistently reported by firms –
either cumulatively or additionally over the life of a project.
Monitoring of the scheme‟s performance needs to be improved, particularly in relation to
collection of data on actual FDI and jobs created. Where discrepancies arise in recorded data,
these need to be resolved in each case and standardised to ensure that accurate figures are
reported and logged.
Promotion of the scheme, particularly to domestic stakeholders who have significant
international client bases, needs to be improved so as to increase the number of participants
in the scheme, which will in turn result in increased job creation and FDI. Particular attention
needs to be given to promoting the incentive scheme itself, as a complement to the promotion
of the SA BPS offering as a whole.
2. Is the design of the incentive programme supporting the achievement of programme
objectives?
One positive aspect of the incentive scheme is that it is straightforward to understand and operate.
However, most participants felt that the scheme should have been applied over a period of five (rather
than three) years, which would make it more directly comparable with incentive schemes in other
countries. The duration of the incentive scheme has also had implications for analysing South Africa‟s
cost competitiveness, as potential investors are comparing South Africa‟s three year incentive scheme
against other countries‟ offerings over five years. The extent to which the duration of our incentive
scheme may have discouraged investment in South Africa to date is not clear.
The BPS industry is split into two broad categories, namely front-office and back-office operators.
These differ not only in their service offerings, but in their employment requirements, required
xiii
employee skill levels, average size, and cost of operations. The back office operations require highly
skilled employees, and in most cases are smaller operations. As such, a number of existing and
potential back office operations are unable to take advantage of the scheme because they do not
meet the minimum requirement for 50 employees. In addition, given their smaller size, higher unit
costs, and higher labour cost, the incentive amount contributes proportionately less to reducing their
cost of operations than is the case for lower cost front-office operations. The incentive scheme is not
designed to take into account these differences in service types. This influences the type of
investment more directly incentivised by the scheme, which in turn impacts prospects for market
deepening (the process whereby South Africa progressively deepens its skills base and moves
beyond the zone of competing on price at the low-skill end of the BPS service market).
The administration of the scheme is perceived to be efficient with no major issues noted regarding the
application or claims processes. However, both the time-consuming, labour-intensive nature of the
paper-based application and claims processes as well as administrators‟ inability to respond to
technical queries relating to these processes and criteria in certain instances, were identified as areas
for improvement.
Recommendations:
A graded scheme by type of service should be introduced to provide higher incentives for
firms offering a higher value niche service offering, particularly in the case of back-office firms.
The requirements for back-office operators should also reflect their smaller size, and the
minimum requirement should be reduced to 20 jobs for such firms.
The application and claims processes should be translated from the current paper-based
platform, to an electronic, web-based platform, which will increase the efficiency of the
process, and will enhance the scope for effective, timeous monitoring and information
processing. The dti is in the process of setting up such a system. This needs to be prioritised
and implemented as soon as possible.
Any adjustments to the design of the scheme must not complicate the application and claims
processes.
The responsibility of communication of information specific to the policy guidelines,
operational and strategic issues of the incentive scheme should be allocated to a single
contact person, who should be well informed and equipped to respond to relevant technical
queries.
3. What is the current rate of job creation through the BPS incentive scheme?
In the 2012/2013 year, the number of projects on the scheme grew by 60% to 32. The number of jobs
created/supported grew by 48% to 3,807. While this is a significant increase over the two years, when
assessed in relation to the maximum allocation as per the MTEF budget, and the potential for growth
in the industry, there is definite scope for improvement.

xiv
Recommendations:
Increasing the number of firms on the scheme and consequently the rate of jobs created must
be made a priority. This is linked both to improving the promotion strategy of the incentive
scheme (especially in the case of domestic stakeholders with an international client base) so
as to attract more investors, as well as to the need for the introduction of graded incentives so
as to capture a greater portion of the entire BPS value chain.
Again, companies should be encouraged to make more realistic projections. This might be
achieved through the application of a bonus incentive designed to reward accurate
forecasting and the fulfillment of projections.
4. How competitive and cost-effective is South Africa’s BPS incentive programme?
The incentive scheme has contributed to making South Africa more competitive than it was in
2010. South Africa‟s cost gap has reduced against all five benchmark countries5, as compared to
the case prior to the BPS incentive scheme. However, when a full assessment is made over the
life of the scheme and compared with other countries, South Africa‟s cost disadvantage is set to
increase rather than decrease. This is primarily due to two factors: the reducing nature of the
incentive scheme; and the three year duration of the scheme as compared to other schemes in
competitor countries which typically run for five years.
There is uncertainty around the future of the incentive scheme. This was noted by every
participant as being a major source of concern. This uncertainty is beginning to adversely affect
South Africa‟s competitiveness as an investment destination.
There is no specific strategy to promote the incentive scheme. The marketing of the scheme
occurs within the broader marketing of South Africa‟s BPS industry. It is essential that the
incentive is adequately promoted to investors as a distinct feature of South Africa‟s BPS offering,
to ensure that South Africa‟s competitiveness is accurately understood by potential investors.
Recommendations:
The incentive scheme is playing a role in reducing the cost gap between South Africa and its
competitors, and should be extended in duration to maximise this benefit.
Communication from the dti regarding the future of the scheme must be increased. Even
though a final decision may not be made immediately about the extension of the scheme,
communication of the fact that the issue is currently being explored and, if possible, of a date
by when decided decision is expected to be reached, will alleviate the current anxiety.
There needs to be a more concerted effort to promote the incentive scheme prominently
within South Africa‟s value proposition to domestic service providers and captives. Any
promotion of the incentive scheme must be communicated to all industry participants so as to
ensure consistency in the message that is delivered to potential investors.
Better coordination is needed between the entity responsible for the promotion of the
incentive scheme and industry bodies and companies, to develop a coherent strategy for
communicating and promoting the scheme to investors.
5 Egypt, Kenya, Philippines, Poland, India.

xv
BPS industry analysis and recommendations:
The TOR presented three questions which examined key factors affecting the success of the BPS
sector as a whole, namely: how the programme can be up-scaled, what barriers exist to growing the
BPS sector, and how the BPS sector can be sustained post the incentive period. The
recommendations stemming from the analysis of the information around these specific questions are
inter-related and as such are discussed in combination.
There are two primary factors that will determine the success of South Africa‟s BPS industry: the cost
of operating and the quality of the service provided.
The findings strongly indicate that there is an insufficient skills pool to meet the current and future
demands of the BPS industry in South Africa. This has a direct bearing on both the cost and quality of
service, and appears to be the main barrier to growing the BPS sector and to its future up-scaling.
The skills shortage was highlighted by many respondents as one of the major constraints to setting up
and/or expanding their operations.
Recommendations:
The industry must be positioned to provide a compelling offering to investors based on the
key factors that will drive long term competitiveness and growth. This implies that the
incentive scheme must be continued beyond its current three year duration to keep South
Africa cost-competitive.
The skills challenge needs to be addressed. The availability of skills is a fundamental
determinant of South Africa‟s long term value proposition and of its ability to graduate beyond
the zone of subsidised competition at the low value end of the service market. It therefore
needs to be addressed with urgency by the industry and government, ideally in partnership.
Beyond the incentive scheme, the BPS industry should align employee training to better meet
the demands of the industry.

1
1. INTRODUCTION
The National Evaluation Policy Framework (NEPF), which sets out the context for a National
Evaluation System for South Africa, was approved in November 2011. The NEPF
encompasses various government interventions, including policies, plans, programmes and
projects. The Department of Performance Monitoring and Evaluation (DPME) at the
Presidency is mandated to conduct evaluations under the NEPF. Eight evaluations were
earmarked to be conducted between 2012/2013.
One of the first evaluations to be undertaken was an implementation evaluation of the
Business Process Services (BPS) Programme, paying particular attention to the incentive
scheme portion of the programme. The BPS incentive scheme is administered by the
Department of Trade and Industry (the dti) through the Incentive Development Administration
Division (IDAD)
1.1. THE TERMS OF REFERENCE
The DPME, in partnership with IDAD, issued a Terms of Reference (TOR) in August 2012 for
an implementation evaluation of the BPS incentive scheme. The purpose of the evaluation is to
investigate whether the BPS incentive scheme is achieving its main objectives, namely those
of job creation and attracting foreign direct investment (FDI). The evaluation covers the period
from the inception of the incentive scheme in January 2011 through to December 2012. The
evaluation covers Gauteng, Western Cape and KwaZulu-Natal; where BPS companies
operate.6
The DPME contracted Genesis Analytics (Genesis) to conduct the implementation evaluation
of the BPS incentive scheme. An inception report was submitted and approved in October
2012, and a field report was submitted in early February 2013.
1.2. OBJECTIVES OF THE IMPLEMENTATION EVALUATION
In order to measure progress towards achieving the programme‟s set targets for job creation
and FDI the evaluation assessed the efficiency, effectiveness, relevance and sustainability of
both the design as well as the implementation of the BPS incentive scheme. It was through this
process that key barriers to the achievement of these targets were revealed. The information
gathered highlighted the strengths of the BPS incentive scheme and has enabled the
formulation of recommendations for improvement where possible.
A number of key questions guided the evaluation:
Are the objectives of the BPS incentive programme being achieved?
What are the key factors influencing the success of the BPS sector in South Africa?
Is the design of the incentive programme supporting the achievement of programme
objectives?
What is the current rate of job creation through the BPS incentive scheme?
How cost-effective and competitive is South Africa‟s BPS incentive programme relative
to those of competing countries?
6 Although the BPS incentive scheme is a national programme, investors have not yet set up substantial investment in
any of the other six provinces.

2
How can the programme be up-scaled for greater impact and what are the barriers to
growing the BPS sector in South Africa?
How can the BPS sector be sustained post-incentive period?
A number of the evaluation questions relate specifically to an assessment of the BPS incentive
scheme itself, whilst others have a broader scope assessing the overall industry.
The evaluation included the collection and analysis of primary and secondary research
information on the BPS incentive scheme since its introduction in 2011.
1.3. EVALUATION CRITERIA
This study made use of the internationally accepted Development Assistance Community
(DAC) evaluation criteria.7 The DAC criteria provide five measures against which each
programme/project should be assessed: relevance; effectiveness (achievement); efficiency;
impact, and sustainability. For the evaluation of the BPS incentive scheme we have adapted
the DAC criteria to encompass the following four categories, which adequately reflect the
objectives of the implementation evaluation:
Efficiency measures the extent to which resources allocated to the programme were
used efficiently to deliver a quality programme (i.e. the efficiency of the project
approval, selection, disbursement, deployment and management cycle). In this
evaluation, efficiency assessed the extent to which the incentive scheme is
administered and marketed efficiently and the extent to which internal processes are
effective.
Relevance assesses the extent to which the incentive scheme is consistent with
national and local priorities and also with the needs of the beneficiaries. This involves
analysing the extent to which the incentive scheme enables investment and job
creation, the quality of the jobs created and to what extent the design of the scheme
maximises these.
Achievement of the incentive scheme‟s objectives assesses the extent to which the
incentive scheme is on track to meet its targets and objectives of job creation and
attracting FDI. Impact has been incorporated into the achievement criteria, as impact
is measured through the achievement of the impact level indicators to date.
Sustainability interrogates whether or not the benefits reaped as a result of the
incentive scheme are likely to continue after the incentive scheme ends. In particular,
this section assesses if the incentive scheme is catalysing an uncompetitive
environment to become competitive, or creating an unsustainable distortionary
environment.
Additionality focuses on the extent to which the incentive has created sustainable employment that would not have occurred otherwise.
7 DAC, Principles for the Evaluation of Development Assistance, OECD (1991). The OECD‟s DAC (Development
Assistance Committee) criteria provide a useful framework for evaluating developmental assistance. This framework is globally recognised and is used by a number of development assistance organisations, so enables comparison between programmes. More information is available at http://www.oecd.org/dac/evaluationofdevelopmentprogrammes/daccriteriaforevaluatingdevelopmentassistance.htm.
3
2. OVERVIEW OF THE OUTSOURCING AND
OFFSHORING INDUSTRY
2.1. GLOBAL OVERVIEW
The global offshoring and outsourcing market has evolved significantly since its initial phase of
expansion between 1995 and 2000. Not only has the industry grown as result of outsourcing
and offshoring becoming increasingly accepted globally, but the value proposition too has
evolved. Organisations are increasingly looking beyond the reduced cost benefits of labour
arbitrage and automation towards other commercial benefits such as increased flexibility,
scalability and business insight.8
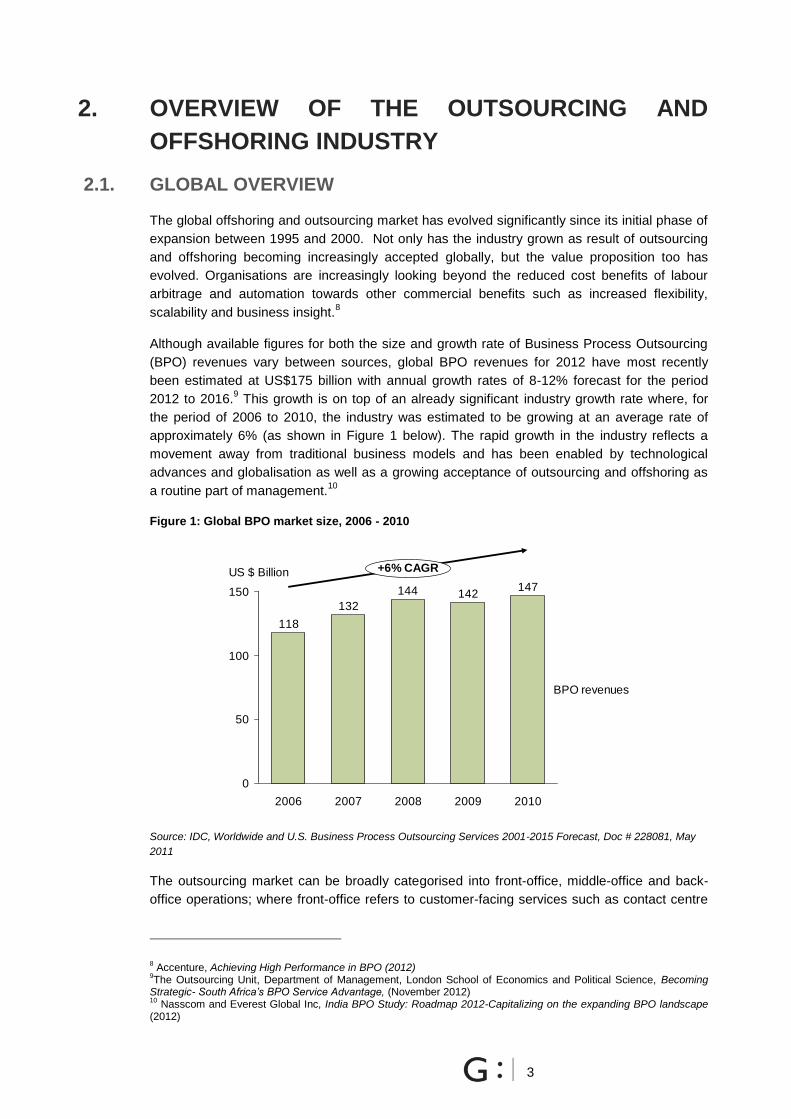
Although available figures for both the size and growth rate of Business Process Outsourcing
(BPO) revenues vary between sources, global BPO revenues for 2012 have most recently
been estimated at US$175 billion with annual growth rates of 8-12% forecast for the period
2012 to 2016.9 This growth is on top of an already significant industry growth rate where, for
the period of 2006 to 2010, the industry was estimated to be growing at an average rate of
approximately 6% (as shown in Figure 1 below). The rapid growth in the industry reflects a
movement away from traditional business models and has been enabled by technological
advances and globalisation as well as a growing acceptance of outsourcing and offshoring as
a routine part of management.10
Figure 1: Global BPO market size, 2006 - 2010
Source: IDC, Worldwide and U.S. Business Process Outsourcing Services 2001-2015 Forecast, Doc # 228081, May
2011
The outsourcing market can be broadly categorised into front-office, middle-office and back-
office operations; where front-office refers to customer-facing services such as contact centre
8 Accenture, Achieving High Performance in BPO (2012)
9The Outsourcing Unit, Department of Management, London School of Economics and Political Science, Becoming
Strategic- South Africa’s BPO Service Advantage, (November 2012) 10
Nasscom and Everest Global Inc, India BPO Study: Roadmap 2012-Capitalizing on the expanding BPO landscape (2012)
147142144
132
118
0
50
100
150
2010200920082007
+6% CAGR
BPO revenues
US $ Billion
2006
4
operations, middle-office refers to secondary operations such as billing and record keeping,
and back-office refers to internal business operations which are non-client facing. Middle-
office and back-office operations can have similar functions depending on the context. IDAD,
and correspondingly the TOR, omits middle-office operations from the description of business
process outsourcing activities; thus, to ensure consistency, this report takes a similar approach
and categorises all internal business functions as back-office operations (these are outlined in
Table 1).
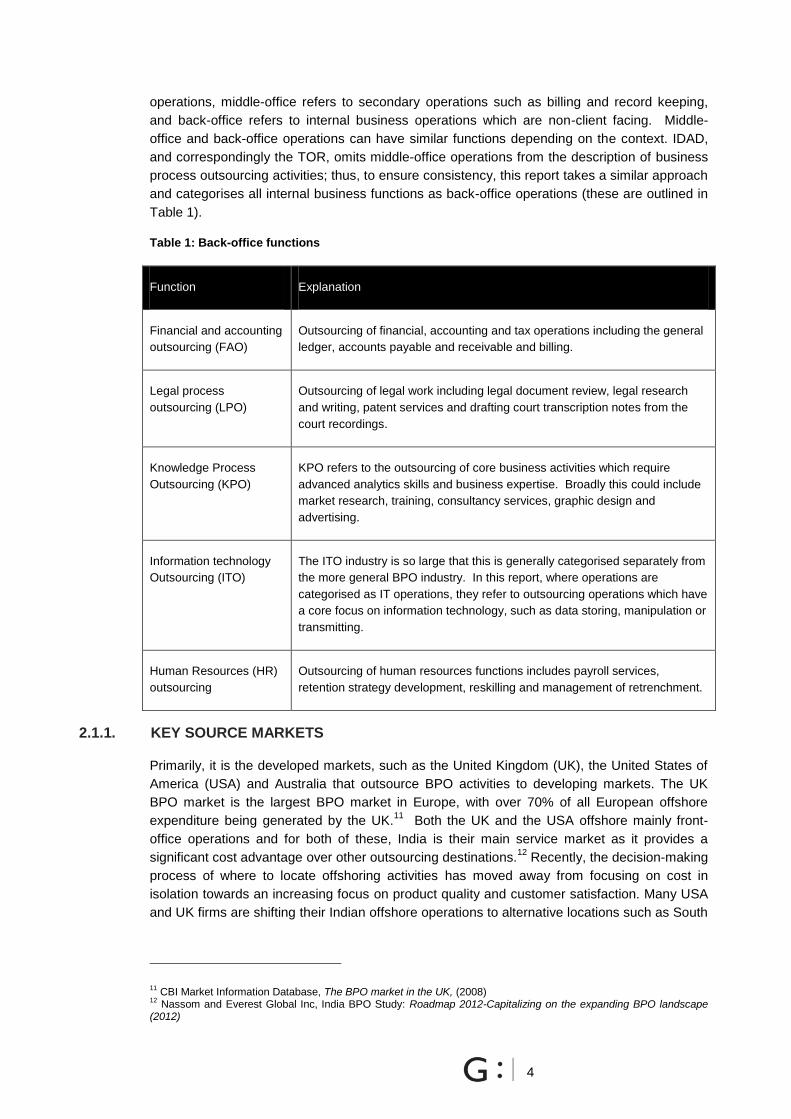
Table 1: Back-office functions
Function Explanation
Financial and accounting
outsourcing (FAO)
Outsourcing of financial, accounting and tax operations including the general
ledger, accounts payable and receivable and billing.
Legal process
outsourcing (LPO)
Outsourcing of legal work including legal document review, legal research
and writing, patent services and drafting court transcription notes from the
court recordings.
Knowledge Process
Outsourcing (KPO)
KPO refers to the outsourcing of core business activities which require
advanced analytics skills and business expertise. Broadly this could include
market research, training, consultancy services, graphic design and
advertising.
Information technology
Outsourcing (ITO)
The ITO industry is so large that this is generally categorised separately from
the more general BPO industry. In this report, where operations are
categorised as IT operations, they refer to outsourcing operations which have
a core focus on information technology, such as data storing, manipulation or
transmitting.
Human Resources (HR)
outsourcing
Outsourcing of human resources functions includes payroll services,
retention strategy development, reskilling and management of retrenchment.
2.1.1. KEY SOURCE MARKETS
Primarily, it is the developed markets, such as the United Kingdom (UK), the United States of
America (USA) and Australia that outsource BPO activities to developing markets. The UK
BPO market is the largest BPO market in Europe, with over 70% of all European offshore
expenditure being generated by the UK.11
Both the UK and the USA offshore mainly front-
office operations and for both of these, India is their main service market as it provides a
significant cost advantage over other outsourcing destinations.12
Recently, the decision-making
process of where to locate offshoring activities has moved away from focusing on cost in
isolation towards an increasing focus on product quality and customer satisfaction. Many USA
and UK firms are shifting their Indian offshore operations to alternative locations such as South
11 CBI Market Information Database, The BPO market in the UK, (2008)
12 Nassom and Everest Global Inc, India BPO Study: Roadmap 2012-Capitalizing on the expanding BPO landscape
(2012)

5
Africa, Eastern Europe and Central America.13
Despite this movement however, India remains
the largest UK offshoring location. The BPO market in Australia is dominated by local
outsourcing rather than offshoring outsourcing; however, the offshoring component is
becoming increasingly popular, such that Australian firms now have operations in the
Philippines, Malaysia and India.
2.1.2. MAIN SERVICE MARKETS
BPO operations are often considered to be resilient to recessionary periods, making the
provision of these services attractive to developing markets. Figure 2 shows that in 2012
BRICS14
countries were responsible for 85% of the ITO and BPO market share. A majority of
this share is held by India, reflecting its continued dominance of the outsourcing service
offering.
Figure 2: Global market share of ITO/BPO service providers, BRICS and non-BRICS, 2012
Source: Genesis Analytics, adapted from The Outsourcing Unit, Department of Management, London School of
Economics and Political Science, Becoming Strategic- South Africa’s BPO Service Advantage, (November 2012)
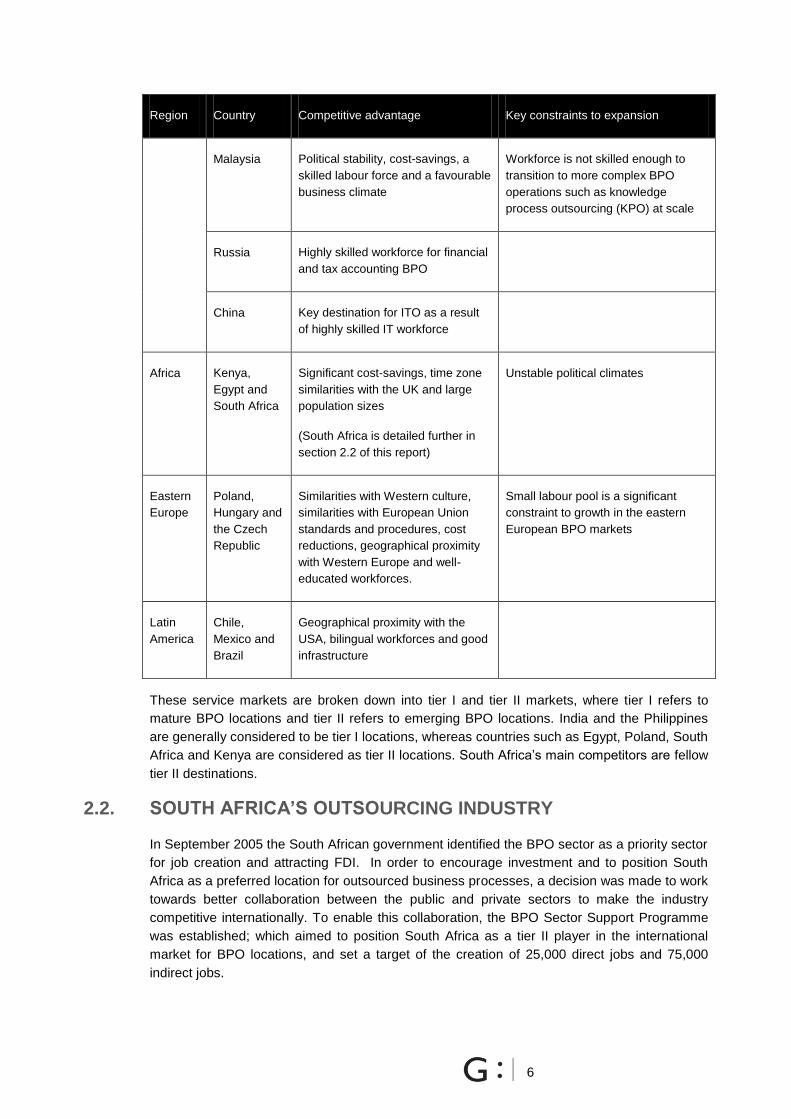
The perceived advantages of each of the key BRIC and non-BRIC service markets are
described in Table 2 below:
Table 2: Key BPO/ITO service markets by region
Region Country Competitive advantage Key constraints to expansion
Asia India Significant cost savings, competitive
incentives, a large pool of talented
English speakers and a mature
BPO market
The
Philippines
Similarities with Western culture,
high English language proficiency
and significantly reduced labour
costs
Workforce is not skilled enough to
transition to more complex BPO
operations such as knowledge
process outsourcing (KPO) at scale
13 Agile Equity, Business Process Outsourcing: Moving Beyond Borders and Cost (2010)
14 The BRICS countries are Brazil, Russia, India, China and South Africa
6%
15%
68%
China
Russia1%
South Africa
India
4%
6%
Non-BRICS
Brazil
6
Region Country Competitive advantage Key constraints to expansion
Malaysia Political stability, cost-savings, a
skilled labour force and a favourable
business climate
Workforce is not skilled enough to
transition to more complex BPO
operations such as knowledge
process outsourcing (KPO) at scale
Russia Highly skilled workforce for financial
and tax accounting BPO
China Key destination for ITO as a result
of highly skilled IT workforce
Africa Kenya,
Egypt and
South Africa
Significant cost-savings, time zone
similarities with the UK and large
population sizes
(South Africa is detailed further in
section 2.2 of this report)
Unstable political climates
Eastern
Europe
Poland,
Hungary and
the Czech
Republic
Similarities with Western culture,
similarities with European Union
standards and procedures, cost
reductions, geographical proximity
with Western Europe and well-
educated workforces.
Small labour pool is a significant
constraint to growth in the eastern
European BPO markets
Latin
America
Chile,
Mexico and
Brazil
Geographical proximity with the
USA, bilingual workforces and good
infrastructure
These service markets are broken down into tier I and tier II markets, where tier I refers to
mature BPO locations and tier II refers to emerging BPO locations. India and the Philippines
are generally considered to be tier I locations, whereas countries such as Egypt, Poland, South
Africa and Kenya are considered as tier II locations. South Africa‟s main competitors are fellow
tier II destinations.
2.2. SOUTH AFRICA’S OUTSOURCING INDUSTRY
In September 2005 the South African government identified the BPO sector as a priority sector
for job creation and attracting FDI. In order to encourage investment and to position South
Africa as a preferred location for outsourced business processes, a decision was made to work
towards better collaboration between the public and private sectors to make the industry
competitive internationally. To enable this collaboration, the BPO Sector Support Programme
was established; which aimed to position South Africa as a tier II player in the international
market for BPO locations, and set a target of the creation of 25,000 direct jobs and 75,000
indirect jobs.

7
In February 2006, the Accelerated Shared Growth Initiative (ASGI-SA) was formally launched,
and identified the Business Process Outsourcing and Off-Shoring (BPO&O) sector as one of
the country‟s top three priority sectors to stimulate growth. Following from this, Cabinet
Memorandum no. 41 of 2006 outlined the key constraints to attracting investment in the South
African BPO sector:
Area I: High costs of doing business (relative to other BPS locations). Labour
and telecommunications costs in South Africa were high relative to other tier II
destinations. These costs were more prominent for foreign firms than domestic firms,
as domestic firms all faced the same prices, whereas foreign firms choose location
based on pricing.
Area II: Lack of required talent. South Africa‟s specialist BPS skills as well as BPS
managerial skills were limited.
Area III: Lack of investor support. South Africa was considered to be behind other
BPS locations in the amount of incentives that it offered to investors. Investors
correlate this to a lack of government support.
Area IV: Lack of a marketing programme. South Africa was lacking in terms of its
marketing efforts, thus hindering the growth of this sector.
Area V: Lack of experience and scale. South Africa had been serving the domestic
market and thus lacked the capabilities and scale that was needed to attract
international investors.
As a means of overcoming these constraints, Cabinet approved a substantial Government
Assistance and Support (GAS) programme, aimed at improving marketing, increasing ease of
entry into the South African BPO&O market, improving processes for expanding existing
BPO&O operations, deepening the skills pool, improving administrative processes and
introducing investment incentives.
In this context, the Business Trust, the dti and Business Process enabling South Africa
(BPeSA) entered into a partnership to implement a number of work streams, including:
Strategic Marketing. This stream focused on marketing South Africa as a
competitive BPO location.
A talent development programme. This focused on deepening the skills pool and
resulted in the roll out of the Monyetla Work Readiness Programme™.
Industry Mobilisation. This intended to build a strong industry body and membership
base.
Achieving a quality standards regime. This aimed to improve the quality of the
South African offering.
Creating an enabling environment. This work stream focused on creating an
enabling environment of infrastructure and incentives.
Two further work streams were later identified:
Telecommunications costs. This attempted to lower South Africa‟s relatively high
telecommunications costs.
Second Economy. This aimed to encourage investment of BPO locations into tier II
cities, in other words, the decentralised areas.

8
2.2.1. SOUTH AFRICA’S VALUE PROPOSITION
Since 2007, South Africa‟s reputation as a business process offshoring location has been
rapidly gaining credibility. This reputation is based on high service quality and medium cost
back-office and contact centre operations. As South Africa‟s industry matures, its ability to offer
quality voice, back-office and shared services operations is increasing. The South African
outsourcing industry is highly competent in knowledge process outsourcing, financial services
outsourcing and legal processing outsourcing.15
This higher value work and high levels of
customer satisfaction has attracted many international call-centre outsourcers (such as Aegis
BPO and Fusion), to set up operations and has also attracted numerous international
companies (such as Amazon and ASDA) which have set up captive outsourcing operations in
South Africa. These companies are primarily from the UK. The dti, Business Trust and
BPeSA developed the value proposition (Figure 3 below) which is used to attract potential
investors.
Figure 3: South Africa's value proposition
Source: Adapted from BPeSA, the dti and the Business Trust’s We Speak your Language: South Africa’s proposition
for business process offshoring
A skilled, English-speaking talent pool
A report by Everest Group16
identified South Africa as being among the top three global
offshore locations that can provide English skills at scale. In 2010, South Africa was ranked
behind only India and the Philippines in terms of annual supply of fresh talent for English
language BPO. On top of South Africa‟s 350,000 annual supply of English talent, it also has
3.6 million people who speak English as a first language; this is the highest number of first
language English speakers among offshoring locations. When the report reviewed the South
15 Figure 5 presents the breakdown of these services in South Africa
16 Everest Group, Internal Analysis (2010)
• Quality infrastructure
• Good quality of life for
expatriates
• Time zone similarities with,
and easy access to, the UK
• Costs 50-60% less than
source markets
• Incentives that reduce costs
by 20%
• Narrowing cost differential with
low-cost destinations
• Attractive investment climate
• Improving telecoms
• Political and socio-economic
stability
Robust enabling environment
• Mature domestic market
• Financial and legal services
expertise
• Large experienced pool
• Large scale English language
talent pool with neutral accent
• Superior customer experience
• Cultural affinity with the UK
A skilled, English-speaking talent pool
Deep domain skills
Significant cost savings First World Experience

9
African accent, it was found that 90% of UK survey respondents prefer the South African
English accent to that of the Asian geographies. This English-speaking talent pool, combined
with South Africa‟s cultural affinity with the UK market, results in BPO competitive advantage.
Although 85%17
of South Africa‟s contact centres are English-language based, increasingly
more operations, such as Amazon, are providing German language services. In the financial
services and back-office operations, this focus on non-English speakers is even greater as the
combination of Dutch or German knowledge combined with the South African financial skills,
yields a better combination than outsourcing to Europe itself. The German language
capabilities in South Africa are comparable to those of other BPS offshoring locations such as
Krakow in Eastern Europe; however, South Africa is likely to have better value for money.
Deep domain of skills
South Africa offers a mature, skilled service market for investors. These skills extend across
the financial, healthcare and legal outsourcing operations; offering world-class service for
complex processing operations. The ability to handle complex operations is evidenced in the
distribution of the complexity of the industry, where 70%18
of the industry is dominated by
contact centre services and the other 30% is more back-office based. However, within the
contact centre operations, these operations are more complex in terms of customers, data and
processes than the traditional low-cost contact centre.
South Africa‟s developed education system and sector-specific training programmes result in a
comparative advantage over other BPO locations as there is a large pool of qualified personnel
in specialist areas. These specialised skills are particularly prevalent in the financial services
sector. Furthermore, the qualifications of these professionals are generally seen to be
comparable with those of the UK.
Lastly, this domain advantage is driven by South Africa‟s similarities with Western Standards,
including similar data protection laws, products and certifications.
Significant cost savings
According to Everest Group, South Africa‟s costs are approximately 50-60% cheaper than
source markets, 30-40% cheaper than near-shore locations in the UK and 10-20% cheaper
than locations in Central and Eastern Europe.19
With the BPO&O incentive, South Africa‟s
costs were also comparable to established low-cost BPO locations.
First World Experience
The quality of life for expatriates, access to advanced infrastructure, the low cost of living, the
similarity with the UK time zone as well as the ease of access to the country itself, increases
South Africa‟s appeal as a BPS location.
Robust enabling environment
Aspects of South Africa‟s enabling environment include improving telecommunications,
political and socio-economic stability, an attractive investment climate as well as strong public
sector support. The government provides skills development support in the form of talent
17 NelsonHall, Analysis of South Africa as a BPO Delivery Location (2011)
18 NelsonHall, Analysis of South Africa as a BPO Delivery Location (2011)
19 The dti , Business Trust and BPeSA, BPO Marketing Programme (2012)
10
development programmes, like Monyetla; and Sector Education and Training Programmes
(SETAs). The industry associations, such as BPeSA, provide assistance and support to
investors setting up and to existing industry players.
The BPO&O and the BPS incentive schemes form components of the “significant cost savings”
aspect of the value proposition.
2.2.2. BPO&O INCENTIVE SCHEME
A central role in the country‟s outsourcing strategy was played by the „creating an enabling
environment‟ work stream, which rested on the provision of incentives to firms to set up
operations in South Africa. Approximately R1 billion in incentives was earmarked to help
assuage the capital costs investors faced in setting up in South Africa. The BPO&O incentive
programme was launched in July 2007 and was planned to run for a period of four years
(through to March 2011). The incentive programme was only offered to investors establishing
new or expanding projects serving offshore clients. These projects were required to create at
least 100 seats and 200 jobs in their first year of operation.
As of September 2009, there were 19 investors and 21 projects taking part in the incentive
programme. Of these, four were international investors, 12 were South African investors with
foreign contracts, and three were South African investors who had invested in the second
economy. Between July 2007 and March 2010, approximately 6,000 new jobs were created
and R303 million of direct investment was received.
There were however, a number of challenges identified with this programme, including:
Process delays as a result of the Department of Labour (DoL) and dti managing
different areas of the incentive programme;
Unclear guidelines and timeframes;
Difficulties in forecasting jobs;
Concerns around the suitability of the training support grant; and
The investment grant was considered to be useful, however, the training support grant
was less successful in implementation and the awareness of the Monyetla Work
Readiness Programme™ was low, resulting in poor up-take.
This programme was reviewed in 2010 by Everest Group. The resultant report highlighted the
fact that while South African incentives were capital expenditure (capex) based, one-time
grants, those of competitors were mainly yearly operational expenditure (opex) based
incentives. It was found that the incentives offered by South Africa did not adequately reduce
the costs between South Africa and its competitors. The Everest report proposed a number of
structural and operational changes to the BPO&O programme, including:
A move to an opex incentive design based on actual jobs created rather than on a mix
of jobs and seats;
Incentives to be paid out for three years;
Incentives taper down over the three years in line with the narrowing cost gap between
South Africa and its competitors; and
Minimum eligibility of 50 jobs.
These revisions were incorporated into the BPS incentive scheme launched in 2011.

11
2.2.3. THE BPS INCENTIVE SCHEME
The BPS20
incentive scheme came into effect in January 2011. The objective of the BPS
incentive scheme is to create jobs and attract foreign investment, with initial company
projections suggesting the creation of 15,868 new jobs by March 2014. The BPS incentive is
comprised of two components, namely a base incentive, and a graduated bonus incentive
(Figure 4), differentiated as follows:
Base Incentive: a three year opex grant paid per Full Time Equivalent (FTE) job
created,21
which tapers down in line with narrowing the cost gap between South Africa
and other destinations.
Bonus Incentive: this is offered for greater job creation, if the applicant exceeds
annual offshore job creation targets. This is paid once in the year that the bonus level
is first achieved.
The base incentive is disbursed quarterly, over a period of three years. This is disbursed per
company on the basis of actual jobs created and sustained. The incentive is only available to
applicants who are servicing the offshore market. For a project to be eligible for the scheme, it
must create at least 50 new offshore jobs by the end of the three years, and to qualify for the
first disbursement a project must have employed a minimum of ten offshore jobs. Furthermore,
a project cannot displace existing jobs in South Africa and projects may not be receiving
concurrent incentives under the BPO&O incentive scheme.
Figure 4: BPS Incentive payment design
Source: Adapted from BPeSA, the dti and the Business Trust’s Our Incentives: Making a Difference
20 With the revision, the name was changed to Business Process Services (BPS)
21 FTE jobs, as defined in the incentive scheme‟s programme guidelines, refers to jobs occupying seats/operating
facilities, handling calls or rendering services regarding the outsourced/offshore market. It refers to agents working an equivalent 45 hours per week (including lunch breaks) and 40 hours per week where lunch breaks are excluded, taking into consideration the provisions of a „compressed working week‟ and „average working hours‟, as detailed in the Basic Conditions of Employment Act (BCEA) 1997, as amended. The number of offshore jobs is calculated as an average number of applicable working hours for a claim period.

12
2.2.4. OVERVIEW OF BPS INCENTIVE SCHEME PARTICIPANTS
Data made available by the dti identifies 32 projects participating in the BPS incentive scheme
as of March 2013. The 32 projects are run by 31 companies22
comprising a combination of
service providers and captive operators. For the service providers, an approved project may
involve services to more than one client but grouped as one project for the purposes of the
incentive application. Of the service providers, 45% are international companies (mainly from
the UK) who have set up operations in South Africa to offer outsourcing services to other
international companies. This reflects the increasing attractiveness of South Africa as an
outsourcing destination.
The projects under the incentive scheme are distributed across service types and geographical
locations. The company‟s service type has been roughly categorised as the function which is
its predominant activity (for example, where a company is primarily as a contact centre with a
few seats as back-office operations, it is categorised as a front office operation). Where
companies do not have a clear split between front- and back-office operations, these are
categorised as servicing both front- and back-office; these were all found to be captive
operators who are in the shared services operations. As shown in Figure 5, the majority (66%)
of the projects are providing front-office operations, and within this, there is an almost even
split between inbound (57%) and outbound operations (43%). Back-office services account for
22% of the total operations; and of these there is an almost even split between operations that
focus on HR and pay roll, information technology (IT), KPO, LPO and FAO; with a slightly
larger proportion of operations in KPO and LPO services. Shared service operations, which
are primarily a combination of HR, FAO and customer query services for the captive operation,
make up 13% of projects.
22 Merchants SA (Pty) Ltd have two projects on the incentive scheme

13
Figure 5: Split of projects by service type
Source: dti data, 2013,
The 32 projects are distributed across KwaZulu-Natal, Gauteng and the Western Cape. This
split is shown in Table 3 below. The projects in KwaZulu-Natal are mostly outbound contact
centres; and those projects in the Western Cape are mainly inbound contact centres, with a
significant number of back-office operations. There are four shared services operations taking
part in the incentive scheme; three of these are in Gauteng, and one is located in the Western
Cape.
Table 3: Distribution of projects by province and service type
KwaZulu-Natal n=11 Western Cape n=15 Gauteng n=6
Front office 9 Front office 9 Front office 3
Inbound 1 Inbound 9 Inbound 2
Outbound 8 Outbound 0 Outbound 1
Back Office 2 Back Office 5 Back Office 0
KPO 1 KPO 1 KPO 0
LPO 0 LPO 2 LPO 0
IT 0 IT 1 IT 0
FAO 0 FAO 1 FAO 0
HR 1 HR 0 HR 0
Combination of front and back office
0 Combination of front and back office
1 Combination of front and back office
3
Source: dti data, 2013
22%
66%
Total back office
Total front office
Service offering of both front and back office
13%
57%Inbound
43%Outbound
29%
29%
HR
IT
14%
14%
FAO
14%
LPO
KPO

14
3. METHODOLOGY
3.1. ANALYTICAL FRAMEWORK
The analytical framework was developed by identifying 26 indicators across the four evaluation
criteria (see Table 4) described above in Section 1.3. The indicators comprise a combination of
quantitative and qualitative questions.23
The full analysis framework is included as Annex B.
Table 4: Number of indicators used per evaluation criterion
Evaluation Criterion Number of indicators used
Efficiency 7
Relevance 7
Achievement 7
Sustainability and additionality 5
Additionality 1
Total number of indicators 26
In order to maintain an objective and standardised approach to assessing the indicators,
qualitative responses were coded into a quantitative scale wherever possible to ensure that the
indicators could be aggregated in order to provide comparable findings. The scale was
adjusted appropriately and contextualised for each indicator (see Table 5 for an example).
Table 5: Sample indicator and scale
Indicator Scale
What was the approximate duration of
the application-to-approval process?
5 (<1 month), 4 (1 to 2 months), 3 (2 to 4 months), 2
(4 to 6 months), 1 (>6 months)
What are the key criteria determining
your investment decision in a country's
BPS industry?
6 (time zone), 5 (accent), 4 (cost), 3 (operational
experience), 2 (infrastructure/technological capacity),
1 (other)
A multi-method approach was undertaken to collect data for each of the indicators. This
involved:
Document reviews;
Data analysis;
Interviews; and
Cost-competitiveness analysis.
Both the methodology and the analysis framework were approved by the Steering Committee through acceptance of the Inception Report (October 2012) and the Analysis Framework (January 2013).
23 The analytical framework and indicators were presented to the Project Steering Committee and were approved prior
to finalisation and implementation.
15
3.2. DOCUMENT AND LITERATURE REVIEW
The first research component consisted of a document review of relevant BPS programme
documents and publications. The document review process involved a comprehensive review
of relevant data provided by the dti to Genesis, including the programme‟s administration
documents and records. The second research component, a comprehensive literature review
of the global BPO industry, resulted in the identification of key themes across the BPS industry
both internationally and in the South African context, as well as providing theoretical
understanding of incentive scheme best practice. The full list of documents and publications
reviewed is available in Table 10 of Annex A.
The document review provided greater detail of the industry context and served to improve the
team‟s understanding of the incentive scheme. These documents informed the analysis
framework, quantitative analysis and the interview planning.
3.3. DATA ANALYSIS
Quantitative data was collected from companies‟ application approval reports and the BPS
company data provided by the dti. . The data analysis included all 32 projects which were on
the incentive scheme at the time of the evaluation.
The quantitative analysis focused on the following elements:
The achievement of each project‟s job creation against its projections;
The total number of jobs created;
The projected investment to be generated from the incentive scheme;
The distribution of the projects by province and service type; and
The type, size and ownership of companies on the incentive scheme.
This analysis was crucial to accurately map the range of BPS incentive scheme participants.
The analysis enhanced the team‟s understanding of the type of companies participating in the
incentive scheme and the programme‟s achievement of its objectives. It was also important in
identifying the position of these firms in the industry (for example, in terms of growth stage),
how long they have participated in the incentive scheme, and the type of service provided by
these firms. Such analysis is vital when analysing the findings of the qualitative research
process. This quantitative review further uncovered gaps and additional pertinent questions to
be included in the interview process.
3.4. INTERVIEW PROCESS
Interviews were conducted in Johannesburg, KwaZulu-Natal and Cape Town with
representatives from participating companies, rejected or cancelled applicants, BPS industry
bodies/representatives and key government officials involved in the BPS incentive scheme and
the BPS industry as a whole. Standardised interview questions were developed for each
category of interviewee (categorised as client, government official, or industry body).

16
Interviews were conducted with 24 of the 28 companies participating in the scheme at the time
of the evaluation (see section 3.6.1)24
, nine government officials and one industry body. In a
number of instances, more than one interview was held for a company where there was more
than one relevant person to speak to and the interviews could not be held at the same time.
Table 11 in Annex A provides the details of companies, government personnel and
representatives of the industry bodies interviewed.
3.5. COST-COMPETITIVENESS ANALYSIS
A core component of the evaluation of the BPS incentive scheme involved an assessment of
the cost-effectiveness and competitiveness of South Africa‟s BPS incentive programme
compared to competing countries.25
The work focused on two main areas:
1. A historical (2010) and current benchmarking view of SA BPS cost-
competiveness, focussing on:
Contact centre services: benchmarking South Africa‟s fully loaded cost per Full
Time Equivalent (FTE) for contact centre services, considering the impact of
incentives. The countries included in this comparison were Egypt, Kenya,
Poland, Philippines, and India.
Financial services: benchmarking South Africa‟s fully loaded cost per FTE for
financial services back-office, considering the impact of incentives. The
countries included in this comparison were India and Poland.
2. An updated, forward looking view (i.e. next 3-5 years) on the projected cost gap
between South Africa and other offshore locations. The countries included in
this comparison were India and Poland.
In order to carry out the work as outlined above, the following methodological approach was
employed:26
Market intelligence and secondary research
Secondary research from public sources
Selective inputs from Everest Group‟s network (e.g. industry
stakeholders/experts)
Proprietary tools, databases and experiences
Prior benchmarking engagement on South Africa
Cost modelling
Research on global services market trends
Selective primary interactions with market participants
Egypt: Information Technology Industry Development Agency
India: National Association of Software and Services Companies (NASSCOM)
24 Due to it being financial year end at the time interviews were scheduled, two participants could not schedule
interview time with us as they were too busy. Two participants were travelling for the duration of the interview process; despite attempts to schedule telecoms with these companies, this could not be scheduled due to their busy schedules. CCMG was contacted but informed the researchers that they had nothing to do with the BPS incentive scheme and indicated that there was no point in interviewing them. 25
Genesis outsourced the cost-competitiveness analysis to the Everest Group, a leading global services advisory firm, with extensive experience of Business Process Services, particularly in South Africa. 26
See Annex C for a full list of the assumptions used by Everest in their analysis

17
Kenya: Kenya BPO and Contact Centre Society
Philippines: Business Processing Association of the Philippines
Poland: Polish Information and Foreign Investment Agency
3.6. LIMITATIONS OF METHODOLOGY AND SCOPE OF
RESEARCH
3.6.1. LIMITATIONS
As with any research, this research relied on a number of critical assumptions and was subject
to inherent constraints, captured as follows:
At the time that our fieldwork began, there were 28 companies taking part in the
incentive scheme. We aimed to engage each participant in the scheme; however, four
were unable to participate in the research within the necessary timeframe.
At the end of January 2013, three additional companies were approved for the
incentive scheme. These companies could not be included in the qualitative analysis
owing to the timeline of the evaluation. However, they were included in the quantitative
analysis.
The sample size is small and is reflective of the actual number of firms participating in
the incentive scheme. The report did not interview potential investors. The sample was
agreed with the Steering Committee at the inception phase. The findings therefore
reflect the experience of the participants in the scheme, and not potential investors or
firms not on the scheme. This potential bias towards participating companies is taken
into account in the analysis of qualitative findings.
Ideally we would have interviewed each provincial industry body as well as the
national body. However BPeSA National‟s CEO had recently resigned, and thus
BPeSA National and BPeSA Western Cape were represented in the same interview by
Gareth Pritchard in his capacity as CEO of both BPeSA Western Cape and BPeSA
National. There was no representation from industry bodies from Gauteng or KZN.
Despite attempts to interview stakeholders who had been part of the incentive scheme
and had had their applications rejected or cancelled, only one such interview was
completed (given the reluctance of others to participate).
There were a few inconsistencies in the data relating to job projections and actual jobs
created27
. As the average number of jobs created is calculated by an electronic
calculator developed by an external firm, inconsistencies with the data and the
underlying calculations were difficult to clarify with the dti.
The investment values used in this report are based on reported investment according
to submitted claim sheets. The investment figures are not audited and are therefore
reported as estimates. These values include operational expenditure, which in the
majority of cases consists primarily of salaries. Since no set template exists in terms of
the form in which these figures are reported, these figures were taken as additional in
some cases, and cumulative in others, as recommended by the dti.
27 In some cases, minor differences existed relating to projected and claimed-for job numbers between various data
sources.
18
3.6.2. SCOPE OF THE RESEARCH
The evaluation was mandated to cover the incentive scheme programme from its inception in
January 2011 until July 2012. The actual period of the incentive scheme‟s administration aligns
with the dti’s financial year, from April to March. However, at the inception phase of the project
in October 2012, it was agreed that the evaluation will cover the incentive scheme from its
inception to the most recent data. As such the 24 firms interviewed are firms currently on the
incentive scheme, and the data provided for analysis covers the period from January 2011 to
December 2012. The data analysis therefore covers the full 2011/2012 period of the incentive
scheme and 9 months of the 2012/2013 scheme.
The scope of this evaluation, focusing on the implementation evaluation of the BPS incentive
scheme, includes elements that cover certain issues relevant to the broader industry. The
seven evaluation questions, as listed above in Section 1.2 can be split into those specific to the
incentive scheme (Questions 1, 3, 4, 5), and those relevant to the broader BPS industry
(Questions 2, 6, 7). As a result, while the evaluation process, the findings and the
recommendations generated in this report primarily deal with the incentive scheme, a number
of broader issues are also covered.
The components of the evaluation that did not form part of the evaluation included:
Monyetla Work Readiness Programme™
Marketing
Industry mobilisation
Standards
Talent development initiative
Quality of sector operators
Industry organisation
However, in the research process, it was impossible to totally exclude certain aspects of these
themes, especially where there were links to elements of the evaluation of the BPS incentive
scheme. As a result, the findings and recommendations highlight issues relevant to these
themes, even though they are not central to the evaluation. In particular, this concerns issues
relating to the Monyetla Work Readiness Programme™, marketing and the skills of industry
employees.
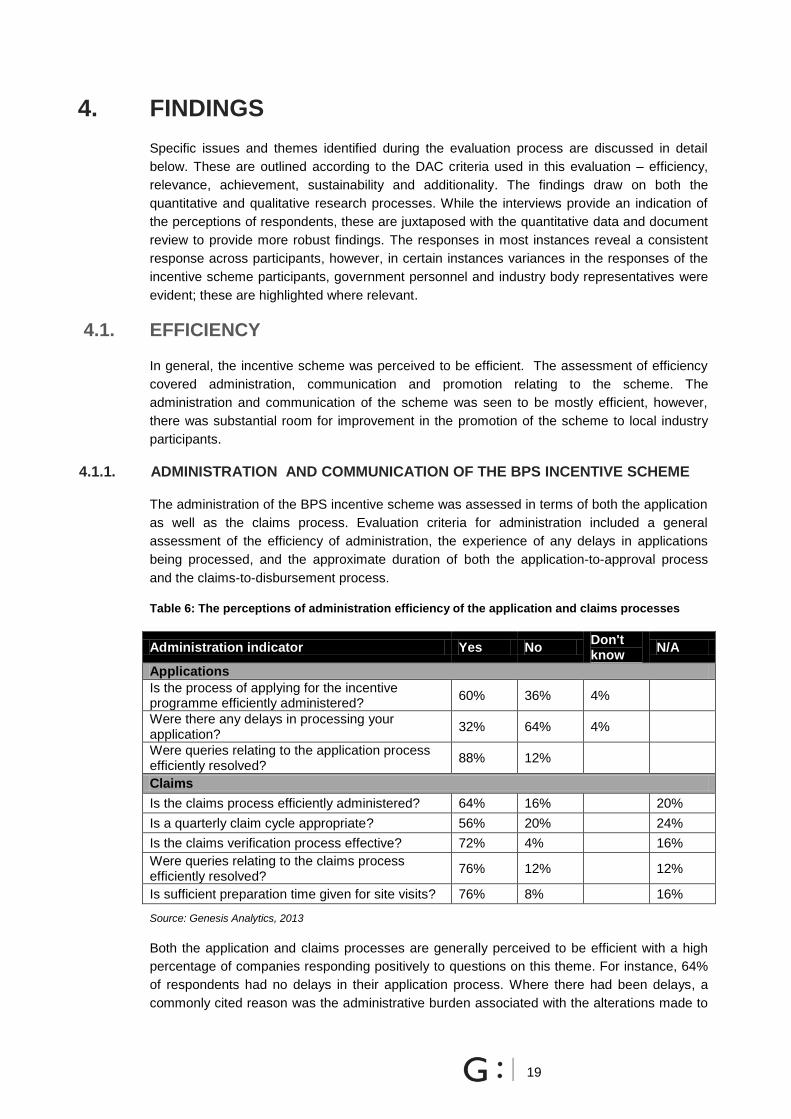
19
4. FINDINGS
Specific issues and themes identified during the evaluation process are discussed in detail
below. These are outlined according to the DAC criteria used in this evaluation – efficiency,
relevance, achievement, sustainability and additionality. The findings draw on both the
quantitative and qualitative research processes. While the interviews provide an indication of
the perceptions of respondents, these are juxtaposed with the quantitative data and document
review to provide more robust findings. The responses in most instances reveal a consistent
response across participants, however, in certain instances variances in the responses of the
incentive scheme participants, government personnel and industry body representatives were
evident; these are highlighted where relevant.
4.1. EFFICIENCY
In general, the incentive scheme was perceived to be efficient. The assessment of efficiency
covered administration, communication and promotion relating to the scheme. The
administration and communication of the scheme was seen to be mostly efficient, however,
there was substantial room for improvement in the promotion of the scheme to local industry
participants.
4.1.1. ADMINISTRATION AND COMMUNICATION OF THE BPS INCENTIVE SCHEME
The administration of the BPS incentive scheme was assessed in terms of both the application
as well as the claims process. Evaluation criteria for administration included a general
assessment of the efficiency of administration, the experience of any delays in applications
being processed, and the approximate duration of both the application-to-approval process
and the claims-to-disbursement process.
Table 6: The perceptions of administration efficiency of the application and claims processes
Administration indicator Yes No Don't know
N/A
Applications
Is the process of applying for the incentive programme efficiently administered?
60% 36% 4%
Were there any delays in processing your application?
32% 64% 4%
Were queries relating to the application process efficiently resolved?
88% 12%
Claims
Is the claims process efficiently administered? 64% 16% 20%
Is a quarterly claim cycle appropriate? 56% 20%
24%
Is the claims verification process effective? 72% 4% 16%
Were queries relating to the claims process efficiently resolved?
76% 12% 12%
Is sufficient preparation time given for site visits? 76% 8% 16%
Source: Genesis Analytics, 2013
Both the application and claims processes are generally perceived to be efficient with a high
percentage of companies responding positively to questions on this theme. For instance, 64%
of respondents had no delays in their application process. Where there had been delays, a
commonly cited reason was the administrative burden associated with the alterations made to

20
the scheme during the initial roll-out stage. Interaction with the government officials who
oversee the administration revealed that many of the delays are related to incomplete
application forms and missing documents such as tax clearance certificates.
The claims verification process is highly effective and sufficient time appears to be given for
site visits. Overall, 64% of companies found the claims process to be mostly efficient, with an
even greater percentage (72%) stating that the process of verifying their jobs created was
efficient. Five respondents (20% of the companies interviewed) were unable to comment on
the claims process because they had recently joined the scheme and had not submitted a
claim yet.
Commonly reported inefficiencies in the claims process are those related to the onerous and
perceived duplicative nature of current reporting mechanisms and requirements respectively.
However, it was also noted that the recently introduced quarterly claims process was more
conducive to relieving cash flow constraints than when the claims were submitted biannually.
An overwhelming majority (88%) of respondents described the communication and explanation
of the details of the scheme during the application process as efficient and sufficient to
promote timely and informed decision-making. In some cases respondents reported that the
communication from the dti representatives during this phase had been invaluable and had
played an important role in initiating instrumental relationships between industry and
government. Similarly, more than three-quarters of participants described communication
during the claims process as effective and efficient. Of the remaining 24%, half had not
experienced the claims process, and half had reported less positive interactions in this regard.
In the case of the latter, a main area of concern was that of the accessibility of relevant dti
representatives and the efficiency of communication in terms of response time.
Figure 6: Approximate duration of application and claims process
Source: Genesis Analytics, 2013
A consistent view across all stakeholders is that the administration of the scheme has
exhibited steady improvements over time. The application-to-approval process was reported to
take between two and four months by almost half of respondents, which aligns with the dti‟s
objective to process applications within six to eight weeks. Data provided by the dti shows that
the processing of applications takes, on average, 16 days. The delay between processing and
0% 0%
16%
8% 8%
less than
1 month
1-2 months 2-4 months
48%
24%
28%
12%
36%
4%
8%
4%
4-6 months More than
6 months
I don‟t know Not applicable
4%
Claims
Applications

21
companies receiving their approval appears to be dependent on the approval process of the
adjudication committee to which applications are submitted after processing.
For those companies which had submitted claims, the duration of the claim submission-to-
payment process was reported to have been largely varied. Responses suggest that 36% of
claims are processed within two months. Another 36% could not answer this question as they
were yet to claim. Similar to the application process, the dti‟s records indicate a shorter
duration of the claims submission-to-payment process (approximately 16 days) to what
respondents perceived; this time lag is believed to be the result of internal processes of the
finance department.
Despite the generally positive responses, a number of concerns were raised regarding the
applications and claims processes, namely:
In certain instances the administration officials were happy to help but were not able to
respond to certain technical issues/queries relating to the incentives
The process can be quite a tedious one, although this has recently been improved
In certain cases insufficient notice for site visits was given
Of the 64% of participants which did experience any kind of dispute resolution process, two
thirds found that their disputes were adequately handled and resolved. Many of these disputes
related to misunderstandings regarding the incentive scheme‟s procedures. Discussion and
resolution of these issues was reported to have been welcomed and satisfactorily dealt with.
Figure 7 shows that the handling and resolution of general comments and queries throughout
engagement with the scheme was described by more than half (52%) of respondents as
satisfactory, with one-fifth of respondents going as far as to describe this aspect of the
incentive scheme‟s communication processes as meeting best practice standards for the
industry.
Figure 7: Efficiency of responses to general queries and dispute management
Source: Genesis Analytics, 2013
In cases where dispute resolution and/or the handling of queries and comments were reported
to have been poorly handled, commonly raised issues included the inaccessibility of relevant
contact people, an inability of assigned department representatives to adequately address
relevant questions or concerns (this is with respect to technical questions, not administrative),
and a lack of follow up after initial contact. Approximately one third (36% and 32%
respectively) of participants had not had to engage either in any kind of dispute resolution or in
20%
Good
24%
Best Practice
0%
24%
32%
8% 8%
36%
16%
32%
Average Not applicablePoor
General queries
Dispute management

22
any comments/query-related communication with incentive scheme administrators at the time
of these interviews.
4.1.2. PROMOTION OF SOUTH AFRICA’S BPS INCENTIVE SCHEME
Although marketing was excluded as a core component of this evaluation in the TOR, it is
imperative that the relevant stakeholders, specifically potential investors and service providers,
are aware of the scheme‟s existence and the details of its offering. With this in mind, the
companies were asked two questions related specifically to the promotion of the BPS incentive
scheme within the broader marketing programme of the BPO industry.
It must be reiterated here that survey respondents were all located in South Africa. The
findings here therefore reflect the promotion of the scheme to local service providers and those
foreign investors who have already set up in South Africa. As such, the report cannot comment
on the effectiveness of the promotion of the incentive scheme to potential investors outside
South Africa.
Figure 8: Does the promotion of the South African BPS industry within South Africa include
specific information related to the BPS incentive scheme?
Source: Genesis Analytics, 2013
48%
24%
12%
16%
Not applicable
I don‟t know
Yes
No
“We were very happy with the application process. The process was very smooth and
efficient. There was good communication throughout the process. The dti team were very
helpful” – Gauteng based service provider
“Quarterly disbursements are much better than bi-annual disbursements, this helps with
cash flow” – KwaZulu-Natal based service provider

23
Figure 9: How attractive is the South African BPS incentive scheme compared to other
outsourcing incentives schemes?
Source: Genesis Analytics, 2013
Only a quarter of participants reported that they had been exposed to, or were aware of, any
promotion of the BPS incentive scheme itself. These respondents accounted for only 29% of
total employment generated by companies on the incentive scheme. Almost two-thirds (60%)
of respondents stated that they felt that the scheme was not promoted adequately within the
promotion of the industry as a whole or that they were unsure of whether any specific
promotion of the scheme took place at all.
Where respondents had heard of the scheme through promotional efforts, this was as a
component of the cost competiveness aspect of the value proposition. Many respondents
stated that they had only found out about the incentive scheme through word-of-mouth from
other industry players or as a result of their own independent research. These respondents
accounted for 65% of total employment generated by the incentive scheme, indicating that the
majority of jobs created by the incentive scheme were generated by employers who were not
directly made aware of the incentive scheme. Although our question was specifically targeted
at the promotion of the incentive scheme, and not South Africa‟s BPS industry as a whole, the
findings align with those of a recent study conducted by the London School of Economics
(LSE) in which South Africa‟s BPS industry was found to be “under-marketed” and in need of
increased marketing via a single source.28
The collective response of industry bodies and government officials to the question of whether
promotion of the BPS incentive scheme exists and is effective would seem to contradict that of
the companies. More than half (55%) of industry body and government department
representatives interviewed stated that the BPS incentive scheme was indeed well-marketed
alongside the South African BPS industry as a whole, and in fact that this marketing was a
foremost consideration in their respective entity‟s BPS industry development strategy and
budget. Certain government department representatives did however, acknowledge that the
promotion efforts to date had not been as effective as originally projected, and that
improvement was needed in this area. Similarly, a bias towards promoting specific regions
within the country rather than the incentive scheme as it applies to the nation as a whole was
noted as an area of concern by certain government officials.
28 The Outsourcing Unit, Department of Management, London School of Economics and Political Science, Becoming
Strategic- South Africa’s BPO Service Advantage, (November 2012), page 28
32%
4%
32%
20%
12%
Best practice
Unobserved
Poor
Average
Good
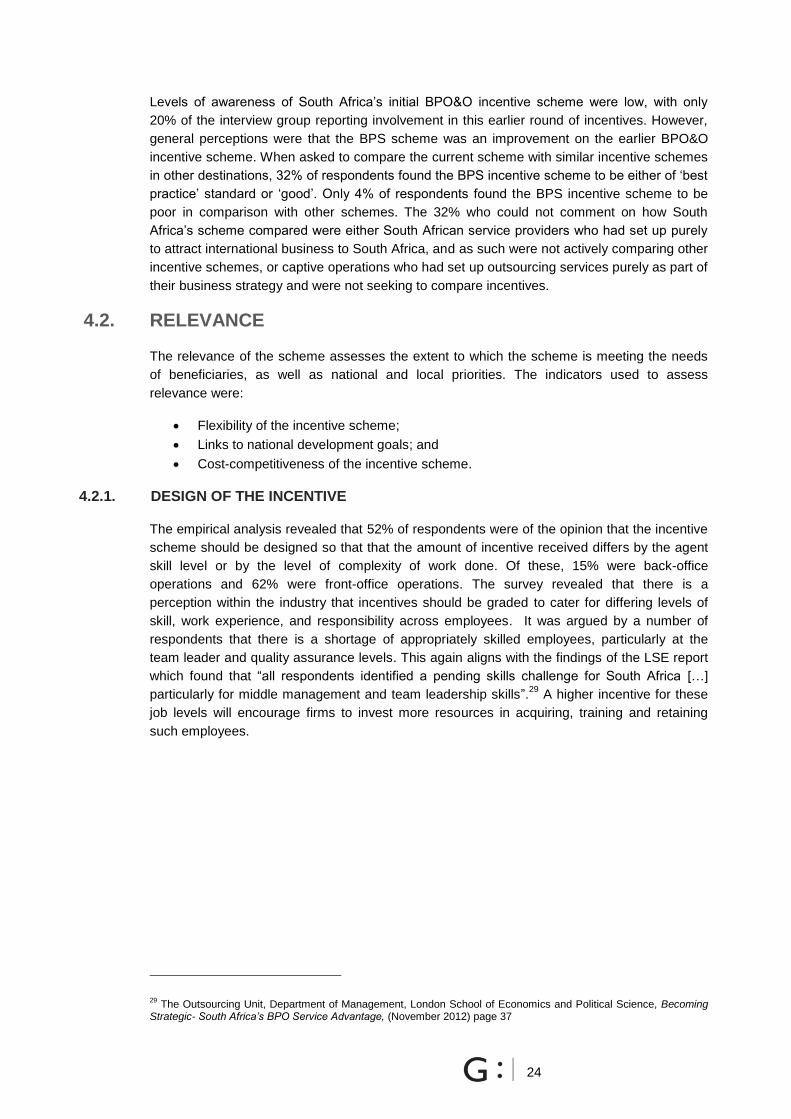
24
Levels of awareness of South Africa‟s initial BPO&O incentive scheme were low, with only
20% of the interview group reporting involvement in this earlier round of incentives. However,
general perceptions were that the BPS scheme was an improvement on the earlier BPO&O
incentive scheme. When asked to compare the current scheme with similar incentive schemes
in other destinations, 32% of respondents found the BPS incentive scheme to be either of „best
practice‟ standard or „good‟. Only 4% of respondents found the BPS incentive scheme to be
poor in comparison with other schemes. The 32% who could not comment on how South
Africa‟s scheme compared were either South African service providers who had set up purely
to attract international business to South Africa, and as such were not actively comparing other
incentive schemes, or captive operations who had set up outsourcing services purely as part of
their business strategy and were not seeking to compare incentives.
4.2. RELEVANCE
The relevance of the scheme assesses the extent to which the scheme is meeting the needs
of beneficiaries, as well as national and local priorities. The indicators used to assess
relevance were:
Flexibility of the incentive scheme;
Links to national development goals; and
Cost-competitiveness of the incentive scheme.
4.2.1. DESIGN OF THE INCENTIVE
The empirical analysis revealed that 52% of respondents were of the opinion that the incentive
scheme should be designed so that that the amount of incentive received differs by the agent
skill level or by the level of complexity of work done. Of these, 15% were back-office
operations and 62% were front-office operations. The survey revealed that there is a
perception within the industry that incentives should be graded to cater for differing levels of
skill, work experience, and responsibility across employees. It was argued by a number of
respondents that there is a shortage of appropriately skilled employees, particularly at the
team leader and quality assurance levels. This again aligns with the findings of the LSE report
which found that “all respondents identified a pending skills challenge for South Africa […]
particularly for middle management and team leadership skills”.29
A higher incentive for these
job levels will encourage firms to invest more resources in acquiring, training and retaining
such employees.
29 The Outsourcing Unit, Department of Management, London School of Economics and Political Science, Becoming
Strategic- South Africa’s BPO Service Advantage, (November 2012) page 37

25
Figure 10: Interviewee responses when asked whether a graded or tiered incentive scheme
should be implemented
Source: Genesis Analytics, 2013
On the other hand, a number of respondents argued that whilst it would be a good extra
offering, grading the incentives is not a necessity and could complicate the claims process and
reduce the efficiency of scheme administration. In addition, one respondent noted that since
the current incentive amount essentially covers the cost of employing an agent and is therefore
already a notable contributing factor to reducing costs, there is no real need to provide higher
incentives for more qualified employees.
One important aspect of South Africa‟s incentive scheme, and probably one of its most
distinguishing features as compared to other incentive schemes, is the duration of the
incentive (three years). Interestingly, 56% of companies interviewed stated that the duration of
the incentive scheme had no real impact on their investment plans. A majority of these (64%)
were service providers who had set up offices in South Africa for the long term. What they did
mention was that while they (as service providers) had set up for the long term, the duration of
the incentive scheme definitely influences the decision-making of the investors that they aim to
attract to South Africa. The remaining 36% of the companies who responded that the duration
did not influence their investment decision were the larger captive operators who stated that
their decision to enter the outsourcing industry was primarily driven by an internal business
strategy, independent of the incentive.
Further structural questions related to whether the incentive scheme accommodated for firms
at various stages of growth, and to what extent the incentive scheme provided scope for
amending projected and actual job creation values. The results of these questions are shown
in Figure 11, Figure 12 and Figure 13. Just less than half (40%) of the respondents stated that
they found the incentive scheme to be poorly suited to the needs of the industry in terms of
flexibility across various segments and stages of growth, while a slightly greater number of
interviewees (48%) were satisfied with the flexibility of the scheme in this regard.
44% 52%
Not applicable
4%
No Yes
15%
62%
23%
Combination of front and back office
Front office
Back office
No. jobs represented: 1761
No. jobs represented: 1793
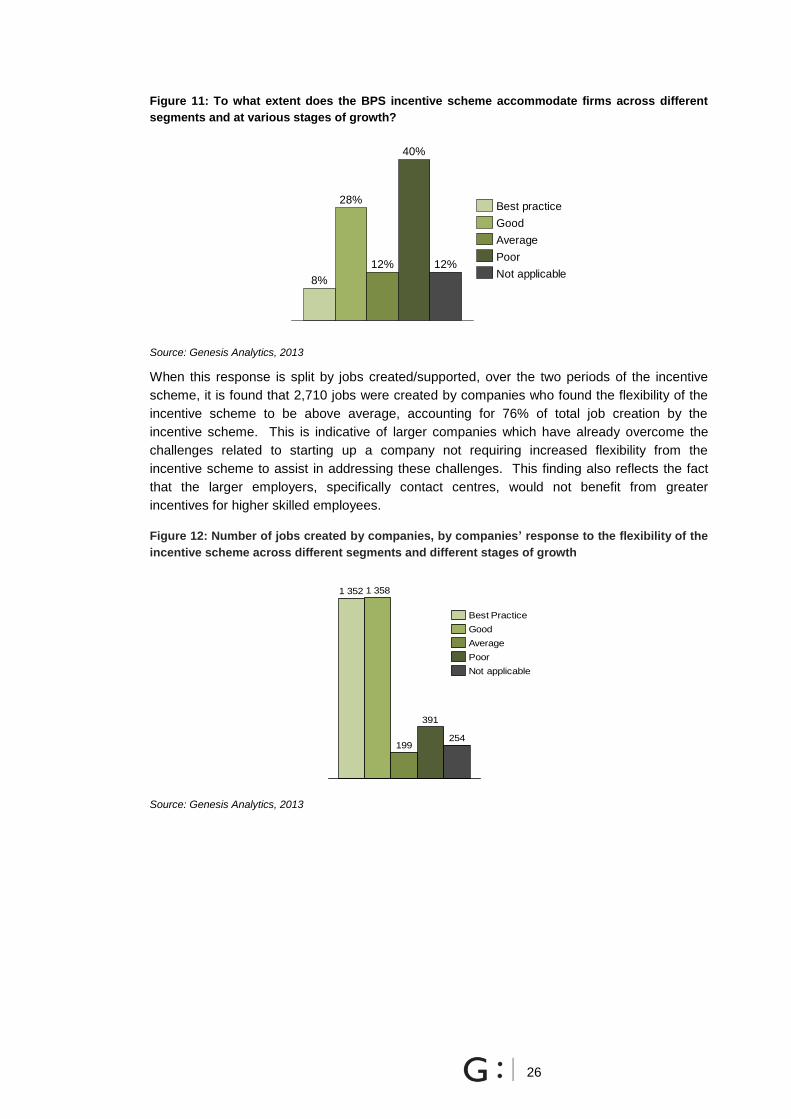
26
Figure 11: To what extent does the BPS incentive scheme accommodate firms across different
segments and at various stages of growth?
Source: Genesis Analytics, 2013
When this response is split by jobs created/supported, over the two periods of the incentive
scheme, it is found that 2,710 jobs were created by companies who found the flexibility of the
incentive scheme to be above average, accounting for 76% of total job creation by the
incentive scheme. This is indicative of larger companies which have already overcome the
challenges related to starting up a company not requiring increased flexibility from the
incentive scheme to assist in addressing these challenges. This finding also reflects the fact
that the larger employers, specifically contact centres, would not benefit from greater
incentives for higher skilled employees.
Figure 12: Number of jobs created by companies, by companies’ response to the flexibility of the
incentive scheme across different segments and different stages of growth
Source: Genesis Analytics, 2013
8%
28%
12%
40%
12%
Best practice
Good
Not applicable
Poor
Average
1 352 1 358
199
391
254
Good
Average
Best Practice
Not applicable
Poor

27
Figure 13: To what extent does the BPS incentive scheme provide flexibility around reviewing
projected and actual outcomes?
Source: Genesis Analytics, 2013
The flexibility of the scheme in terms of reviewing projected and actual job creation values was
an issue on which 24% of respondents could not comment, either because they had not
participated in a claims process in which projections had had to be reviewed, or because there
had to date been no discrepancy between projected and actual values. Of all respondents,
40% found the scheme to be excellent or good at providing flexibility around reviewing
projected and actual outcomes. 32% of participants however, described the scheme as
performing poorly in this area. A key concern which was raised was the perception that in
cases of companies creating more jobs than they had projected, these companies would not
be able to claim corresponding pay-outs for the additional jobs created. This appears to be the
result of miscommunication between companies and the dti, as the provision to claim for
additional jobs created does in fact exist.
Discussions with government officials and industry bodies indicated that the BPS incentive
scheme as it is currently designed is not adequately flexible to account for the high degree of
differentiation across segments and growth stages within the BPS industry, and that improving
this particular aspect of the scheme‟s design is an issue that has been noted for further
investigation.
12%
28%
4%
32%
24%
Best practice
Good
Not applicable
Poor
Average
“The incentive scheme is not flexible enough. This is especially the case for the higher
value-add operations. In the higher value-add operations, it is more difficult to get the
required minimum number of seats." – Government official
“The scheme definitely does not favour start-ups or firms that require specialist or niche skill
sets” – Western Cape based service provider
“The scheme is great if you overestimate your outcomes, as you are not penalised.
However if you exceed your projections you do not benefit, as the incentive payments are
capped. This is not fair and does not incentivise business to aim for maximum
performance” – Western Cape based service provider
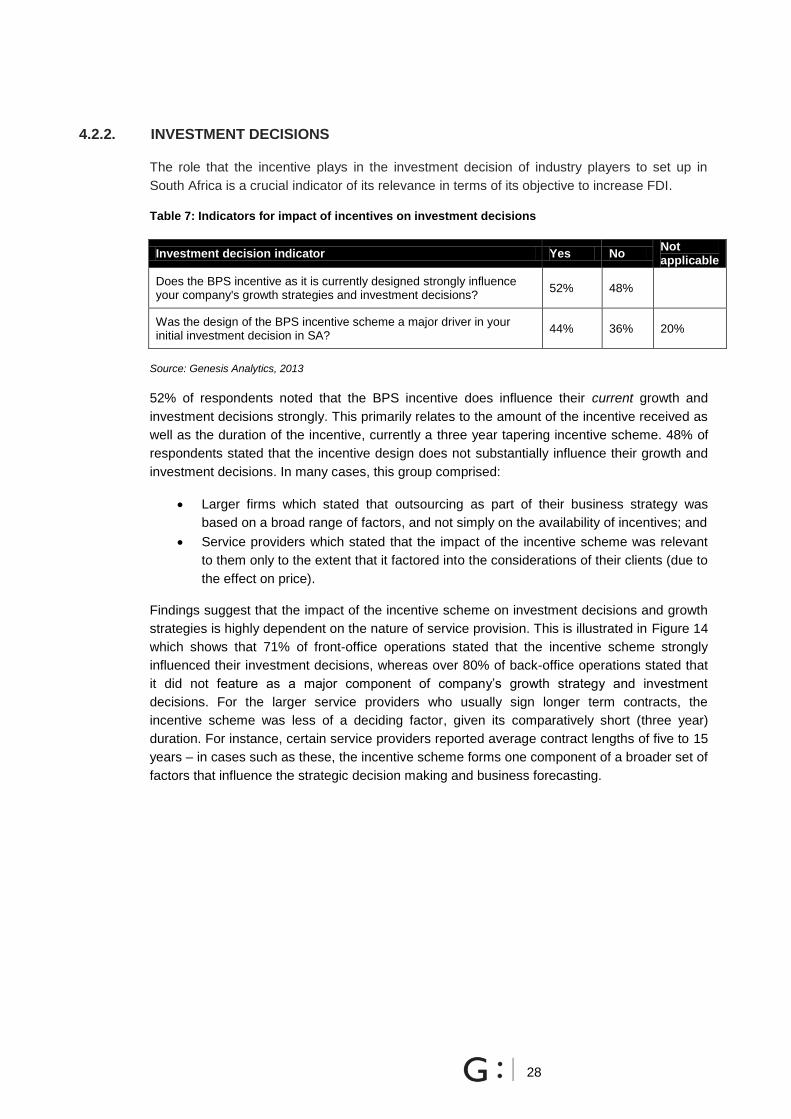
28
4.2.2. INVESTMENT DECISIONS
The role that the incentive plays in the investment decision of industry players to set up in
South Africa is a crucial indicator of its relevance in terms of its objective to increase FDI.
Table 7: Indicators for impact of incentives on investment decisions
Investment decision indicator Yes No Not applicable
Does the BPS incentive as it is currently designed strongly influence your company's growth strategies and investment decisions?
52% 48%
Was the design of the BPS incentive scheme a major driver in your initial investment decision in SA?
44% 36% 20%
Source: Genesis Analytics, 2013
52% of respondents noted that the BPS incentive does influence their current growth and
investment decisions strongly. This primarily relates to the amount of the incentive received as
well as the duration of the incentive, currently a three year tapering incentive scheme. 48% of
respondents stated that the incentive design does not substantially influence their growth and
investment decisions. In many cases, this group comprised:
Larger firms which stated that outsourcing as part of their business strategy was
based on a broad range of factors, and not simply on the availability of incentives; and
Service providers which stated that the impact of the incentive scheme was relevant
to them only to the extent that it factored into the considerations of their clients (due to
the effect on price).
Findings suggest that the impact of the incentive scheme on investment decisions and growth
strategies is highly dependent on the nature of service provision. This is illustrated in Figure 14
which shows that 71% of front-office operations stated that the incentive scheme strongly
influenced their investment decisions, whereas over 80% of back-office operations stated that
it did not feature as a major component of company‟s growth strategy and investment
decisions. For the larger service providers who usually sign longer term contracts, the
incentive scheme was less of a deciding factor, given its comparatively short (three year)
duration. For instance, certain service providers reported average contract lengths of five to 15
years – in cases such as these, the incentive scheme forms one component of a broader set of
factors that influence the strategic decision making and business forecasting.
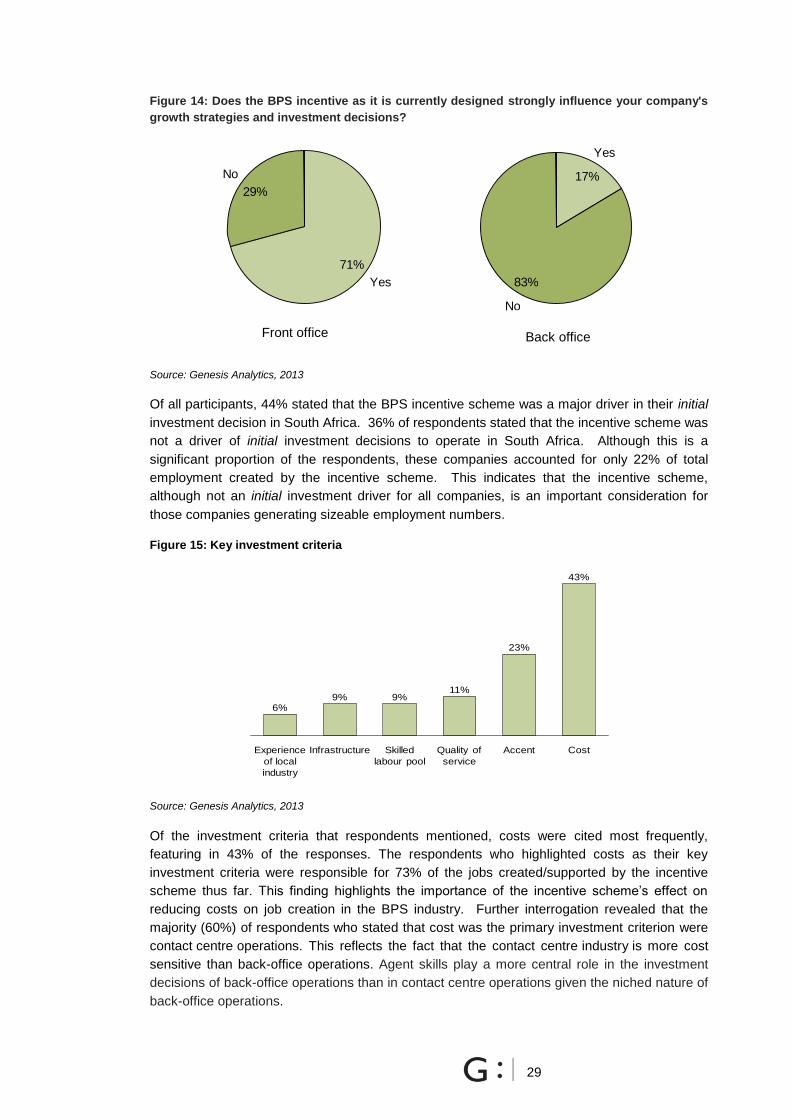
29
Figure 14: Does the BPS incentive as it is currently designed strongly influence your company's
growth strategies and investment decisions?
Source: Genesis Analytics, 2013
Of all participants, 44% stated that the BPS incentive scheme was a major driver in their initial
investment decision in South Africa. 36% of respondents stated that the incentive scheme was
not a driver of initial investment decisions to operate in South Africa. Although this is a
significant proportion of the respondents, these companies accounted for only 22% of total
employment created by the incentive scheme. This indicates that the incentive scheme,
although not an initial investment driver for all companies, is an important consideration for
those companies generating sizeable employment numbers.
Figure 15: Key investment criteria
Source: Genesis Analytics, 2013
Of the investment criteria that respondents mentioned, costs were cited most frequently,
featuring in 43% of the responses. The respondents who highlighted costs as their key
investment criteria were responsible for 73% of the jobs created/supported by the incentive
scheme thus far. This finding highlights the importance of the incentive scheme‟s effect on
reducing costs on job creation in the BPS industry. Further interrogation revealed that the
majority (60%) of respondents who stated that cost was the primary investment criterion were
contact centre operations. This reflects the fact that the contact centre industry is more cost
sensitive than back-office operations. Agent skills play a more central role in the investment
decisions of back-office operations than in contact centre operations given the niched nature of
back-office operations.
29%
No
Yes
71%
17%
Yes
83%
No
Cost
43%
Accent
23%
Quality of
service
11%
Skilled
labour pool
9%
Infrastructure
9%
Experience
of local
industry
6%
Front office Back office

30
The final indicator on investment decisions assessed the impact that an end to the incentive
scheme would have on companies‟ operations and investment in South Africa. 80% of the
contact centre operations stated that if the incentive scheme were to end, it would have a
significant impact on their operations and their decision to continue operating in South Africa.
This group accounted for 86% of the jobs which have been created by the incentive scheme.
The majority of back-office operations stated that the incentive scheme had minimal impact on
their investment decisions. This is again indicative of the competitiveness and cost-driven
nature of contact centre operations.
4.2.3. COST-COMPETITIVENESS
Cost is one of the most important factors in the investment decisions of investors when
selecting a country to set up an outsourced part of their business. South Africa‟s incentive
scheme helps to increase its cost competitiveness, but does not adequately reduce the cost
gap between South Africa and its main tier II competitors. Figure 16 and
Figure 17 show the average incentive for South Africa and its main competitors for contact
centre and financial services.
Figure 16: Average annualized per FTE incentive for contact centre services, 2010, 2012; US$
Source: Everest Group, 2013
2010 2012
1 425
2 700
4 080
1 005
1 590 1 380
1 596
2 636
1 821
979
1 582 1 237
South Africa Egypt Kenya Poland Philippines India
Reduction driven by
removal of subsidy on
telecom costs
“If the scheme were to end, the company would no longer be financially viable and would
probably have to relocate or simply close its doors” – Western Cape based service
provider
“The incentive is not a determinant to invest or not to invest, but rather is an enabler in
terms of growth; without it, we would need to down-scale” – KwaZulu-Natal based service
provider
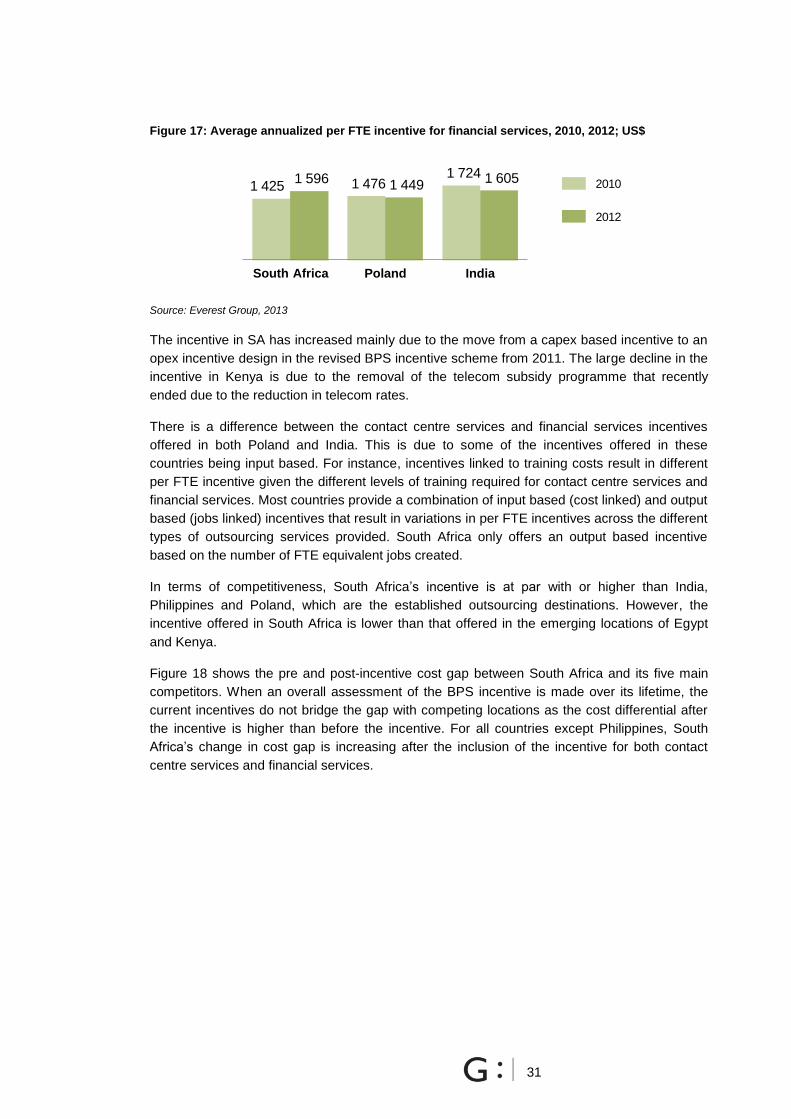
31
Figure 17: Average annualized per FTE incentive for financial services, 2010, 2012; US$
Source: Everest Group, 2013
The incentive in SA has increased mainly due to the move from a capex based incentive to an
opex incentive design in the revised BPS incentive scheme from 2011. The large decline in the
incentive in Kenya is due to the removal of the telecom subsidy programme that recently
ended due to the reduction in telecom rates.
There is a difference between the contact centre services and financial services incentives
offered in both Poland and India. This is due to some of the incentives offered in these
countries being input based. For instance, incentives linked to training costs result in different
per FTE incentive given the different levels of training required for contact centre services and
financial services. Most countries provide a combination of input based (cost linked) and output
based (jobs linked) incentives that result in variations in per FTE incentives across the different
types of outsourcing services provided. South Africa only offers an output based incentive
based on the number of FTE equivalent jobs created.
In terms of competitiveness, South Africa‟s incentive is at par with or higher than India,
Philippines and Poland, which are the established outsourcing destinations. However, the
incentive offered in South Africa is lower than that offered in the emerging locations of Egypt
and Kenya.
Figure 18 shows the pre and post-incentive cost gap between South Africa and its five main
competitors. When an overall assessment of the BPS incentive is made over its lifetime, the
current incentives do not bridge the gap with competing locations as the cost differential after
the incentive is higher than before the incentive. For all countries except Philippines, South
Africa‟s change in cost gap is increasing after the inclusion of the incentive for both contact
centre services and financial services.
2010
2012
1 425 1 476 1 724 1 596 1 449
1 605
South Africa Poland India

32
Figure 18: Pre and Post-incentive cost-gap, 2012
Source: Everest Group, 2013
Despite the fact that the incentives are at par with most countries, they have not contributed to
sustainably reducing the initial cost gap that existed between South Africa and its main
competitors. On the contrary, the cost-gap has increased post incentives in most cases. It is
only the cost gap with Philippines for contact centre services and with Poland for financial
services that remains unchanged post-incentive. This is mainly due to the annual reduction of
the incentives, and the fact that South Africa„s incentives are applicable only for the next three
years as compared to five years in most competitor countries. The Everest Group provided an
analysis of the potential cost competitiveness of the South African offering based on an
incentive scheme that runs for five years rather than the current three year scheme. These
findings are presented in Figure 33 in Annex C and reflect that in this scenario, the cost gap is
reduced with Poland, Philippines and India, and remains on par with Egypt over the five year
period.
What is important to note is that while the incentives have not reduced the cost gap between
South Africa and its closest competitors, it has helped to alleviate in the pressure present in
2010 when South Africa‟s operating costs were even higher. The Everest report found that in
the case of all countries, South Africa‟s cost gap has reduced since 2010 (Figure 19).
Kenya
Philippines
Country
Egypt
Poland
India
Cost gap with South
Africa pre incentive
2012; Percentage
Cost gap with South
Africa post incentive
2012; Percentage
Change in cost
gap
2012
Cost gap with South
Africa pre incentive
2012; Percentage
Cost gap with South
Africa post incentive
2012; Percentage
Change in cost
gap
2012
Contact Centre Services Financial Services
74-78%
18-22%
60-65%
22-26%
%-(15-20)% %-(8-12)%
%95-100%
60-65%
10-15%
55-60%
20-25%
%-(10-15)%
85-90%
-(5-10)%

33
Figure 19: Reduction in cost gap from 2010 - 2012
Source: Everest Group, 2013
Qualitative analysis found that there was an equal split in the company category between
those who felt that the incentive helped bridge the cost gap sufficiently to make operations
more competitive, and those that did not. The majority of government officials however, stated
that they believed the incentive scheme to be a major contributor to reducing the cost of
operations for all firms in the BPS industry.
4.2.4. LINKS TO NATIONAL DEVELOPMENTAL OBJECTIVES
The objectives of the BPS incentive scheme align with broader national objectives to attract
FDI and create sustainable employment. The creation of sustainable employment as it relates
to the BPS incentive scheme is dependent first on the creation of employment and second, on
the existence of effective linkages to skills development initiatives. A key finding of this study is
that for the incentive scheme to actively contribute to these national development goals, the
incentives will need to move beyond a focus on the creation of jobs, and toward a focus on the
creation of sustainable jobs that incorporate skills development and increase the upward
mobility potential of employees.
Only 24% of companies stated that their employment strategy was strongly geared towards
employing employment equity individuals. Many respondents stated that their employment
decisions were primarily based on the specific skills demands of their company, and that
employment equity considerations played only a secondary role in their hiring choices.30
Given
the profile of unemployed individuals who are likely to take up jobs in this sector, there is a
natural absorption of historically disadvantaged South Africans (HDSAs) into employment in
the firms taking part in the scheme, and as such the incentive scheme is already placed in an
30 Some companies prefer to hire expatriates or foreign nationals due to specific requirements for their business,
usually specific language skills
Kenya
Philippines
21-23
Country
Egypt
Poland
India
25-27
20-22
24-26
Cost gap with
South Africa post
incentive
2010; Percentage
20-22
24-26
19-21
23-25
Cost gap with
South Africa post
incentive
2012; Percentage
74-78%
18-22%
60-65%
22-26%
94-98%
35-40%
70-75%
-(10-15)%
58-62%
Change in
cost gap
2010-2012
CC
Primarily on account of
appreciating currency
Primarily on account of
reduction in telecom subsidy
-(10-15)%-(15-20)% -(15-20)%
F&A
Cost gap with
South Africa post
incentive
2010; Percentage
Cost gap with
South Africa post
incentive
2012; Percentage
Change in
cost gap
2010-2012
-(6-10)% -(6-12)%
105-110% 95-100%

34
industry inadvertently contributing to the national development goal of employment equity and
inclusion. What is more relevant than the mere absorption of HDSAs however, is the extent to
which the labour pool is equipped with sustainable and transferable skills.
4.3. ACHIEVEMENT
The analysis here looks at how well the incentive scheme is doing in meeting its targets and
objectives. The indicators assessed are:
FDI and job creation;
Perceptions of the incentive scheme; and
Perceptions of the BPS industry.
4.3.1. JOBS CREATION OBJECTIVE
While job creation projections are provided by companies for the three years of their
participation in the incentive scheme programme, actual job figures are available up to 31 Dec
2012. Our analysis of jobs created is for the period of January 2011 to December 2012.31
This
relates to the full period of year 1 of the incentive scheme, and the first 9 months of year 2. The
analysis of jobs created is based on quantitative data provided by the dti.
Number of jobs created
Figure 20 below shows the breakdown of actual jobs created over the two financial years in
which the BPS incentive scheme has operated. In the 2011/2012 year, 20 projects were
approved on the scheme, creating 2,557 jobs. In the 2012/2013 year, the number of projects
on the scheme grew by 60% to 32. The number of jobs created however only grew by 48% to
3,807. Of the 1,230 new jobs claimed for on the scheme in 2012/2013, 464 (38%) of these
were created by the 12 new projects on the scheme. The remainder of new jobs were from
firms already on the scheme which expanded their operations.
31 Although the incentive scheme officially began in April 2011, firms could claim for jobs created between January –
April 2011.

35
Figure 20: Jobs created per financial year
Attaining a consistent definition of a job remains a challenge not only in the BPS industry, but
across the South African economy as a whole. The FTE definition is applied formally by only
36% of respondents, while the remaining 64% are unsure of any clear definition. Whilst only
36% of respondents actively use the FTE definition – a 40 hour week where lunch breaks are
excluded from the payroll – the majority of respondents agree with this definition and informally
adhere to it so as to maintain consistency with the dti. Consequently, in this industry, the FTE
definition is an appropriate definition for a job, however, it must be noted that an FTE job
created does not necessarily correspond to an additional person in the workplace.
Jobs created vs. dti target
Although the core objective of the incentive scheme is to contribute to job creation, there is no
defined target for the number of jobs that the incentive scheme is expected to create/support.32
The scheme‟s administration team receives a yearly budget aligned to the dti‟s Medium Term
Expenditure Framework (MTEF) approved by the National Treasury. This budget is then used,
with reference to the maximum incentive allowance per FTE job of R40, 000, to determine
what can be termed the „maximum allocation‟ of jobs that can be supported annually. This then
serves as the informal benchmark or „target‟ for the number of jobs to be created by the
scheme in that particular year. It is however, possible for the administrative team to apply for
further funding should the number of jobs created exceed the allocated budget. For the
2011/2012 period, the MTEF budget for the BPS incentive scheme was R143 million, was
which was increased to R209 million for the 2012/2013 period. Hence, the „maximum
allocation‟ of jobs contained implicitly within the set MTEF budget was 3,557 jobs for the
2011/2012 period and 5,225 jobs for the 2012/2013 period.
The figure below compares these maximum allocations to the actual number of jobs created or
sustained since the inception of the revised incentive scheme. The 2012/2013 allowance of
32 The term „supported‟ is included because a number of firms, particularly captive operators who are in the industry
purely for the business rationale, would have still created these jobs, however the incentive scheme does support the existence of these jobs

36
jobs includes both jobs sustained in the 2011/2012 period, as well as net growth in jobs in
2012/2013.
Figure 21: Maximum allowance of jobs and actual jobs created
Source: Genesis Analytics, 2013 adapted from dti data
The incentive scheme paid out 72% of the potential allocation budget in 2011/2012, covering
2,577 jobs.33
Given that the data on actual jobs is only available up to December 2012, the
figure above compares this figure with the corresponding prorated maximum MTEF allocation
as at December 2012 (4,563).34
As at December 2012, the incentive scheme has supported
3,807 jobs (cumulatively), this translates into expenditure of 83% of its potential maximum job-
allocation for that period.
Jobs created vs. companies projections
Figure 21 compares the number of actual jobs created with the projections made by
companies when submitting their application forms and as such reflects the performance of
companies on the scheme in relation to initial expectations.
33 There were a further 692 jobs paid for under the incentive scheme budget for this period, but these jobs were
created by firms on the previous BPO&O scheme, and so have not been included here. 34
This figure was arrived at by multiplying 5225 by 0.75 to account for the 9 months of this period.

37
Figure 22: Companies’ job projections and actual job creation
Source: Genesis Analytics, 2013 adapted from dti data
In both years, the actual number of jobs was substantially less than that which was projected
by companies on the scheme in their applications. The number of actual jobs
created/sustained is 33% of the total projected jobs up to March 2013. Job creation projections
exceed the number of actual jobs created by over 300%.
The disparity between numbers of actual and projected jobs created has been attributed to a
number of factors. Firstly, it is possible that many companies have been optimistic in their
growth projections and have underestimated the difficulties in setting up in the BPS industry.
Secondly, it is possible that companies have over projected to ensure that they are approved
for a greater incentive amount which would compensate for unexpected additional job creation.
Discussion with the dti indicates that allowances do exist for those instances in which firms
create more jobs than projected, which implies a miscommunication between the dti and
companies regarding the protocol for these instances. The dti allows for adjustment of
projections after each claim period, so that where necessary firms have an opportunity to
provide more realistic projections.
4.3.2. FDI ATTRACTION OBJECTIVE
There is also no target set for the amount of FDI to be generated by the scheme. This makes it
impossible to analyse whether the FDI that has been attracted is more or less than what was
expected at the onset of the scheme.
Projected investment figures are supplied by companies in the application phase, and actual
figures for investment and expenditure are reported by companies when submitting their claim
forms. The reported investment figures are not audited and as such are taken as estimates for
the purposes of this report. The projected investment value for 2011/2012 was approximately
3 807
2 577
11 597
0
1 000
2 000
3 000
4 000
5 000
6 000
7 000
8 000
9 000
10 000
11 000
12 000
2012/20132011/2012
4 660
Actual jobs created
Companies‟ projections

38
R998 million for the first year and approximately an additional R1.8 billion in the second year.
This investment is primarily composed of operational expenditure (accounting for over 85% of
total expenditure for both years), which mainly consists of rent expenditure, salary bill and
telecoms costs. The high proportion of operations expenditure validates the decision to shift
from the previous BPO&O capex-based incentive to the current BPS opex incentive, but
suggests that it is inappropriate to describe this figure as FDI in its strict form.35
A number of
service providers and South African captives also serve the domestic market. It is likely, given
the complexity of separating electricity and telecoms costs which are incurred for the entire
business, that in these cases, domestic costs are included in the reporting of expenses to the
dti. While the dti does encourage companies to “ring-fence” the expenditure that relates to
their offshore business, it cannot in the absence of any form of auditing, be confirmed whether
this occurs in practice.
Table 8: Projected investment for 2011/2012 and 2012/2013
Type of expenditure
2011/2012 2012/2013
Projected
amount
Percentage of
total
Projected
amount
Percentage of
total
Land/buildings R 13,561,000 1.37% R88,558,770 4.93%
Other assets R 101,165,332 10.23% R159,402,262 8.86%
Operational expenditure R 874,126,020 88.40% R1,550,159,083 86.21%
Total R 988,852,352 100% R1,798,120,115 100%
Source: Adapted from dti data
Figure 23 shows the projected investment figures compared with reported investment, as
provided by firms in their claim submissions. In general there is a close alignment between
projected and reported investment figures. For the 2011/2012 year, reported investment was
78% of the projected amount, while in the 2012/2013 period reported investment exceeded
projections by 12.4%.
35 Foreign direct investments are the net inflows of investment to acquire a lasting management interest in an
enterprise operating in an economy other than that of the investor. It is the sum of equity capital, reinvestment of earnings, other long-term capital, and short-term capital.

39
Figure 23: Estimated projected and actual investment figures, R million
4.3.3. PERCEPTIONS OF THE INCENTIVE SCHEME
Apart from assessing the incentive scheme‟s achievement of its core objectives, qualitative
research aimed to identify what participants felt were the main strengths and weaknesses of
the incentive scheme.
Figure 24: Weaknesses of the BPS incentive
Source: Genesis Analytics, 2013
The objective in this case was to find out how the incentive scheme contributed to certain key
aspects of the outsourcing industry in South Africa. Over 64% of respondents felt that the
strength of the incentive scheme was in its impact on reducing the cost of operations. This is in
line with the core objective of the incentive scheme, which is to reduce the cost gap between
South Africa and its competitors. Figure 24 presents the main weaknesses identified by
participants related to the BPS incentive scheme. 36% of respondents noted that the incentive
scheme does not adequately deal with the shortage of skilled agents. The scheme incentivises
firms to employ agents but not to train them and/or to increase their skill levels. 12% of
respondents noted that the scheme does not adequately reduce their cost of operations. About
770
988
Projected investment
2011-2012
Actual investment
2011-2012
Projected investment
2012-2013
Actual investment
2012-2013
1,798
2,021
The majority of other responses included: Lack of flexibility and differential, 3 year duration is too short, and the lack of communication about the scheme‟s future
Majority of these responses are from companies who have not been on the incentive scheme for long enough to recognise these challenges
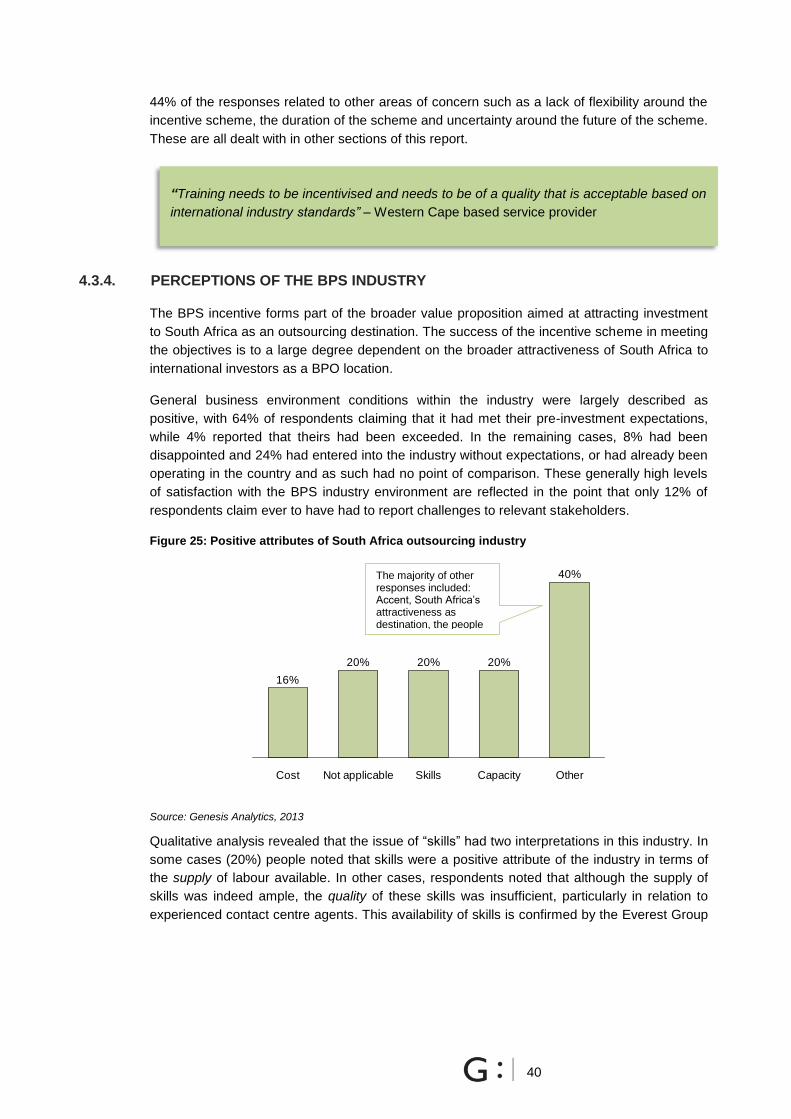
40
44% of the responses related to other areas of concern such as a lack of flexibility around the
incentive scheme, the duration of the scheme and uncertainty around the future of the scheme.
These are all dealt with in other sections of this report.
4.3.4. PERCEPTIONS OF THE BPS INDUSTRY
The BPS incentive forms part of the broader value proposition aimed at attracting investment
to South Africa as an outsourcing destination. The success of the incentive scheme in meeting
the objectives is to a large degree dependent on the broader attractiveness of South Africa to
international investors as a BPO location.
General business environment conditions within the industry were largely described as
positive, with 64% of respondents claiming that it had met their pre-investment expectations,
while 4% reported that theirs had been exceeded. In the remaining cases, 8% had been
disappointed and 24% had entered into the industry without expectations, or had already been
operating in the country and as such had no point of comparison. These generally high levels
of satisfaction with the BPS industry environment are reflected in the point that only 12% of
respondents claim ever to have had to report challenges to relevant stakeholders.
Figure 25: Positive attributes of South Africa outsourcing industry
Source: Genesis Analytics, 2013
Qualitative analysis revealed that the issue of “skills” had two interpretations in this industry. In
some cases (20%) people noted that skills were a positive attribute of the industry in terms of
the supply of labour available. In other cases, respondents noted that although the supply of
skills was indeed ample, the quality of these skills was insufficient, particularly in relation to
experienced contact centre agents. This availability of skills is confirmed by the Everest Group
Cost Not applicable
16%
20%
Other
20%
Skills
20%
40%
Capacity
“Training needs to be incentivised and needs to be of a quality that is acceptable based on
international industry standards” – Western Cape based service provider
The majority of other responses included: Accent, South Africa‟s attractiveness as destination, the people and their work ethic
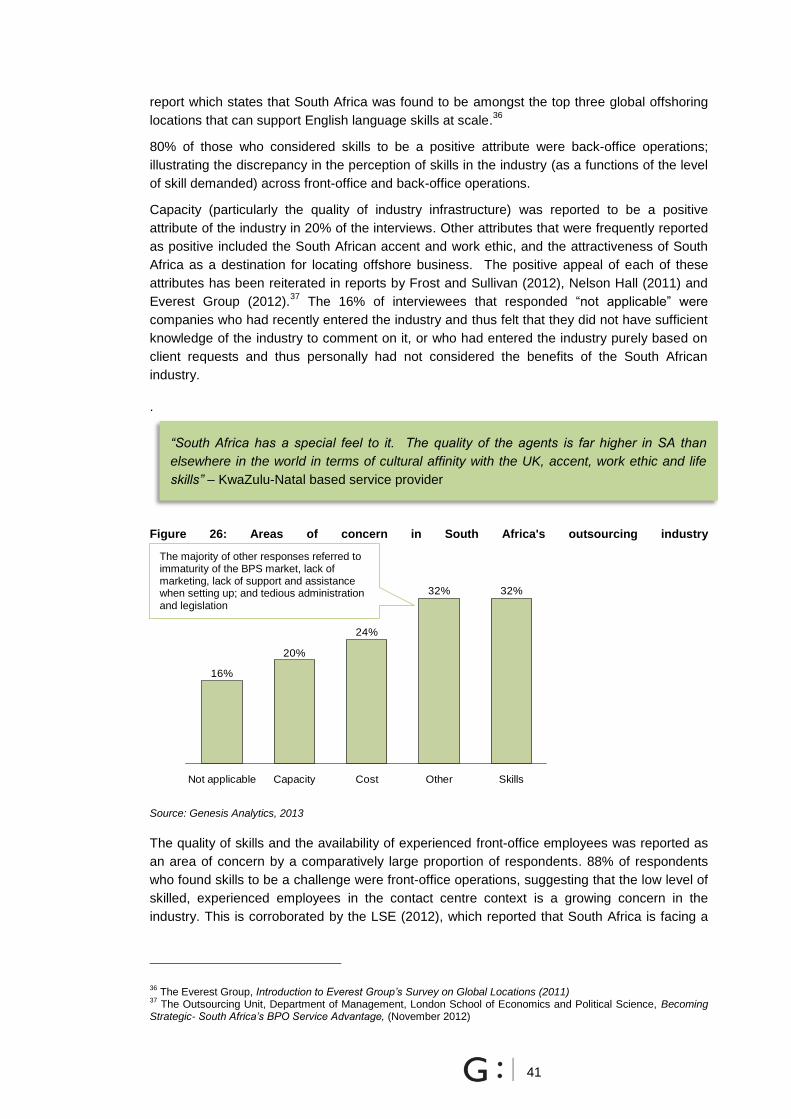
41
report which states that South Africa was found to be amongst the top three global offshoring
locations that can support English language skills at scale.36
80% of those who considered skills to be a positive attribute were back-office operations;
illustrating the discrepancy in the perception of skills in the industry (as a functions of the level
of skill demanded) across front-office and back-office operations.
Capacity (particularly the quality of industry infrastructure) was reported to be a positive
attribute of the industry in 20% of the interviews. Other attributes that were frequently reported
as positive included the South African accent and work ethic, and the attractiveness of South
Africa as a destination for locating offshore business. The positive appeal of each of these
attributes has been reiterated in reports by Frost and Sullivan (2012), Nelson Hall (2011) and
Everest Group (2012).37
The 16% of interviewees that responded “not applicable” were
companies who had recently entered the industry and thus felt that they did not have sufficient
knowledge of the industry to comment on it, or who had entered the industry purely based on
client requests and thus personally had not considered the benefits of the South African
industry.
.
Figure 26: Areas of concern in South Africa's outsourcing industry
Source: Genesis Analytics, 2013
The quality of skills and the availability of experienced front-office employees was reported as
an area of concern by a comparatively large proportion of respondents. 88% of respondents
who found skills to be a challenge were front-office operations, suggesting that the low level of
skilled, experienced employees in the contact centre context is a growing concern in the
industry. This is corroborated by the LSE (2012), which reported that South Africa is facing a
36 The Everest Group, Introduction to Everest Group’s Survey on Global Locations (2011)
37 The Outsourcing Unit, Department of Management, London School of Economics and Political Science, Becoming
Strategic- South Africa’s BPO Service Advantage, (November 2012)
“South Africa has a special feel to it. The quality of the agents is far higher in SA than
elsewhere in the world in terms of cultural affinity with the UK, accent, work ethic and life
skills” – KwaZulu-Natal based service provider
The majority of other responses referred to immaturity of the BPS market, lack of marketing, lack of support and assistance when setting up; and tedious administration and legislation
16%
Cost
24%
32%
20%
32%
Not applicable Capacity Other Skills

42
skills challenge, particularly in the area of middle management and team leadership skills.38
In
cases where capacity was reported to be a concern, this was more often than not related to
the cost of telecoms – which remains relatively high compared to other offshoring destinations.
Concerns around costs in the industry relate predominantly to the high costs of labour and the
high cost of transition into the industry.
4.3.5. INCENTIVE TAKE-UP
As reported by dti officials, job creation as attributed to the scheme has not been as rapid as
initially expected. This has been attributed to the initial over-projection of job creation numbers
by companies. The pay-out of incentives for jobs created has therefore not reached the
maximum budget allocation in each year. Based on the data from the dti, R70,306,600 was
paid out in 2011/2012 and R149,372,134 was paid out in 2012/2013.39
The second period of
the incentive scheme reflects a larger component of the allocated budget being disbursed. The
percentage of funds disbursed over the total period cannot be calculated as the disbursement
value will increase for the 2012/2013 year as there are disbursements still to be made.40
This
is shown in Table 9 below.
Table 9: BPS incentive scheme budget
Incentive scheme budget 2011/2012 2012/2013
Budget allocated R 143 000 000 R 209 000 000
Funds Disbursed R 70 306 600 R 149 372 134
Source: Genesis Analytics, 2013 , based on information from the dti
The lower level of disbursement of funds in relation to the budgeted amount does not reflect a
lack of efficiency on the part of the incentive scheme‟s administrative team. Almost all of the
complete applications that the dti receives are processed and approved, with exceptions
existing in the case of incomplete applications. Under-expenditure of the allocated budget
merely reflects the fact that there exists greater scope for firms to join the scheme than
anticipated, and suggests the potential need for increased and/or varied promotion of the
scheme.
4.4. SUSTAINABILITY
The analysis here interrogates whether or not the benefits reaped as a result of the incentive
scheme are likely to continue after the incentive scheme ends. The indicators assessed are:
The skills pool
The future of the incentive scheme
BPS industry sustainability
4.4.1. THE SKILLS POOL
A central issue facing the longer term viability of the outsourcing industry in South Africa is the
diminishing pool of skils.
38 The Outsourcing Unit, Department of Management, London School of Economics and Political Science, Becoming
Strategic- South Africa’s BPO Service Advantage, (November 2012) 39
Three of the companies who have had claims paid out were not included in this data. 40
Although the original budget request for the programme was approximately R750 million, annual budget provisions as per the MTEF have resulted in a different total budget for the scheme.

43
Figure 27: Perceptions on the quality of the skills pool
Source: Genesis Analytics, 2013
36% of companies felt that the current skills pool is insufficient to sustain future growth of the
industry. Another 36% felt that the skills pool could be described as „average‟ in relation to the
current demand for agents, and noted that as the industry grows, should the skilled labour not
increase rapidly, the level of skills will be unsustainable to meet the industry‟s demands.
Particular concerns exist in relation to the insufficient supply of skilled team leaders and quality
assessors. 24% of respondents felt that the current skills pool is sustainable; with 67% of these
representing higher skilled functions such as KPO and LPO operations. This reiterates the
disparity in skills availability which exists between niche segments and front-office segments.
Although not part of the scope of the research, the Monyetla Work Readiness Programme™
was briefly discussed by interviewees, given its relevance to the issue of skills development.
What emerged from the brief interaction on this topic was that the Monyetla Work Readiness
Programme™ cannot, in isolation, address the skills shortages in South Africa‟s BPS industry.
Additional measures are needed to address this shortage, especially in relation to the higher
level skills and training needed to deepen SA‟s BPS offering.
A number of government officials and industry bodies confirmed the need for improved skills in
order to maintain a sustainable industry. This need was discussed in relation to the skilled
team leaders and quality assessors. Interviews suggest was that if this issue is not addressed,
the high levels of poaching and churn in the industry will remain. Various officials stated that
the industry would be able to operate sustainably only if the skills shortages are effectively
addressed.
4.4.2. THE FUTURE OF THE INCENTIVE SCHEME
There is a lot of uncertainty around the future of the incentive scheme. The current incentive
programme is scheduled to end in the 2014/2015 financial year. 100% of respondents reported
that they had received no communication from the government regarding the future of the
incentive scheme. This has led to increasing uncertainty around the future of the incentive
36%
Average
36%
Good
12%
Not
applicable
12%
4%
PoorBest
practice
“The issue of skilled labour scarcity is a growing concern and is one of the major drivers of
increasing operational costs” – Western Cape based service provider
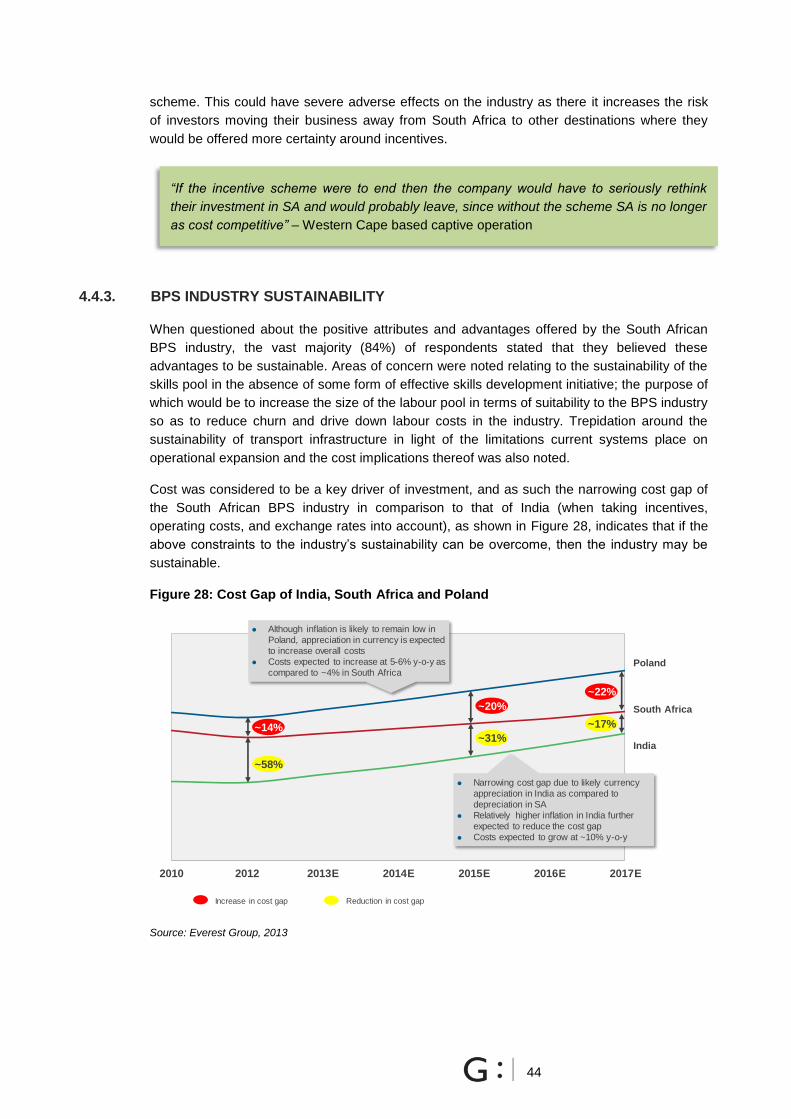
44
scheme. This could have severe adverse effects on the industry as there it increases the risk
of investors moving their business away from South Africa to other destinations where they
would be offered more certainty around incentives.
4.4.3. BPS INDUSTRY SUSTAINABILITY
When questioned about the positive attributes and advantages offered by the South African
BPS industry, the vast majority (84%) of respondents stated that they believed these
advantages to be sustainable. Areas of concern were noted relating to the sustainability of the
skills pool in the absence of some form of effective skills development initiative; the purpose of
which would be to increase the size of the labour pool in terms of suitability to the BPS industry
so as to reduce churn and drive down labour costs in the industry. Trepidation around the
sustainability of transport infrastructure in light of the limitations current systems place on
operational expansion and the cost implications thereof was also noted.
Cost was considered to be a key driver of investment, and as such the narrowing cost gap of
the South African BPS industry in comparison to that of India (when taking incentives,
operating costs, and exchange rates into account), as shown in Figure 28, indicates that if the
above constraints to the industry‟s sustainability can be overcome, then the industry may be
sustainable.
Figure 28: Cost Gap of India, South Africa and Poland
Source: Everest Group, 2013
South Africa
India
2010 2012 2013E 2014E 2015E 2016E 2017E
Poland
Increase in cost gap Reduction in cost gap
~22%
~20%
~17%
~31%
Narrowing cost gap due to likely currency
appreciation in India as compared to
depreciation in SA
Relatively higher inflation in India further
expected to reduce the cost gap
Costs expected to grow at ~10% y-o-y
Although inflation is likely to remain low in
Poland, appreciation in currency is expected
to increase overall costs
Costs expected to increase at 5-6% y-o-y as
compared to ~4% in South Africa
~14%
~58%
“If the incentive scheme were to end then the company would have to seriously rethink
their investment in SA and would probably leave, since without the scheme SA is no longer
as cost competitive” – Western Cape based captive operation

45
4.5. ADDITIONALITY
Additionality assesses the extent to which the incentive has created sustainable employment
rather than once-off jobs.
4.5.1. SUSTAINABLE EMPLOYMENT
The issue of sustainable employment assesses the extent to which the jobs created by the
projects on the scheme long-term and sustainable rather than short term or once-off jobs. The
majority (76%) of the projects on the scheme are based on contracts which exceed 12 months
in duration (Figure 29), suggesting guaranteed employment for workers for at least one year.
Longer term contracts also increase the probability of upward mobility of employees since
agents who are familiar with a particular client service and excel in their performance can more
easily be promoted to Team Leader and Quality Assessor roles on those projects than
inexperienced employees.
Figure 29: Percentage of job contracts, of those qualifying for the BPS incentive, which are for
longer than 12 months
Source: Genesis Analytics, 2013
Related to the issue of longer term employment generation is the rate of attrition. 40% of firms
reported attrition rates of 20% or less. The same number of firms however, report attrition
rates of between 20% and 60%. Attrition rates are relatively similar across regions, but higher
rates of attrition (between 20% and 60%) are reported to exist amongst front-office service
providers (Figure 30).
16%
76%
4%
0%
0%
4% 0% to 20%
20% to 40%
40% to 60%
60% to 80%
80% to 100%
Not applicable

46
Figure 30: Annual attrition rates
Source: Genesis Analytics, 2013
Less than one-fifth (16%) of companies interviewed stated that they did not intend to continue
operations of their respective currently incentivised project(s) beyond the approved incentive
period (Figure 31). The majority of those who stated that their current projects would continue
had either signed long term contracts already or were captive operations that were set up for
reasons that were unrelated to the incentive scheme. Another 20% of respondents were either
unsure of the future of these projects or described the issue of future planning as inapplicable
to their project. This particular portion of responses may reflect the uncertainty associated with
service providers who merely facilitate the implementation of these projects and are not
involved in the design thereof, and/or representatives of short-term projects scheduled to end
at the same time or before the end of the incentive scheme period. 90% of the all the jobs
created by the incentive scheme are represented by employers who would continue their
operations post the incentive scheme period, indicating that the scheme is contributing to the
generation of sustainable employment. Many of these companies, however, stated that
although they would continue with their operations, these may have to be downsized.
Figure 31: Responses regarding the planned continuation of currently incentivised projects
beyond the incentive period
Source: Genesis Analytics, 2013
4%
12%
20%
40%
20%
0% 4%
Not applicable
I don‟t know
0% to 20%
20% to 40%
40% to 60%
60% to 80%
80% to 100%
64%
16%
4%
16%
I don‟t know
Not applicable
No
Yes

47
5. ANALYSIS AND RECOMMENDATIONS
A number of central themes emerged consistently through our analysis and engagement with
stakeholders. These themes are analysed with reference to the core evaluation questions
posed in the TOR. As indicated in earlier sections of the report, a number of these questions
deal specifically with the BPS incentive scheme whilst three questions have a broader scope in
relation to the BPS industry as a whole.
The analysis first looks at the BPS incentive scheme specifically, before addressing the
broader industry questions. For the incentive scheme-specific analysis, the four related
questions are answered individually, whilst the three questions relating to the broader industry
are assessed together. In each instance recommendations are provided on how the emerging
analysis can be used to improve either the performance and impact of the incentive scheme,
or the functioning of the industry, respectively.
5.1. BPS INCENTIVE SCHEME ANALYSIS
5.1.1. ARE THE OBJECTIVES OF THE PROGRAMME BEING ACHIEVED?
The incentive scheme does not have a job creation target per se. Instead, the maximum
number of jobs to be supported per year is determined by the budget allocated for the
scheme in alignment with the MTEF. It is a major drawback that a system designed to
contribute to job creation has no defined job creation target that it is supposed to achieve.
Assessing the performance of the BPS incentive scheme is therefore limited to a comparison
of jobs created in relation to the maximum allocation from the MTEF budget. The MTEF budget
is not allocated in a forward looking manner based on how many jobs the scheme should
ideally aim to create, but is instead primarily based on the historical performance of the
scheme in spending its prior financial allocation(s). Given that the scheme has never fully
utilised its budget allocations, an increasingly restrictive budget is provided to the scheme
annually. This constrains the ambition and potential impact of the incentive scheme in relation
to its job creation potential. A tangible job creation target rather than annual MTEF budget
allocations is essential to the development of a clear understanding of the success of the
scheme. This would also allow for better strategic planning, budgeting and improved
operational and promotional processes.
Assessed in relation to the scheme‟s budget-based planning methodology, the dti has to date
performed reasonably well in its job creation figures. As at December 2012, the incentive has
paid-out 83% of the potential maximum allocation. However, this figure may be well short of
what might have been possible if the scheme‟s managers had been driven by a target.
However, this cannot be accurately ascertained based on the results of this study.
Companies’ job creation projections are significantly higher than actual jobs created.
After two years, the BPS incentive scheme has created/supported an average of 3,807 jobs (it
is this figure that disbursements are based on). This represents 33% of companies‟ job
projections. Of the 20 projects on the scheme in the 2011/2012 period, only three met or
exceeded their projections. 11 of the projects (55%) failed to create even half of the jobs they
had projected. Whilst the job projection figures are revised on a yearly basis to reflect actual
job creation trends, it is expected that firms in the industry should be better able to predict the
number of jobs they are likely to create at the outset of their project. A number of factors may
be responsible for the much lower actual numbers, not least of which being the impact of
undesirable economic conditions over the last few years. However it is most likely that many
48
companies are significantly over-projecting the number of jobs they are likely to create when
they submit their application forms as a result of the perception of many firms that they will not
be able to claim for extra jobs should they exceed their target. The fact that this perception is
inaccurate, as confirmed by the dti, suggests that there is a need for better communication of
scheme operations to firms.
The dti team administering the scheme has little influence on the companies‟ ability to meet
their targets. However it should still be a relevant issue to the dti that actual jobs are
significantly behind companies‟ projections. Furthermore, the companies‟ projections have
been included in public documents by the dti as the likely number of jobs to be created by the
incentive scheme. An official publication of the dti in 2011 reports that an “estimated 15,868
jobs are likely to be supported” by the incentive scheme over its lifetime.41
While the document
notes that this figure is based on projections by companies, it still provides an inaccurate,
reflection of the likely number of jobs to be created by the scheme. Official references to
companies‟ projections as an indication of the scheme‟s likely performance without clearly
conditioning the basis for these projections are misleading and should be avoided.
No specific target has been set for FDI. A core objective of the scheme is to attract FDI,
however no policy target has been set in relation to how much FDI is expected to be attracted
through the incentive scheme. Since the introduction of the incentive scheme, an estimated
R2.8 billion of investment has been made by companies on the scheme. Whilst this is a
notable amount of investment, it is difficult to assess whether it is in line with the expectations
of government given the lack of a target. No assessment can be made therefore as to whether
the amount of FDI being attracted by the incentive scheme is better, worse or in line with
expectations. It also reduces the basis for an effective performance monitoring and
management system for the scheme‟s managers.
The incentive scheme is not adequately defining or measuring the achievement of its
objectives. The current system by which the job creation and FDI figures are defined and
measured needs to be improved. Interactions with firms indicated that whilst in most cases
firms did not dispute the incentive amount paid, many firms did not have a good grasp of how
their payment was calculated. The calculation process used to arrive at the final job figures has
not been shared with firms.
Importantly, the job creation data collected does not stipulate the skill level of the jobs that are
projected or created. There is thus no means of assessing the different skill level of jobs
created i.e. how many agent, team leader or quality assessor jobs have been created as a
result of the scheme. This is a limitation which undermines the relevance and ability of the
scheme to deepen the skill base of South Africa‟s BPS sector, and needs to be addressed.
The investment data provided by firms in the claim forms includes their total investment for the
claim period. The investment numbers can however only be taken as indicative since they
have not been audited. Also, investment numbers provided include operational expenditure
such as salaries and wages, telecoms costs, electricity costs and other running costs.
Moreover, the investment figures assembled are inconsistently recorded: they are recorded by
some companies cumulatively since the start of the incentive period, whilst other firms record
their actual investment for each claim period. These inconsistencies in the recording standards
41 “An overview of the dti incentive programmes”- Presentation to the Select Committee on Trade and Relations,
August 2011. the dti.

49
make it difficult to get an accurate estimate of the amount of FDI that is associated with the
scheme.
Recommendations:
A more rigorous target needs to be set for jobs to be created and FDI attracted by the
scheme. This will assist the dti team in managing the incentive scheme more
proactively and in more accurately assessing its impact. Although the incentive
scheme is already mid-stream in its term, it will be useful to set targets for the rest of
the incentive scheme‟s duration.
In the current context of no policy target, the dti should aim to achieve a higher jobs
created/sustained figure than stipulated by the MTEF budget. Opportunity exists for
this initiative to be supported by access to extra funds, and successful attempts will
encourage a higher budget provision for future years of the scheme.
Firms must be encouraged to more accurately project how many jobs they expect to
create, thus ensuring a closer alignment between projected and actual jobs. One way
to incentivise more accurate projections would be to offer a financial reward to firms
that create 90% or more of the jobs that they have projected to create. This financial
reward should be a calculated as a percentage of a firm‟s projected job numbers, as
opposed to being based on by how much they exceed their target, so as to prevent
firms from under-projecting on purpose in order to receive this „bonus‟.
At the very least, firms should be required to provide an explanation for notable
variances between their projected and actual jobs. This information would help the
scheme‟s administrators to review and improve the focus, structure and operation of
the incentive over time.
The method of calculating average jobs created/sustained by a company on which the
incentive amount is paid out should be made more transparent. The dti‟s calculation
model is not fully understood by many of the scheme participants. The calculation
model should be shared with and clearly explained to firms. An embedded spread
sheet for example, would allow companies to enter their job figures for a claim period,
and arrive at their incentive payment amount. This will increase understanding of the
calculation process, go some way to managing firms‟ expectations, and will encourage
a more transparent and predictable process of calculating the incentive pay-out,
ensuring that any disputes are objectively resolved.
The measurement of investment must be better defined in terms of what is
included/excluded from the investment figures provided. The reporting of investment
by firms must be standardised with clear instructions provided on how the recording
should be done – either cumulatively or additionally.
5.1.2. IS THE DESIGN OF THE INCENTIVE PROGRAMME SUPPORTING THE
ACHIEVEMENT OF PROGRAMME OBJECTIVES?
Design of the incentive scheme
A positive aspect of the incentive scheme is that it is straightforward to understand.
Most companies have a good understanding of how the scheme works. Once the scheme was
explained to them, it was quite straightforward and the design and conditions associated with
the scheme are easy to understand and apply.
The main concern expressed around the design of the scheme relates to its duration.
Most participants felt that the scheme should have been for five years, which is more

50
comparable with incentive schemes in other countries, and that if the three year period was
chosen at the initial design of the BPS incentive programme, the incentive scheme should
have been extended by now. The duration of the incentive scheme has also had implications
for analysing South Africa‟s cost competitiveness as potential investors compare South Africa‟s
incentive scheme against other countries with schemes that have a longer duration. The extent
to which the duration of South Africa‟s incentive scheme has discouraged investment in the
country to date is not clear.
The incentive scheme should be graded by different service types. The BPS industry is
split into two broad categories of front-office and back-office operators, which differ not only in
their service offerings, but in their employment requirements, average size, and cost of
operations. The back-office operations (LPO and KPO services) require highly skilled
employees, and in most cases are smaller operations. As such, a number of back-office
operations are unable to take advantage of the scheme because they do not meet the
minimum requirement for 50 employees. Also, given their smaller size, higher unit costs, and
higher labour cost, the incentive amount contributes proportionately less to reducing their cost
of operations than is the case for front-office operations. The incentive scheme does not take
into account these differences in service types, and as a result is inadvertently prejudiced
against back-office operators.
The scheme indirectly promotes employment of historically disadvantaged South
Africans. The design of the scheme positions it well to meet national targets of employment
creation for historically disadvantaged South Africans (HDSAs). Although not explicitly stated
as an objective, the nature of the BPS industry in South Africa, specifically its relatively low
entry-level skill requirements, implies that the incentive scheme will directly contribute to the
employment of HDSAs. There is therefore no need for any further measures which specifically
target HDSAs.
BPS incentive scheme theory of change
A review of the theory of change of the BPS incentive scheme was included in this
implementation evaluation. What was received from the dti is a Performance Monitoring Plan
(PMP).42
As the evaluation team was not supplied with an existing theory of change, the team
undertook the development of a notional results chain. This highlights the processes involved
in the incentive scheme and the logical progression of these processes from the inputs of the
scheme through to the impact of these inputs. Figure 32 is a representation, based on our
analysis, of the results chain for the BPS incentive scheme, and is described in detail below.
42 Document reference: BPS PMP 15 October 2012

51
Figure 32: Proposed Results chain
The key features and definitions of terms used to describe the results chain are
summarised as follows:
Inputs. The initial catalyst for the incentive scheme was the confirmation of the
allocation of funding from the MTEF. This catalysed the deployment of a team from
the dti and an operational budget for the implementation and running of the scheme.
Activities. Once companies have heard of the scheme (ideally through marketing),
they compile applications and submit to the dti. Officials process the applications and
where applicable approve them for the incentive scheme. Once companies are
approved on the scheme, the dti tracks the disbursement of their MTEF allocation
based on the number of jobs created (a key component of this activity is the validation
of the claims process to ascertain the number of jobs created).
Outcomes. Once approved onto the scheme, the company begins operations on the
new, incentivised project. For captive operations this model has a simple logical
transition: once a project is approved, it begins operations on this project. However, for
service providers the logical progression is not as simple: service providers need to
attract investors through a lower pricing model, thus when they market to their
investors, they discount the cost of their operations as if they have already been
approved onto the incentive scheme; however in order to qualify for the scheme, the
project needs to have a signed investor. Thus there is a “chicken and egg” scenario,
where the service provider needs use the incentive scheme as a means to attract
Impact
Outcomes
Activities
Inputs
Job creation
Foreign direct investment
Foreign investors commit
Receipt of applications Processing/approving applicationsTracking programme‟s
uptake of funds allocated
Marketing
Confirmed allocation in
Medium Term Expenditure
Framework (MTEF)
Human resources Operational budget
New BPS operations start up

52
investors, however, they will only be approved for the scheme if they have a signed
investor. Despite the discrepancy in logical progression for service providers and
captive operations, the result of being approved on the scheme is that operations on a
new project begin.
Impact. In the case of service providers, the start of the new project will be dependent
on a contract being signed with a foreign investor, the investor will thus be committed
to South Africa for the duration of the contact. In the case captive operations, the
investor will have signed a lease/property agreement, signifying a commitment to
investing in South Africa for a significant period. Once these investors have made this
commitment to South Africa, they begin to buy/rent telephones, rental space and so on
which is the inflow of FDI to South Africa. Along with this FDI is the employment of
individuals to staff the operation. Thus jobs are created at each new project, resulting
in increased job creation at the national level. The dotted line back to the MTEF
signifies that the incentive money is only disbursed once the jobs are actually created.
As there have been no formal discussions with the dti around the results chain or theory of
change, the results chain presented here is conceptual, and provides the basis for the
development of a more detailed model.
Institutional structure
The administration of the scheme is perceived to be efficient with no major issues with
the application and claims processes. One of the main positive highlights of the evaluation
was the generally positive impression of administration and communication of the
administrative team at the dti. Stakeholders are impressed with this aspect of the scheme and
this is an area of demonstrated proficiency.
The administration of the incentive scheme can be improved further by addressing two main
areas: the time-consuming, labour-intensive nature of the application and claims processes;
and administrators‟ inability to respond to technical queries related to these processes in
certain instances. In terms of the former, there is demand from the industry to transition
towards an electronic system (preferably in the form of an online platform) for the application
and claims processes. Our interaction with the dti indicates that this has already been noted
and a process of moving all government incentive schemes onto an online platform has begun.
Regarding the point of addressing more technical issues of the scheme, and notwithstanding
the generally good communication from the dti team, in certain cases the team has been
unable to provide guidance on policy and strategic queries regarding the scheme. It is
appropriate to publicise a single point of contact, including a website, to be consulted for all
policy/strategic issues relating to the incentive scheme (e.g. regarding the duration and grading
of the system).
Recommendations:
A graded scheme by type of service should be introduced to provide higher incentives
for firms offering a niche service, particularly in the case of back-office firms. The
requirements for back-office operators should also reflect their typical size, with the
minimum requirement reduced to, for example, 20 jobs for such firms.
Any adjustments to the design of the scheme must not complicate the associated
administrative processes. One of the positive elements highlighted in the qualitative
research is that the incentive scheme is quite straightforward and simple to

53
understand, and whilst improvements are necessary, they must not occur at the
expense of complicating the design and operating processes involved.
The proposed theory of change should be considered and developed, and appropriate
and measurable indicators should be finalised to assist in the monitoring of progress.
The application and claims processes can be moved to an electronic platform, this will
increase the efficiency of the process. The dti has indicated that this process has
already begun. It is still noted as a recommendation in this report given that it does not
currently exist and to emphasise that this process should be prioritised.
Communication specific to the policy guidelines and strategic issues relating to the
incentive scheme needs to be allocated to a specific point of contact, which must be
well informed and equipped to respond to such queries.
(repeated from Section 5.1.1) The monitoring process of the projects on the scheme
need to be improved to better collect data on actual FDI and jobs created. This is an
essential part of ensuring that the stated objectives of the incentive scheme are being
monitored and measured. This can be incorporated into the above recommended
electronic platform.
5.1.3. WHAT IS THE CURRENT RATE OF JOB CREATION THROUGH THE BPS
INCENTIVE SCHEME?
There is scope for an increase in the rate of job creation. This assessment is closely linked
to 5.1.1 above on how the scheme is meeting its targets. Firstly, given that there is no job
target set, it is difficult to assess a rate of job creation as there is no benchmark that the
incentive is aiming to reach. In the 2012/2013 year, the number of projects on the scheme
grew by 60% to 32. The number of jobs created/supported grew by 48% to 3,807. While this is
a significant increase over the two years, the fact that the budget allocation has never been
fully utilised indicates that there is scope for an increase in the rate of job creation.
Recommendations:
There needs to be a bigger drive to get more companies onto the scheme to increase the
rate of jobs created. It is understandable that the dti is limited in its ability to influence how
many job projections are translated into actual jobs, however should more projects be
included in the scheme, this will increase the overall number of actual jobs.
This is linked to improving the promotion strategy of the incentive scheme to attract more
investors, as well as a need for the introduction of graded incentives to capture more of the
entire BPS value chain.
Companies should be encouraged to make more realistic projections. This might be
achieved through the application of a bonus incentive designed to reward accurate
forecasting and the fulfilment of projections.
5.1.4. HOW COMPETITIVE AND COST-EFFECTIVE IS SOUTH AFRICA’S BPS
INCENTIVE PROGRAMME?
Cost competitiveness and cost-effectiveness
The rationale for the BPS incentive scheme is that it helps address the unfavourable cost
differential between South Africa and its major competitors. It was not anticipated that the
incentive would totally remove this cost differential but rather contribute significantly to
reducing the cost gap. What is important to note is that the incentive scheme is designed to
serve as a means to attracting companies to South Africa and to enable South Africa to

54
compete effectively with other tier II competitors, and not to totally cover all costs of operating
in South Africa. South Africa‟s value proposition shows that its BPS offering goes beyond cost
to include other advantages such as the quality of service provided, the accent and affinity to
the UK market.
That said, it is still relevant to analyse the extent to which South Africa‟s competitiveness has
been improved through the incentive scheme. The incentive scheme has contributed to making
South Africa more competitive than it was in 2010. The cost gap has reduced when compared
with the situation prior to the start of the BPS incentive scheme with each of the five countries
compared, and for both contact centre services and financial services. However when a full
assessment is made over the life of the scheme and compared with other countries, South
Africa‟s cost gap is increasing rather than decreasing. This is primarily due to two factors – the
reducing nature of the incentive scheme, and the three year duration of the scheme as against
schemes that run for five years in other countries.
An important part of the analysis of the cost-competitiveness is related to the duration of the
scheme. Our projections indicate that the narrowing of the cost gap is likely to continue if the
incentive scheme is extended beyond its current three year duration. This relates directly to the
the future of the incentive scheme.
In terms of cost-effectiveness, the incentive scheme is providing a positive return on the
investment made by the government. A very simplistic assessment shows that the estimated
actual investment made by companies on the scheme exceeds the budget allocated per year
to the incentive scheme. The positive ROI remains with the inclusion of the operational cost of
running the programme.43
The future of the incentive scheme
Uncertainty around the future of the incentive scheme was noted by every participant as
being a major current source of concern. None of the companies interviewed were aware of
the future duration of the incentive scheme. As such, companies are unable to include aspects
of the scheme in the development of their business strategy. While some of the larger
companies in the industry have been able to adjust their business plans for the next few years
to account for the possibility of an end to the incentive scheme, many other firms, particularly
at the growth stage or those more reliant on the incentives to help cover their operational
costs, are very concerned about the ambiguity around the future of the scheme.
The uncertainty about the future of the scheme is also starting to have an adverse impact on
the BPS industry‟s attractiveness and future competitiveness. When investors weigh up the
costs of setting up in a country, the incentives offered are a central part of the comparison
between countries, particularly for those companies who generate sizeable employment.
Service providers interviewed noted that South Africa‟s value proposition as an outsourcing
destination is currently being limited by the lack of clarity on the future of the incentive scheme.
Promotion of the incentive scheme
The promotion of the BPS incentive scheme within South Africa needs improvement.
While there is generally knowledge in the global BPO industry about South Africa as a BPO
location, there is a lower level of awareness of the scheme by firms in South Africa prior to
43 It must be noted that a comprehensive assessment of the return on investment of this scheme was not conducted
55
entering the industry. The incentive scheme has been marketed as part of the broader value
proposition of South Africa‟s BPS industry, with seemingly more focus on marketing to
international investors than to firms in South Africa. There needs to be improved promotion
and communication about the scheme to South African service providers who provide the
service to the international investors and those South African shared services operations that
service their African operations..
A number of companies were actually already operating in the industry servicing international
clients before they heard about the scheme. Many of the larger service providers who
frequently travel to liaise with potential investors stated that they often promoted the scheme
as part of their overall cost breakdown. The existence of multiple channels of promotion
increases the risk of a disjointed, incoherent marketing effort in which insufficient, out-dated or
inaccurate information may be provided to potential investors.
Recommendations:
The incentive scheme is playing a role in reducing the cost gap between South Africa
and its competitors, and should be extended in duration to fully derive this benefit. It is
important, however, that this simple cost-based subsidy is enhanced by measures to
deepen the skills base of the industry – an essential pre-requisite for South Africa to
realise and sustain its competitive advantage in the global BPS market.
There needs to be communication from the government on the possible future of the
scheme. Even though a final decision may not be made immediately about the
extension of the scheme, communication which indicates that the issue is currently
being explored, and if possible, suggests a date by when decided decision will be
made, will alleviate the current anxiety.
There needs to be a more concerted effort to promote the incentive scheme to
domestic service providers and captives. A promotional strategy for the incentive
scheme must be communicated to all industry participants in South Africa to ensure
consistency in the message that is given to potential investors.
Better coordination is needed between the government body responsible for the
promotion of the incentive scheme, industry bodies and companies to develop a
shared and coherent strategy for communicating and promoting the incentive scheme
to investors, specifically to domestic service providers with the potential to attract
offshore work.
5.2. BROADER INDUSTRY ANALYSIS
The three themes included in the TOR that relate to the broader BPS sector are factors
influencing the success of the industry, barriers to growing the BPS sector, and how the sector
can be sustained and up-scaled for greater impact. These are briefly discussed below, with
recommendations provided at the end.
Factors influencing the success of the BPS sector
There are two primary factors that will determine South Africa‟s BPS industry success – the
cost of operating and the quality of service provided.
Cost of operating. As expected, a key success factor for every BPO location relates
to the costs of set-up and operation. While this is primarily an assessment of the
financial cost, other business costs such as the ease with which a company receives a
license to operate and the administrative burden associated with legislative

56
requirements, such as obtaining work permits, are also relevant. South Africa‟s
success as a BPO destination will always be linked to its cost-competitiveness in
relation to other BPO locations. Although we are not aiming to become the lowest cost
operator, the incentive scheme was introduced to decrease substantially the cost of
operating in South Africa. This was the justification for the provision of the BPS
incentive, and is still a relevant factor today.
The quality of service is a key factor influencing South Africa’s success. Many
respondents indicated that South Africa is chosen because of the higher quality of
service provided as compared to other destinations. This is a broad theme that relates
to the affinity of the South African accent for the UK market, and the culture and work-
ethic of the South African labour pool. This is one of the main reasons why South
Africa is chosen over other destinations. A drop in the comparatively high standard of
service will have adverse consequences for the success of South Africa‟s BPS sector.
Barriers to growing the BPS sector
The findings strongly indicate that there is an insufficient skills pool to meet the current
and future demands of the BPS industry in South Africa. This appears to be the main
barrier to increasing the scale and deepening the value base of the BPS sector. The skills
shortage concern was highlighted by many respondents as one of their major areas of
constraint when setting up and/or expanding their operations. It is important to note that the
issue is not one of a lack of supply of labour, but rather of labour with the required skills for
servicing the international outsourcing market. Currently, this shortage of skills is most felt in
the team leader and quality assessor roles.
At the agent level, the skills pool currently appears to be adequate and as such companies
have few difficulties with filling these positions. However, many companies noted that should
the rapid growth of the industry over the last few years continue, the current skills pool will not
be able to keep pace with the future demand for all levels of employees, and this could limit the
growth of the industry.
This evaluation purposively did not investigate the Monyetla Work Readiness Programme™.
However, the indication is that a more targeted approach must be taken to supply the industry
with skilled labour suitable for servicing the international market. The Monyetla Work
Readiness Programme™ is considered by respondents to be insufficient in terms of supplying
the quality and quantity of employees, especially at the team leader and quality assessor roles.
As such, a number of firms, mostly the larger service providers, use internal training
programmes for their employees44
.
Sustaining and up-scaling the BPS sector post the incentive period
In essence the sustainability of the BPS sector is dependent on a number of factors highlighted
above. Whilst South Africa is not positioned to compete directly with countries such as India on
cost grounds, our unique offering (affinity to the UK market, quality of service provided etc.)
may position us adequately to compete with these countries on the grounds of quality. Most of
the companies interviewed indicated that the strengths of the BPS industry can be sustained,
should the main areas of concern relating to the skills pool and the uncertainty around the
44 The Monyetla Level 4 Programme, which is due to be implemented shortly, aims to support skills development at a
higher level of work for agents, and also for team leaders and quality assessors. The dti designed the programme for this purpose, although there have been delays in starting the programme. However it is uncertain whether this programme will meet the needs of the industry participants

57
future of the incentive scheme be addressed. The recommendations below speak to the key
conditions for and barriers to expansion of the industry.
Recommendations for the BPS industry:
The incentive scheme must be continued to keep South Africa cost-competitive.
The key barrier to growth of the industry is the skills challenge. The skills shortage has
a broader implication for South Africa‟s current and future value proposition and needs
to be addressed with urgency by the government, in partnership with industry. Broader
than the incentive scheme, the BPS industry should align employee training to better
meet the demands of the industry.
While it is noted that the incentive is a fungible tool that firms can use to address a
variety of input costs, training has not been and is not likely to be one of these costs
that firms are directing the incentive towards. The incentive is used primarily to reduce
their overall cost gap with competitor countries, which are driven by operational
expenditure items. An additional and distinct support mechanism for training should be
considered given the critical role played by the skills pool in the sustainability of the
industry.

58
6. PRIORITY CONSIDERATIONS
The evaluation report has highlighted the main positive attributes of the BPS incentive scheme,
as well as the areas requiring attention to improve the scheme going forward. To conclude this
report, we highlight some priority considerations that need to be addressed and that, in our
view, will have a notable effect on improving the impact of the scheme at meeting its
objectives. The improvements suggested here are readily achievable and could be expected to
yield results in a relatively short time.
Develop a clear target for job creation and FDI, and implement adequate measures to
achieve, measure and review these targets. The BPS incentive scheme has a clearly
defined objective to attract FDI and create jobs. To adequately assess whether the scheme is
achieving these objectives, it is crucial to set clear targets for both job creation and FDI. These
targets must be clearly communicated to prospective and participating firms. For example, in
the case of FDI, the types of investment that are included in this component of the incentive
scheme must be defined for all companies. It is then vital to develop accurate and consistent
records of the actual FDI that has been generated and of the number of jobs created. The
administrative team should have a dedicated and consistent means of monitoring the
achievement of these targets, making use of the online platform for capturing, calculating and
reporting this information. The number of jobs supported by the scheme must be recorded
consistently to ensure a continuous up to date view on the performance of the incentive
scheme.
Review the design of the scheme. Given that the current time frame of the scheme is three
years, and this is set to be completed soon, it is an appropriate time to review the design of the
scheme to identify how the scheme can be refined to better meet its objectives and attract
more FDI and create sustainable jobs. The review of the design should explore the possibility
of providing a slightly different incentive amount and requirement for front-office and back-
office operators. Important also is the need to encourage as a separate measure or component
the training and development of agents to reach specific levels of skill required for international
services. The management of the scheme should consider the option of providing a graded
incentive by job level and/or an additional incentive for training. This will require more detailed
financial modelling for each industry segment and each respective value.
Improve communication on the future of the scheme. Possibly the most immediate priority
is to begin a process of communication with the industry participants regarding the future of the
incentive scheme. Whilst it may not be possible to provide a definite directive on the future of
the scheme, improved communication indicating that the dti is in the process of reviewing the
scheme‟s current format. A timeframe within which a directive will be released should be
communicated to the industry participants. The dti needs to make a decision fairly soon as to
whether the scheme will be extended beyond the current timeframe, and if so, if any changes
are to be made to its design.
Develop a specific promotions strategy for the BPS incentive scheme. The promotion of
the BPS incentive scheme is currently conducted as part of the broader marketing of South
Africa‟s BPS industry value proposition. While this is appropriate, it should be in addition to a
targeted approach for promoting the incentive scheme to South African service providers -
since domestic firms are crucial to the success of the scheme, and can be encouraged to
broaden their offer to overseas investors. There should be measures to improve collaboration
between the dti marketing department, the administration officials of the scheme, and the

59
industry bodies to develop a coherent strategy that more effectively promotes the scheme and
also that equips service providers to attract investors to South Africa.
Move key administration process to an online platform. Transferring the current
application, claims and progress reporting process to an online platform will immediately
improve the administrative efficiency of the scheme. The platform should also provide the
opportunity for participants to email queries they have on the administration process. This will
help streamline the queries process and help the administration team keep track of the
common queries they receive. This is a process that has begun but needs to be prioritised and
implemented as a matter of urgency.
Address the skills pool in South African BPS industry. While this was explicitly excluded
from the evaluation scope of work, the skills pool is the key driver in ensuring the sustainability
of the industry beyond the incentive period and in developing and sustaining South Africa‟s
competitive advantage. The development of a strategy and related measures to address this
goal should be adopted as a priority.
60
7. APPENDIX
7.1. ANNEX A
Table 10: List of documents, data and information sources reviewed
Title Author Year Description/Relevance
Policy Documents
Cabinet memorandum Nr 41 of 2006
The dti 2006 Background to the policy behind the BPS sector and incentive scheme
Programme Guidelines: Business Process Services Incentives
The dti 2012 Greater understanding of the BPS incentive scheme, particularly as it is seen from the perspective of a potential investor.
Programme Guidelines: BPO&O Investment Incentive
The dti 2007 Investor guidelines about the BPO&O incentive programme, providing insight into the revisions for the BPS incentive scheme
Programme Guidelines: BPO&O Training Support Grant
The dti 2007 Investor guidelines about the BPO&O incentive programme, providing insight into the revisions for the BPS incentive scheme
Industrial Policy Action Plan (IPAP) 2012/2013-2014/2015
The dti 2010 Identification of the BPS sector as a priority sector and the reasoning behind this.
Evaluations and reviews
Sector Support Programme for BPO&O in South Africa: A Review of the Government Assistance and Support Programme
Mercorio, G 2009 Initial review of the BPO&O incentive scheme, providing the strengths and weaknesses of the GAS programme
BPO Incentives Review Everest Global Inc. 2010 Review confirmed Mercorio‟s findings and subsequently informed the change from the BPO&O incentive scheme to the BPS incentive scheme.
Becoming Strategic- South Africa‟s BPO Service Advantage: Report One- South Africa‟s BPO Service Advantage
Willcocks, L., Craig, A., and Lacity, M- London School of Economics and Political Science
2012 Review of the South African BPS sector including country comparisons, investors‟ experiences of the industry, the strengths and weakness of the sector and key recommendations
Becoming Strategic- South Africa‟s BPO Service Advantage: Part 2- Case studies of success
Willcocks, L., Craig, A., and Lacity, M- London School of Economics and Political Science
2012 Detailed case studies of BPS companies in South Africa.
Analysis of South Africa as a BPO Delivery Location
NelsonHall 2011 Review of the South African BPS sector for mainly UK investors.
Marketing material and value proposition

61
Ready to Compete: South Africa‟s BPO capabilities in the financial sector
Everest Global Inc. and Letsema Consulting and Advisory
2008 Overview of South Africa‟s strategic BPS position.
Developing Talent: A snapshot of initiatives in South Africa‟s BPO sector
The dti , Business Trust and BPeSA
2010 Overview of South Africa‟s skills potential and skills programmes for the BPS sector.
Delivering World-Class Customer Experience: South Africa‟s proposition for contact centre BPO
The dti , Business Trust and BPeSA
2010 Overview of South Africa as a destination for BPS and the value proposition in its entirety.
Gateway to Africa: South Africa‟s proposition as a BPO service hub for Africa
The dti , Business Trust and BPeSA
2010 South Africa as a strategic position for investors to penetrate the African market.
Our Incentives: Making a Difference
Overview of incentives offered to South Africa‟s business process offshoring industry
The dti , Business Trust and BPeSA
2010 Overview of South Africa‟s incentives for the BPS sector.
BPO Strategic Marketing: Programme discussion document
The dti , Business Trust and BPeSA
2010 Overview of South Africa‟s BPS value proposition and why it is an attractive location for investors.
We Speak Your Language: South Africa‟s proposition for business process offshoring
The dti , Business Trust and BPeSA
2010 Overview of South Africa‟s accent and voice qualities.
South Africa at a glance:
Overview of geopolitical, environment, demographics and business environment
The dti , Business Trust and BPeSA
2010 A general overview of South Africa as a country.
Developing the BPO sector: Report to stakeholders 2009
The dti , Business Trust and BPeSA
2009 Detailed outline of the South African BPS sector including the BPS strategy, value proposition, marketing, institutional framework and second economy objectives.
Desktop research: The global BPS market
Business Process Outsourcing: Moving Beyond Borders and Cost
Agile Equity 2010 The global BPS sector and what the trends are in BPS globally.
Achieving High Performance in BPO
Willcocks, L., Simonson, E., Sutherland, C. and Lacity, M- Accenture
2012 Global BPS context, how it developed and what its future is expected to look like.
India BPO Study: Roadmap 2012-Capitalizing on the
Nassom and Everest Global Inc.
2012 Global overview, including India‟s BPS capabilities, opportunities, and growth imperatives.

62
expanding BPO landscape
Introduction to Everest Group‟s Survey on Global Locations
Everest Global Inc. 2011 Overview of where South Africa ranks as an outsourcing location for investors when considering expanding operations.
Offshore Locations: Buyers‟ Perceptions and Plans for 2011-2012
Everest Global Inc. 2010 Outline of investors current footprint, expansion plans and risk perceptions and how this affects the South African BPS sector.
Business Process Outsourcing Services 2001-2015 Forecast, Doc # 228081
International Development Corporation
2011 Overview of industry growth rates and projections
U.K. BPO Market Forecast: 2011-2015
NelsonHall 2011 Overview of the UK BPS market, which is essential as they are South Africa‟s biggest source market.
Working documents from the dti
Company evaluation reports
The dti N/A Summary of companies on the incentive scheme, their location, projected number of jobs, projected investment and incentive allocation
BPS client information sheet
The dti N/A List of companies on the incentive scheme, names of relevant company stakeholders and contact information
Blank application and claims forms
The dti N/A Useful for understanding ease of use of the application and claiming process
BPS status report The dti N/A List of companies on the incentive scheme, the number of jobs and projected and created per project, and the projected FDI per project
Desktop research: The theory of incentives
The Economics of Subsidies
Erickcek, G., Lannane, D., McCrea, N., Salem, P.
2006 Theoretical background to incentives and the effects they can have.
New Voices in Public Policy: The Washington Consensus
Symoniak, J. 2011 Theoretical background to incentives and the effects they can have.
Introduction to Market Failure or Success: The New Debate
Cowen, T., and Crampton, E.
2002 Theoretical background to incentives and the effects they can have.
Distributive Politics and Economic Growth
Alesina, A and Rodrik, D.
1994 Theoretical background to incentives and the effects they can have.

63
Table 11: Stakeholders included in the qualitative research process
Stakeholder Participants in the interview
Companies
Amazon Scott Sommers (Senior Site Leader)
Natalie Joubert (Senior Accountant)
Computer Services & Solutions (Pty) Ltd Gavin Taylor (Documentation Manager (SLM); Quality Management – Internal Auditor)
Frikkie Grobler (CEO)
Dialstat Trading 118 (Pty) Ltd Jody Baumgarten (Financial Director)
Exigent Natalie Langeveld (HR Officer)
Full Circle Contact Centre Services (Pty) Ltd Noel Carbutt (Assistance Finance Director)
Fusion Outsourcing Services (Pty) Ltd Johann Kunz (Managing Director)
Merchants SA (Pty) Ltd Lisa Roos (General Manager for iiNet and Everything Everywhere)
Diana Costella (General Manager for ASDA)
Trevor Arumugam (Financial Manager for iiNet, Everything Everywhere and ASDA)
Mindpearl South Africa (Pty) Ltd Stefan Burri (CFO)
Sue Hollis (Finance Manager)
Old Mutual Life assurance Company SA Ltd Cilliers van der Spuy (Finance Manager)
Pixelfaerie Business Service (Pty) Ltd Eamonn O'sullivan (Managing Director)
Ursula Jordaan (Quality Assurance and Training)
Sharp Trading 91 Denis Fry (CEO)
Aegis Outsourcing South Africa (Pty) Ltd Kobus van der Westhuizen (Country Head and Senior Vice President of Business Development)
Coracall (Pty) Ltd Ian Kinsey (Managing Director)
Bazigyn (Pty) Ltd Snow Cogan (Managing Director)
Broodsky Trading Brett Gray (CEO)
Kieron Kriel (Financial Director)
Call Centre International (Pty) Ltd Mark Chana (Managing Director)
Miracle Communications CC Denton Muil (Co-founder and Financial Director)

64
Stakeholder Participants in the interview
Bruce Muil (Co-founder and CEO)
Smartworx BPO Tumbikani Nyasulu (CEO)
Fezeka Dlamini (HR and Legal Compliance Manager)
Value Click SA Cheryl Ingram (Digital Operations Executive)
Ernst & Young Advisory Services Limited Chantelle Durand Fuchs (Business Tax Compliance Services)
First Call Centre Solutions CC Gary Hohls (Financial Manager)
Darren Robson (Director)
Sanclare Chris Fisher (Managing Director)
MSAT.CC Dyalan Munsamy (CEO)
Standard Bank of South Africa Elsabe Pretorius (Head of Credit Projects)
ABSA Group Limited Ben van Zyl (Head of Strategic Projects)
Paul Riley (CEO)
Government officials
DED-Western Cape Nezaam Joseph
DED-KwaZulu-Natal Linley Nadasen
DED-Johannesburg Linda Ranieri
DTI (IDD) Ntokozo Mthabela
DTI (TISA) Dean Hoff
DTI (IDAD) Reshni Singh
TIKZN Isaac Zikhathile
WESGROW Nils Flaatten
Industry bodies
BPeSA Western Cape Gareth Prichard
TOTAL 35 stakeholder groups (45 participants)

65
7.2. ANNEX B
INDICATOR/MEASURE
QUESTIONS SOURCE PERSONS TO BE INTERVIEWED
RANK/SCORE
EF
FIC
IEN
CY
Marketing of SA's BPS incentives
Does the marketing of the South African BPS industry include specific information related to the BPS incentive scheme?
Interviews
Companies, Government officials
2 (yes), 1 (no)
Is communication, of the BPS incentive scheme, within and between relevant divisions of the dti and other stakeholders effective and efficient?
Companies, Government officials
2 (yes), 1 (no)
How attractive is the South African BPS incentive scheme to you compared with other BPS incentive schemes that offer tax rebates, capital incentives and other incentive tools?
Companies, Government officials
5 (Best Practice), 4 (Good), 3 (Average/Met target), 2 (Poor), 1 (Unobserved)
General design of the BPS incentive scheme
Did you participate in SA's initial BPO&O incentive scheme (that included a capex and opex incentive component)? If not, why not?
Interviews Companies
2 (yes), 1 (no)
Is the current BPS incentive scheme an improvement on the initial BPO&O incentive scheme? How
2 (yes), 1 (no)
Administration of the BPS incentive scheme in the application process
Is the process of applying for the incentive programme efficiently administered? (eg turn around times and correctness)
Interviews
Companies 2 (yes), 1 (no)
What was the approximate duration of the application-to-approval process?
Companies
5 (<1 month), 4 (1 to 2 months), 3 (2 to 4 months), 2 (4 to 6 months), 1 (>6 months)
Were there any delays in processing your application? If so, what were the reasons for the delay (eg. a result of missing documents on your behalf and / or delays on behalf of the dti ?)
Companies 2 (yes), 1 (no)

66
INDICATOR/MEASURE
QUESTIONS SOURCE PERSONS TO BE INTERVIEWED
RANK/SCORE
Did you experience any administrative hurdles in processing the incentive application? If so, what were these?
Government Officials
2 (yes), 1 (no)
Administration of the BPS incentive scheme in the claims process
Is the claims process efficiently administered? (e.g. turn around times and correctness)
Interviews Companies (service provider)
2 (yes), 1 (no)
What is the approximate duration of the claim submission-to-payment process?
5 (<1 month), 4 (1 to 2 months), 3 (2 to 4 months), 2 (4 to 6 months), 1 (>6 months)
Did you have any experience in appealing the annual review of targets? If so, how was this managed?
2 (yes), 1 (no)
Is a quarterly claim cycle appropriate, or is this too frequent or not frequent enough?
2 (yes), 1 (no)
Is the claims verification process effective (eg site visits, factual findings)? How does this process effect your business?
2 (yes), 1 (no)
Is sufficient preparation time given for site visits? Do you know what to expect and how to prepare?
2 (yes), 1 (no)
Management of disputes
Have you experienced any disputes with regards to interpreting the incentive guidelines? If so, what were these disputes and how was this managed?
Interviews
Companies (service provider), investors, government officials
5 (Best Practice), 4 (Good), 3 (Average/Met target), 2 (Poor/Below target), 1 (Not Applicable)
Communication during the incentive scheme application process
Is communication and explanation of the details of the BPS incentive scheme sufficient and efficient and allowed you to make decisions in a timely manner? (Probing: Did you have enough information supplied to you with regards to the requirements for your application for the BPS incentive scheme? Do effective and efficient communication channels exist regarding issues relevant to the application process? Are you kept informed of the progress of your application?)
Interviews Companies 2 (yes), 1 (no)

67
INDICATOR/MEASURE
QUESTIONS SOURCE PERSONS TO BE INTERVIEWED
RANK/SCORE
Communication during the incentive scheme claiming process
Do effective and efficient communication channels exist regarding issues relevant to the claims process?
Interviews Companies 2 (yes), 1 (no)
How would you describe the handling and resolution of any queries or comments raised during this process?
Interviews Companies
5 (Best Practice), 4 (Good), 3 (Average/Met target), 2 (Poor/Below target), 1 (Not Applicable)
RE
LE
VA
NC
E
Flexibility of the BPS incentive scheme
To what extent does the BPS incentive scheme accommodate firms across different segments / Industry verticals of the BPS sector and at various stages of growth (start up, growth, mature)?
Interviews
Companies; government officials
5 (Best Practice), 4 (Good), 3 (Average/Met target), 2 (Poor/Below target), 1 (Not Applicable)
To what extent does the BPS incentive scheme provide flexibility around reviewing projected and actual outcomes?
Companies; government officials
5 (Best Practice), 4 (Good), 3 (Average/Met target), 2 (Poor/Below target), 1 (Not Applicable)
Domestic versus foreign split
Do you provide services to the domestic market? Why or why not? If yes, how does the size of this footprint compare to the size of your foreign market?
Interviews Companies 2 (yes), 1 (no)
Links to national development goals
To what extent do you believe the BPS incentive scheme aligns to the national socio-economic development goals? (the three goals being job creation, sustainability and FDI?
Interviews
Government officials; companies
5 (Best Practice), 4 (Good), 3 (Average/Met target), 2 (Poor/Below target), 1 (Not Applicable)
To what extent does your project, for which you have applied for the BPS incentives, encourage employment of previously disadvantaged individuals?
Government officials; companies
5 (Best Practice), 4 (Good), 3 (Average/Met target), 2 (Poor/Below target), 1 (Not Applicable)

68
INDICATOR/MEASURE
QUESTIONS SOURCE PERSONS TO BE INTERVIEWED
RANK/SCORE
Links to other departments/development programmes/funds etc
How could skills development be improved for the broader BPS industry in RSA?
Interviews
Companies; government officials
5 (Best Practice), 4 (Good), 3 (Average/Met target), 2 (Poor/Below target), 1 (Not Applicable)
To what extent does the BPS incentive scheme encourage links with the Monyetla Work Readiness Programme?
Companies
5 (Best Practice), 4 (Good), 3 (Average/Met target), 2 (Poor/Below target), 1 (Not Applicable)
Investment decisions
What are the key criteria determining your investment decision in a country's BPS industry?
Interviews Companies (investor)
6 (time zone), 5 (accent), 4 (cost), 3 (operational experience), 2 (infrastructure/technological capacity), 1 (other)
How does SA fair in terms of these criteria?
5 (Best Practice), 4 (Good), 3 (Average/Met target), 2 (Poor/Below target), 1 (Not Applicable)
Lack of differential in the incentive scheme
Do you think that the BPS incentive scheme should be graded by skill level (ie contact centres at a lower rate and lower incentive amount than KPO centres)? Why?
Interviews Companies (investor)
2 (yes), 1 (no)
Impact of incentives on investment decisions
Does the BPS incentive scheme as it is currently designed and implemented influence your company's growth strategies and investment decisions?
Interviews Companies (investor)
2 (yes), 1 (no)
Was the presence and design of the current BPS incentive scheme a driver of your investment decision in SA?
2 (yes), 1 (no)
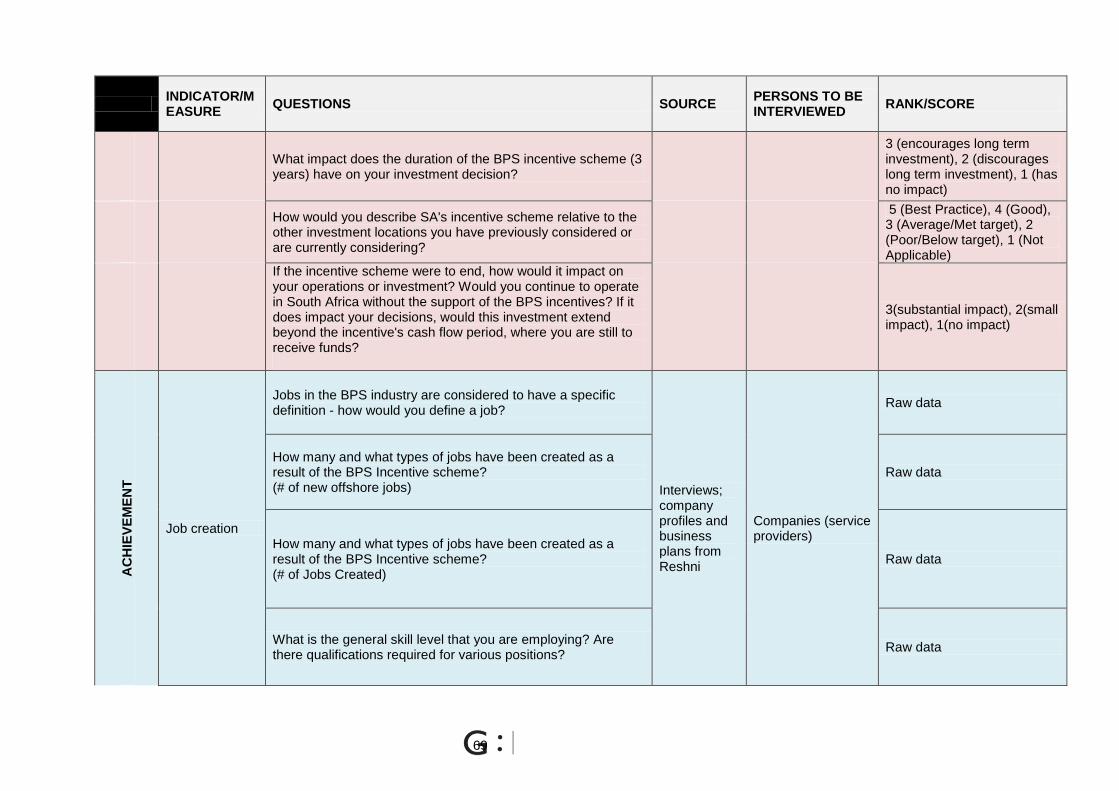
69
INDICATOR/MEASURE
QUESTIONS SOURCE PERSONS TO BE INTERVIEWED
RANK/SCORE
What impact does the duration of the BPS incentive scheme (3 years) have on your investment decision?
3 (encourages long term investment), 2 (discourages long term investment), 1 (has no impact)
How would you describe SA's incentive scheme relative to the other investment locations you have previously considered or are currently considering?
5 (Best Practice), 4 (Good), 3 (Average/Met target), 2 (Poor/Below target), 1 (Not Applicable)
If the incentive scheme were to end, how would it impact on your operations or investment? Would you continue to operate in South Africa without the support of the BPS incentives? If it does impact your decisions, would this investment extend beyond the incentive's cash flow period, where you are still to receive funds?
3(substantial impact), 2(small impact), 1(no impact)
AC
HIE
VE
ME
NT
Job creation
Jobs in the BPS industry are considered to have a specific definition - how would you define a job?
Interviews; company profiles and business plans from Reshni
Companies (service providers)
Raw data
How many and what types of jobs have been created as a result of the BPS Incentive scheme? (# of new offshore jobs)
Raw data
How many and what types of jobs have been created as a result of the BPS Incentive scheme? (# of Jobs Created)
Raw data
What is the general skill level that you are employing? Are there qualifications required for various positions?
Raw data

70
INDICATOR/MEASURE
QUESTIONS SOURCE PERSONS TO BE INTERVIEWED
RANK/SCORE
FDI What is the extent and form of your direct investment attributed to projects which are part of the BPS incentive scheme?
Interviews; company profiles and business plans from Reshni
Companies (service providers)
5 (Operational ie rent), 4 (Capital), 3 (Human capital), 2 (Direct portfolio), 1 (Other)
Expectations vs reality of scheme
Did your company (or is your company on track) to meet the expectations created around the BPS incentive scheme?
Interviews Companies (investor and service provider)
3 (fell short), 2, (met expectations), 1 (exceeded expectations)
Cost effectiveness
Does the BPS incentive scheme bridge the cost gap sufficiently to make your cost of operations competitive?
Interviews Companies (investor)
2 (yes), 1 (no)
General environment of the incentive scheme
What are some of the major positive attributes of the BPS incentive scheme?
Interviews
Companies, industry bodies/representatives
5 (skills), 4 (capacity i.e. infrastructure), 3 (cost), 2 (other), 1 (not applicable)
What are some of the main challenges/weaknesses presented by the BPS incentive scheme?
Companies, industry bodies/representatives
5 (skills), 4 (capacity i.e. infrastructure), 3 (cost), 2 (other), 1 (not applicable)
Have you attempted to contact any relevant stakeholders with regard to these challenges? What has been the response?
Companies
5 (Best Practice), 4 (Good), 3 (Average/Met target), 2 (Poor/Below target), 1 (Not Applicable)
What are the common strengths noted or concerns raised by the industry in terms of the BPS incentive scheme?
Companies, industry bodies/representatives
5 (skills), 4 (capacity i.e. infrastructure), 3 (cost), 2 (other), 1 (not applicable)
Has the industry body taken any steps to address these issues?
Companies 2 (yes), 1 (no)
Incentive take-up/absorption
What is the success rate of BPS incentive applications?
Interviews Government officials
1 (0 to 20%), 2 (20 to 40%), 3 (40 to 60%), 4 (60 to 80%), 5 (80 to 100%)
What are the main reasons for rejected applications?
Qualitative
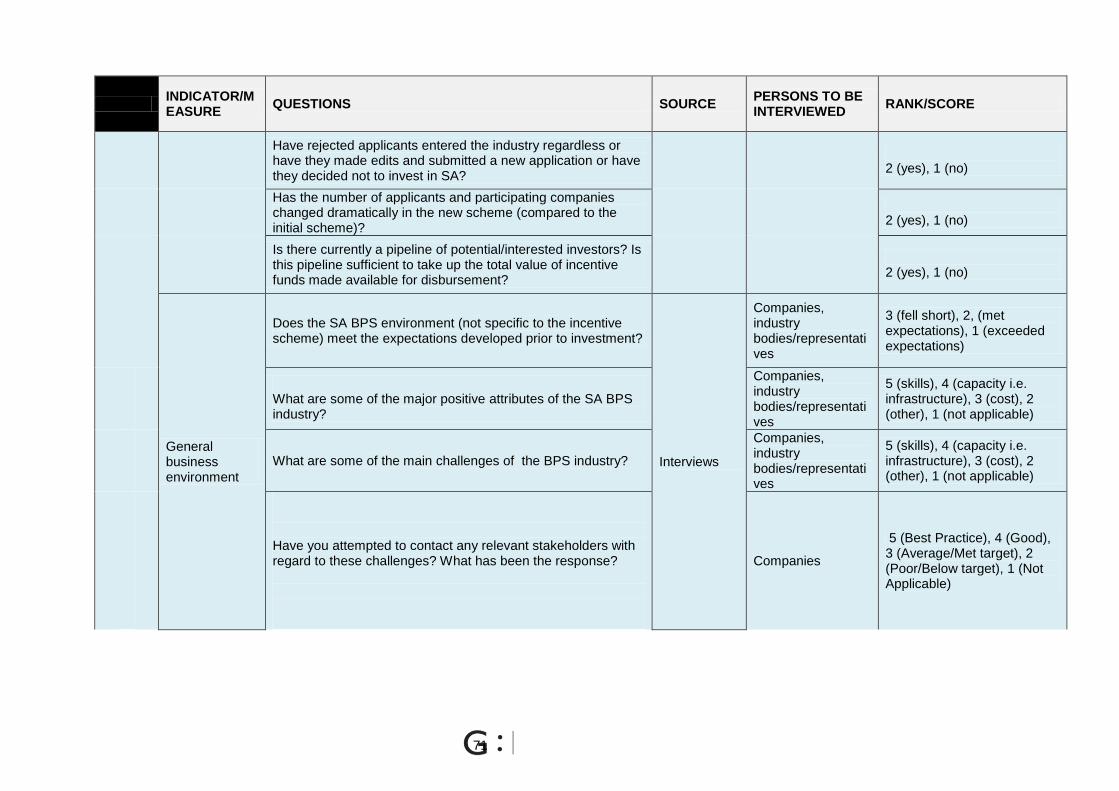
71
INDICATOR/MEASURE
QUESTIONS SOURCE PERSONS TO BE INTERVIEWED
RANK/SCORE
Have rejected applicants entered the industry regardless or have they made edits and submitted a new application or have they decided not to invest in SA?
2 (yes), 1 (no)
Has the number of applicants and participating companies changed dramatically in the new scheme (compared to the initial scheme)?
2 (yes), 1 (no)
Is there currently a pipeline of potential/interested investors? Is this pipeline sufficient to take up the total value of incentive funds made available for disbursement?
2 (yes), 1 (no)
General business environment
Does the SA BPS environment (not specific to the incentive scheme) meet the expectations developed prior to investment?
Interviews
Companies, industry bodies/representatives
3 (fell short), 2, (met expectations), 1 (exceeded expectations)
What are some of the major positive attributes of the SA BPS industry?
Companies, industry bodies/representatives
5 (skills), 4 (capacity i.e. infrastructure), 3 (cost), 2 (other), 1 (not applicable)
What are some of the main challenges of the BPS industry?
Companies, industry bodies/representatives
5 (skills), 4 (capacity i.e. infrastructure), 3 (cost), 2 (other), 1 (not applicable)
Have you attempted to contact any relevant stakeholders with regard to these challenges? What has been the response?
Companies
5 (Best Practice), 4 (Good), 3 (Average/Met target), 2 (Poor/Below target), 1 (Not Applicable)

72
INDICATOR/MEASURE
QUESTIONS SOURCE PERSONS TO BE INTERVIEWED
RANK/SCORE
SU
ST
AIN
AB
ILIT
Y A
ND
AD
DIT
ION
AL
ITY
Long term employment sustainability
What percentage of your job contracts, of those qualifying for the BPS incentive, are for longer than 12 months? (and what do you define as a permanent contract?)
Interviews Companies
1 (0 to 20%), 2 (20 to 40%), 3 (40 to 60%), 4 (60 to 80%), 5 (80 to 100%)
What is the average annual rate of attrition that you experience? (Probe: Does this vary across skill level? Has this changed in the time your company has been working in SA?)
1 (0 to 20%), 2 (20 to 40%), 3 (40 to 60%), 4 (60 to 80%), 5 (80 to 100%)
To what extent is the current skills pool and capacity suitable and sufficient to meet the growing demand in the BPS industry in your area?
5 (Best Practice), 4 (Good), 3 (Average/Met target), 2 (Poor/Below target), 1 (Not Applicable)
Long term plans for continued operations
Are there intentions to continue the currently incentivised project (operations) beyond the currently approved 3 year incentive period?
Interviews, Business Plans
Companies 2 (yes), 1 (no)
Has there been any communication with investors by government regarding the long term vision of the incentive scheme?
Interviews, Business Plans
Companies 2(yes), 1 (no)
Telecommunications
In your opinion have you seen a progression and change in the price of telecommunications?
Interviews Companies
2 (decrease in price relatively), 1 (increase in price relatively), 0 ( no change)
Long term vision for the incentive scheme
What is the long-term vision for the design, function and funding of the incentive scheme?
Interviews Government officials
3 (renew/continue scheme), 2 (end scheme without replacement), 1 (implement revised/new scheme)

73
INDICATOR/MEASURE
QUESTIONS SOURCE PERSONS TO BE INTERVIEWED
RANK/SCORE
What changes, if any, do you believe could be made to improve the current BPS incentive scheme? (eg criteria for application, values of disbursements, disbursement pay-outs and the timing of this, relevance of opex system versus other systems or a combination of systems)
Interviews Government officials; companies
Open
General sustainability of SA BPS industry
What advantage does SA present over other competitor destinations in the BPS industry?
Interviews
Government officials; companies; industry bodies/representatives
6 (time zone), 5 (accent), 4 (cost), 3 (operational experience), 2 (infrastructure/technological capacity), 1 (other)
Is this advantage sustainable?
Government officials; companies; industry bodies/representatives
2 (yes), 1 (no)
What are some of the commonly reported areas of concern/ needing improvement?
Government officials; companies; industry bodies/representatives
5 (skills), 4 (capacity i.e. infrastructure), 3 (cost), 2 (other), 1 (not applicable)
In the absence of the incentive scheme, what would be the core criteria for increased and/or sustained investment in SA's BPS industry?
Companies 5 (skills), 4 (capacity i.e. infrastructure), 3 (cost), 2 (other), 1 (not applicable)
Gen
era
l
Info
rmati
on
Overview of company details
Company size in terms of turnover?
Interviews & Desktop
Companies; Desktop research
Raw data
Company size in terms of tax contribution? Raw data
Range of services offered by the company? (% split between front/middle/back-office operations? Inbound and Outbound)
Raw data
Company growth stage? 3 (start up), growth (2), mature(1)

74
INDICATOR/MEASURE
QUESTIONS SOURCE PERSONS TO BE INTERVIEWED
RANK/SCORE
Overview on Industry Bodies/Representatives
What is the membership size and structure of the industry body/representative?
Interviews Industry bodies/representatives
Qualitative
What are the industry body/representative's roles and responsibilities?
Qualitative
How many members do you have this year compared to last year?
Qualitative
What percentage of the industry body/representatives are BPS operators, suppliers, etc?
Qualitative
What challenges are industry bodies/representatives facing getting new members to join? And what are you doing about it?
Qualitative

75
7.3. ANNEX C
Figure 33: SA's incentive competitiveness should incentives be extended to 5 year period
Source: Everest Group, 2013
Assumptions used to model incentives by Everest Group
Seats: A 500 seat centre undertaking transactional BPO work is assumed
Period: Historical assessment considers operations starting in April 2010. Current
assessment considers operations starting in April 2013. Cumulative incentives over
five year period thereafter considered for assessing at average annual per FTE
incentive
Ramp-up: The model assumes ramp up in 3 stages:
o Year 1: 100 jobs
o Year 2: 200 additional jobs
o Year 3: 200 Additional jobs
By end of year 3, the centre is assumed to be working at full capacity of 500 FTEs
The input data along with related duties and taxes, inflation is gathered from primary
and secondary research
Currency exchange rate: The exchange rate is taken to be the calendar year average,
i.e., Jan 1, 2010 to Dec 31, 2010 for 2010. For 2012, exchange rate is taken as the
average between Jan 1 2012 and Dec 31 2012
The mark-up to the cost or transfer pricing for the tax related exemption is country
specific
Amortization: The amortization is done over 4 years for fixtures and fit outs, and over 3
years for equipment
Inflation: Employee salary is assumed to increase as per wage inflation. Equipment
are assumed to be free of inflation whereas other costs (e.g., fit-outs, utilities, facilities)
– Average annual per FTE
incentive for transactional voice
BPO increases to ~US$2,3232
in case the incentives are
extended at current scale (i.e.,
ZAR24,000 per job as per the
incentive in FY2015-16 in
current program)
– Additional reduction of
~US$925 in annual operating
cost per FTE augments SA‟s
competitiveness since the
incentives become available for
full five year period, similar to
other locations
Annual per
FTE cost post incentive
2012; US$ „000
10-12
18-20
16-18
11-13
23-25
15-17
Cost gap with
South Africa pre incentive
2012; Percentage
60-65%
10-15%
55-60%
20-25%
Change in
cost gap1
2012
CC
%-(10-15)%
South
Africa
Kenya
Philippines
Country
Egypt
Poland
India
Cost gap with
South Africa post extended
incentive1
2012; Percentage
64-68%
10-15%
50-55%
15-20%
%-(18-22)%
1 With extended incentives. Refer page 35 for illustration of extended incentive calculation for South Africa2 As compared to ~US%1,596 when incentives are not extended. Refer page 17 and 19 for detail on incentive without extending the program
Additional reduction of ~US$925
in annual operating cost per FTE
Comments
Favorable Neutral Unfavorable
EXTENDED SCENARIO

76
have been assumed to increase with macro-economic inflation. Telecom costs are
assumed to reduce over the years
90% of equipment are assumed to have imported duties, training cost is assumed to
be 5% of salary cost for the employees
The Centre is assumed to be established in a favourable location within the country so
as to be able to avail the maximum incentives related to location
Incentives are calculated at a per FTE level based on the ramp up schedule assumed
Grade A, non-CBD rentals used to assess costs of leasing office space
Assessment conducted at a functional level with relevant resource pool for base skills
(e.g., transaction processing in voice BPO)
Assessment conducted for English language
Assessment reflects market average costs for steady state of operations
Following cities are considered for assessment
o South Africa: Johannesburg
o Egypt: Cairo
o Kenya; Nairobi
o Poland: Krakow
o Philippines: Metro Manila
o India: Delhi/NCR