implementation of data mining using naïve bayes
TRANSCRIPT
The IJICS (International Journal of Informatics and Computer Science) ISSN 2548-8384 (online)
Vol 3 No 2, September 2019 ISSN 2548-8449 (print)
Page 66 – 79
DOI 10.30865/ijics.v3i2.1391
Page | 66
The IJICS | Arif Senja Fitriani | http://ejurnal.stmik-budidarma.ac.id/index.php/ijics
Implementation of Data Mining Using Naïve Bayes Classification
Method To Predict Participation of Governor And Vocational
Governor Selection in Jemirahan Village, Jabon District
Arif Senja Fitrani1, Fajrillah2, Wirda Novarika3
1 Universitas Muhammadiyah Sidoarjo, Jl. Mojopahit No.666 B, Sidowayah, Celep, Kec. Sidoarjo, Kabupaten Sidoarjo, Jawa Timur 61271, Indonesia
2 Sekolah Tinggi Ilmu Ekonomi IBBI, Jl. Sei Deli No.18, Medan, Sumatera Utara 20236, Indonesia 3 Universitas Islam Sumatera Utara, Jl. Sisingamangaraja No.16, Medan, Sumatera Utara 20217
Email: [email protected], [email protected], [email protected]
Abstract−General Election (ELECTION) is an important political event to determine a leader in a democratic country. The
General Election (ELECTION) in East Java, which was held on June 27, 2018 yesterday was the election of the Governor and
Deputy Governor for the period 2019-2024. There are two pairs of candidates for Governor and Deputy Governor. Through
the General Election (ELECTION) then all parties can be accommodated what they want and aspire to so that a better life can be realized. The community is the determining component of the success or failure of an Election. Therefore, in this study, the
researcher wanted to examine how to participate in the election in Jemirahan Village, Gabon District by using the classification
method, the Naïve Bayes algorithm. To predict General Participation (PEMILU) in Jemirahan Village, Gabon District, it can
be done using the Naïve Bayes Algorithm with 6 predefined variables. The results of the prediction of participation from the data taken were 300 data divided by 2 namely 65% of 195 Training data and 35% of 105 Testing data.
Keywords: Data Mining, Classification, Naïve Bayes, Election Participation
1. INTRODUCTION
General Election (ELECTION) is an important political event to determine the leader in a democratic country.
Permanent Voter List (DPT) is a citizen who has been registered to vote at the Polling Station (TPS). There are
several problems related to the DPT including the General Election Commission (KPU) is difficult to get the NIK
from people who are in prison. With these problems, resulting in a lack of public participation to participate in this
election.
Therefore, in this study, the researcher wanted to examine how the electoral participation in Jemirahan
Village, Jabon District by using the classification method, the naïve Bayes algorithm. The focus of this study is to
predict the participation of the Governor and Deputy Governor in the Jemirahan Village, Gabon District, Sidoarjo
Regency. This research uses a qualitative research approach. Election data token is data from the General Election Commission (KPU) of Sidoarjo specifically in
Jemirahan Village, Jabon District. Data will be processed using the naïve Bayes classification method to find out
who participated in the election of the Governor and Deputy Governor in June 2018 in Jemirahan Village, Gabon
District.
2. THEORY
2.1 Election
General Election (ELECTION) is an activity to determine a leader from the Democratic State. Elections are also
very important in democracies that include a system of representation and work on it as a means of grouping
people's voices in representative institutions. Then a quick counting system is needed to find out who is
participating. [1]
Elections in Indonesia can be divided into 2 (two), namely:
1. New Order Election
This election began in 1955 and is the first General Election (ELECTION) held in the State of Indonesia.
2. Electoral Reform Era
The General Election process in 1997 and became a milestone in the reform era..
2.2 Data Mining
Data Mining is a data collection process that is processed by various methods. Another term for data mining is
knowledge-discovery in the database (KDD). The purpose of data mining is to utilize the data and process it to
obtain new and useful information.

The IJICS (International Journal of Informatics and Computer Science) ISSN 2548-8384 (online)
Vol 3 No 2, September 2019 ISSN 2548-8449 (print)
Page 66 – 79
DOI 10.30865/ijics.v3i2.1391
Page | 67
The IJICS | Arif Senja Fitriani | http://ejurnal.stmik-budidarma.ac.id/index.php/ijics
There are several types of data mining grouping according to [2]:
1. Description
To describe patterns in a data.
2. Estimation
The goal is more numerical than category, this estimation is almost similar to classification.
3. Predictions
The result of predictions is to show something that hasn't happened yet
4. Classification
The purpose of this classification is categorical
5. Clustering
Clustering is more towards grouping records or cases that have similar data
6. Association
To identify the relationship between events that occur at one time.
The data mining phase is interactive and the stages of data mining are divided into several stages including
[3]
Figure 1. Data Mining Stages
1. CleaningIs the process of removing / cleaning an inconsistent data.
2. Integration (integration)I s the merging of data from various databases into one new database
3. Selection (Selection) Data selection (data selection) Not all data in the database is used, only the data taken
is suitable for analysis.
4. Transformation
Data will be converted into a format that is suitable for the data mining process.
5. Data mining process
Is the most important process in the method used to find knowledge?
6. Pattern evaluation
Identify a unique and interesting pattern in the knowledge base
7. Knowledge presentation
It is a presentation of knowledge of the methods used to obtain the knowledge obtained by users.
2.3 Naïve Bayes Method
The Naïve Bayes method is a method for calculating probability values by adding up frequencies and combinations
of values from a dataset. Naïve Bayes is assumed as a simplification of the attribute value of the attributes that are
free if given output value. The advantage of using Naïve Bayes is that this method only requires two data: training
data and testing set to collect the data you want to obtain [4].
The Naïve Bayes' theorem is:
𝑃 (𝐻|𝑋) =𝑃(𝑋|𝐻)𝑃 (𝐻)
𝑃 (𝑋) (1)

The IJICS (International Journal of Informatics and Computer Science) ISSN 2548-8384 (online)
Vol 3 No 2, September 2019 ISSN 2548-8449 (print)
Page 66 – 79
DOI 10.30865/ijics.v3i2.1391
Page | 68
The IJICS | Arif Senja Fitriani | http://ejurnal.stmik-budidarma.ac.id/index.php/ijics
Informasi:
X : Data dengan kelas yang tidak diketahui
H : Data hipotesis yang merupakan kelas khusus
P (H | X): probabilitas hipotesis H berdasarkan kondisi X (probabilitas posterior)
P (H) : Hipotesis probabilitas H (probabilitas sebelumnya)
P (X | H): Probabilitas X didasarkan pada kondisi hipotesis H
P (X) : Probabilitas X
To explain a Naïve Bayes method it is necessary to know that in the classification process it requires
guidance to determine a class that is suitable for analysis.
2.4 Weka Tools
WEKA is a practical tool. WEKA is an acronym for the Waikato Environment for Knowledge Analysis, created
at the University of Waikato, New Zealand. WEKA can also be used at several different levels and contains tools
for preprocessing data, namely: classification, regression, grouping, association, and visualization. [6]
By presenting various algorithms to the WEKA tool, it can choose to choose the best and can solve a
problem. WEKA functions multi platform and can be used as a library in Java applications. In the development of
WEKA with version, 3.8 can manage large data using Hadoop and Spark. WEKA provides four (4) interfaces for
managing datasets, namely:
1. Explorer: used to find the right algorithm. All data will be loaded into memory
2. Experimentation: used to find suitable parameters. The process can be automated.
3. Knowledge flow: used to process data flow. The settings that can be carried out can organize and manage large
data collected.
4. Simple CLI (Command Line Interface)
3. METHODOLOGY
The design of the application of data mining application prediction of the participation of the Governor and Deputy
Governor election can be divided into the following stages, namely:
1. Classification diagram
2. Data Collection
3. Manual Calculation
4. WEKA Stages / User Interface Design
3.1 Classification Diagram
Figure 2. Classification diagram
3.2 Data Collection
Searching and collecting data is carried out first before conducting research. The following are the activities
carried out in searching and collecting data that support this research.
a. Study of literature
This method is carried out in a literature study on the application concept that will be used by finding data related
to population data for the General Election (ELECTION). The theory used comes from journal books and previous
research that supports problem-solving in the research to be conducted.

The IJICS (International Journal of Informatics and Computer Science) ISSN 2548-8384 (online)
Vol 3 No 2, September 2019 ISSN 2548-8449 (print)
Page 66 – 79
DOI 10.30865/ijics.v3i2.1391
Page | 69
The IJICS | Arif Senja Fitriani | http://ejurnal.stmik-budidarma.ac.id/index.php/ijics
b. Observation
The method of data collection is done by research in the Office of the General Election Commission (KPU)
Sidoarjo. So, with the data obtained, it can be implemented into the application system that is to be created.
3.2.1 Variables and Features
A variable is a collection of variables consisting of entities. The variables used for election data are 6 attributes.
While features are the contents of variables. Data that has been obtained from the General Election Commission
(KPU) can be known variables and features as follows:
Table 1. variables and Features
No. Variable Feature Description
1 Nama - Names, Categorical Features
2 Age Numerik
{17,18,19,20,20,21,22,23,24,25,
26,27,28,29,30,31,32,33,34,35,
36,37,38,39,40,41,42,43,44,45,
46,47,48,49,50,51,52,53,54,55,
56,57,58,59,60,61,62,63,64,65,
66,67,68,69,71,73,74,76,77,78,
80,83}
Age, Numeric Features
3 Gender Categorical {L, P} Male Female
4 Distance Categorical{J1, J2, J3} J1= 0-150 meterS,
J2= 150-200 meterS,
J3= >200 meterS
5 Marital status Categorical { B, S, P} B = Not married yet
S = Marriage
P = Never Married
6 Presence Categorical Present and Not Present
3.2.2 Flowchart
In understanding a table form with attributes and records, from there a solution is obtained. In general, the Naive
Bayes algorithm in the stages of determining solutions can be passed with the following picture:
Figure 3. Data Flowchart Training
The captions from Figure 3.2 are:
1. Read training data
2. Calculating the number and probability
3. Get Bayes values based on probability
4. Produce a solution

The IJICS (International Journal of Informatics and Computer Science) ISSN 2548-8384 (online)
Vol 3 No 2, September 2019 ISSN 2548-8449 (print)
Page 66 – 79
DOI 10.30865/ijics.v3i2.1391
Page | 70
The IJICS | Arif Senja Fitriani | http://ejurnal.stmik-budidarma.ac.id/index.php/ijics
Figure 4. Flowchart Data Testing
The description of Figure 3.3 is:
a. Test data input
b. Determine the prediction class
c. Get the results of trial data
3.2.3 Tools Weka
Following is the User Interface design created using the Weka GUI Chooser Tools.
Figure 5. Initial Display of WEKA Application
Figure 6. Display User Interface
4. DISCUSSION
Data obtained from the General Election Commission (KPU) Sidoarjo. The data will be tested using the Naive
Bayes classification method with Weka Tools and Website. The data set was taken as much as 300 data divided
by 2, as much as 65% of 195 training data and as much as 35% of 105 testing data.

The IJICS (International Journal of Informatics and Computer Science) ISSN 2548-8384 (online)
Vol 3 No 2, September 2019 ISSN 2548-8449 (print)
Page 66 – 79
DOI 10.30865/ijics.v3i2.1391
Page | 71
The IJICS | Arif Senja Fitriani | http://ejurnal.stmik-budidarma.ac.id/index.php/ijics
Table 2. Dataset
Table 3. Training Data
Table 4. Testing Data
4.1 Data
The data used are 300 data. The dataset is divided into two data, namely: Training Data and Data Testing. Training
Data is used by classification algorithms to form a classifier model. While Data Testing is used to measure the
extent to which the classifier managed to classify correctly.
4.1.2 Data Pre Processing
Unprocessed data is raw data, so it needs to be prepared in advance so that it can be used in the Data Mining
process.
4.2 Proses
The process used at this stage is to find out the results of the Naive Bayes classification calculation on the Weka
Tools and Website.
4.2.1 Tools Weka
Following is the User Interface design created using the Weka GUI Chooser Tools.
Set File Arff
a. Open file .csv
The first step is determining the distribution of Training data and Testing data with the CSV extension
b. Save .arff
Furthermore, each file is saved with the default file format of WEKA namely ARFF, the file will change to
the extension training.arff and testing.arff
No Nama Usia Jenis Kelamin Jarak Status Nikah Kehadiran
1 A ZAMZANI KURNIAWAN 33 L 0-150 meter B Hadir
2 ABD KHAFIF 19 L >200 meter B Tidak Hadir
3 ABD. KARIM AS'ARI 51 L >200 meter S Hadir
4 ABDUL ADIM 43 L >200 meter S Hadir
5 ABDUL HAKIM KURNIAWAN 22 L >200 meter B Hadir
6 ABDUL KADIR 60 L >200 meter S Hadir
7 ABDUL KHAKIM KURNIAWAN 22 L >200 meter B Tidak Hadir
8 ACH BAGUS FIRMAN KHAMALA 22 L 0-150 meter B Hadir
9 ACH BASORI 31 L 150-200 meter B Hadir
10 ACH SUGIYANTO 30 L 150-200 meter B Hadir
No Usia Jenis Kelamin Jarak Status Nikah Kehadiran1 33 L 0-150 meter B Hadir2 19 L >200 meter B Tidak Hadir3 51 L >200 meter S Hadir4 43 L >200 meter S Hadir5 22 L >200 meter B Hadir6 60 L >200 meter S Hadir7 22 L >200 meter B Tidak Hadir8 22 L 0-150 meter B Hadir9 31 L 150-200 meter B Hadir10 30 L 150-200 meter B Hadir
No Usia Jenis Kelamin Jarak Status Nikah Kehadiran1 54 P >200 meter S ?2 20 L >200 meter B ?3 39 P 150-200 meter S ?4 76 P 150-200 meter S ?5 61 L 150-200 meter S ?6 44 L >200 meter S ?7 71 P 150-200 meter S ?8 50 P >200 meter S ?9 42 P 150-200 meter S ?
10 27 P >200 meter S ?

The IJICS (International Journal of Informatics and Computer Science) ISSN 2548-8384 (online)
Vol 3 No 2, September 2019 ISSN 2548-8449 (print)
Page 66 – 79
DOI 10.30865/ijics.v3i2.1391
Page | 72
The IJICS | Arif Senja Fitriani | http://ejurnal.stmik-budidarma.ac.id/index.php/ijics
Set Training (Algoritma Naïve Bayes)
a. Open training set.arff
b. Choose Classify Naïve Bayes
To see what is produced by the probability of this training data, use the classification method with the Naïve
Bayes algorithm, at this stage of the process determining in the Classify tab, selecting the "Choose" option will
lead to the Classifier. Various methods will be presented in the sub menu available at WEKA. Where the
determination of sub menus in this study was directed at WEKA → Classify → Bayes → Naïve Bayes
c. Use Training Set
The next step is to determine the training test by selecting the "Test Options" → "Use Training Set" Then test
the testing data to determine the predicted participation of the Governor Election in Jemirahan Village, Gabon
District. d. Start Training Set
Select "Start" to begin processing the training set on the data that comes from training. arff
e. Save model
From the set of training set processes that are known to present the output of both text and graphics. The final
stage is first to save the "Save model" from the output of the "Classifier"
Figure 7. Save Model Data Training Results
Set Testing
By repeating the steps starting from "Open file" by specifying the training1. by file again and continue by selecting
the "Classify" tab to start the testing sets testing phase. The aim is to prove that the presentation of training data
that has been processed and ended by saving the process of training data results.
a. Open Training Set.arff
b. Choose Classify Naïve Bayes
To see what is produced by the probability of this training data, use the classification method with the Naïve
Bayes algorithm, at this stage of the process determining in the Classify tab, selecting the "Choose" option will
lead to the Classifier. Various methods will be presented in the sub menu available at WEKA. Where the
determination of sub menus in this study was directed at WEKA → Classify → Bayes → Naïve Bayes
c. Load Model

The IJICS (International Journal of Informatics and Computer Science) ISSN 2548-8384 (online)
Vol 3 No 2, September 2019 ISSN 2548-8449 (print)
Page 66 – 79
DOI 10.30865/ijics.v3i2.1391
Page | 73
The IJICS | Arif Senja Fitriani | http://ejurnal.stmik-budidarma.ac.id/index.php/ijics
Then call the training data that has been stored previously. With the aim to test data from testing data that is
ready. In the "Result list" right click select "Load Model" to call the data model.
d. Open File Testing.arff
e. Re-Evaluate Model On Current Test Set
The results of the testing1. earth data, which were previously saved are now displayed again after the call is
made and the results are displayed in the "Classifier Output". The final step, to test the test data is by right-
clicking on the "Result list", select evaluate model on current.
Figure 8. Results of data in "Classifier Output"
Website
Figure 9. Index Menu Display
The IJICS (International Journal of Informatics and Computer Science) ISSN 2548-8384 (online)
Vol 3 No 2, September 2019 ISSN 2548-8449 (print)
Page 66 – 79
DOI 10.30865/ijics.v3i2.1391
Page | 74
The IJICS | Arif Senja Fitriani | http://ejurnal.stmik-budidarma.ac.id/index.php/ijics
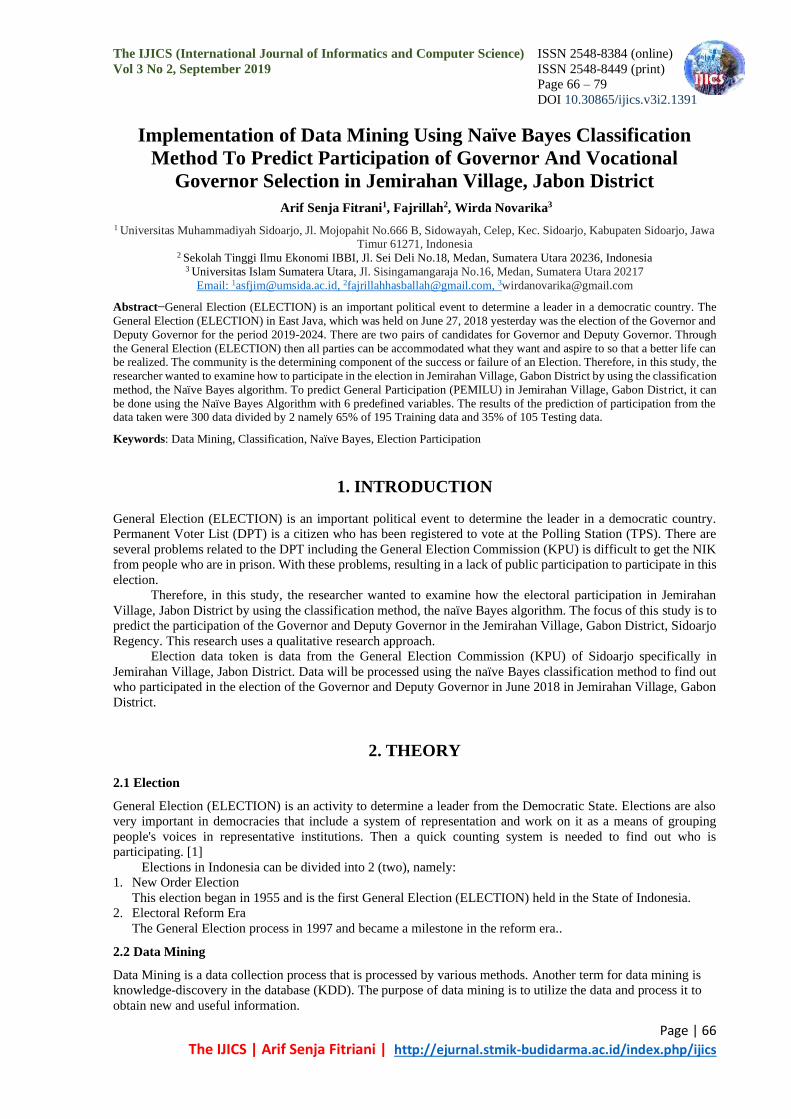
1. After that, retrieve the database with the extension.csv /.Off
Figure 10. Display of Dataset Files
2. Select the classify method, flat Naïve Bayes Algorithm then select the Dataset file and Testing data then
choose submit
Figure 11. Classify Views
Wait a while until the classification results display
Figure 12. Display of Naïve Bayes Classification Results
Figure 12. Display of Test Results
Calculate the Amount and Probability
To calculate the probability of target / class data we need to know the amount of data first. From the case studies
that were raised namely in determining the presence and absence of elections for the Governor and Deputy
Governor based on the age of 17 to 83 years. The number of probabilities is taken as much as 300 election data,
and the data is called a data set.
Note: Total : 300 Number of attendance : 285
Number of Missing : 15
Probability of Present
P (H | data)

The IJICS (International Journal of Informatics and Computer Science) ISSN 2548-8384 (online)
Vol 3 No 2, September 2019 ISSN 2548-8449 (print)
Page 66 – 79
DOI 10.30865/ijics.v3i2.1391
Page | 75
The IJICS | Arif Senja Fitriani | http://ejurnal.stmik-budidarma.ac.id/index.php/ijics
= Amount of target data Present/Amount of target data
=285/300
= 0,95
Probability Not Present
P (H | data)
= Amount of target data Not Available / Amount of target data
=15/300
= 0,05
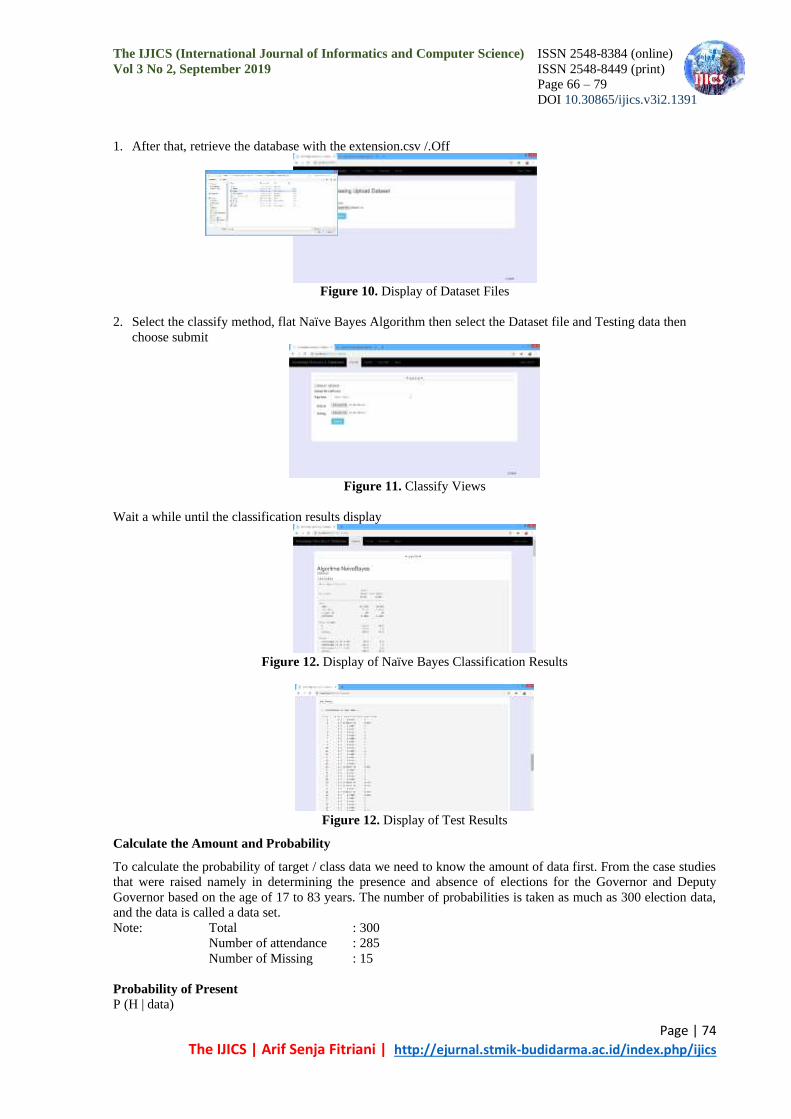
Table 5. Probability of Training Data
Probability Present Not present
P (Present / Not
Present) 0,9384615 0,0615385
JUMLAH 1
P (Age | data)
17 0,0218579 0,0833333
18 0,0382514 0,0833333
19 0,010929 0,25
20 0,0218579 0,25
21 0,0273224 0,25
22 0,0273224 0,0833333
23 0,010929 0
24 0,010929 0
25 0,0218579 0
26 0,0382514 0
27 0,0163934 0
28 0,0163934 0
29 0,0218579 0
30 0,0437158 0
31 0,0163934 0
32 0,0218579 0
33 0,0273224 0
34 0,0054645 0
35 0,0218579 0
36 0,0382514 0
37 0,010929 0
38 0 0
39 0,0218579 0
40 0,0163934 0
41 0,0327869 0
42 0,0218579 0
43 0,0327869 0
44 0,0273224 0
45 0,0218579 0
46 0,0163934 0
47 0,0273224 0
48 0,0218579 0
49 0,0218579 0
50 0,0327869 0
51 0,0218579 0
52 0,0163934 0
53 0,0218579 0
54 0,0218579 0
The IJICS (International Journal of Informatics and Computer Science) ISSN 2548-8384 (online)
Vol 3 No 2, September 2019 ISSN 2548-8449 (print)
Page 66 – 79
DOI 10.30865/ijics.v3i2.1391
Page | 76
The IJICS | Arif Senja Fitriani | http://ejurnal.stmik-budidarma.ac.id/index.php/ijics
55 0,0273224 0
56 0,0163934 0
57 0,0054645 0
58 0,0054645 0
59 0,0054645 0
60 0,0163934 0
61 0 0
62 0,0218579 0
63 0,010929 0
64 0,0054645 0
65 0 0
66 0,0054645 0
67 0,0054645 0
68 0 0
69 0,0054645 0
71 0 0
73 0 0
74 0,0054645 0
76 0 0
77 0,0054645 0
78 0,0054645 0
80 0 0
83 0,0054645 0
AMOUNT 1 1
P (Gender | data)
L 0,5136612 0,5833333
P 0,4863388 0,4166667
AMOUNT 1 1
P (Address | data)
Kademangan rt.09
rw.04 0,3442623 0,3333333
Kademangan rt.10
rw.04 0,3551913 0,25
Kademangan rt.11
rw.04 0,3005464 0,4166667
AMOUNT 1 1
P (Marital Status |
data)
B 0,3606557 0
S 0,5737705 0
P 0,0655738 0
AMOUNT 1 0
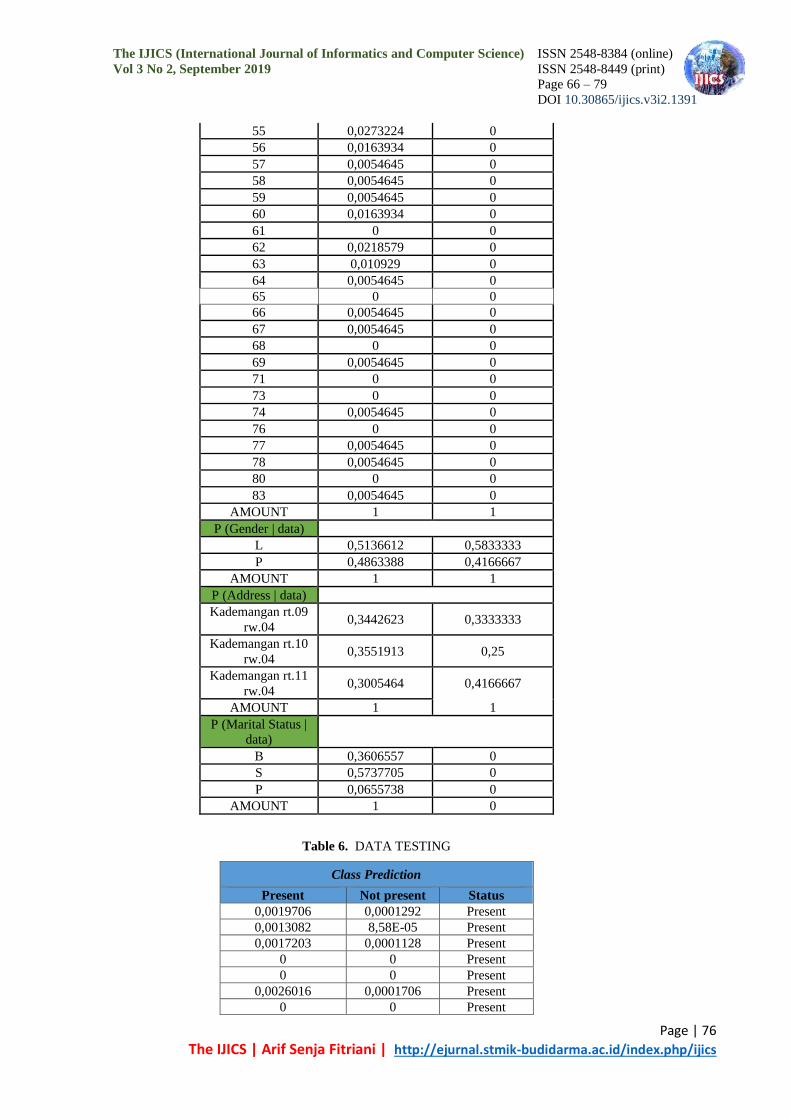
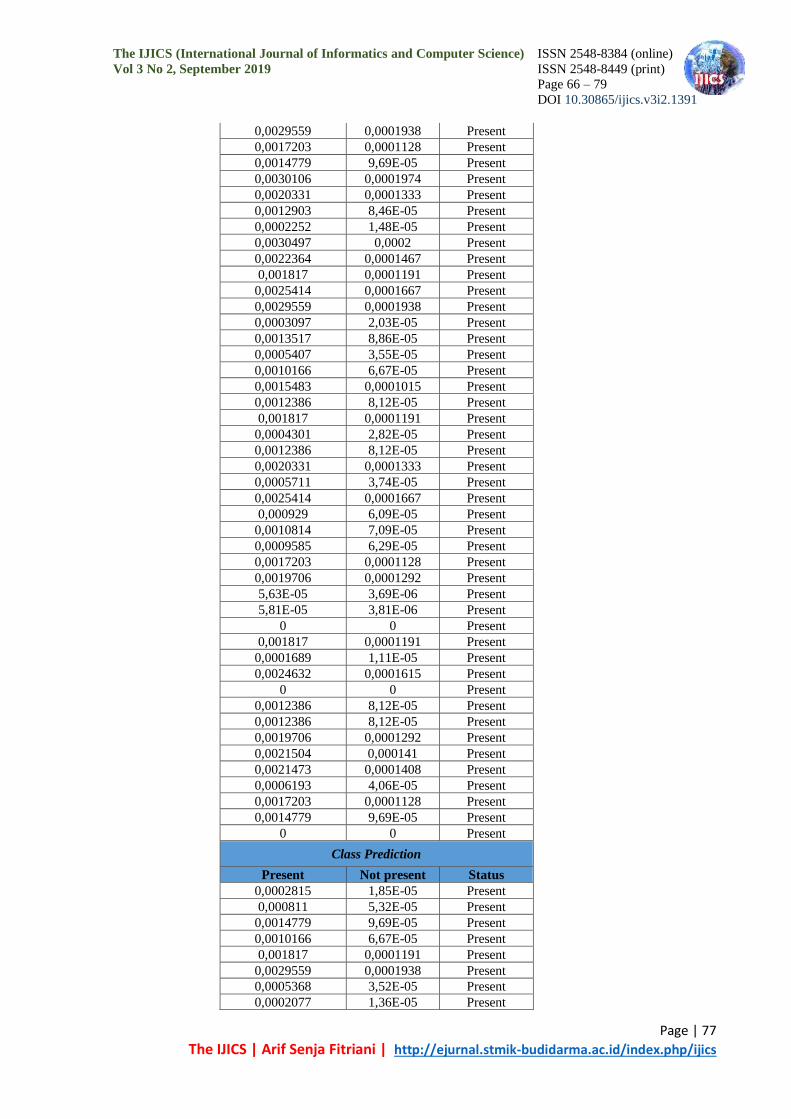
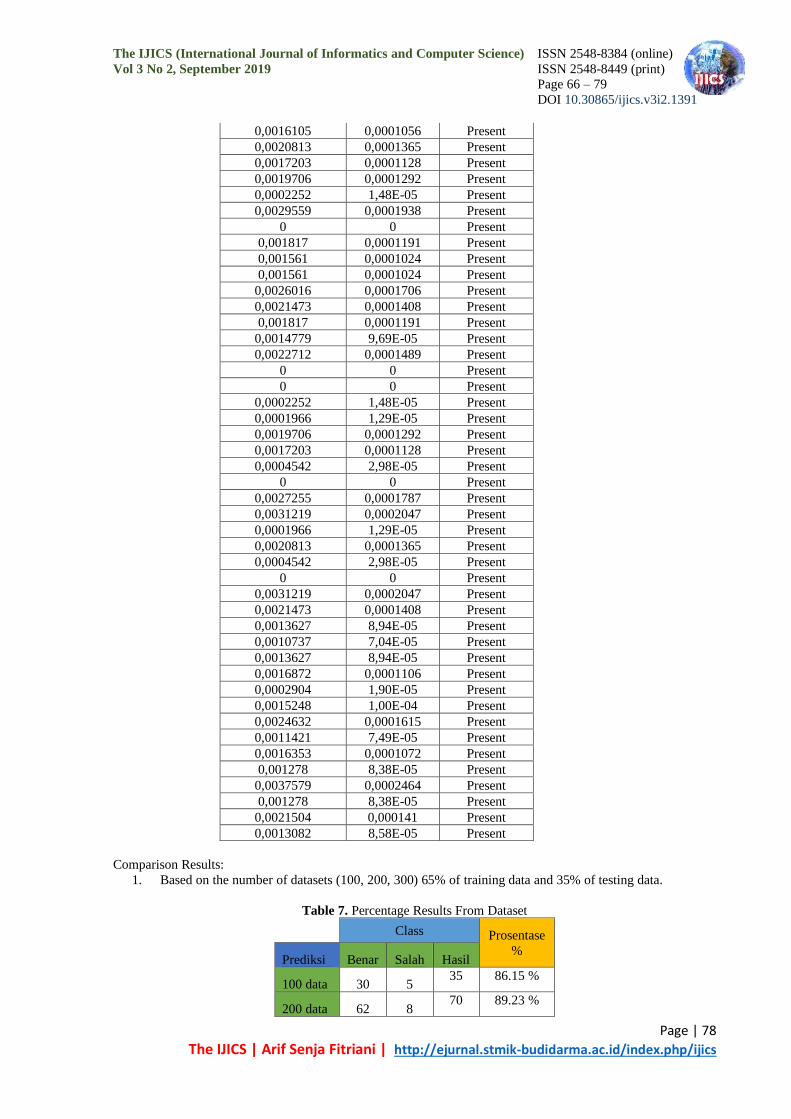
Table 6. DATA TESTING
Class Prediction
Present Not present Status
0,0019706 0,0001292 Present
0,0013082 8,58E-05 Present
0,0017203 0,0001128 Present
0 0 Present
0 0 Present
0,0026016 0,0001706 Present
0 0 Present
The IJICS (International Journal of Informatics and Computer Science) ISSN 2548-8384 (online)
Vol 3 No 2, September 2019 ISSN 2548-8449 (print)
Page 66 – 79
DOI 10.30865/ijics.v3i2.1391
Page | 77
The IJICS | Arif Senja Fitriani | http://ejurnal.stmik-budidarma.ac.id/index.php/ijics
0,0029559 0,0001938 Present
0,0017203 0,0001128 Present
0,0014779 9,69E-05 Present
0,0030106 0,0001974 Present
0,0020331 0,0001333 Present
0,0012903 8,46E-05 Present
0,0002252 1,48E-05 Present
0,0030497 0,0002 Present
0,0022364 0,0001467 Present
0,001817 0,0001191 Present
0,0025414 0,0001667 Present
0,0029559 0,0001938 Present
0,0003097 2,03E-05 Present
0,0013517 8,86E-05 Present
0,0005407 3,55E-05 Present
0,0010166 6,67E-05 Present
0,0015483 0,0001015 Present
0,0012386 8,12E-05 Present
0,001817 0,0001191 Present
0,0004301 2,82E-05 Present
0,0012386 8,12E-05 Present
0,0020331 0,0001333 Present
0,0005711 3,74E-05 Present
0,0025414 0,0001667 Present
0,000929 6,09E-05 Present
0,0010814 7,09E-05 Present
0,0009585 6,29E-05 Present
0,0017203 0,0001128 Present
0,0019706 0,0001292 Present
5,63E-05 3,69E-06 Present
5,81E-05 3,81E-06 Present
0 0 Present
0,001817 0,0001191 Present
0,0001689 1,11E-05 Present
0,0024632 0,0001615 Present
0 0 Present
0,0012386 8,12E-05 Present
0,0012386 8,12E-05 Present
0,0019706 0,0001292 Present
0,0021504 0,000141 Present
0,0021473 0,0001408 Present
0,0006193 4,06E-05 Present
0,0017203 0,0001128 Present
0,0014779 9,69E-05 Present
0 0 Present
Class Prediction
Present Not present Status
0,0002815 1,85E-05 Present
0,000811 5,32E-05 Present
0,0014779 9,69E-05 Present
0,0010166 6,67E-05 Present
0,001817 0,0001191 Present
0,0029559 0,0001938 Present
0,0005368 3,52E-05 Present
0,0002077 1,36E-05 Present
The IJICS (International Journal of Informatics and Computer Science) ISSN 2548-8384 (online)
Vol 3 No 2, September 2019 ISSN 2548-8449 (print)
Page 66 – 79
DOI 10.30865/ijics.v3i2.1391
Page | 78
The IJICS | Arif Senja Fitriani | http://ejurnal.stmik-budidarma.ac.id/index.php/ijics
0,0016105 0,0001056 Present
0,0020813 0,0001365 Present
0,0017203 0,0001128 Present
0,0019706 0,0001292 Present
0,0002252 1,48E-05 Present
0,0029559 0,0001938 Present
0 0 Present
0,001817 0,0001191 Present
0,001561 0,0001024 Present
0,001561 0,0001024 Present
0,0026016 0,0001706 Present
0,0021473 0,0001408 Present
0,001817 0,0001191 Present
0,0014779 9,69E-05 Present
0,0022712 0,0001489 Present
0 0 Present
0 0 Present
0,0002252 1,48E-05 Present
0,0001966 1,29E-05 Present
0,0019706 0,0001292 Present
0,0017203 0,0001128 Present
0,0004542 2,98E-05 Present
0 0 Present
0,0027255 0,0001787 Present
0,0031219 0,0002047 Present
0,0001966 1,29E-05 Present
0,0020813 0,0001365 Present
0,0004542 2,98E-05 Present
0 0 Present
0,0031219 0,0002047 Present
0,0021473 0,0001408 Present
0,0013627 8,94E-05 Present
0,0010737 7,04E-05 Present
0,0013627 8,94E-05 Present
0,0016872 0,0001106 Present
0,0002904 1,90E-05 Present
0,0015248 1,00E-04 Present
0,0024632 0,0001615 Present
0,0011421 7,49E-05 Present
0,0016353 0,0001072 Present
0,001278 8,38E-05 Present
0,0037579 0,0002464 Present
0,001278 8,38E-05 Present
0,0021504 0,000141 Present
0,0013082 8,58E-05 Present
Comparison Results:
1. Based on the number of datasets (100, 200, 300) 65% of training data and 35% of testing data.
Table 7. Percentage Results From Dataset
Class Prosentase
% Prediksi Benar Salah Hasil
100 data 30 5 35 86.15 %
200 data 62 8 70 89.23 %

The IJICS (International Journal of Informatics and Computer Science) ISSN 2548-8384 (online)
Vol 3 No 2, September 2019 ISSN 2548-8449 (print)
Page 66 – 79
DOI 10.30865/ijics.v3i2.1391
Page | 79
The IJICS | Arif Senja Fitriani | http://ejurnal.stmik-budidarma.ac.id/index.php/ijics
300 data 92 13 105 87.69 %
2. Based on the number of each attribute (age, sex, distance, marital status)
Table 8. Percentage Result Attributes
Class Prosentase
% Prediksi Benar Salah Hasil
Usia 4 101 105 4.06%
Jenis
Kelamin 100 5
105 100%
Jarak 44 61 105 100%
Status
Nikah 100 5
105 100%
3. Based on the calculation tools weka, website, and manual
Table 9. Percentage Results From (tools, website, and manual)
Class Prosentase
% Prediction Correct False Results
Weka 92 13 105 87.69 %
Website 96 9 105 91.66%
Manual 102 3 105 97%
From the Naïve Bayes algorithm method, the predicted results of the 2018 Governor and Deputy Governor Election
attendance level are 97% (102) data states are true and 3% (3) is incorrect.
5. CONCLUSION
From the research that has been done, it can be concluded:
1. To predict the participation of the General Election (PEMILU) in Jemirahan Village, Jabon District, it can be
done using the Naïve Bayes Algorithm with 10 predefined variables.
2. Prediction results of election participation from the dataset taken are 300 data divided by 2, namely 56% of
195 Training data and 35% of 105 Testing data.
3. Prediction results are based on the presence attribute set. For the presence of 105 data, a 97% prediction value
is obtained and a 3% prediction value is obtained.
REFERENCES
[1] Raden, I., & Lampung, I. (2016). 3 1,2,3, 7(2), 135–152.
[2] Amelia, M. W., Lumenta, A. S. M., & Jacobus, A. (2017). Prediksi Masa Studi Mahasiswa Dengan
Menggunakan Algoritma Naive Bayes. E-Journal Teknik Informatika, 11(1).
[3] Ridwan, M., Suyono, H., & Sarosa, M. (2013). Jurnal Pak Agung, 7(1), 59–64.
Https://Doi.Org/10.1038/Hdy.2009.180
[4] Yos, J. K. L., Km, S., & Mulia, T. (2016). Penerapan Data Mining Dengan Metode Klasifikasi Naïve Bayes
Untuk Memprediksi Kelulusan Mahasiswa Dalam Mengikuti English Proficiency Test ( Studi Kasus :
Universitas Potensi Utama ) Penerapan Data Mining Dengan Metode Klasifikasi Naïve Mengikuti English ,
(February 2015).
[5] Lena, A. R. K. (2008). Pengertian PHP Dan Mysql. Ilmu Teknologi Informasi, 2–3.
[6] Pujiono, S., Amborowati, A., Suyanto, M., & Kunci, K. (2013). Analisis Kepuasan Publik Menggunakan
Weka Dalam Mewujudkan, 14(2).