implementation of emerging technologies: treatment capability … · ii minutes of contact time. in...
TRANSCRIPT

Implementation of Emerging Technologies:
Treatment Capability of Peracetic Acid and Ultraviolet Irradiation
by
Samantha Cooper
A Thesis Presented in Partial Fulfillmentof the Requirements for the Degree
Master of Science
Approved March 2017 by theGraduate Supervisory Committee:
Morteza Abbaszadegan, ChairPeter Fox
Absar Alum
ARIZONA STATE UNIVERSITY
May 2017
i
ABSTRACT
Advanced oxidation processes (AOP’s) are water/wastewater treatment processes
simultaneously providing disinfection and potential oxidation of contaminants that may
cause long-term adverse health effects in humans. One AOP involves injecting peracetic
acid (PAA) upstream of an ultraviolet (UV) irradiation reactor.
Two studies were conducted, one in pilot-scale field conditions and another under
laboratory conditions. A pilot-scale NeoTech UV reactor (rated for 375 GPM) was used
in the pilot study, where a smaller version of this unit was used in the laboratory study
(20 to 35 GPM). The pilot study analyzed coliform disinfection and also monitored water
quality parameters including UV transmittance (UVT), pH and chlorine residual. Pilot
study UV experiments indicate the unit is effectively treating flow streams (>6 logs total
coliforms) twice the 95% UVT unit capacity (750 GPM or 17 mJ/cm2 UV Dose). The
results were inconclusive on PAA/UV inactivation due to high data variability and field
operation conditions creating low inlet concentrations.
Escherichia coli (E. coli) bacteria and the enterobacteria phage P22—a surrogate
for enteric viruses—were analyzed. UV inactivated >7.9 and 4 logs of E. coli and P22
respectively at a 16.8 mJ/cm2 UV dose in test water containing a significant organics
concentration. When PAA doses of 0.25 and 0.5 mg/L were injected upstream of UV at
approximately the same UV Dose, the average E.coli log inactivation increased to >8.9
and >9 logs respectively, but P22 inactivation decreased to 2.9 and 3.0 logs, respectively.
A bench-scale study with PAA was also conducted for 5, 10 and 30 minutes of contact
time, where 0.25 and 0.5 mg/L had <1 log inactivation of E. coli and P22 after 30

ii
minutes of contact time. In addition, degradation of the chemical N-
Nitrosodimethylamine (NDMA) in tap water was analyzed, where UV degraded NDMA
by 48 to 97% for 4 and 0.5 GPM flowrates, respectively. Adding 0.5 mg/L PAA
upstream of UV did not significantly improve NDMA degradation.
The results under laboratory conditions indicate that PAA/UV have synergy in the
inactivation of bacteria, but decrease virus inactivation. In addition, the pilot study
demonstrates the applicability of the technology for full scale operation.

iii
DEDICATION
In loving memory of my grandfather, Stephen Moulton.

iv
ACKNOWLEDGMENTS
This thesis would not have been possible without the help of my committee members,who provided expert advice on performing these experiments. Dr. MortezaAbbaszadegan and Dr. Absar Alum gave their time to assist me with experimental set-up,procedure and to discuss next steps.
I want to especially thank my fellow graduate student, Majid Nikougoftar Zarif, forperforming the P22 bacteriophage experiments, assisting with experimental set-up/clean-up and helping with a variety of other tasks around the lab.
Thank you to Ivo Hrabovsky and Laura McCasland at the City of Scottsdale for assistingwith the NDMA analysis.
I would like to thank NeoTech Aqua Solutions, Inc. for providing the NeoTech UV unitsused in both the pilot and laboratory studies. Thank you to Solvay for sending a researchsample of peracetic acid.
Thank you also to Dr. Teresa Valentine and Wesley Boerm for the opportunity to workon the pilot study as well as assisting on required supplies for performing experiments.
Finally, I must express my very profound gratitude to my family and my fiancé forproviding continuous encouragement throughout my years of study and for lending an earto listen to me discuss this research with them.

v
TABLE OF CONTENTS
Page
LIST OF TABLES………………………………………………………………………viii
LIST OF FIGURES …………………………………………………………………….....x
PREFACE………………………………………………………………………………..xii
CHAPTER
1 INTRODUCTION…………………………………………………………......1
2 BACKGROUND LITERATURE……………………………………………..6
2.1 Advanced Oxidation Processes (AOP’s)…………………………............. 6
2.1.1 Hydrogen Peroxide (H2O2)/UV Advanced Oxidation……………… 8
2.2 Peracetic Acid (PAA)…………………………………………………...…9
2.2.1 Effectiveness of PAA as A Primary Disinfectant……………….….13
2.3 Ultraviolet (UV) Disinfection System…………………………………....14
2.4 Effectiveness of PAA Upstream of UV Reactor…………………………15
2.5 Microorganisms Used in the Study……………………………………....18
2.5.1 Escherichia coli (E. coli)………………………………………......18
2.5.2 P22 Bacteriophage………………………………………………....19
2.6 N-Nitrosodimethylamine (NDMA)…………………………………..…..20
3 METHODOLOGY……………………………………………………..….....23
3.1 Materials……………………………………………………………….....23
3.1.1 Description of NeoTech UV Unit………………………………….23
3.1.1.1 NeoTech UV Unit Used in Pilot Scale Study…………..…… 23
3.1.1.2 NeoTech UV Unit Used in Laboratory Study………….…….24

vi
CHAPTER Page
3.1.2 Peracetic Acid (PAA)………………………………………….......26
3.1.3 Microbial Culture and Media………………………………………26
3.2 Pilot Scale Study……………….……………………………………..….29
3.2.1 Set-Up……………………………………………………………...30
3.2.2 Testing Matrix……………………………………………………...31
3.2.3 Pilot Study Experimental Procedure……………………………….34
3.3 Laboratory Experimental Set-Up…………………………………….......34
3.3.1 Laboratory Scale UV Unit………………………………….……...36
3.3.2 Pumps…………………………………………………………...….36
3.3.3 Inlet and Outlet Barrels………………………………………….…37
3.3.4 Chemical Feed Pump and Injection Port…………....……..…….....37
3.3.5 Testing Matrix…………………………………………………..….37
3.4 Laboratory Scale Experimental Procedure…………………………….....38
3.4.1 Microbial Inactivation by UV…………..……………………….....39
3.4.2 Microbial Inactivation by PAA/UV………………..…….……..….40
3.4.3 Microbial Inactivation by PAA…………….…………….……..….41
3.4.4 NDMA Removal by UV and PAA/UV……………………..…..…42
3.5 Data Analysis………………………………………………………….…42
4 RESULTS…………………………………………………………………… 45
4.1 UV Only Inactivation of E. coli, Total Coliform and P22
Bacteriophage…………………………………………..…………… 45
4.1.1 Pilot Study Results………………………….……………………...45

vii
CHAPTER Page
4.1.2 Laboratory Study Results…………….…….…………………..…..51
4.2 PAA/UV Inactivation of E. coli, Total Coliform and P22
Bacteriophage.……………………………………………………….….. 54
4.2.1 Pilot Study Results…………………………………...………….....54
4.2.2 Laboratory Study Results………….……………………………….59
4.2.2.1 Water Quality and PAA Inlet/Residual Testing……….....62
4.3 PAA Only Inactivation of E. coli and P22 Bacteriophage………….........65
4.3.1 Pilot Study Results…………………………………………….…...65
4.3.2 Laboratory Study Results……………………………………….….66
4.4 NDMA Removal by UV and PAA/UV…………………….…………….71
5 DISCUSSION……………………………………………………………......74
REFERENCES…………………………………………………………………………...82
APPENDIX
A SOLVAY PERACETIC ACID MATERIAL SAFETY DATA SHEET
PROXITANE WW-12…………………………………………………………...86
B CALCULATIONS OF FEED RATE AND DILUTION FOR INTENDED PAA
DOSES…………………………………………………………………………...92
C HACH TEST PROCEDURE TO MEASURE PERACETIC ACID (PAA)…...101
BIOGRAPHICAL SKETCH…………………………………………………...103
viii
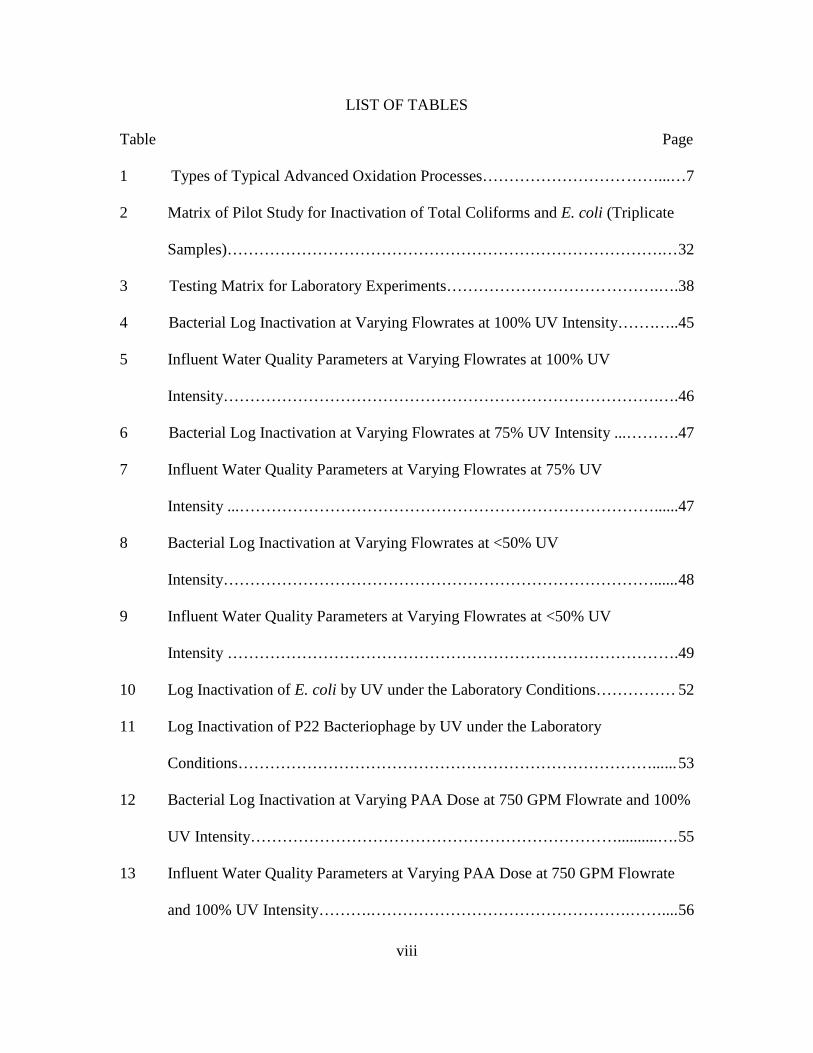
LIST OF TABLES
Table Page
1 Types of Typical Advanced Oxidation Processes……………………………...…7
2 Matrix of Pilot Study for Inactivation of Total Coliforms and E. coli (Triplicate
Samples)……………………………………………………………………….…32
3 Testing Matrix for Laboratory Experiments………………………………….….38
4 Bacterial Log Inactivation at Varying Flowrates at 100% UV Intensity…….…..45
5 Influent Water Quality Parameters at Varying Flowrates at 100% UV
Intensity……………………………………………………………………….….46
6 Bacterial Log Inactivation at Varying Flowrates at 75% UV Intensity ...……….47
7 Influent Water Quality Parameters at Varying Flowrates at 75% UV
Intensity ...……………………………………………………………………......47
8 Bacterial Log Inactivation at Varying Flowrates at <50% UV
Intensity………………………………………………………………………......48
9 Influent Water Quality Parameters at Varying Flowrates at <50% UV
Intensity ………………………………………………………………………….49
10 Log Inactivation of E. coli by UV under the Laboratory Conditions…………… 52
11 Log Inactivation of P22 Bacteriophage by UV under the Laboratory
Conditions……………………………………………………………………......53
12 Bacterial Log Inactivation at Varying PAA Dose at 750 GPM Flowrate and 100%
UV Intensity……………………………………………………………..........….55
13 Influent Water Quality Parameters at Varying PAA Dose at 750 GPM Flowrate
and 100% UV Intensity……….………………………………………….……....56

ix
Table Page
14 Bacterial Log Inactivation at 2 ppm PAA Dose at 750 and 1,000 GPM Flowrates
and 50% UV Intensity…………………..………...…….…………………….….57
15 Influent Water Quality Parameters 2 ppm PAA Dose at 750 and 1,000 GPM
Flowrates and 50% UV Intensity………..................……..……………….…..…58
16 Log Inactivation of E. coli by PAA/UV under the Laboratory Conditions at High
Flowrate (20 GPM) and PAA Doses of 0.5 and 0.25 mg/L….………..………....60
17 Log Inactivation of P22 Bacteriophage by PAA/UV under the Laboratory
Conditions at High Flowrate (20 GPM) and PAA Doses of 0.5 and 0.25
mg/L…...................................................................................................................61
18 PAA Inlet and Residual Measured Concentrations for the PAA/UV Tests under
the Laboratory Conditions ……………………………..…………………..….... 63
19 Measured UVT and DOC for the PAA/UV Tests under the Laboratory
Conditions………………………………………………………………………..64
20 Measured Inlet and Outlet pH for the PAA/UV Tests under the Laboratory
Conditions ……………………………………………………………….…..…. .65
21 Log Inactivation of E. coli by PAA under the Laboratory Conditions……....…..67
22 Log Inactivation of P22 Bacteriophage by PAA under the Laboratory
Conditions………………………………………………………...………..…….69
23 NDMA Removal by UV and PAA/UV at 0.5 and 4 GPM Flowrates …..…...…. 72

x
LIST OF FIGURES
Figure Page
1 Peracetic Acid (PAA) Chemical Structure………………………………..………9
2 PAA Dose and UV Dose Total Coliform Log Inactivation with
Isocost Curves (Caretti and Lubello, 2003)……………………………………... 17
3 Pilot Study NeoTech Inline Magnum UV Unit Schematic……………….……...24
4 Close-Up View of Laboratory Scale NeoTech UV Unit (D222)………………...25
5 Close-Up View of Laboratory Scale UV Unit Control Box………..………........26
6 E. coli Colonies on Brilliance Media………………………………………….…28
7 Plaques Created by P22 Bacteriophage….……………………………….….…..29
8 Plot Study Site Layout…………………..…..…………………………..………...31
9 Laboratory Set-Up of Laboratory NeoTech UV Unit, Inlet/Outlet Barrels, Pump,
Piping and Fittings………………………………………………………..…..… 35
10 Process Flow Schematic for Laboratory Studies…….…….……..………….…..36
11 Log Inactivation of Total Coliform and E. coli for UV Pilot Study
Experiments (100%, 75%, <50% UV Intensity)……….……………………..….50
12 Log Inactivation of E. coli and P22 Bacteriophage by UV under the Laboratory
Conditions……………………………………………………….…………….…54
13 Log Inactivation of Total Coliform and E. coli for PAA/UV Pilot Study
Experiments…………………………………………………………………...… 59
14 Log Inactivation of E. coli and P22 Bacteriophage by PAA/UV under the
Laboratory Conditions ………………………………….…….……………..….. 62

xi
Figure Page
15 Log Inactivation of E. coli and P22 Bacteriophage by PAA under the Laboratory
Conditions……………………………..……………………………………..….. 71
16 Percent NDMA Removal for UV and 0.5 mg/L PAA/UV for 0.5 and 4 GPM
Flowrates …………………………………….……………………………..……73

xii
PREFACE
The research discussed in the following pages was conducted in two different locations.
The pilot study was conducted at the Global Water Palo Verde Water Reclamation Plant
located in Maricopa, Arizona. The study was a joint contribution that lasted from July
2015 to October 2015 and included Valentine Environmental Engineers, LLC, Hennesy
Mechanical Sales, Inc., NeoTech Aqua Solutions, Inc. and Global Water. The results of
this study are included in the thesis with the permission of NeoTech Aqua Solutions, Inc.
Separately, additional Master’s thesis laboratory research was conducted at
Arizona State University beginning in April 2016 and ending in March 2017. The
research was conducted in Dr. Morteza Abbaszadegan’s laboratory on the 3rd floor of
Interdisciplinary Science & Technology Building IV.

1
CHAPTER 1
INTRODUCTION
Clean water is a basic necessity of living organisms; however, the availability of clean
water is decreasing over time as more water sources become polluted from human-related
activity. For this reason, there is an increasing need to develop cost-effective methods to
treat water sources in order to remove pollutants responsible for adverse health effects in
organisms. These pollutants include both microbiological and chemical contaminants,
where each type of contaminant presents treatment challenges. Traditionally, the methods
reported for effective removal/inactivation of microbial and chemical contaminants have
been separated into different treatment technologies, and in many cases this causes a
comprehensive treatment process to be less cost effective. Some research has indicated a
type of process that may be able to provide adequate disinfection of microorganisms,
while also degrading chemical contaminants. This series of processes, known as
advanced oxidation processes (AOP’s), are currently being studied for their treatment
capability.
Disinfection is a vital process in water and wastewater treatment. Disinfection
reduces the risk of waterborne diseases by inactivating pathogenic microorganisms.
There are various types of disinfection methods used in the field including chlorine
injection and ultraviolet irradiation. The United States Environmental Protection Agency
(U.S EPA) has provided literature to discuss the advantages and disadvantages of
chlorine disinfection (U.S EPA, 1999a) and ultraviolet irradiation (U.S EPA, 1999b),
which are briefly discussed in the following paragraphs.
2
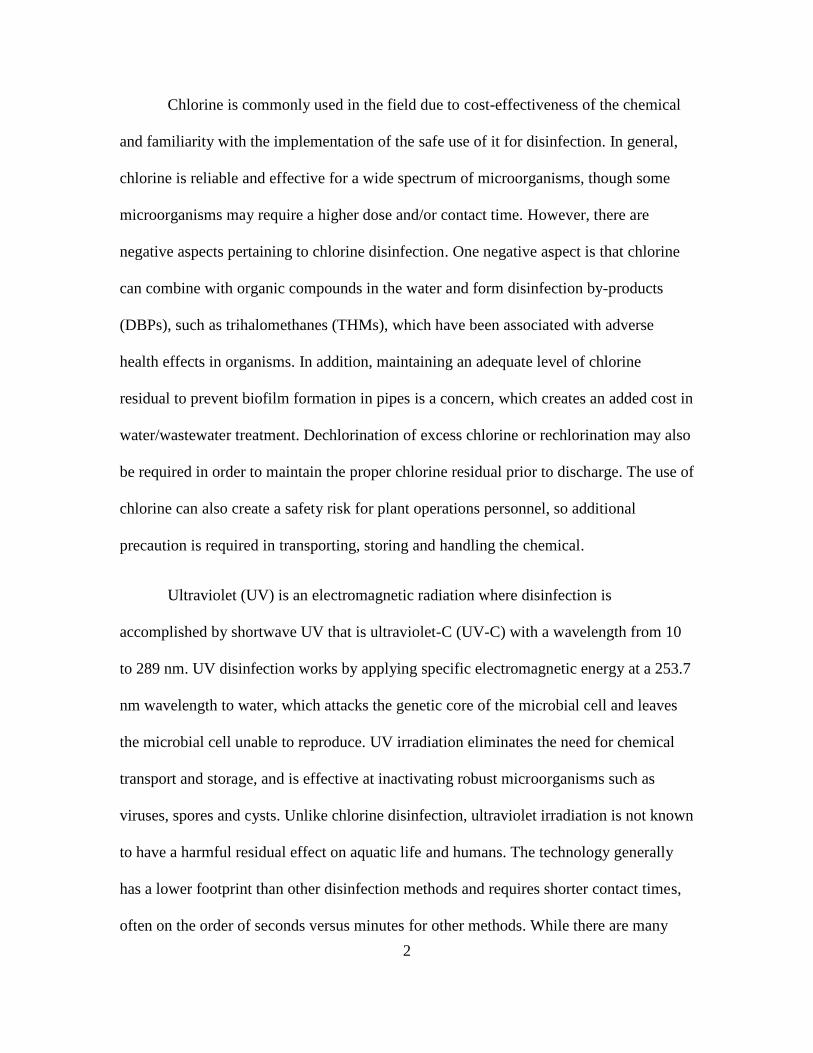
Chlorine is commonly used in the field due to cost-effectiveness of the chemical
and familiarity with the implementation of the safe use of it for disinfection. In general,
chlorine is reliable and effective for a wide spectrum of microorganisms, though some
microorganisms may require a higher dose and/or contact time. However, there are
negative aspects pertaining to chlorine disinfection. One negative aspect is that chlorine
can combine with organic compounds in the water and form disinfection by-products
(DBPs), such as trihalomethanes (THMs), which have been associated with adverse
health effects in organisms. In addition, maintaining an adequate level of chlorine
residual to prevent biofilm formation in pipes is a concern, which creates an added cost in
water/wastewater treatment. Dechlorination of excess chlorine or rechlorination may also
be required in order to maintain the proper chlorine residual prior to discharge. The use of
chlorine can also create a safety risk for plant operations personnel, so additional
precaution is required in transporting, storing and handling the chemical.
Ultraviolet (UV) is an electromagnetic radiation where disinfection is
accomplished by shortwave UV that is ultraviolet-C (UV-C) with a wavelength from 10
to 289 nm. UV disinfection works by applying specific electromagnetic energy at a 253.7
nm wavelength to water, which attacks the genetic core of the microbial cell and leaves
the microbial cell unable to reproduce. UV irradiation eliminates the need for chemical
transport and storage, and is effective at inactivating robust microorganisms such as
viruses, spores and cysts. Unlike chlorine disinfection, ultraviolet irradiation is not known
to have a harmful residual effect on aquatic life and humans. The technology generally
has a lower footprint than other disinfection methods and requires shorter contact times,
often on the order of seconds versus minutes for other methods. While there are many

3
advantages to UV irradiation, UV treatment capability is highly dependent on water
quality and photoreactivation/dark repair can reverse the destructive effects of the UV on
the microorganism. The UV disinfection also cannot maintain a residual to help prevent
biofilm formation in discharge piping. In addition, power consumption and maintenance
costs (cleaning the unit, replacing parts) are an additional expense for the treatment
facility.
While UV irradiation is a method that helps to reduce toxic compounds
discharged to the environment when implemented over chlorine disinfection, there has
been additional research on methods to effectively destroy toxic compounds that can be
detected in wastewater. Many studies have reported degradation of these compounds by
advanced oxidation processes (AOP’s). One purpose of advanced oxidation is to provide
advanced treatment and transform toxic pollutants into compounds that are not harmful.
Chemical oxidation can transform these pollutants into harmless products such as carbon
dioxide and water (Andreozzi et al., 1999). Although different methods have been
described for AOP systems, these processes rely on the production of hydroxyl (OH)
radicals (Andreozzi et al., 1999).
The research discussed in the following section summarizes the studies reporting
treatment capability of an AOP based on the chemical peracetic acid (PAA) combined
with UV, where PAA is injected upstream of the UV reactor. PAA is a strong oxidant
and, unlike chlorine, is not known to form DBP’s associated with adverse health effects.
Literature published on the process suggests that low doses of PAA combined with UV
are effective in providing significant enhanced disinfection. The low PAA doses indicate

4
that applying the treatment process to wastewater or other types of treatment such as
stormwater may allow for the method to be cost-effective in terms of operations and
maintenance (O&M) costs. In general, there appear to be significant advantages to
implementing the PAA/UV AOP over traditional disinfection methods. The benefits
indicate that research on this subject should be continued.
Limited literature is available on this process, leaving plenty of research questions
to be addressed. AOP’s are not widely applied yet and may be considered an emerging
technology due to the fact that the processes are not yet fully understood. In particular,
reactant doses and operating conditions still need to be studied in order to understand
optimal treatment conditions for different pollutants and water quality.
Currently, published literature on PAA/UV is generally focused on disinfection,
not chemical degradation. Therefore, this thesis focuses on both the inactivation of E. coli
and P22 bacteriophage (as a surrogate for enteric virus), as well as the degradation of N-
Nitrosodimethylamine (NDMA), where NDMA is an extremely potent carcinogen that
can be formed from industrial processes and as a byproduct of wastewater chlorination.
The objective of the study is to determine whether relatively low doses of PAA combined
with UV can achieve adequate disinfection, while also providing additional degradation
of NDMA. A portion of the research discussed in the following pages is a pilot study
conducted on tertiary-treated wastewater (filter effluent) in field conditions, while the
remainder of the study is conducted using tap water as well as tap water containing
organics under laboratory conditions. The pilot study research is focused on disinfection
of coliform bacteria. The laboratory study analyzes the disinfection of E. coli and P22

5
bacteriophage as a surrogate for enteric viruses. The laboratory study also includes an
experiment on the degradation of NDMA with UV and PAA/UV. In both types of
studies, water quality parameters are monitored.
This thesis is organized to include background literature on AOP’s including the
PAA/UV AOP, provide a detailed methodology of the experimentation conducted,
present the results of the study, discuss these results, and finally conclude and suggest
future research related to the study.

6
CHAPTER 2
BACKGROUND LITERATURE
This section describes the background literature for the advanced oxidation processes
(AOP’s) and the components of the AOP selected for the study, peracetic acid (PAA)
injected upstream of an ultraviolet (UV) reactor.
2.1 Advanced Oxidation Processes (AOP’s)
AOP’s have been utilized in treating wastewater as well as in groundwater remediation
and manufacturing facilities (Bergendahl and O’Shaughnessy, 2005). In wastewater
treatment, AOP’s have been used to reduce organic concentrations, destroy specific
pollutants, treat sludge, and reduce color and odor (Bergendahl and O’Shaughnessy,
2005).
Advanced oxidation relies on the highly reactive hydroxyl (OH) radicals to drive
the process. In comparison with ozone (O3), hydroxyl radicals attack organics with rate
constants usually on the order of 106 to 109 M/s, over seven orders of magnitude higher
than the rate constant of ozone (Andreozzi et al., 1999; Huang et al., 1993). Hydroxyl
radicals are also not selective, which makes them useful for degrading a wide variety of
pollutants. The hydroxyl radical is stably generated by UV irradiation over a wide range
of pH, as high as pH 10 (Huang et al., 1993).
Using these hydroxyl radicals, chemical oxidation may be achieved to degrade
chemical pollutants found in water. In particular, advanced oxidation may be effective in
degrading chemicals that are not degraded by wastewater biological processes, which

7
may be due to high chemical stability or difficulty to become mineralized (Andreozzi et
al., 1999). One example is the degradation of endocrine disrupting compounds (EDCs),
which are chemicals that interfere with the endocrine system in organisms. In one study
(Bergendahl and O’Shaughnessy, 2005) on advanced oxidation, ozone (O3) was able to
degrade estradiol, bisphenol A and nonylphenol by over 40%, with removal above 90%
for doses of 3 mg/L or higher.
There are a variety of different ways to create advanced oxidation processes.
Table 1 (Andreozzi et al., 1999) below lists a few methods that have been studied.
Table 1. Types of Typical Advanced Oxidation Processes
Type of Reactants for AOP
Hydrogen Peroxide and UV H2O2/UV
Titanium Dioxide and UV (Photocatalysis) TiO2/UV
Hydrogen Peroxide and Fenton H2O2/Fe2+
Hydrogen Peroxide and Fenton-Like H2O2/Fe3+
Ozone and UV O3/UV
Ozone and Hydrogen Peroxide H2O2/ O3
One setback/potential concern regarding the use of AOP’s is the baseline quality
of water required for achieving the optimal treatment efficacy, particularly for
wastewater. In order to achieve adequate treatment, chemical oxygen demand (COD),
must be at relatively low concentrations (≤5 g/L) (Andreozzi, 1999). At higher COD
8
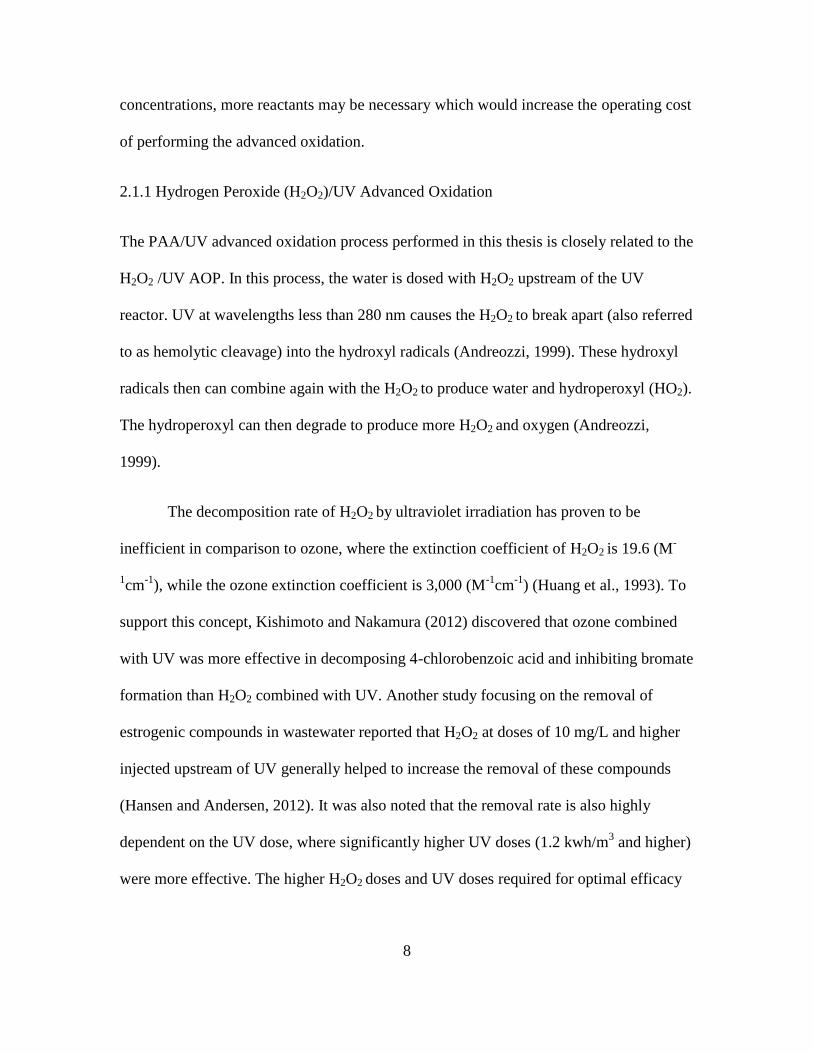
concentrations, more reactants may be necessary which would increase the operating cost
of performing the advanced oxidation.
2.1.1 Hydrogen Peroxide (H2O2)/UV Advanced Oxidation
The PAA/UV advanced oxidation process performed in this thesis is closely related to the
H2O2 /UV AOP. In this process, the water is dosed with H2O2 upstream of the UV
reactor. UV at wavelengths less than 280 nm causes the H2O2 to break apart (also referred
to as hemolytic cleavage) into the hydroxyl radicals (Andreozzi, 1999). These hydroxyl
radicals then can combine again with the H2O2 to produce water and hydroperoxyl (HO2).
The hydroperoxyl can then degrade to produce more H2O2 and oxygen (Andreozzi,
1999).
The decomposition rate of H2O2 by ultraviolet irradiation has proven to be
inefficient in comparison to ozone, where the extinction coefficient of H2O2 is 19.6 (M-
1cm-1), while the ozone extinction coefficient is 3,000 (M-1cm-1) (Huang et al., 1993). To
support this concept, Kishimoto and Nakamura (2012) discovered that ozone combined
with UV was more effective in decomposing 4-chlorobenzoic acid and inhibiting bromate
formation than H2O2 combined with UV. Another study focusing on the removal of
estrogenic compounds in wastewater reported that H2O2 at doses of 10 mg/L and higher
injected upstream of UV generally helped to increase the removal of these compounds
(Hansen and Andersen, 2012). It was also noted that the removal rate is also highly
dependent on the UV dose, where significantly higher UV doses (1.2 kwh/m3 and higher)
were more effective. The higher H2O2 doses and UV doses required for optimal efficacy

9
indicate that this treatment combination makes it likely infeasible for treatment facilities
from a cost perspective.
The removal efficiency of N-Nitrosodimethylamine (NDMA), which is studied as
part of this research, is not significantly increased by H2O2/UV treatment as reported in
some studies (Jobb et al., 1994; Liang, 2002).
2.2 Peracetic Acid (PAA)
PAA, also known as peroxyacetic acid, is a chemical that breaks down into H2O2 and an
organic acid, which is typically acetic acid. The chemical structure is shown in the figure
below (Zheng et al., n.d.).
Figure 1. Peracetic Acid (PAA) Chemical Structure
PAA has been used in a variety of applications, including disinfection in the food and
medical industries (Graham et al., 2010; Kitis, 2004; Wilson, 2014) as well as to provide
disinfection of irrigation systems (Zheng et al., n.d.). The chemical has also been studied
for the treatment of stormwater (U.S EPA, 1999c).

10
PAA is viewed as a “green chemical” that “poses no danger to the environment”
(EPA, 2002). In treated wastewater effluents and surface waters, it has been demonstrated
that PAA produces “none to little toxic or mutagenic by-products after reaction with
organic material” (Kitis, 2004). In a study by Dell’Erba et al. (2007), “no brominated or
chlorinated phenols are formed” (Luukonen et al., 2014). In fact, a study demonstrated
that using PAA actually reduced the estrogenicity (endocrine activity) of wastewater,
whereas chlorination increased the endocrine activity by over 100% (Block et al., 2015).
In addition, PAA meets the aquatic toxicity test criteria (Graham et al., 2010).
Kitis (2004) identifies the consumption of PAA, which is discussed in this
paragraph. In an aqueous solution, the three reactions involved with consumption of the
PAA are hydrolysis, decomposition, and transition-metal-catalyzed decomposition.
Within the pH range of 5.5 to 8.2 the consumption processes mainly involves
spontaneous decomposition to acetic acid and oxygen. Above the pH of 9, the efficiency
of PAA starts to decrease.
The decomposition of the PAA occurs relatively quickly, where the initial rate of
decomposition depends on various factors depending on water quality, such as particulate
concentration and microorganisms in the water (Luukkonen et al., 2014). The quick
degradation of the PAA was observed in one study, where 5 ppm was dosed through a
reactor, but concentrations less than 1 ppm were observed in various sampling points
within the reactor and at the outfall (U.S EPA, 2012). In aquatic systems, the
consumption processes are not complete as small residuals of PAA and H2O2 have been
detected after some time when dosed in wastewater; however, this residual is not
11
considered harmful to aquatic environments and it can actually aid in reducing biofilm
formation in discharge piping (Luukkonen et al., 2014) though this may be dependent on
the length of pipe.
While there are a number of advantages involved with the use of PAA, including
its efficacy and “green” nature, there are also disadvantages to using this chemical. One
disadvantage is that the use of PAA produces increased organic loading in the effluent
due to acetic acid (Kitis, 2004), which may also contribute to microbial regrowth if PAA
residuals are low. According to Kitis (2004), PAA is also not nearly as effective against
some viruses and parasites in comparison to other disinfection methods such as chlorine.
Another drawback of this chemical is a relatively high cost, at approximately $3 per
gallon for 12% PAA solution (Kitis, 2004). Another source states that the cost per gallon
of 12% PAA solution is nearly double at approximately $5.50 per gallon (Dancey, 2009).
The high cost may be due to a limited market, particularly since PAA is not yet
commonly used in water/wastewater treatment in the United States. While the cost is
higher, the added cost benefit of using PAA over traditional chlorine treatment is that
dechlorination is not required.
PAA has been approved by the U.S EPA for use as a primary disinfectant for
wastewater disinfection since 2007; however, PAA has been used to treat wastewater in
Europe for over a decade (Dancey, 2009). Some wastewater treatment plants in the
United States have adopted PAA as a primary disinfectant, including a wastewater
treatment plant in St. Augustine, Florida (Graham et al., 2010) that discharges treated
flow to environmentally-sensitive wetlands. Case studies have also been conducted at a

12
number of treatment plants including a wastewater treatment plant in Frankfort, Kentucky
(U.S EPA, 2012).
PAA solutions are typically manufactured in solutions between 10 and 15%, as
concentrations higher than 15% can begin to exhibit issues with instability, reactivity and
explosiveness (Kitis, 2004). The Solvay Proxitane WW-12 chemical solution used in the
experiments contains a stabilizer that has a relatively long shelf life of approximately six
months (Wodalski, 2012). Quenching of the chemical is not required (Dancey, 2009)
prior to discharge.
Since PAA is an oxidizing agent, disinfection occurs from the PAA and H2O2
(that PAA degrades into) “oxidizing the cell membranes and inner cell structures of
pathogens” (Zheng et al., n.d.). The oxidation occurs through the fast transfer of electrons
to the microorganism. The faster the electron-transfer, the more quickly the
microorganisms are inactivated or killed (Wilson, 2014). Though H2O2 is another
disinfectant, PAA is more stable and known to degrade at a slower rate than H2O2,
allowing the chemical to perform further disinfection (Zheng et al., n.d.). The U.S EPA
has stated that the PAA is a stronger oxidant than chloride dioxide and hypochlorite,
though not as strong as ozone (Martin, 2014).
PAA was selected for the study due to the ease of implementation, treatment
efficacy discussed further in Section 2.2.1 and 2.4 and other advantages associated with
the chemical. The brand of PAA used in both the pilot study and laboratory study was
Proxitane WW-12 manufactured by Solvay Chemical. This solution is a 12% PAA
solution. The Material Safety Data Sheet (MSDS) for Proxitane WW-12 is provided as an

13
appendix to this thesis (Appendix A). In both the pilot study and laboratory settings, the
PAA was used within approximately six months of receipt.
2.2.1 Effectiveness of PAA as a Primary Disinfectant
Research has been conducted to study the disinfection efficacy of PAA as a primary
disinfectant. In one study, PAA doses of 1.5 mg/L to 2 mg/L with a contact time of 10 to
15 minutes were sufficient to inactivate 2 logs or more of E. coli (Luukkonen et al.,
2014). In a pilot scale study, PAA doses and contact times were varied to determine the
disinfection of total coliforms and enterococci (Koivunen and Heinonen-Tanski, 2005).
For PAA doses that ranged from 2 to 7 mg/L with contact times ranging from 4 to 27
minutes, approximately 3-log inactivation of total coliforms and enterococci was
achieved. In Koivunen and Heinonen-Tanski (2005), higher doses of 10 to 15 mg/L PAA
achieved 3 to 4 logs inactivation. This study noted that minor changes in wastewater
quality parameters such as chemical oxygen demand (COD), suspended solids (SS),
turbidity, temperature and UV transmittance (UVT) did not affect PAA disinfection;
however, large increases in concentrations of microorganisms, organic matter and
suspended solids significantly decreased the log inactivation.
In addition to disinfection capability, use of PAA as a primary disinfectant may
also be able to decrease the activity of endocrine disrupting compounds (EDCs). In one
bench test study (Block et al., 2015), PAA was dosed at 1, 5 and 10 mg/L. After 10
minutes of stirring, the E2 (17-beta-estradiol) and EE2 (17-alpha-ethinyl estradiol,
chemical derivative of estradiol) activity had decreased by over 75%. After 20 minutes,
the percent decrease in EDC activity was over 80%.
14
The literature therefore suggests both disinfection and added benefit of decreased
endocrine activity with the use of PAA.
2.3 Ultraviolet (UV) Disinfection System
In combination with the PAA, the AOP is made possible with the utilization of a UV unit.
NeoTech Aqua Solutions Inc. produces UV systems that are in-line, enclosed units that
contain low pressure mercury vapor lamp(s). The set-up for the unit includes power
connection and the UV intensity monitor(s) connected to control box(es) to provide UV
intensity readings.
The UV unit utilized in the pilot-scale study included eight lamps and four UV
intensity monitors, while the UV unit used in the laboratory study only contained one
lamp and one UV intensity monitor. Each lamp is enclosed within a quartz sleeve where
the outside of this sleeve is in direct contact with the water. The pilot scale UV unit was
rated for 375 GPM for 95% UVT, while the laboratory bench-scale UV unit was only
rated for 20-35 GPM.
A unique feature associated with the NeoTech UV units is a reflective coating
within the chamber that helps to distribute UV light through the water passing through
the vessel. The concept behind this design is to provide efficient treatment of the water
with less power consumption. While typical low pressure lamps have lower power
consumption (typically less than 1 kW) in comparison to medium pressure lamps
(typically around 15 kW), the footprint is typically larger (Water Research Foundation et
al., 2011). The NeoTech UV unit, however, does not require a large footprint in
comparison to other similar UV technologies.

15
The UV dose can be calculated based on the UV intensity (mW/cm2) and contact
time in seconds. The UV intensity is a value that is read by the UV intensity probe and
displayed on the monitor. The contact time is adjusted based on flowrate, where the
contact time is calculated based on this flowrate and volume of water in contact with the
UV light. The UV Dose is calculated with the following equation:
UV Dose (mJ/cm2) = UV Intensity (mW/cm2) * Contact Time (seconds)
In many cases, the effectiveness of ultraviolet irradiation is often judged based on
a UV Transmittance (UVT) measurement. UVT measures the amount of ultraviolet light
that passes through a water sample as compared to the amount of light passing through a
pure water sample (USAPHC, 2011). The UVT varies depending on organics, solids
content and other material in the water that absorb and scatter the UV light. The
measurement is typically expressed as a percentage. A low percentage indicates that the
water quality cannot be treated as effectively by UV irradiation. Typically UVT for UV
wastewater application ranges from 50% to 80%, where the specified UV Dose for this
UVT range is 30 mJ/cm2 (ATG Technology). The UVT of secondary effluent typically
ranges from 60% to 70%, and ranges from 85% to 95% for tap water (Briley, 2015).
Water temperature and pH do not generally have a major impact on UV disinfection
(USAPHC, 2011).
2.4 Effectiveness of PAA Upstream of UV Reactor
While PAA and UV are both effective primary disinfectants, the implementation of PAA
upstream of a UV reactor may contribute to much higher disinfection efficacy. The
reason why the combination may contribute to better disinfection efficacy is that UV

16
helps produce the hydroxyl radicals more quickly by breaking the O-O bonds within the
PAA molecule (Caretti and Lubello, 2003). The hydroxyl radicals are highly important in
degrading the polluting molecules, but do not last for a significant length of time.
According to Caretti and Lubello (2003), the H2O2 present in the commercial product of
PAA, and which the PAA degrades into, helps extend the AOP by forming more
hydroxyl radicals. In addition, the H2O2 also forms new PAA through chemical reactions
as the PAA is consumed.
A few studies have been published that document the effectiveness of PAA and
UV treatment. One study is titled “Wastewater disinfection with PAA and UV combined
treatment” (Caretti and Lubello, 2003). The paper investigates the treatment efficiency of
PAA and UV alone as well as PAA combined with UV. Injection of PAA downstream of
the UV reactor was also tested. For this study, PAA was selected over H2O2 due to
literature claiming that PAA was more effective and because spectroscopic analysis
demonstrated that the PAA solutions produce more free hydroxyl radicals than H2O2.
PAA doses ranged from 1 ppm to 8 ppm with UV doses ranging from 100 mJ/cm2 to 300
mJ/cm2. The different indicator bacteria analyzed in the study include total coliform, E.
coli and Pseudomonas aeruginosa. The results overall indicated that both PAA and UV
treatment as primary disinfectants were incapable of attaining the strict disinfection
requirements for wastewater irrigation reuse (in Italy). Combining the two disinfectants
provided significantly better disinfection efficacy when the PAA was upstream of the UV
reactor. This combination provided sufficient treatment to meet the disinfection
requirements for reuse (≤2 MPN/100 mL total coliforms) with 2 mg/L (ppm) or higher of
PAA combined with the UV irradiation. The figure from the source shows the log

17
inactivation achieved at varying UV and PAA doses as well as the approximate cost per
cubic meter of water to treat the water, which is depicted through isocost curves (€/m3).
This figure is depicted below in Figure 2.
Figure 2. PAA Dose and UV Dose Total Coliform Log Inactivation with Isocost Curves
(Caretti and Lubello, 2003)
The recorded data indicates a great synergy with injecting PAA upstream of the UV.
Adding the PAA downstream of the UV reactor did not result in significant additional log
inactivation of the microorganisms in comparison with the disinfectants on their own.
18
2.5 Microorganisms Used in the Study
The pilot study experiments were conducted by sampling for total coliform and E. coli.
The present study laboratory experiments were performed using E. coli and P22
bacteriophage.
2.5.1 Escherichia coli (E. coli)
The type of bacteria used in the pilot and laboratory studies is Escherichia coli (E. coli).
The “versatility, broad palate and ease of handling have made it the most intensively
studied and best understood organism on the planet” (Blount, 2015). E. coli is naturally
found in the gut of mammals, and is sometimes found in other animals as well as in soil,
plants, water and food (Blount, 2015). High concentrations of E. coli are found in
wastewater from human excretion. While excreted from the human body, consumption of
pathogenic strains of the bacteria may cause adverse health effects in humans including
diarrheal diseases, peritonitis, colitis, and urinary tract infections (Blount, 2015). For this
reason, pathogenic strains of E. coli and other pathogenic bacteria are targeted for
inactivation (through disinfection), particularly for treated wastewater discharges where
humans may come in contact.
E. coli is commonly used as an indicator of fecal contamination in aquatic
environments. If detected it may indicate the presence of other pathogenic
microorganisms. The fecal coliform group is classified by characteristics including rod-
shaped, non-spore forming, Gram-Negative, and lactose-fermenting in 24 hours at
44.5°C. The bacteria can also grow with or without oxygen.

19
The assay for the detection of bacteria can be performed using a variety of
methods including membrane filtration and spread plate techniques. Membrane filtration
is performed using a membrane filter with a particular pore size, which is generally 0.45
micron. Typically, 100 mL of water sample is filtered and any bacterial cells present in
the water sample are captured on the surface of the membrane filter. The filter is then
placed on sterilized media in a petri dish. Spread plate technique is performed by
transferring 0.1, 0.25 or 0.5 mL of sample on media and then spreading the small volume
with a sterilized spreader. The colonies are then counted on the plates and appropriate
dilution factors are applied to provide the total colony forming units per volume
(typically mL). Both techniques are appropriate assays for E. coli analysis; however, the
membrane filtration method is best used for lower anticipated E. coli concentrations.
2.5.2 P22 Bacteriophage
A bacteriophage is a virus that infects bacterial cells. Bacteriophages can be classified by
the degree to which the bacterial cell is damaged, where some bacteriophages cause lysis
of the cell. “Bacteriophages ‘enter’ bacterial cells through absorption via appropriate
receptors on their cellular wall” (Tokarz-Deptula et al., 2011). Bacteriophages are used
for various studies including environmental protection studies, where bacteriophages
have been used as specific bio-indicators for identifying sources of microbial pollution
(Tokarz-Deptula et al., 2011). The bacteriophages, which are some of the most
structurally-complex viruses, can also be used as a surrogate to estimate removal or
inactivation of human viruses during treatment processes.

20
The bacteriophage known as P22 was the first phage shown to be able to perform
generalized transduction (Casjens, 2000). P22 bacteriophage is a phage that infects
Salmonella, where it is able to establish lysogeny and perform generalized transduction in
Salmonella typhimurium (Rhoades et al., 1968). The DNA molecules of P22 are linear
and double stranded. The genetic structure of P22 is similar to that of the coliphage, ʎ
(Susskind and Botstein, 1978). The P22 virion is an icosahedral particle approximately
ca. 60 nm in diameters, with a baseplate approximately 20 nm wide and thin spike or
fiber (ca. 20 nm long) (Susskind and Botstein, 1978).
Assay of the P22 bacteriophage is conducted through the double agar layer
method, which is described further in Section 3.0, Methodology.
2.6 N-Nitrosodimethylamine (NDMA)
N-Nitrosodimethylamine (NDMA) is an organic, semi-volatile chemical formed in both
industrial and natural processes (U.S EPA, 2014). The chemical has been used in the
production process of industrial chemicals such as rocket fuel and antioxidants; however,
it can also be produced during food processing. In addition, NDMA is also the
unintended byproduct from chlorination of wastewater using chloramines for disinfection
(U.S EPA, 2014).
Once produced, whether intentionally or unintentionally, NDMA’s release into
the environment through waste streams can contaminate water sources, including
drinking water sources. If not degraded prior to coming into contact with humans or
animals, it may cause adverse health effects in these organisms. The chemical is part of
the N-nitrosamines family, a family known for potent carcinogens, where some studies

21
have observed tumors in various species, including rats and mice as a result of exposure
to NDMA (U.S EPA, 2014). In fact, NDMA “cancer potencies are much higher than
those of the trihalomethanes” (Mitch et al., 2003).
Based on studies conducted, the U.S EPA has listed NDMA on Contaminant
Candidate Lists (CCL’s), including CCL 4 published in November 2016. The CCL
contains contaminants that are currently not nationally regulated in primary drinking
water, but are known to be in drinking water sources and may be proposed for regulation
in the future. In fact, results of sampling conducted in 2001 showed 3 of 20
chloraminated drinking water supplies contained 10 ng/L or higher NDMA
concentrations (Tomkins et al., 1995; Tomkins and Griest, 1996). Though there is no
EPA maximum contaminant level (MCL) specified for this chemical, many agencies
have established NDMA guidelines (Mitch et al., 2003) due to research suggesting
significant health impacts.
In literature, the observed concentrations of NDMA in water are discussed (Mitch
et al., 2003). Influent wastewater may contain NDMA concentration as high as 105,000
ng/L. Effluents from circuit board manufacturing may contain raw sewage NDMA
concentrations as high as 1,500 ng/L. Secondary treatment removes a considerable
percentage of NDMA, with observed concentrations often less than 20 ng/L in
unchlorinated secondary effluent.
Some removal of NDMA can occur with ultraviolet (UV) treatment. The UV
photolysis may help to remove NDMA, but may not destroy NDMA precursors (Mitch et

22
al., 2003). Therefore, chlorine injection that occurs after the UV disinfection can still
contribute to NDMA formation in the distribution system.
NDMA is analyzed through liquid-liquid extraction and gas chromatography/mass
spectrometry (GC/MS) or through gas chromatography with a thermionic detector (Mitch
et al., 2003). Through these methods or a combination of the methods, detection limits
can be as low as 1 ng/L.
23
CHAPTER 3
METHODOLOGY
3.1 Materials
3.1.1 Description of NeoTech UV Unit
Two different UV units were used in the pilot scale and laboratory studies. The NeoTech
Inline Magnum UV unit was used in the pilot scale study and the NeoTech D222 UV unit
was used in the laboratory study. These units are described in further detail in the
following sections.
3.1.1.1 NeoTech UV Unit Used in Pilot Scale Study
The NeoTech Inline Magnum UV unit contains eight 60-inch long low pressure mercury
vapor UV lamps. In the pilot study, the flow entered via two 6-inch pipes connected at 45
degree angles to the main vessel. The flow exited the vessel in a similar manner. The unit
was equipped with four UV intensity sensors, two located on the top of the vessel and
two located on the bottom of the vessel. These intensity sensors were linked to two
control boxes that provide dosimetry, UV intensity and lamp status information on the
display screen. A close-up of the display screen is shown in Figure 5. The schematic of
the NeoTech Inline Magnum UV unit is depicted on the next page in Figure 3.

24
Figure 3. Pilot Study NeoTech Inline Magnum UV Unit Schematic
3.1.1.2 NeoTech UV Unit Used in Laboratory Study
The bench-scale NeoTech UV system (Model D222) is pictured in Figure 4. The unit
consists of a vessel with one low pressure mercury vapor UV lamp.

25
Figure 4. Close-Up View of Laboratory Scale NeoTech UV Unit (D222)
The UV unit is rated for 20 to 35 gallons-per-minute (GPM) of flow. The flow entered
and exited the unit via 1-1/2 inch 90 degree elbows. These 90 degree elbows acted as a
UV light trap to keep UV light from degrading the attached PVC. The UV unit is
equipped with one UV intensity sensor which is hooked to one control box. The control

26
box is programmed to provide UV intensity readings. A close-up view of the control box
is presented in Figure 5.
Figure 5. Close-Up View of Laboratory Scale UV Unit Control Box
3.1.2 Peracetic Acid (PAA)
The 12% PAA (Proxitane WW-12) stocks were obtained from Solvay Chemicals
(Houston, TX) and kept in the chemical hood. The concentrated stock of PAA was
diluted to the desired working concentration using deionized (DI) water.
3.1.3 Microbial Culture and Media
Pure culture of E. coli (ATCC 25922), bacteriophage P22 (ATCC 19585-B1) and P22
host bacterium Salmonella typhimurium (ATCC 19585) were obtained from American
27
Type Culture Collection (ATCC, Rockville, MD) and propagated according to the
vendor’s instructions.
Nutrients media used for propagation of bacterial cultures were Tryptic Soy Agar
(TSA) and Tryptic Soy Broth (TSB). These media were obtained from Hardy Diagnostics
(Santa Maria, CA) and prepared according to manufacturer’s instruction. Briefly, 30 g of
TSA powder or 7.5 g of TSB powder was dissolved in one liter of nanopure water under
continuous mixing at medium heat, followed by autoclaving for 15 minutes at 121°C.
Autoclaved media was aseptically dispensed in petri-dishes or test tubes and stored at 4°C
until used.
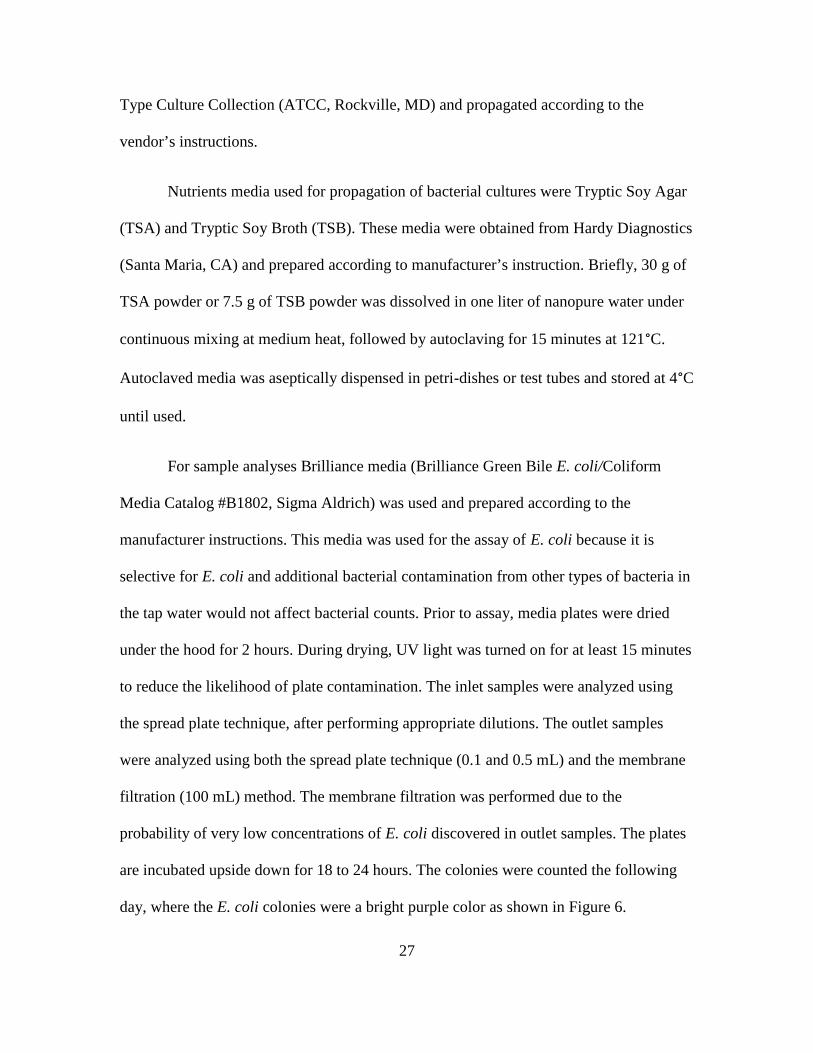
For sample analyses Brilliance media (Brilliance Green Bile E. coli/Coliform
Media Catalog #B1802, Sigma Aldrich) was used and prepared according to the
manufacturer instructions. This media was used for the assay of E. coli because it is
selective for E. coli and additional bacterial contamination from other types of bacteria in
the tap water would not affect bacterial counts. Prior to assay, media plates were dried
under the hood for 2 hours. During drying, UV light was turned on for at least 15 minutes
to reduce the likelihood of plate contamination. The inlet samples were analyzed using
the spread plate technique, after performing appropriate dilutions. The outlet samples
were analyzed using both the spread plate technique (0.1 and 0.5 mL) and the membrane
filtration (100 mL) method. The membrane filtration was performed due to the
probability of very low concentrations of E. coli discovered in outlet samples. The plates
are incubated upside down for 18 to 24 hours. The colonies were counted the following
day, where the E. coli colonies were a bright purple color as shown in Figure 6.

28
Figure 6. E. coli Colonies on Brilliance Media
The bacteriophages and bacterial hosts used in this study were obtained from the
American Type Culture Collection (ATCC, Rockville, MD). The bacteriophages were
propagated and assayed in duplicate using the double agar layer method (Adams, 1959).
The propagation and purification of the bacteriophage stocks were performed as
described in Abbaszadegan et al. (2007).
Briefly, 1 mL of bacteriophage sample, 1 mL of log phase host Salmonella, and 5
mL of 0.7% molten TSA (top agar kept in water bath at 48°C) were mixed and poured
onto 1.5% TSA bottom agar plates. After solidifying, the plates were incubated inverted
at 37ºC overnight and plaques (Figure 7) were counted after 12 hours. All the assays were
performed in duplicate, and positive and negative controls were included in each set of

29
assays and for each experiment. A picture of these plaques is displayed in Figure 7
below. The unit of measurement for this technique is Plaque Forming Units (PFU) per
milliliter and is reported as PFU/mL based on the dilution factors.
Figure 7. Plaques Created by P22 Bacteriophage
3.2 Pilot Scale Study
The pilot scale study set-up, methodology and test matrix are discussed within this
section.

30
3.2.1 Set-Up
The pilot study was conducted at the Palo Verde Water Reclamation Plant (WRP), which
is owned by Global Water located in Maricopa, Arizona. The pilot study took place from
July to October 2015.
The NeoTech Inline Magnum UV unit rated for 375 GPM for 95% UVT was
installed after cloth-media filtration and treated a slip-stream of filtered effluent. Global
Water decided to evaluate the NeoTech UV unit for the pilot study because it appears to
require less power consumption and has a smaller footprint than other similar
technologies.
The set-up included a pump and a valve for adjusting flow rate to the desired
level. As part of the set-up, a dimmer was installed to reduce/adjust power output to the
UV unit. The set-up allowed for decreasing the UV intensity for simulating lamp aging
and/or worsening water quality (lower UV transmittance, UVT). A small chemical feed
pump was used to inject the PAA into the system through an injection port located just
prior to the UV unit. The PAA feed pump was connected to the PAA storage container
that was placed on a spill containment pallet.
The experimental set-up included two sampling ports: one located upstream and
the other located downstream of the UV unit. These sampling ports were used to collect
water samples. The sampling port located upstream of the UV unit served as the inlet
sampling port and a sampling port located downstream of the UV unit served as the outlet
sampling port. A flowmeter installed further down the piping, after the outlet sampling

31
port was used to record flowrate readings. The experimental set-up and site layout is
depicted in Figure 8.
Figure 8. Pilot Study Site Layout
3.2.2 Testing Matrix
The testing matrix is presented in Table 2, which summarizes the tests performed in the
pilot study.

32
Four flowrates (250, 375, 750 and 1,000 GPM) were selected for the pilot study.
The design flowrate for the unit is 375 GPM (though for 95% UVT); however, higher
flowrates were investigated to understand the treatment capability at lower UV doses.
Four PAA doses evaluated were: 0.5, 1.0, 1.5 and 2.0 mg/L. These are typical
PAA concentrations used in combination with UV for synergistic disinfection (Caretti
and Lubello, 2003).
Two UV intensities: 75 and 50% UV were selected for the pilot study. These
intensities were percentages of the baseline intensity and selected to simulate slow failure
of the system, which could be due to aging lamps, fouled quartz sleeves or other
degradation of the system over time.
Table 2. Matrix of Pilot Study for Inactivation of Total Coliforms and E. coli (Triplicate
Samples)
UV Only Testing
Flow (GPM) Lamp Intensity, %
Varying Flow Tests
250 100%
375 100%
750 100%
1,000 100%
75% Intensity Test
250 75%

33
Flow (GPM) Lamp Intensity, %
375 75%
750 75%
1,000 75%
50% Intensity Test
250 <50%(1)
375 <50%(1)
750 <50%(1)
1,000 <50%(1)
Peracetic Acid (PAA)/UV Test
PAA Dose (mg/L) Lamp Intensity, %
750 GPM(2), 100% UV Intensity PAA Test
0.5 100%
1 100%
1.5 100%
Additional PAA/UV Tests (2 mg/L PAA Dose)
Flow (GPM) Lamp Intensity(3) ,%
750 50%
1,000 50%
Notes: (1) Actual percent UV intensity was initially around 28% (based on the 50% nonpotable water baseline intensity and 100% baseline intensity from the previoustesting day).
(2) 750 GPM selected as flowrate for test because complete kill observed at 250 GPM and375 GPM in 100% UV Intensity Test.
(3) Additional tests completed to understand treatment capability of the unit at true 50%UV intensity and a PAA dose of 2 mg/L

34
The total coliform and E. coli analyses were performed by Transwest Analytical
Laboratories, located in Tempe, Arizona.
3.2.3 Pilot Study Experimental Procedure
The pilot study experiments discussed within this thesis were performed on different
dates ranging from 7/8/2015 to 7/29/2015. The initial start-up of the pilot study involved
thorough cleaning of the UV unit and quartz sleeves to provide an accurate baseline field
intensity reading while operating the unit using non-potable water. The baseline field
intensity reading for each test was selected based on the highest UV intensity reading out
of the four intensity readings. If the baseline field intensity reading dropped by more than
10% between tests, the unit was cleaned.
At the start of each day of the pilot study, the baseline field intensity was
determined using the non-potable water. Then the water was switched to filter effluent
and flowrate was adjusted based on the test matrix using the pump and the post-unit valve
shown in Figure 8. The dimmer and PAA pump were also set up based on the
requirements for the test performed on that day.
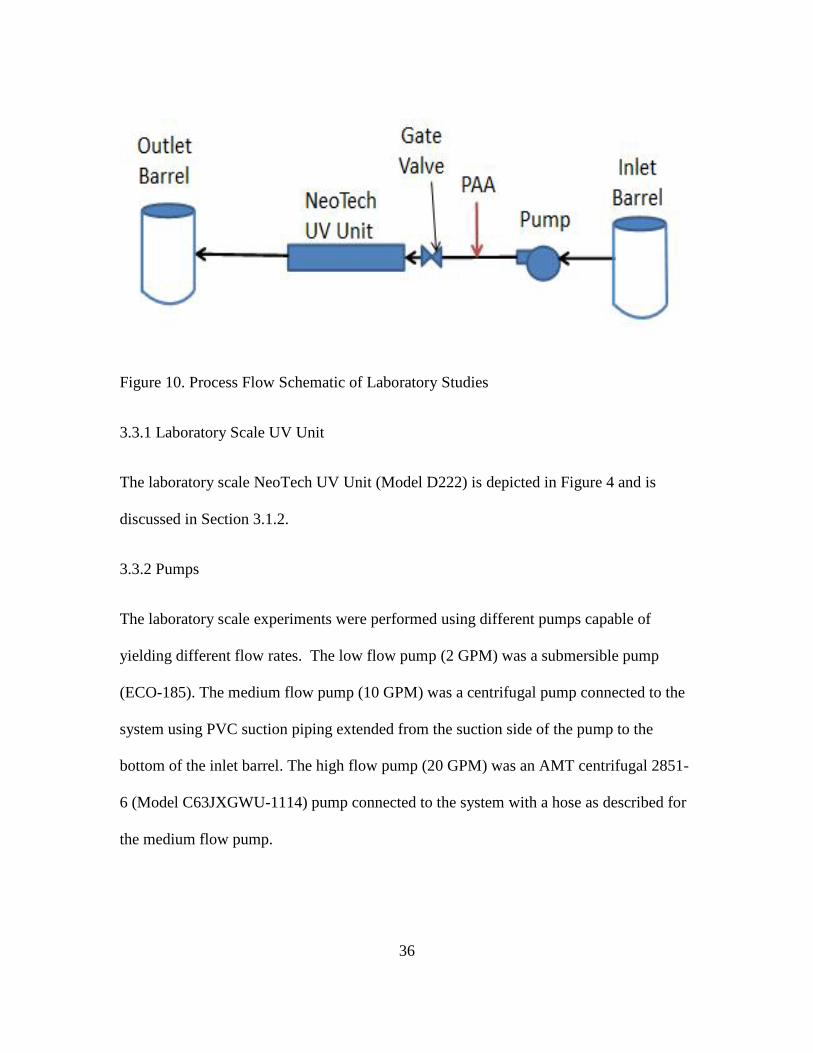
3.3 Laboratory Experimental Set-Up
The main components of the laboratory scale experimental set-up are the NeoTech D222
UV unit, pump, and inlet and outlet barrels, which are all connected through PVC piping
and fittings. The experimental set-up also includes the chemical feed pump and chemical
injection port. Figures of the laboratory scale set-up and process flow schematic are
shown below in Figures 9 and 10.

35
Figure 9. Laboratory Set-Up of Laboratory NeoTech UV Unit, Inlet/Outlet Barrels,
Pump, Piping and Fittings
36
Figure 10. Process Flow Schematic of Laboratory Studies
3.3.1 Laboratory Scale UV Unit
The laboratory scale NeoTech UV Unit (Model D222) is depicted in Figure 4 and is
discussed in Section 3.1.2.
3.3.2 Pumps
The laboratory scale experiments were performed using different pumps capable of
yielding different flow rates. The low flow pump (2 GPM) was a submersible pump
(ECO-185). The medium flow pump (10 GPM) was a centrifugal pump connected to the
system using PVC suction piping extended from the suction side of the pump to the
bottom of the inlet barrel. The high flow pump (20 GPM) was an AMT centrifugal 2851-
6 (Model C63JXGWU-1114) pump connected to the system with a hose as described for
the medium flow pump.
37
3.3.3 Inlet and Outlet Barrels
The laboratory scale experimental set-up included inlet and outlet barrels (208 liters or
approximately 50 gallons). Inlet samples are collected directly from the inlet barrel.
Outlet samples are collected from the short segment of PVC pipe extended from the 90
degree elbow attached to the outlet end of the UV unit and not directly from the outlet
barrel. This location was selected in an effort to prevent potential contamination. Prior to
each experiment, both the inlet and outlet barrels were thoroughly cleaned and
disinfected with bleach.
3.3.4 Chemical Feed Pump and Injection Port
The chemical feed pump was used to inject PAA into the PVC piping using small
diameter chemical-rated tubing. The suction tubing was placed directly into the working
stock of PAA contained in conical flask solution. The discharge tubing entered the PVC
piping via a chemical injection port. This chemical injection port prevented backflow into
the PAA chemical feed line. In order to achieve the desired chemical feed rates, the
chemical feed pump was tested before each experiment with water to set the correct
pump feed rate.
3.3.5 Testing Matrix
The testing matrix for the laboratory scale experiments is provided in Table 3.

38
Table 3. Testing Matrix for Laboratory Experiments
Microbial Testing
Test Control UV Only (NeoTech D222 Unit) PAA+UV
Microbe/
Chemical
No UV
or PAA,
20 GPM
Low
Flowrate
(2 GPM)
Medium
Flowrate
(10
GPM)
High
Flowrate
(20
GPM)
High
Flowrate,
20 GPM
(E. coli and
P22)(1)
20
GPM,
0.25
mg/L
PAA(1)
20
GPM,
0.5
mg/L
PAA(1
)
E. coli 2 3 3 -- 3 3 3
P22 2 -- -- 3 3 3 3
Chemical Testing
UV, 4 GPM, No
PAA
UV, 4 GPM, 0.5
mg/L PAA
UV, 0.5 GPM,
No PAA
UV, 0.5 GPM, 0.5
mg/L PAA
NDMA 2 2 2 2
Notes: (1) In these experiments, both P22 bacteriophage and E. coliwere added. The experiment included adding over 400 mL of TSB organics.
3.4 Laboratory Scale Experimental Procedure
The laboratory scale studies included four types of experiments: 1) UV only for
microorganism inactivation, 2) PAA plus UV for microorganism inactivation, 3) PAA
only for microorganism inactivation, and 4) UV and PAA/UV for NDMA degradation.
The experimental procedures for these experiments are described below.
39
Prior to the experiments conducted with the NeoTech D222 UV unit, the
experimental system was flushed with tap water. After filling and emptying the inlet
barrel at least twice to flush the system, the barrel was filled with tap water. A mixer at
the bottom of the barrel was turned on to provide thorough mixing within the barrel. The
inlet pump was then turned on as well as the NeoTech UV unit (technician mode turned
off). At the barrel fill point (approximately 80 L), the inlet pump was turned off and one
mL of sodium thiosulfate was added to the inlet barrel. The sodium thiosulfate was
allowed to mix for at least one minute to completely neutralize all residual chlorine.
3.4.1 Microbial Inactivation by UV
These experiments were conducted using overnight bacterial cultures. Approximately 18
to 24 hours before conducting each experiment, 400 mL of TSB was inoculated with the
overnight culture from the prior day and incubated at 37°C. The overnight bacterial
culture was added to the inlet barrel and mixed thoroughly to ensure homogenous
distribution of test bacteria in tap water (with chlorine neutralized by 1 mL of sodium
thiosulfate) to prepare spiked test water. The UV lamp in the NeoTech D222 unit was
turned on and allowed to warm up until the UV intensity was stable. Then, spiked test
water was allowed to run through the system for 45 seconds using the inlet pump. At this
point, an inlet sample (from the inlet barrel) and outlet sample (from the PVC outlet pipe)
were collected. The UV intensity was recorded during this time period. The barrels were
immediately bleached after sample collection and disinfected properly using bleach
before waste disposal. Throughout this experiment no PAA was injected in the system. In
each experiment, control treatments (no UV) were also included and samples were

40
analyzed. The samples from control treatment plates demonstrated that E. coli and P22
concentrations were the same at inlet and outlet after 45 seconds, indicating that proper
mixing and enough time prior to collecting the outlet sample was provided to maintain
accurate outlet sampling.
The experiments for P22 inactivation were performed in conjunction with E. coli
following the procedures described above. For these experiments, the inlet water was
spiked with approximately 4 to 5 mL of P22 bacteriophage.
3.4.2 Microbial Inactivation by PAA/UV
The addition of PAA followed a similar methodology to the experimental procedure
discussed in Section 3.2.1; however, a few differences are addressed. In preparation, the
PAA/UV experiments had the additional component of chemical feed rate testing prior to
experiments. The chemical feed rates were set based on achieving the intended PAA dose
with the diluted PAA solution (working stock of PAA). The calculations for the proper
dilution to prepare working stock of PAA and feed rate in order to reach the desired
concentrations are provided as an appendix to this thesis (Appendix B). The working
stock of PAA was prepared with DI water and the provided Solvay 12% Proxitane WW-
12 PAA sample.
Outlet samples were quenched with approximately 40 μL of 50 mg/mL sodium
thiosulfate solution immediately after collection.

41
3.4.3 Microbial Inactivation by PAA
The PAA experiments were performed with a bench scale set-up conducted in beakers
and petri dishes for E. coli and P22 respectively. The E. coli and P22 testing were
performed in different types and volumes of liquid, which is discussed further below.
Each test was performed on a stir plate to promote ample mixing. Prior to each test, the
PAA concentration was measured using a parallel control.
For the E. coli experiments, approximately 125 mL of tap water was dosed with
approximately 20 μL of 50 mg/mL sodium thiosulfate to quench chlorine residual. Then,
approximately 4 logs of E. coli were added to the beakers. After mixing for at least one
minute, the inlet (or influent) sample was collected from the beaker. Then PAA was
added to achieve the desired dose for each experiment (0.25 and 0.5 mg/L). After adding
the PAA, samples were collected for each selected point in time (5, 10 and 30 minutes).
Just after collecting the sample, 20 μL of 50 mg/mL sodium thiosulfate was added to the
sample to quench the PAA. The samples were then assayed using the spread plate
method.
The P22 bacteriophage inactivation experiments using PAA only were performed
using phosphate-buffered saline (PBS) in 25 mL petri dishes. The P22 was added to 25
mL of PBS and mixed prior to adding the PAA. Samples were also collected after 5, 10,
and 30 minutes. 20 μL of 50 mg/mL sodium thiosulfate was immediately added to the
samples after collection.

42
3.4.4 NDMA Removal by UV and PAA/UV
These experiments were performed using the procedures described in Sections 3.4.1 and
3.4.2 with exception that the desired concentration of NDMA was added to the inlet tap
water and no microorganisms were added. Approximately 400 μL of 200 μg/mL of
NDMA in methanol solution was added to 108 Liters of tap water in the inlet barrel to
create a 700 ng/L NDMA concentration. Inlet and outlet samples were collected in amber
bottles (1 L volume).
The experimental flowrates were 0.5 and 4 GPM. A high 700 ng/L NDMA inlet
concentration was selected in order to accurately determine % removal in the case that
the UV treatment degraded a high percentage of the NDMA. Outlet samples were
collected for UV and 0.5 mg/L PAA upstream of UV for each flowrate. The sample
bottles contained a small amount of sodium thiosulfate powder preservative
(approximately 250 mg). Experiments were conducted in the dark due to the light
sensitivity of NDMA. The samples were analyzed at the City of Scottsdale Water
Campus laboratory, Scottsdale, Arizona using EPA Method 521. The MRL for this
method is 2 ng/L.
3.5 Data Analysis
The E. coli and P22 bacteriophage data was analyzed in terms of log inactivation, UV
Dose and PAA Dose. The calculations were performed using Microsoft Excel.
The log inactivation measures the percent of microorganisms inactivated. For
example, 99.9% of microorganisms inactivated corresponds with three logs inactivation

43
and 99.99% corresponds with four logs inactivation. The log inactivation is calculated
using the following equation:
Log Inactivation = Log(N0/Nf),
Where N0 is the inlet concentration of P22 bacteriophage or E. coli and Nf is the outlet
concentration of P22 bacteriophage or E. coli.
The UV Dose was calculated using the equation in Section 2.3, based on UV
intensity and contact time. The contact time is based on the volume within the UV
chamber in contact with water and flowrate. The volume within the UV chamber was
determined based on the dimensions of the UV unit accounting for the UV bulb/outer
quartz sleeve.
The NDMA results were expressed in terms of percent removal, UV Dose and
PAA Dose. Percent removal is calculated using the following equation:
% Removal = (C0-Cf)/C0 * (100%)
Where C0 is the inlet concentration of NDMA and Cf is the outlet concentration of
NDMA.
Experimental data analysis also includes the analysis of water quality parameters
including PAA concentration (inlet and outlet), UVT (discussed in Section 2.3), pH and
Dissolved Organic Carbon (DOC). These parameters were evaluated against typical
water quality parameters stated in literature.

44
The PAA concentration was analyzed using a Hach DR 4000 Spectrophotometer
instrument. Total chlorine reagent powder pillows (25 mL) were used with this
instrument to provide a total chlorine concentration. Per the Hach protocol included in
Appendix C, the total chlorine concentration is multiplied by 1.07 to get the PAA
concentration in the sample
Since UVT could not be measured directly in the laboratory study using the
available laboratory equipment, UV254 absorbance (UVA) was measured with a Hach
DR5000 instrument. This UV254, also known as the spectral absorption coefficient
(SAC), measures the amount of light absorbed by organic compounds at a specified
wavelength of 254 nm. The UV254 and UVT measurements are related by the following
equation:
UVT = 100 x 10-UVA
where UVA is the UV254 absorbance. The data was expressed in terms of UVT using the
above equation.
45
CHAPTER 4
RESULTS
4.1 UV Only Inactivation of E. coli, Total Coliform and P22 Bacteriophage
In this section, the results of the UV experiments for both the pilot and the laboratory
studies are discussed.
4.1.1 Pilot Study Results
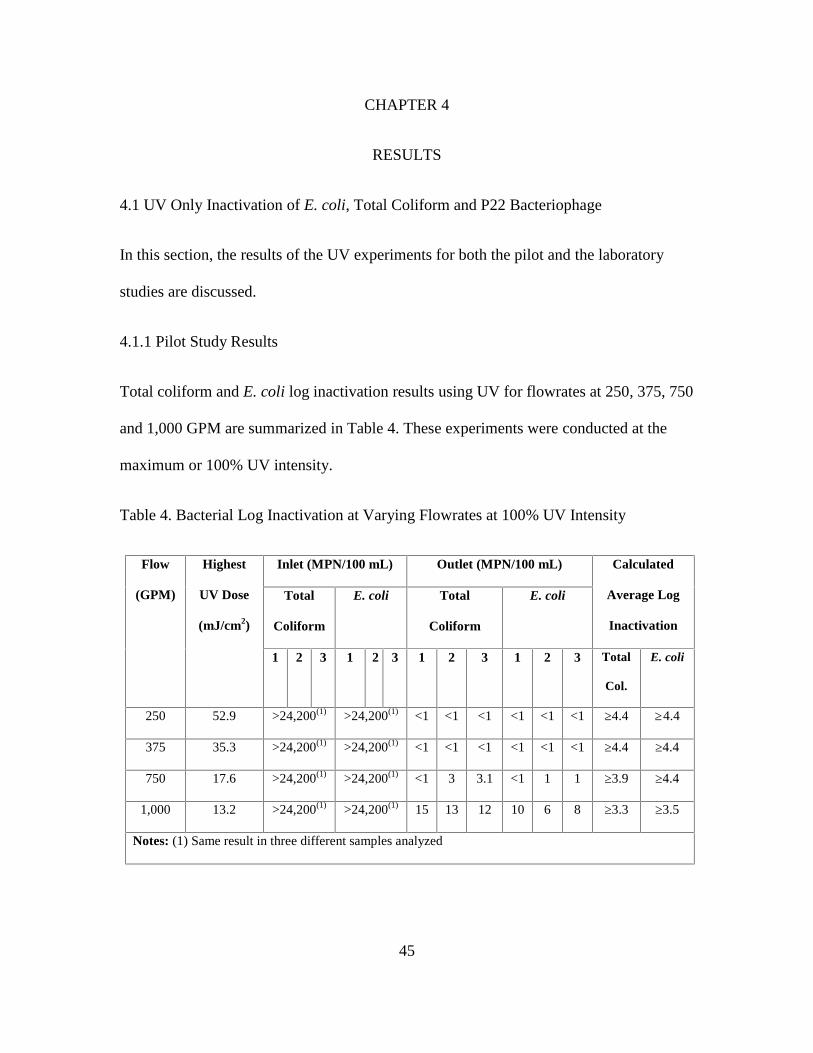
Total coliform and E. coli log inactivation results using UV for flowrates at 250, 375, 750
and 1,000 GPM are summarized in Table 4. These experiments were conducted at the
maximum or 100% UV intensity.
Table 4. Bacterial Log Inactivation at Varying Flowrates at 100% UV Intensity
Flow
(GPM)
Highest
UV Dose
(mJ/cm2)
Inlet (MPN/100 mL) Outlet (MPN/100 mL) Calculated
Average Log
Inactivation
Total
Coliform
E. coli Total
Coliform
E. coli
1 2 3 1 2 3 1 2 3 1 2 3 Total
Col.
E. coli
250 52.9 >24,200(1) >24,200(1) <1 <1 <1 <1 <1 <1 ≥4.4 ≥4.4
375 35.3 >24,200(1) >24,200(1) <1 <1 <1 <1 <1 <1 ≥4.4 ≥4.4
750 17.6 >24,200(1) >24,200(1) <1 3 3.1 <1 1 1 ≥3.9 ≥4.4
1,000 13.2 >24,200(1) >24,200(1) 15 13 12 10 6 8 ≥3.3 ≥3.5
Notes: (1) Same result in three different samples analyzed
46
The results depict high degree of coliform inactivation for the 250 and 375 GPM
flowrates. The higher flowrates (750 and 1,000 GPM) also resulted in >3 logs
inactivation of E. coli, even though the NeoTech UV unit is only designed for the 375
GPM flowrate.
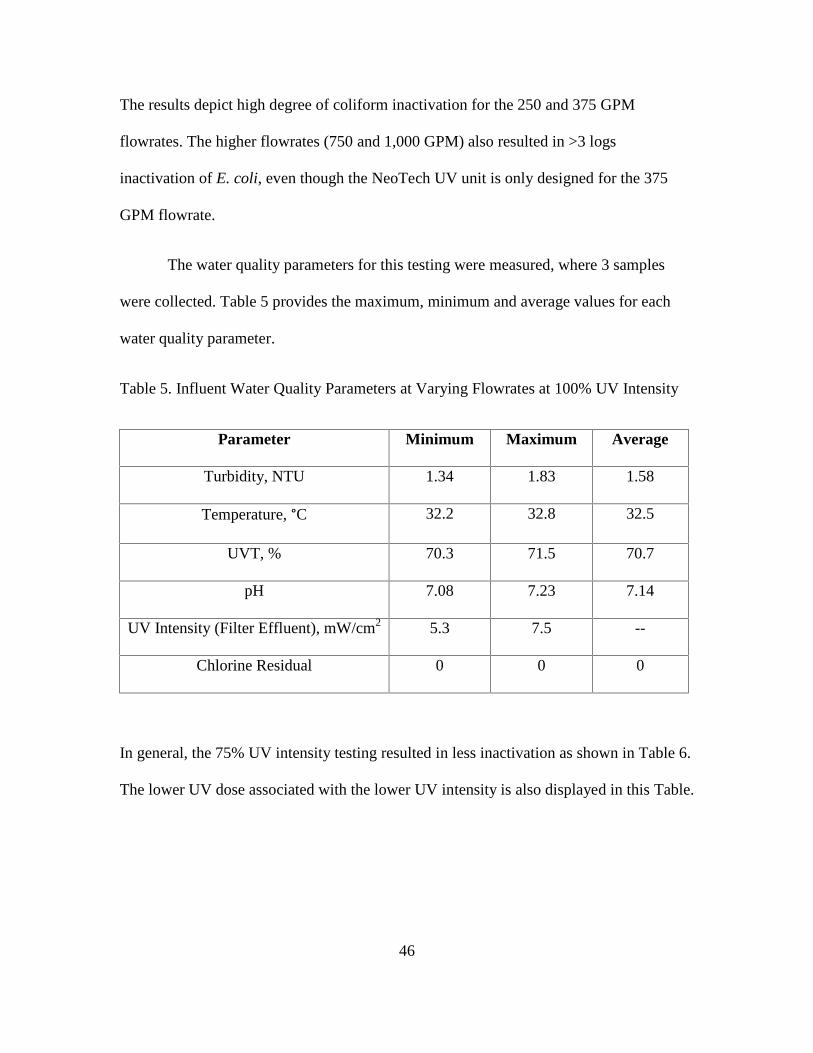
The water quality parameters for this testing were measured, where 3 samples
were collected. Table 5 provides the maximum, minimum and average values for each
water quality parameter.
Table 5. Influent Water Quality Parameters at Varying Flowrates at 100% UV Intensity
Parameter Minimum Maximum Average
Turbidity, NTU 1.34 1.83 1.58
Temperature, °C 32.2 32.8 32.5
UVT, % 70.3 71.5 70.7
pH 7.08 7.23 7.14
UV Intensity (Filter Effluent), mW/cm2 5.3 7.5 --
Chlorine Residual 0 0 0
In general, the 75% UV intensity testing resulted in less inactivation as shown in Table 6.
The lower UV dose associated with the lower UV intensity is also displayed in this Table.

47
Table 6. Bacterial Log Inactivation at Varying Flowrates at 75% UV Intensity
Flow
(GPM)
Highest
UV Dose
(mJ/cm2)
Inlet (MPN/100 mL) Outlet (MPN/100 mL) Average
Log
Inactivation
Total
Coliform
E. coli Total Coliform E. coli
1 2 3 1 2 3 1 2 3 1 2 3 Total
Col.
E.
coli
250 38.1 >120,980(1) 49,000(1) <1 <1 <1 <1 <1 <1 ≥5.1 4.7
375 25.4 >120,980(1) 59,000(1) 10 <1 7.4 1 <1 2 ≥4.5 4.7
750 12.7 >120,980(1) 64,100(1) 261 345 248 30 55 35 ≥2.6 3.3
1,000 9.5 >120,980(1) 44,500(1) >2,420 1,120 921 155 289 158 ≥2.0 2.4
Notes: (1) Same result in three different samples analyzed
The influent water quality parameters for the 75% UV intensity tests are listed in Table 7.
Table 7. Influent Water Quality Parameters at Varying Flowrates at 75% UV Intensity
Parameter Minimum Maximum Average
Turbidity, NTU 1.19 1.61 1.43
Temperature, °C 32 32.7 32.4
UVT, % 69.9 71.2 70.6
pH 7.03 7.23 7.09
UV Intensity (Filter Effluent), mW/cm2 0.7 5.4 --
Chlorine Residual 0 0 0

48
The dimmer malfunctioned when switching from the 75% to the 50% UV intensity test,
which was likely due to overheating of the dimmer from the high Arizona summer
temperature. Despite efforts to fix the broken resistors in the dimmer, the dimmer could
not be brought back to its original performance. The effect was that the electrical ballast
on the UV system began to expire and power to the lamps was lost over the course of the
test, resulting in even lower UV intensities and therefore doses. It is possible that many
lamps lost power completely resulting in low UV treatment of the filtered effluent.
Therefore, the test did not reflect the true treatment capability at 50% and was instead
closer to 28% UV intensity.
Table 8. Bacterial Log Inactivation at Varying Flowrates at <50% UV Intensity
Flow
(GPM)
Highest
UV
Dose
(mJ/cm
2)
Inlet (MPN/100 mL) Outlet (MPN/100 mL) Calculated
Average Log
Inactivation
Total
Coliform
E. coli Total Coliform(1) E. coli(2)
1 2 3 1 2 3 1 2 3 1 2 3 Total
Col.
E.
coli
250 30.3 >242,000(1) 44,100(1) >2,420(3) >2,420(3) 2 ≤1.3
375 20.2 >242,000(1) 29,100(1) 10 <1 7.4 >2,420 2 3.8
750 10.1 >242,000(1) 33,100(1) 261 345 248 >2,420 2 2.1
1,000 7.6 >242,000(1) 13,900(1) >2420 1,120 921 >2,420 2 1
Notes: (1) Same result in three different samples analyzed(2) The laboratory reported results indicate E. coli counts higher than total coliform counts,
which should not occur. The results are shown in the Table as reported based on formallaboratory reports.
(3) These results are not consistent with the rest of the data, which could be due to error(sampling or lab)

49
Table 9. Influent Water Quality Parameters at Varying Flowrates at <50% UV Intensity
Parameter Minimum Maximum Average
Turbidity, NTU 1.49 2.43 1.85
Temperature, °C 31.7 36.6 33.4
UVT, % 68.1 70.5 69.5
pH 7.01 7.28 7.10
UV Intensity (Filter Effluent), mW/cm2 0 4.3 --
Chlorine Residual 0 0 0
The series of plots displaying the log inactivation of E. coli for the experiments discussed
in this section are in Figure 11. Error bars are included on these plots to display standard
deviation in the data.

50
Figure 11. Log Inactivation of Total Coliform and E. coli for UV Pilot Study
Experiments (100%, 75%, <50% UV Intensity)

51
4.1.2 Laboratory Study Results
The UV experiments performed under laboratory conditions were performed at low,
medium and high flowrates: 2, 10 and 20 GPM. In these experiments, the UV dose was
changed by the flowrate only as the UV intensity could not be adjusted. Only E. coli was
analyzed for the 2 and 10 GPM flowrates. The 20 GPM flowrate included analysis of
both E. coli and P22 bacteriophage, and both microorganisms were added together into
the inlet barrel. Additionally, inactivation tests were performed on P22 without adding
400 mL of TSB to the inlet barrel, where TSB media is part of E. coli stock preparation.
The results for E. coli at the three flowrates and P22 bacteriophage at the high flowrate
(20 GPM, together with E.coli and separately) are shown in Tables 10 and 11.

52
Table 10. Log Inactivation of E. coli by UV under the Laboratory Conditions
Trial
Number
UV
Intensity
(mW/cm2)
UV Dose
(mJ/cm2)
Average
UV Dose
(mJ/cm2)
E. coli Concentration
(CFU/mL)
Log
Inactivation
Inlet Outlet
Low Flowrate, 2 GPM
1 22.1 164.8
166.1
3,362,500 0 >8.5
2 22.3 166.3 7,120,000 0.045 8.2
3 22.4 167.1 9,100,000 0.01 9.0
Average ≥8.2
Medium Flowrate, 10 GPM
1 24 35.8
39.3
14,750,000 0.035 8.6
2 28 41.8 12,100,000 0.01 9.1
3 27 40.3 13,250,000 0.095 8.1
Average 8.61
High Flowrate, 20 GPM
1 22.2 16.6
16.8
6,300,000 0.08 7.9
2 22.3 16.6 7,775,000 0.12 7.8
3 22.9 17.1 3,200,000 0 8.5
Average ≥7.8

53
Table 11. Log Inactivation of P22 Bacteriophage by UV under the Laboratory Conditions
Trial
Number
UV Intensity
(mW/cm2)
UV Dose
(mJ/cm2)
Average
UV Dose
(mJ/cm2)
P22 Concentration
(PFU/mL)
Log
Inactivation
Inlet Outlet
High Flowrate, 20 GPM, E. coli and P22 Bacteriophage Added
1 22.2 16.6
16.8
371,535 42.7 3.94
2 22.3 16.6 1,380,384 114.8 4.08
3 22.9 17.1 1,479,108 154.9 3.98
Average 4
High Flowrate, 20 GPM, Only P22 Bacteriophage
1 31.5 23.5
23.1
1,122,018 0 >6.05
2 30.6 22.8 1,659,587 0 >6.22
3 31 23.1 1,548,817 0 >6.19
Average >6.1
The plot displaying the comparison of E. coli and P22 log inactivation for UV
experiments is shown in Figure 12.

54
Figure 12. Log Inactivation of E. coli and P22 Bacteriophage by UV under the
Laboratory Conditions
4.2 PAA/UV Inactivation of E. coli, Total Coliform and P22 Bacteriophage
4.2.1 Pilot Study Results
The results of the testing of PAA/UV at PAA doses of 0.5, 1.0 and 1.5 mg/L is displayed in
Table 12. The testing was conducted at the 750 GPM flowrate with the required chemical
feed rate for maintaining the doses. The 100% UV Intensity was utilized. The results of the
test varied (Table 12), where some of the inlet samples were low concentrations for both
total coliform and E. coli, and some outlet sample concentrations were significantly higher
than inlet, which was not observed in the 100% UV intensity test conducted without PAA.

55
The bolded concentrations in Table 12 are the results that are believed to be inaccurate,
whether due to sampling error (including incorrect labelling of inlet and outlet samples) or
the type of analytical method used. The analytical method used by the commercial lab was
the Most Probable Number method, which is based on dilutions and may not be as accurate
compared to other analytical methods, such as membrane filtrations technique.
Table 12. Bacterial Log Inactivation at Varying PAA Dose at 750 GPM Flowrate and
100% UV Intensity
PAA
Dose
(mg/L)
Highest
UV Dose
(mJ/cm2)
Inlet (MPN/100 mL) Outlet (MPN/100 mL) Log
InactivationTotal
Coliform
E. coli Total Coliform E. coli
1 2 3 1 2 3 1 2 3 1 2 3 Total
Col.
E.
coli
0.5 16.5 >242,000(1)
, <100(2)
51,200(1),
<100(2)
>2,420
(2)
19 21 >2,420
(2)
2 1 2.3 2.6
1.0 16.5 >242,000(1)
, <100(2)
48,300(1),
100(2)
31 119 19 <1 86 1 2.6 3.1
1.5 16.5 >242,000(1)
, 2490(2)
53,300(1),
310(2)
11 26 <1 <1 <1 <1 3.9 4
Notes: (1) This number indicates the same results for two samples(2) Bolded results indicate results that appear to be affected by sampling or lab error.
The additional influent water quality parameters for the varying PAA doses at 100% UV
intensity and 750 GPM flowrate test are listed in Table 13. The water quality testing
particular to this pilot study experiment included testing the PAA concentration at the
outlet for the highest inlet PAA dose of 1.5 mg/L. The results demonstrate significant

56
decrease in PAA concentration across the UV reactor, where the average outlet
concentration indicates one-third of the inlet concentration.
Table 13. Influent Water Quality Parameters at Varying PAA Dose at 750 GPM Flowrate
and 100% UV Intensity
Parameter Minimum Maximum Average
Turbidity, NTU 1.29 1.88 1.62
Temperature, °C 31.5 31.8 31.6
UVT, % 68.2 71.7 69.8
pH 7.08 7.31 7.18
UV Intensity (Filter Effluent),
mW/cm2
5.9 7 --
Chlorine Residual 0 0 0
PAA Concentration (Outlet), mg/L 0.1 1.1 0.5
Due to the ambiguous results, another set of experiments were performed. The additional
two tests were at the higher flowrates of 750 and 1,000 GPM at 50% UV intensity. A 2
mg/L PAA dose was selected due to the results of the previous PAA/UV testing
displayed in Table 12; though, as previously mentioned, the results may have been
affected by other factors. All E. coli results with this PAA dose were non-detect, despite a
lower UV intensity and dose. However, it was observed that the inlet coliform
concentrations were lower than concentrations in the previous tests including the 100%,
75% and 50% UV intensity tests (Tables 4, 6 and 8).
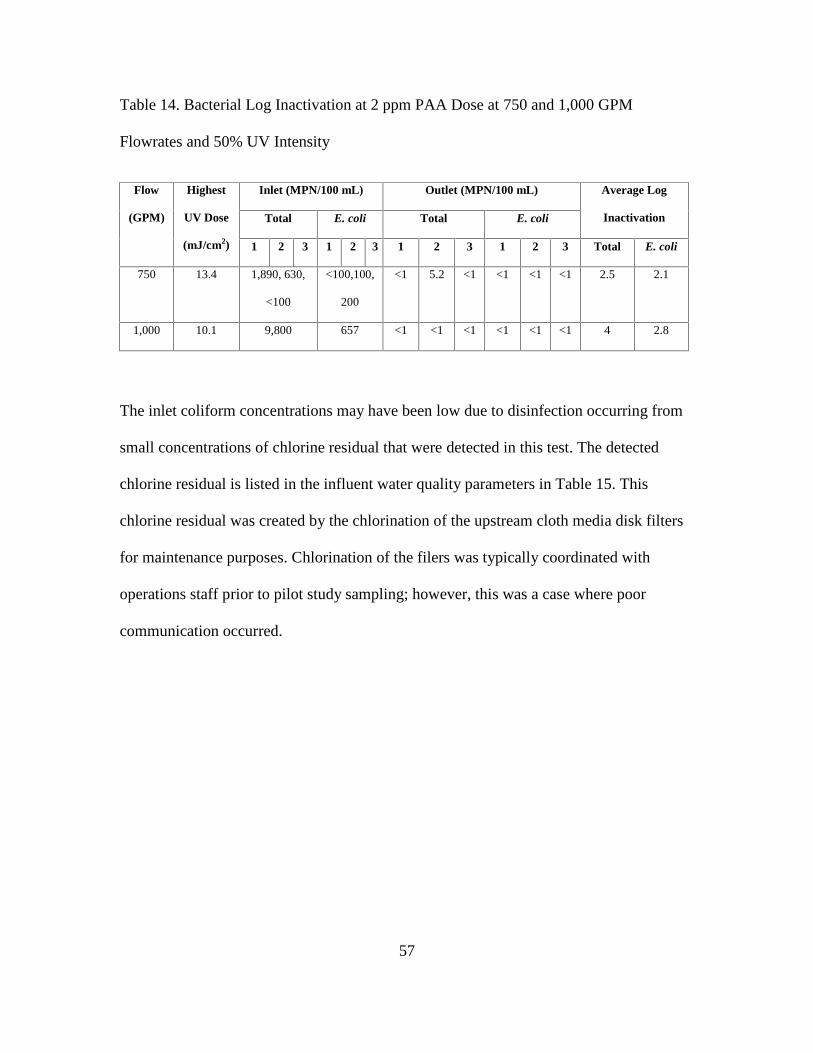
57
Table 14. Bacterial Log Inactivation at 2 ppm PAA Dose at 750 and 1,000 GPM
Flowrates and 50% UV Intensity
Flow
(GPM)
Highest
UV Dose
(mJ/cm2)
Inlet (MPN/100 mL) Outlet (MPN/100 mL) Average Log
InactivationTotal E. coli Total E. coli
1 2 3 1 2 3 1 2 3 1 2 3 Total E. coli
750 13.4 1,890, 630,
<100
<100,100,
200
<1 5.2 <1 <1 <1 <1 2.5 2.1
1,000 10.1 9,800 657 <1 <1 <1 <1 <1 <1 4 2.8
The inlet coliform concentrations may have been low due to disinfection occurring from
small concentrations of chlorine residual that were detected in this test. The detected
chlorine residual is listed in the influent water quality parameters in Table 15. This
chlorine residual was created by the chlorination of the upstream cloth media disk filters
for maintenance purposes. Chlorination of the filers was typically coordinated with
operations staff prior to pilot study sampling; however, this was a case where poor
communication occurred.

58
Table 15. Influent Water Quality Parameters at 2 ppm PAA Dose at 750 and 1,000 GPM
Flowrates and 50% UV Intensity
Parameter Minimum Maximum Average
Turbidity, NTU 1.66 2.26 1.96
Temperature, °C 31.7 31.9 31.8
UVT, % 70 70.5 70.3
pH 6.87 6.87 6.87
UV Intensity (Filter Effluent),
mW/cm2
0.4 5.7 --
Chlorine Residual 0.2 0.2 0.2
The results of the PAA/UV testing discussed above are shown in Figure 13. The sizeable
error bars in the plot displaying 100% UV intensity at the 750 GPM demonstrate the high
variability in the data collected.

59
Figure 13. Log Inactivation of Total Coliform and E. coli for PAA/UV Pilot Study
Experiments
4.2.2 Laboratory Study Results
The research results of the laboratory testing involving the PAA dosing upstream of the
UV reactor are presented in this subsection. The 0.5 mg/L PAA Dose testing was

60
completed first. Following the results of the 0.5 mg/L, a 0.25 mg/L PAA dose was
selected for the second round of experiments.
Table 16. Log Inactivation of E. coli by PAA/UV under the Laboratory Conditions at
High Flow (20 GPM) and PAA Doses of 0.5 and 0.25 mg/L
Trial
Number
UV
Intensity
(mW/cm2)
UV Dose
(mJ/cm2)
Average
UV Dose
(mJ/cm2)
E. coli Concentration
(CFU/mL)
Log
Inactivation
Inlet Outlet
20 GPM Flowrate, 0.5 mg/L PAA Dose
1 21.3 15.89
16.0
55,666,667 0 ≥9.75
2 21.3 15.89 3,800,000 0 ≥8.6
3 21.9 16.33 4,733,333 0.01 ≥8.6
Average ≥9
20 GPM Flowrate, 0.25 mg/L PAA Dose
1 22.1 16.48
16.1
25,166,667 0 ≥9.4
2 21.5 16.04 4,766,667 0 ≥8.7
3 21.3 15.89 4,300,000 0 ≥8.6
Average ≥8.9
The P22 results for this flowrate and selected PAA doses are listed in Table 17.
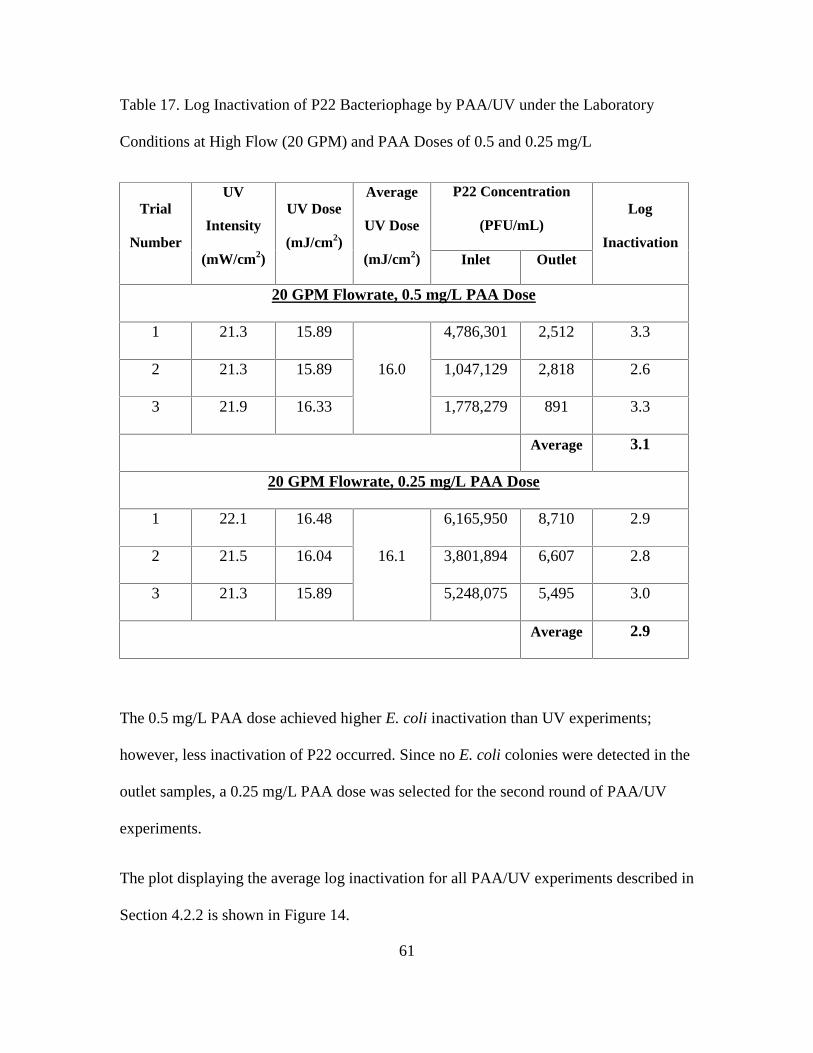
61
Table 17. Log Inactivation of P22 Bacteriophage by PAA/UV under the Laboratory
Conditions at High Flow (20 GPM) and PAA Doses of 0.5 and 0.25 mg/L
Trial
Number
UV
Intensity
(mW/cm2)
UV Dose
(mJ/cm2)
Average
UV Dose
(mJ/cm2)
P22 Concentration
(PFU/mL)Log
InactivationInlet Outlet
20 GPM Flowrate, 0.5 mg/L PAA Dose
1 21.3 15.89
16.0
4,786,301 2,512 3.3
2 21.3 15.89 1,047,129 2,818 2.6
3 21.9 16.33 1,778,279 891 3.3
Average 3.1
20 GPM Flowrate, 0.25 mg/L PAA Dose
1 22.1 16.48
16.1
6,165,950 8,710 2.9
2 21.5 16.04 3,801,894 6,607 2.8
3 21.3 15.89 5,248,075 5,495 3.0
Average 2.9
The 0.5 mg/L PAA dose achieved higher E. coli inactivation than UV experiments;
however, less inactivation of P22 occurred. Since no E. coli colonies were detected in the
outlet samples, a 0.25 mg/L PAA dose was selected for the second round of PAA/UV
experiments.
The plot displaying the average log inactivation for all PAA/UV experiments described in
Section 4.2.2 is shown in Figure 14.

62
Figure 14. Log Inactivation of E. coli and P22 Bacteriophage by PAA/UV under the
Laboratory Conditions
4.2.2.1 Water Quality and PAA Inlet/Residual Testing
The concentration of PAA at the inlet was measured to confirm that the dose
entering the UV reactor was the intended concentration. The PAA residual was also
measured when the UV was on in the reactor. The PAA concentration at the inlet and the
residual testing results for 0.25 and 0.5 mg/L doses are shown in Table 18. The values are
an average of 3 measurements.

63
Table 18. PAA Inlet and Residual Measured Concentrations for PAA/UV Tests under the
Laboratory Conditions
Intended Inlet PAA Dose
(mg/L)
Inlet PAA Concentration
(mg/L)
Residual PAA
Concentration (mg/L)
0.25 0.20 0.02
0.50 0.44 0.016
The results from Table 18 show that the measured PAA concentration at the inlet was
close to the intended dose. In fact, the actual dose in the experiments may have been
closer to this intended dose; however, some PAA may have degraded during the short
time that elapsed before measurement of each sample.
The residual PAA dose measured after the UV reactor was low, suggesting that
the PAA was quickly degraded within the UV reactor. The calculated contact time in the
UV reactor is less than one second.
The water quality for the UV and PAA/UV experiments with addition of the 400
mL of TSB was analyzed in order to determine the organic loading concentration in the
inlet water. Table 19 displays the calculated percent of UV Transmittance (UVT), which
is the light energy that reaches the detector and is calculated from the UV Absorption
(UVA) at 254 nm wavelength according to the equation in Section 3.4. The dissolved
organic carbon (DOC) was also measured (Table 19). The instrument used for measuring
DOC was not calibrated to provide accurate readings for concentrations above 20 mg/L.
The DOC measurement was approximately 98 mg/L for all sample types. Due to the fact
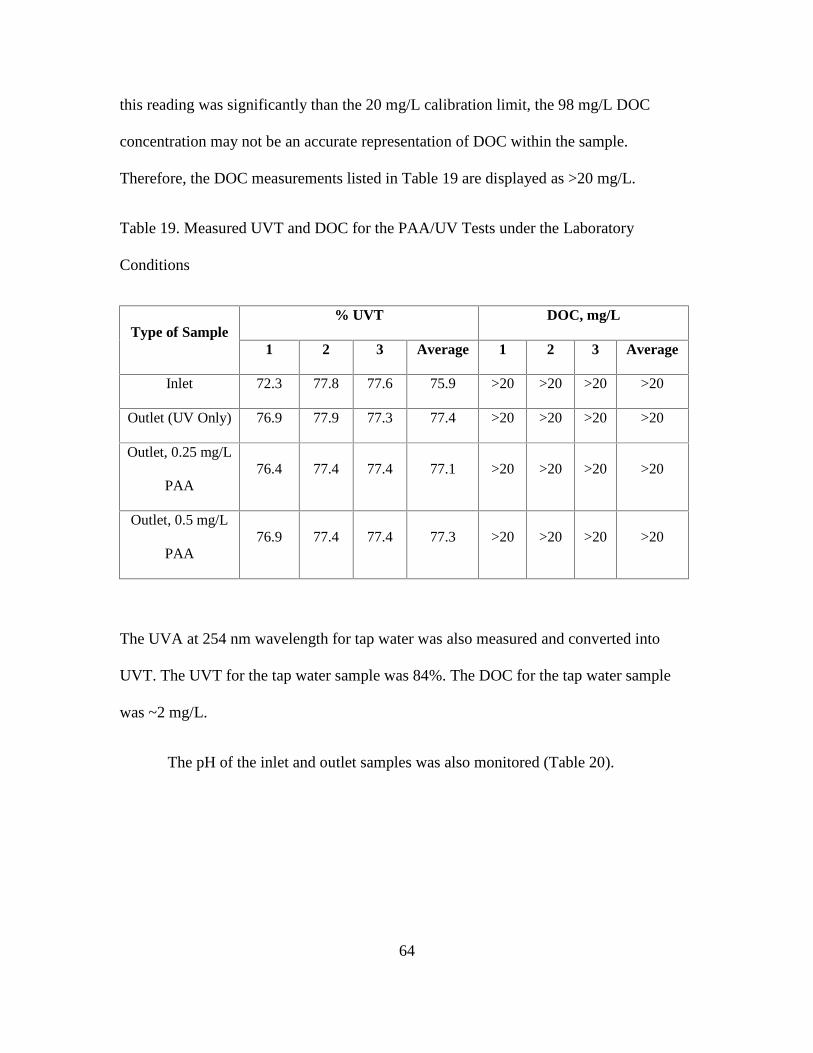
64
this reading was significantly than the 20 mg/L calibration limit, the 98 mg/L DOC
concentration may not be an accurate representation of DOC within the sample.
Therefore, the DOC measurements listed in Table 19 are displayed as >20 mg/L.
Table 19. Measured UVT and DOC for the PAA/UV Tests under the Laboratory
Conditions
Type of Sample% UVT DOC, mg/L
1 2 3 Average 1 2 3 Average
Inlet 72.3 77.8 77.6 75.9 >20 >20 >20 >20
Outlet (UV Only) 76.9 77.9 77.3 77.4 >20 >20 >20 >20
Outlet, 0.25 mg/L
PAA76.4 77.4 77.4 77.1 >20 >20 >20 >20
Outlet, 0.5 mg/L
PAA76.9 77.4 77.4 77.3 >20 >20 >20 >20
The UVA at 254 nm wavelength for tap water was also measured and converted into
UVT. The UVT for the tap water sample was 84%. The DOC for the tap water sample
was ~2 mg/L.
The pH of the inlet and outlet samples was also monitored (Table 20).
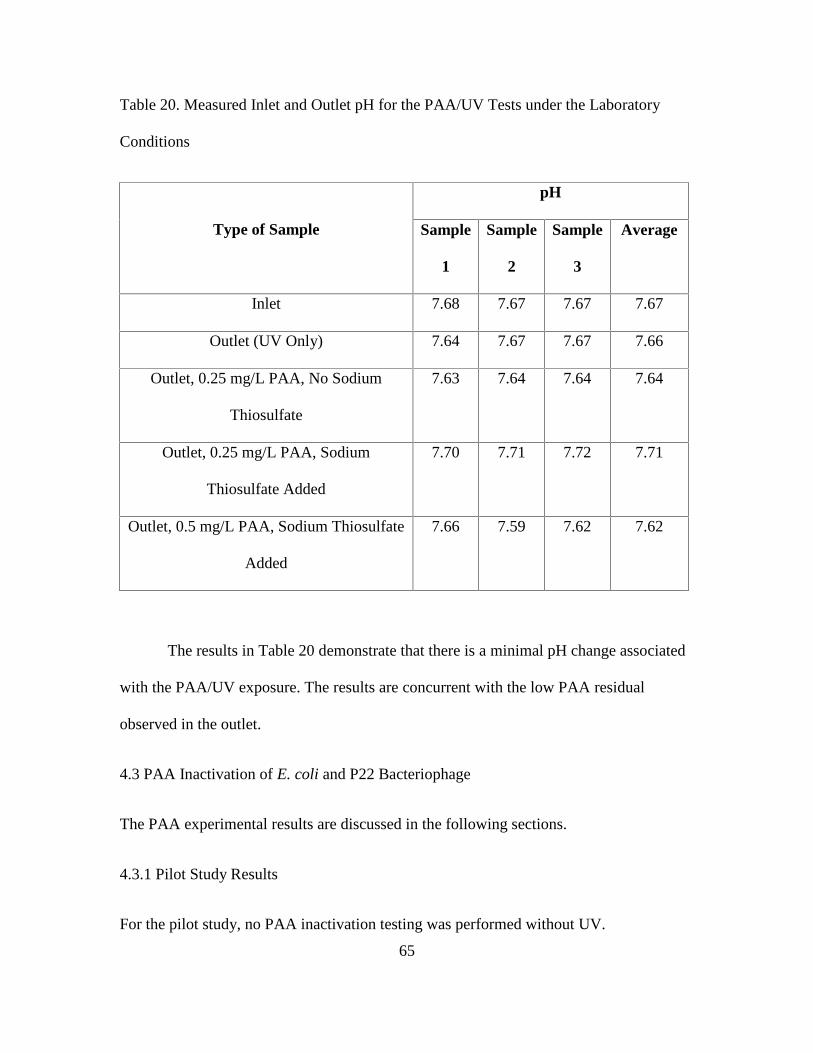
65
Table 20. Measured Inlet and Outlet pH for the PAA/UV Tests under the Laboratory
Conditions
Type of Sample
pH
Sample
1
Sample
2
Sample
3
Average
Inlet 7.68 7.67 7.67 7.67
Outlet (UV Only) 7.64 7.67 7.67 7.66
Outlet, 0.25 mg/L PAA, No Sodium
Thiosulfate
7.63 7.64 7.64 7.64
Outlet, 0.25 mg/L PAA, Sodium
Thiosulfate Added
7.70 7.71 7.72 7.71
Outlet, 0.5 mg/L PAA, Sodium Thiosulfate
Added
7.66 7.59 7.62 7.62
The results in Table 20 demonstrate that there is a minimal pH change associated
with the PAA/UV exposure. The results are concurrent with the low PAA residual
observed in the outlet.
4.3 PAA Inactivation of E. coli and P22 Bacteriophage
The PAA experimental results are discussed in the following sections.
4.3.1 Pilot Study Results
For the pilot study, no PAA inactivation testing was performed without UV.

66
4.3.2 Laboratory Study Results
The PAA experiments were conducted separately for E. coli and P22. The experiments
were conducted using tap water and PBS buffer for E.coli and P22, respectively. The
average E. coli inactivation at 5, 10 and 30 minutes of contact time is displayed in Table
21. A zero is incorporated into the calculated average for tests where no inactivation was
observed.
A control experiment was performed without PAA to measure the natural
inactivation of E. coli in water over time, which could potentially be due to external
factors. Out of the three experiments, the maximum average inactivation after 30 minutes
was 0.12 log. There was no inactivation after 5 and 10 minutes exposure time.

67
Table 21. Log Inactivation of E. coli by PAA under the Laboratory Conditions
Trial
Number
PAA
Dose
(mg/L)
Average
PAA Dose
(mg/L)
E. coli Concentration
(CFU/mL)
Log
Inactivation
Inlet Outlet
0.25 mg/L PAA Dose
5 Minutes of Contact Time
1 0.26
0.25
40,000 69,000 None
2 0.24 33,500 26,500 0.10
3 0.26 29,500 44,000 None
Average 0.03
10 Minutes of Contact Time
1 0.26
0.25
40,000 52,500 None
2 0.24 33,500 22,000 0.18
3 0.26 29,500 39,500 None
Average 0.06
30 Minutes of Contact Time
1 0.26
0.25
N/A N/A N/A
2 0.24 33,500 3,050 1.04
3 0.26 29,500 32,000 None
Average 0.52
0.50 mg/L PAA Dose
5 Minutes of Contact Time
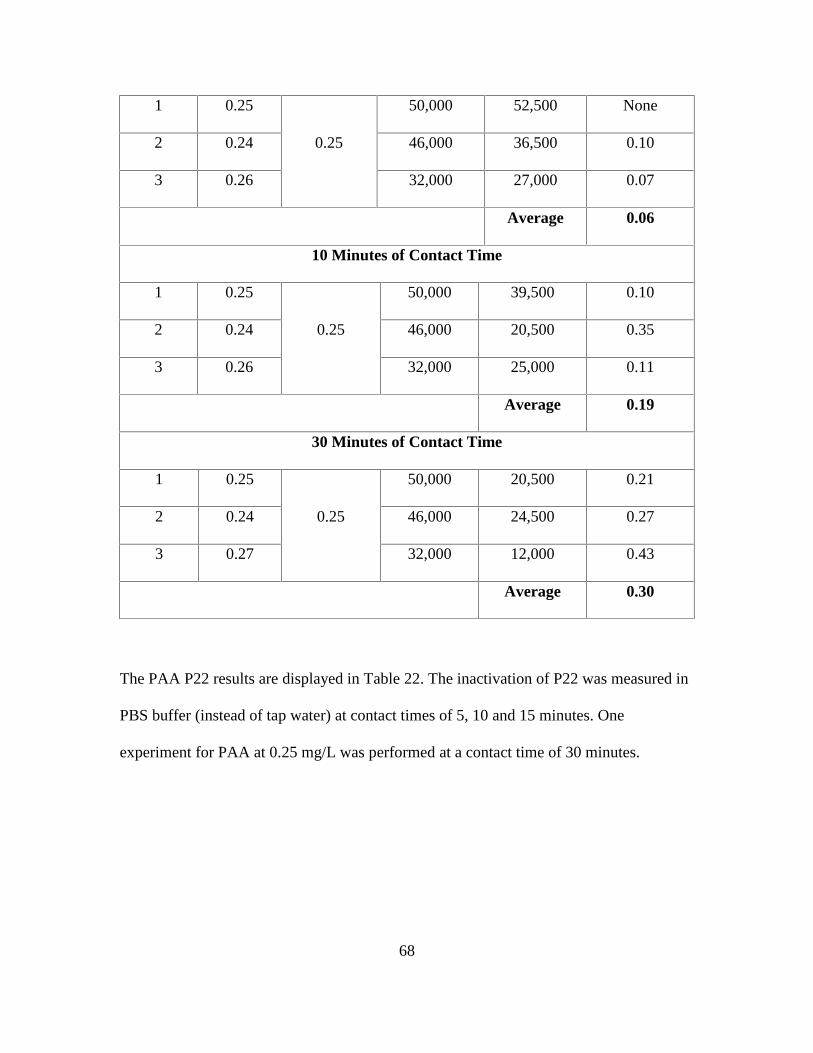
68
1 0.25
0.25
50,000 52,500 None
2 0.24 46,000 36,500 0.10
3 0.26 32,000 27,000 0.07
Average 0.06
10 Minutes of Contact Time
1 0.25
0.25
50,000 39,500 0.10
2 0.24 46,000 20,500 0.35
3 0.26 32,000 25,000 0.11
Average 0.19
30 Minutes of Contact Time
1 0.25
0.25
50,000 20,500 0.21
2 0.24 46,000 24,500 0.27
3 0.27 32,000 12,000 0.43
Average 0.30
The PAA P22 results are displayed in Table 22. The inactivation of P22 was measured in
PBS buffer (instead of tap water) at contact times of 5, 10 and 15 minutes. One
experiment for PAA at 0.25 mg/L was performed at a contact time of 30 minutes.

69
Table 22. Log Inactivation of P22 Bacteriophage by PAA under the Laboratory
Conditions
Trial
Number
PAA
Dose
(mg/L)
Average
PAA Dose
(mg/L)
P22 Concentration
(PFU/mL)
Log
Inactivation
Inlet Outlet
0.25 mg/L PAA Dose
5 Minutes of Contact Time
1 0.26
0.25
4,295,000 - -
2 0.24 2,650,000 1,900,000 0.14
3 0.26 3,200,000 2,200,0000 0.16
Average 0.15
10 Minutes of Contact Time
1 0.26
0.25
4,295,000 3,205,000 0.13
2 0.24 2,650,000 2,050,000 0.18
3 0.26 3,200,000 2,200,000 0.16
Average 0.16
15 Minutes of Contact Time
1 0.26
0.25
4,295,000 - -
2 0.24 2,650,000 1,900,000 0.14
3 0.26 3,200,000 2,250,000 0.15
Average 0.15
30 Minutes of Contact Time

70
1 0.26 - 4,295,000 2,200,000 0.29
0.50 mg/L PAA Dose
5 Minutes of Contact Time
1 0.25
0.25
5,000,000 4,200,000 0.08
2 0.24 5,350,000 3,500,000 0.18
3 0.26 4,700,000 3,850,000 0.09
Average 0.12
10 Minutes of Contact Time
1 0.25
0.25
5,000,000 4,050,000 0.09
2 0.24 5,350,000 3,200,000 0.22
3 0.26 4,700,000 3,300,000 0.15
Average 0.15
15 Minutes of Contact Time
1 0.25
0.25
5,000,000 3,050,000 0.21
2 0.24 5,350,000 2,600,000 0.31
3 0.27 4,700,000 2,400,000 0.29
Average 0.27
Figure 15 depicts the results of the E. coli and P22 bacteriophage inactivation for the 0.25
and 0.5 mg/L PAA doses at the different contact times.

71
Figure 15. Log Inactivation of E. coli and P22 Bacteriophage by PAA under the
Laboratory Conditions
4.4 NDMA Removal by UV and PAA/UV
The NDMA removal experiments were conducted with UV as well as PAA/UV. The
average UV doses for these experiments were 700 and 100 mJ/cm2 for 0.5 and 4 GPM
flowrates, respectively (Table 23).

72
Table 23. NDMA Removal by UV and PAA/UV at 0.5 and 4 GPM Flowrates
Experiments Average NDMA Concentration
(ng/L)
% NDMA Removal
Inlet Outlet
0.5 GPM, UV 655 19 97.1
0.5 GPM, 0.5 mg/L
PAA/UV
655 37 94.4
4 GPM, UV 655 343 47.6
4 GPM, 0.5 mg/L
PAA/UV
655 330 49.6
There is a slight increase in the percent NDMA removal for the 4 GPM flowrate when
0.5 mg/L PAA was added upstream of the UV reactor; however, there is no significant
change in percent removal for both flowrates (Figure 16).

73
Figure 16. Percent NDMA Removal for UV and 0.5 mg/L PAA/UV for 0.5 and 4 GPM
Flowrates

74
CHAPTER 5
DISCUSSION
Results from the pilot and the laboratory studies provided useful information pertaining
to advanced oxidation processes (AOP’s), as well as ultraviolet irradiation (UV) and
peracetic acid (PAA) disinfection capability as primary disinfectants. The treatment
capability was analyzed in terms of disinfection and chemical degradation.
Microorganisms studied for disinfection were total coliforms, E. coli and P22
bacteriophage as a surrogate for enteric viruses. The chemical studied in terms of
degradation was NDMA.
The pilot study performed on tertiary-treated (filter effluent) wastewater at the
Palo Verde Water Reclamation Plant focused on total coliform and E. coli inactivation
and monitoring of several physico-chemical water quality parameters. As shown in Table
4, the experimental data from the pilot study conducted at 100% UV intensity showed
that the NeoTech Inline Magnum UV unit was capable of disinfecting >4 logs of E. coli
at flowrates above its 95% UVT rated capacity of 375 GPM, with <2 MPN/100 mL E.
coli at the outlet of the reactor at 750 GPM flowrate (equivalent to a UV dose of
approximately 18 mJ/cm2). Even under the high flowrate condition of 1,000 GPM (13
mJ/cm2), 10 MPN/100 mL or less E. coli cells were detected in the outlet, which
translates into >3 logs of E. coli inactivation.
The experiments conducted at 75% UV intensity, in general, had a higher initial
E. coli concentration at the inlet than the experiments conducted at 100% UV intensity.
Even with these higher initial concentrations of E. coli, the log inactivation was slightly

75
less at 3 logs for a 12.7 mJ/cm2 UV dose as shown in Table 6. Generally, lower E.coli
inactivation levels were achieved at higher flowrates, with 3.2 and 2.3 logs at 750 and
1,000 GPM flowrates, respectively.
The experiments conducted at the <50% UV intensity produced anomalous results
as the E. coli concentrations (>2,420 MPN/100 mL) were greater than the total coliform
concentrations (261, 345 and 248 MPN/100 mL) in outlet samples for all flowrates
(Table 8). These reported results appear inaccurate since the total coliform concentrations
are expected to be greater than the E. coli concentrations as E. coli are a subpopulation of
total coliforms. If the E. coli and total coliform concentrations in this Table are switched,
the results are consistent with the other UV data previously discussed showing
approximately 3.7 logs of E. coli inactivation at the UV dose of 20 mJ/cm2.
According to ATG UV technology, UV systems at wastewater treatment plants
are specified for 30 mJ/cm2 for UVT ranging from 50% to 80%. Hassen et al. (2000)
recommends that UV doses do not fall below 30 mJ/cm2. In the pilot scale experiments
conducted using UV, the UVT ranged from 68 to 72%. The results highlight the potential
application of the NeoTech Inline Magnum UV unit for improving the bacteriological
quality of the filter effluent at the Palo Verde Water Reclamation Plant. The technology
requires a UV dose that is approximately half of the typically specified 30 mJ/cm2 UV
dose. The capability of adequate disinfection at lower UV doses may be due to the unique
design attributes of the NeoTech UV unit that includes the reflective interior to
effectively spread the UV light throughout the UV reactor. Additional experiments
should be performed to measure the unique capability of the NeoTech UV technology

76
against a broad range of microorganisms such as viruses, parasites and bacteria listed in
the U.S EPA Candidate Contaminant List.
The UV experiments performed under the laboratory conditions for E. coli
indicates that the log inactivation is proportional to UV dose. The water used in the
experiments performed under laboratory conditions was tap water. Experiments
conducted with the E. coli utilized tap water spiked with the cells suspended in TSB
resulting in the test water containing a significant DOC concentration, which was
measured to be >20 mg/L in all samples (Table 19). The average UVT for the test water
ranged from 75.9 to 77.4%, whereas the measured UVT of tap water was approximately
85% indicating that the addition of the organics decreased the UVT resulting in less UV
light transmitted through test water than regular tap water.
The UVT measured for test water used in the laboratory studies is within the
typical wastewater range of 50% to 80% (ATG Technology). Despite a lower UVT,
approximately 8 logs of E. coli was inactivated with an average UVT ranging from 75.9
to 77.4%. According to literature DOC concentrations in raw wastewater can be
approximately 70 mg/L (Katsoyiannis and Samara, 2007; Amiel et al., 1990). Though a
precise measurement was not provided due to calibration limits of the instrument, the
measured DOC in the test water (>20 mg/L) was still significantly higher than the DOC
concentration of tap water (~2 mg/L), further indicating a high organics content in the
test water.
The UV experiments conducted under the laboratory conditions resulted in
approximately 4 logs inactivation of P22 (a surrogate for enteric viruses) at the UVT (~

77
76%) and at a UV dose of ~17 mJ/cm2. Without the addition of the 400 mL of Tryptic
Soy Broth (TSB) in the influent water, P22 inactivation was ≥ 6 logs for a UV dose of
~23 mJ/cm2. Since both experiments were performed at the same flowrate, the observed
difference between the inactivation of P22 with E. coli in test water at the DOC of >20
mg/L was correlated with an increased UV intensity, which is directly linked to the water
quality. As reported in literature, ~2 logs of P22 are inactivated at a 30 mJ/cm2 UV Dose
using a low pressure UV system in PBS (Linden and Sobsey, 2005).
Comparing the inactivation results of E. coli and P22 from this study with
published data indicate that the selected NeoTech UV unit provides higher microbial
inactivation compared with other UV based microbial inactivation devices. Once again,
the higher observed inactivation may be due to the reflective coating within the reactor.
PAA/UV experiments were performed both in the pilot scale and the laboratory
scale studies. The pilot study total coliform and E. coli concentrations in the influent
samples for PAA/UV were significantly lower than observed in the UV pilot study
experiments. The possible reason for variation in influent concentrations may be ascribed
to the fact that the inlet sampling port was located in close proximity upstream of the
PAA injection port, which may have caused minor reverse flow of the PAA back through
the sampling port. Pulling some PAA into the sample bottle may have provided
additional disinfection in the sample (no sample quenching was used). In addition, the
influent water quality in the PAA/UV pilot study indicates low levels of chlorine residual
in the 2 ppm PAA dose/UV experiment. The low level of chlorine residual observed is
attributed to the chlorination of the cloth-media disk filters located upstream of the pilot

78
scale UV unit. Though chlorination of the filters was typically coordinated with plant
operations staff to ensure no chlorine residuals during pilot study testing, chlorination of
the filters during the 2 ppm PAA dose/UV experiment was necessary to maintain
operation of the plant, and it was unknown that chlorine residual was present in the
influent samples until after samples had been collected. The low inlet chlorine residual
may correspond with low inlet coliform concentrations (Table 14).
The inlet concentrations in the varying PAA dose (0.5, 1 and 1.5 mg/L)/UV
experiment showed wide variation. The inconclusive results indicate that no concrete
conclusion can be derived from the data. One noteworthy observation in the PAA/UV
pilot study is that the water quality parameters did not significantly change, particularly
pH, from inlet to outlet. A few water quality measurements performed on inlet and outlet
sampling ports determined that the outlet PAA residual was a fraction of the injected
PAA concentration. The lower outlet PAA residual indicates that the PAA may have been
degraded quickly within the UV reactor.
The laboratory PAA/UV study was conducted using the E. coli and P22. Injection
of PAA upstream of the UV reactor resulted in increased E. coli inactivation in
comparison to UV inactivation. However, P22 inactivation was decreased when PAA
was injected upstream of the UV reactor. The organics content of water could decrease
the effectiveness of the UV by absorbing UV light. In addition, E. coli cells are much
larger in size than P22 and they could shield P22 as the microorganisms flow through the
chamber. Addition of the PAA could result in breaking up the organics contents in the
water to further prevent inactivation of P22. This possibility is merely conjecture based
79
on the observation of decrease in the P22 inactivation when PAA was added. Additional
studies need to be performed to further investigate this phenomenon. The outlet samples
collected in the PAA/UV experiments indicate a significant decrease in the PAA residual
concentration (approximately one-tenth of the inlet PAA concentration was detected in
the outlet sample). Based on these results, it is presumed that PAA is effectively broken
down within the UV reactor indicating that the PAA is efficiently used when in
combination with the UV.
In the PAA experiments performed under the laboratory conditions, minimal
inactivation (<1 log) of E. coli and P22 was observed even after significant contact time
of 30 minutes. The results are consistent with literature discussed in Section 2.2.1. For
example, significantly higher PAA doses (2-7 mg/L) are required to achieve 3 logs
inactivation of total coliform with 4-27 minutes of contact time (Koivunen and Heinonen-
Tanski, 2005). The results of this study is supported by the literature and indicate that
PAA is not effective as a primary disinfectant of E. coli and P22, particularly at the lower
PAA doses of 0.25 and 0.50 mg/L.
The experiments conducted for the removal of NDMA under the laboratory
conditions demonstrated high NDMA removal with UV treatment, obtaining
approximately 48% removal at 4 GPM and 97% removal at 0.5 GPM. Though the UV
degraded a high percent of NDMA, the flowrates selected are much lower than the rated
capacity and the experiments were conducted using tap water (UVT ~85%). Therefore,
this high degradation was obtained at much higher UV doses, but it is unknown whether
lower UV doses would result in a similar removal. Adding 0.5 mg/L PAA upstream of

80
the UV reactor did not significantly increase NDMA removal. The NDMA removal
increased to 50% for the 4 GPM flowrate when 0.5 mg/L PAA was dosed, but did not
increase for the 0.5 GPM flowrate. Therefore, adding the PAA at 0.5 mg/L upstream of
the UV reactor did not provide significant additional chemical oxidation of NDMA.
The results of the pilot and the laboratory studies may help in understanding
treatment capability of AOP’s. However, there are copious tangential research
experiments that should be conducted to better understand the PAA/UV AOP process. In
particular, the experiments need to be repeated with varying water quality parameters
(DOC, turbidity, UVT, pH, etc.) to examine the effects of each water quality parameter
on PAA/UV treatment. The components within wastewater may provide a disadvantage
for system treatment, which was suggested by the lower inactivation of P22 observed
when PAA was injected upstream. In addition, other microorganisms and chemical
compounds should be studied in terms of disinfection and degradation.
Further investigation may aid in implementing this technology for large scope
applications. The benefits of the process—including the “green” nature of the PAA—
warrant further analysis. Though only an emerging technology, the preliminary results
have revealed potential for its effective use through the combination of PAA and UV.
With relatively small PAA doses required, there is opportunity for the process to be cost-
effective, while providing additional treatment. Future regulation shifts should also be
considered. As the U.S EPA studies more contaminants in terms of health, regulations
may be adopted that include more contaminants or lower limits on regulated
contaminants. The Contaminant Candidate List (CCL) indicates contaminants that are

81
considered for future regulation. If studies suggest that a contaminant from the CCL is to
be regulated, scope of treatment may need to be modified in order to provide effective
treatment of the regulated contaminant if conventional treatment (such as UV) does not
adequately remove/inactivate the contaminant. The PAA/UV AOP may be a solution for
various issues in the future, where the goal is to provide the safe water sources for global
use applications.

82
REFERENCES
Abbaszadegan, M., Mayer, B., Ryu, H., Nwachuku, N., 2007. Efficacy of removal ofCCL viruses under enhanced coagulation conditions. Environ. Sci. Technol. 41 (3),971-977.
Adams, M., 1959. Bacteriophages. Interscience Publishers, New York, NY.
Amiel, A.J., Magaritz, M., Ronen, D., Lindstrand, O., 1990. Dissolved organic carbon inthe unsaturated zone under land irrigated by wastewater effluent. Research J WaterPollut. Control Fed. 62, 861-866.
Andreozzi, R., Caprio, V., Insola, A., Marotta, R., 1999. Advanced oxidation processes(AOP) for water purification and recovery. Catalysis Today 53, 51-59.
ATG UV Disinfection UV Technology. UV Dose & System Selection. Retrieved fromhttp://www.atguv.com/uv-dose-system-selection (3/30/2017)
Bergendahl, J., O’Shaughnessy, J., 2005. Applications of advanced oxidation forwastewater treatment, WPI 508, 831-5772.
Block, P., Reimers, R., Xu, Y., 2015. Use of Peracetic Acid as a Wastewater Disinfectantto Eliminate the Formation of Chlorinated Disinfection By-products and Inhibit theActivity of Endocrine Disrupting Compounds. PeroxyChem. Tulane University (NewOrleans, Louisiana). Retrieved from http://www.wwdmag.com/sites/wwdmag.com/files/PAA%20EDC_whitepaper.pdf (3/30/2017)
Blount, Z., 2015. The unexhausted potential of E. coli. eLife, 4, e05826. Retrieved fromhttp://doi.org/10.7554/eLife.05826 (3/30/2017)
Briley, D.S., 2015. UV Disinfection for Drinking Water. American Water WorksAssociation. Virginia AWWA 2015 Operators Conference. Virginia Beach, VA.Retrieved from http://www.vaawwa.org/file/Committees/Plant%20Operations/2015%20Plant%20Ops%20UV%20Disinfection.pdf (3/30/2017)
Caretti, C., Lubello, C., 2003. Wastewater disinfection with PAA and UV combinedtreatment: a pilot plant study. Water Research 37 (10), 2365-2371.
Hassen, A., Mahrouk, M., Ouzari H., Cherif, M., Boudabous, A., Damelincourt, J.J.,2000. UV disinfection of treated wastewater in a large-scale pilot plant andinactivation of selected bacteria in a laboratory UV device. Bioresource Technology.74, 141-150.
Huang, C.P., Dong, C., Tang, Z., 1993. Advanced Chemical Oxidation: Its Present Roleand Potential Future in Hazardous Waste Treatment. Waste Management. 13, 361-377.
83
Jobb, D.B., Hunsinger, R.B., Meresz, O., 1994. Removal of N-nitrosodimethylaminefrom the Ohsweken (Six Nations) water supply final report, Ontario Ministry ofEnvironment and Energy. Queen’s Printer for Ontario.
Katsoyiannis, A., Samara, C., 2007. The fate of dissolved organic carbon (DOC) in thewastewater treatment process and its importance in the removal of wastewatercontaminants. Environ. Sci. Pollut. Res. Int. 14, 284-292.
Kishimoto, N., Nakamura, E., 2012. Bromate Formation Characteristics of UVIrradiation, Hydrogen Peroxide Addition, Ozonation, and Their CombinationProcesses. International Journal of Photoenergy 2012, 93-102.
Kitis, M., 2004. Disinfection of wastewater with peracetic acid: a review. EnvironmentInternational 30, 47-55.
Koivunen, J., Heinonen-Tanski, H., 2005. Peracetic acid (PAA) disinfection of primary,Secondary and tertiary treated municipal wastewaters. Water Research. 39 (18), 4445-4453.
Liang, S., 2002. Photolysis and advanced oxidation processes for NDMA removal fromdrinking water. Presentation at the Fourth Symposium in the Series on GroundwaterContaminants: Perchlorate and NDMA in Groundwater: Occurrence, Analysis andTreatment; Groundwater Resources Association of California, April 17. Baldwin Park,CA.
Linden, K.G., Sobsey, M.D., 2005.Final report: effectiveness of UV irradiation forpathogen inactivation in surface waters. United States Environmental ProtectionAgency (U.S EPA). Retrieved from https://cfpub.epa.gov/ncer_abstracts/index.cfm/fuseaction/display.highlight/abstract/1128/report/F (3/30/2017)
Luukkonen, T., Teeriniemi, J., Prokkola, H., Ramo, J., Lassi, U., 2014. Chemical aspectsof peracetic acid based wastewater disinfection. Water SA. 40 (1), 73-80.
Martin, L., 2014. EPA Investigates Chlorine Alternative. Water Online. VertMarkets, Inc.Retrieved from https://www.wateronline.com/doc/epa-investigates-peracetic-acid-as-a-green-alternative-to-chlorine-0001 (3/30/2017)
Mitch, W.A., Sharp, J.O., Trussell, R.R., Valentine, R.L., Alvarez-Cohen, L., SedlakD.L., 2003. N-Nitrosodimethylamine (NDMA) as a Drinking Water Contaminant: AReview. Env. Eng. Sci. 20 (5), 389-404.
Mohajerani, M., Mehrvar, M., Ein-Mozaffari, F., 2009. An overview of the integration ofadvanced oxidation technologies and other processes for water and wastewatertreatment. International Journal of Engineering. 3 (2), 120-146.
Rhoades, M., MacHattie, L.A., Thomas, C.A., 1968. The P22 bacteriophage DNAmolecule. J. Mol. Biol. 37, 21-40.

84
Susskind, M.M., and Botstein, D., 1978. Molecular genetics of Bacteriophage P22.Microbiol. Rev. 42, 385-413.
Tokarz-Deptula, B., Sliwa-Dominiak, J., Adamiak, M., Deptula, T., Nowak, M., Deptula,W., 2011. Application of bacteriophages-selected data. Centr. Eur.. Immunol. 36 (2),87-91.
Tomkins, B.A., and Griest, W.H., 1996. Determination of N-nitrosodimethylamine aspart-per-trillion concentrations in contaminated groundwaters and drinking waterfeaturing carbon-based membrane extraction disks. Anal. Chem. 68, 2533-2540.
Tomkins, B.A., Griest, W.H., and Higgens, C.E., 1995. Determination of N-nitrosodimethylamine at part-per-trillion levels in drinking waters and contaminatedgroundwaters. Anal. Chem. 67, 4387-4395.
United States Army Public Health Command, 2011. Ultraviolet light disinfection in theuse of individual water purification devices. Technical Information Paper #31-006-0211. Retrieved from https://phc.amedd.army.mil/PHC%20Resource%20Library/Ultraviolet%20Light%20Disinfection%20in%20the%20Use%20of%20Individual%20Water%20Purification%20Devices.pdf (3/30/2017)
United States Environmental Protection Agency (U.S EPA), 2014. Technical Fact Sheet:N-Nitroso-dimethylamine (NDMA).Office of Solid Waste and Emergency Response.EPA 505-F-14-005.
United States Environmental Protection Agency (U.S EPA), 2012. AlternativeDisinfection Methods Fact Sheet: Peracetic Acid. EPA 832-F-12-030.
United States Environmental Protection Agency (U.S EPA), 1999a. WastewaterTechnology Fact Sheet Chlorine Disinfection. EPA 832-F-99-062.
United States Environmental Protection Agency (U.S EPA), 1999b. WastewaterTechnology Fact Sheet Ultraviolet Disinfection. EPA 832-F-99-064.
United States Environmental Protection Agency (U.S EPA), 1999c. Combined SewerOverflow Technology Fact Sheet Alternative Disinfection Methods. EPA 832-F-99-033.
Wilson, J., 2014. Peracetic acid as an alternative disinfectant. NYWEA. Clear Waters,17-19. Retrieved from https://nywea.org/clearwaters/uploads/71.pdf (3/30/2017)
Wodalski, E., 2012. Wastewater Disinfectant Offers Alternative to Bleach. TreatmentPlant Operator. Cole Publishing Network. Retrieved from http://www.tpomag.com/editorial/2012/09/wastewater_disinfectant_offers_alternative_to_bleach (3/30/2017)

85
Zheng, Y., Dunets, S., Cayanan, D., (n.d.). Peracetic/peroxyacetic acid. Greenhouseand Nursery Water Treatment Information System. School of Environmental Sciences,University of Guelph, Ontario, Canada. Retrieved from http://www.ces.uoguelph.ca/water/PATHOGEN/PeroxyaceticAcid.pdf. (3/30/2017)

86
APPENDIX A
SOLVAY PERACETIC ACID MATERIAL SAFETY DATA SHEET PROXITANE
WW-12

87
Product Safety SummaryPeracetic AcidCAS No. 79-21-0
This Product Safety Summary is intended to provide a general overview of thechemical substance. The information on the summary is basic information and isnot intended to provide emergency response information, medical information ortreatment information. The summary should not be used to provide in-depthsafety and health information. In-depth safety and health information can befound on the Safety Data Sheet (SDS) for the chemical substance.
Names
Peracetic acid (PAA)
Peroxyacetic acid
Ethaneperoxy acid
Peroxyethanoic acid
Equilibrium peracetic acid
Proxitane®
Product Overview
Solvay Chemicals, Inc. does not sell peracetic acid (PAA) directly toconsumers. Solvay Chemicals, Inc.’s PAA is a mixture of peracetic acid,hydrogen peroxide, acetic acid and water. PAA can be used as an oxidant inchemical processes or as a bleaching agent. However, most of the PAA sold inNorth America is used as an antimicrobial, disinfectant or biocide. In the UnitedStates, these applications are typically regulated by the Food and DrugAdministration (FDA) or the Environmental Protection Agency (EPA).
Exposure to PAA can cause severe irritation, burns and other health effects to theskin, eyes and respiratory tract. Ingestion should be avoided at all concentrations.Most PAA is consumed in applications where it is used; however, it is notpersistent in the environment and decomposes to acetic acid, water and oxygenwhen exposed to soils, sediments and surface or ground waters.
Manufacture of Product
PAA is manufactured by adding hydrogen peroxide (H2O2) to acetic acid.
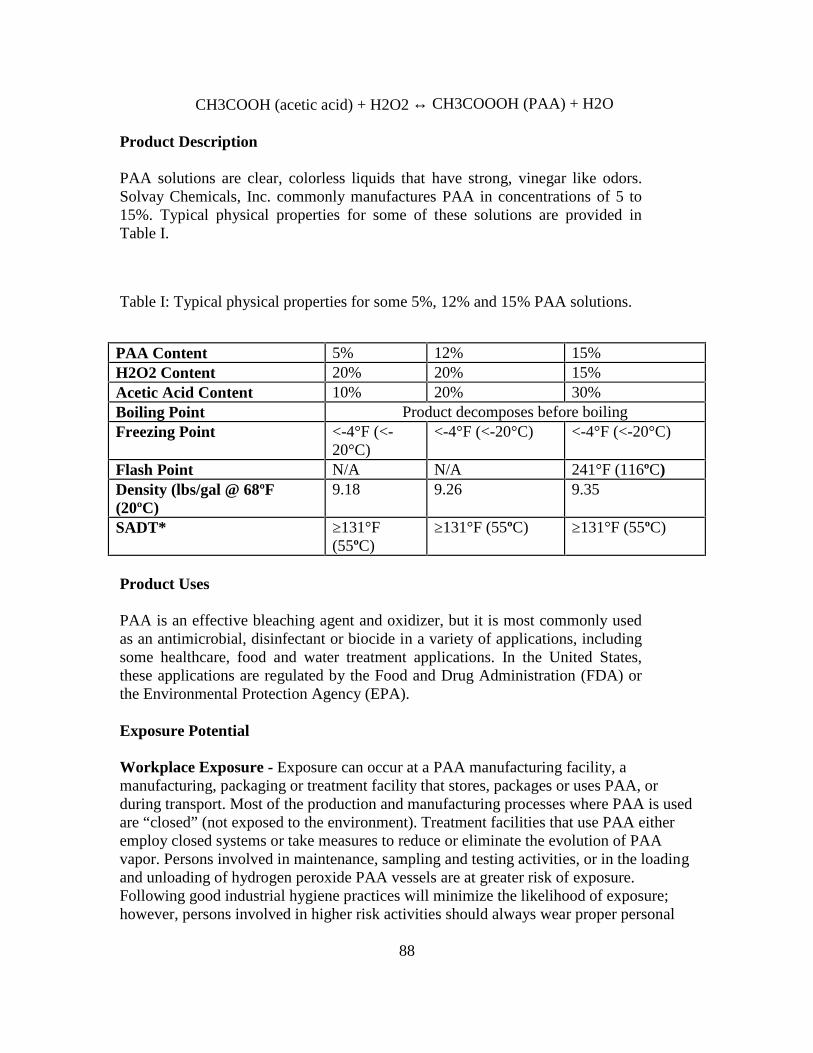
88
CH3COOH (acetic acid) + H2O2 ↔ CH3COOOH (PAA) + H2O
Product Description
PAA solutions are clear, colorless liquids that have strong, vinegar like odors.Solvay Chemicals, Inc. commonly manufactures PAA in concentrations of 5 to15%. Typical physical properties for some of these solutions are provided inTable I.
Table I: Typical physical properties for some 5%, 12% and 15% PAA solutions.
PAA Content 5% 12% 15%H2O2 Content 20% 20% 15%Acetic Acid Content 10% 20% 30%Boiling Point Product decomposes before boilingFreezing Point <-4°F (<-
20°C)<-4°F (<-20°C) <-4°F (<-20°C)
Flash Point N/A N/A 241°F (116ºC)Density (lbs/gal @ 68ºF(20ºC)
9.18 9.26 9.35
SADT* ≥131°F(55ºC)
≥131°F (55ºC) ≥131°F (55ºC)
Product Uses
PAA is an effective bleaching agent and oxidizer, but it is most commonly usedas an antimicrobial, disinfectant or biocide in a variety of applications, includingsome healthcare, food and water treatment applications. In the United States,these applications are regulated by the Food and Drug Administration (FDA) orthe Environmental Protection Agency (EPA).
Exposure Potential
Workplace Exposure - Exposure can occur at a PAA manufacturing facility, amanufacturing, packaging or treatment facility that stores, packages or uses PAA, orduring transport. Most of the production and manufacturing processes where PAA is usedare “closed” (not exposed to the environment). Treatment facilities that use PAA eitheremploy closed systems or take measures to reduce or eliminate the evolution of PAAvapor. Persons involved in maintenance, sampling and testing activities, or in the loadingand unloading of hydrogen peroxide PAA vessels are at greater risk of exposure.Following good industrial hygiene practices will minimize the likelihood of exposure;however, persons involved in higher risk activities should always wear proper personal

89
protective equipment such as rubber gloves and boots, an acid or slicker suit, goggles anda hard hat. In instances where the potential for splashes is high, a face shield should alsobe worn.
Consumer Exposure to Products Containing PAA - Solvay Chemicals, Inc. does notsell PAA directly to consumers. PAA is used as a sterilant, disinfectant or biocide insome food and drinking water applications; however, residual PAA usually decomposesto acetic acid, oxygen and water. Consequently, the probability of consumer exposures toPAA is low.
Environmental Releases - Spills of PAA should be contained and isolated fromwaterways, sewer drains and any flammable or combustible materials. Small spills shouldbe diluted with large amounts of water and disposed of in accordance with applicablelocal, state or federal regulations. Do not use absorbents or adsorbents to soak up PAAspills. Absorbents and adsorbents may contain organics that can react with the residualPAA and hydrogen peroxide in PAA solutions. Rinse PAA contaminated cloth or papertowels with water until they are free of any residuals. Failure to do so may result in a fireonce they dry. Persons attempting to clean up PAA spills should wear proper personalprotective equipment, including respiratory protection (see guidelines in WorkplaceExposure section of this document or Safety Data Sheet).
Large Spills - Large spills of PAA should be contained and isolated from waterways,sewer drains and any flammable or combustible materials by constructing dikes of earth,sand or some other inert material. Diluting large spills with water will reduce theevolution of steam, oxygen, acetic acid, PAA and/or hydrogen peroxide vapors.Emergency responders should wear proper personal protective equipment, includingrespiratory protection, and should only approach spills from up wind. Once the spill iscontained, the PAA and hydrogen peroxide should be allowed to decompose before beingcollected and disposed of in accordance with applicable local, state and federalregulations. If required, report spills to the appropriate state or federal authorities.
Fires - Fires involving PAA should be extinguished with water. Containers of PAAinvolved in a fire should be cooled with water sprays. If the container begins to discoloror vent violently, emergency responders should evacuate the area. If heated ordecomposed, higher concentration PAA solutions may give off toxic and/or flammablevapor.
For additional information concerning PAA emergency response procedures,please consult the Safety Data Sheet.
Health InformationExposures to PAA can produce the following adverse health affects:
Contact - Skin exposures can cause symptoms ranging from minor skin irritation topainful redness and swelling. Eye exposure to PAA solutions may result in severe eyeirritation, burns, irreversible eye damage or even blindness.

90
Inhalation - The inhalation of PAA can irritate mucous membranes of the nose andthroat causing symptoms ranging from nose and throat irritation to coughing anddifficulty breathing. Repeated or prolonged exposures may cause sore throat, nosebleeds,chronic bronchitis, chemical pneumonitis (inflammation of the lungs) and edema (fluid inthe lungs).
Ingestion - Ingestion of PAA may cause bloating, belching, irritation of the upperdigestive and respiratory tracts, nausea, vomiting, difficulty breathing, excessive fluid inthe mouth and nose, and risk of suffocation. Ingestion may also cause severe burns to themouth and throat, perforations to the esophagus and stomach, chemical pneumonitis andedema. The ingestion of concentrated solutions of PAA can be fatal.Other Effects - Animal testing with PAA has shown no evidence that it is a carcinogen.Some testing has indicated that PAA may have mutagenic effects.
For more information on health effects and routes of exposure, or for informationconcerning proper first aid measures, please consult the Safety Data Sheet.
Environmental Information
Small amounts of PAA may be released to the aquatic environment from sitesthat manufacture it or use it. PAA may also be released to the environmentthrough spills and other unintentional releases. PAA can be toxic to fish andmicroorganisms, but it is not known to bioaccumulate or persist in theenvironment. PAA degrades into oxygen, water and acetic acid, which isrelatively non-toxic at low concentrations. For more ecological andenvironmental information concerning this product, please consult the SafetyData Sheet.
Physical Hazard Information
PAA is an oxidizer and will support combustion. PAA solutions can cause fireswhen left in contact with combustible materials such as paper, wood or cloth.Mixing PAA solutions with certain organics should be done with care, as theymay form explosive mixtures. Oxygen enrichment from the decomposition ofPAA solutions in vessels containing certain volatile organics can also formexplosive mixtures in the headspace of the vessel. If heated or decomposed,higher concentration PAA solutions may give off toxic and/or flammable vapor.
Exposure of PAA solutions to impurities such as strong acids, bases andtransition metals (copper, manganese, chrome, etc.) can cause decomposition.PAA decomposition will result in the liberation of heat and gases which canresult in a rapid pressure buildup. Systems used to store or transport PAAsolutions must be properly vented and must have enough emergency venting

91
capacity to allow the contents of the system to withstand a catastrophicdecomposition event.
For more information concerning the physical hazards of this product, pleaseconsult the Safety Data Sheet. For information concerning the proper design ofhydrogen peroxide and PAA systems, please contact Solvay Chemicals, Inc.Regulatory Information
Regulations may exist that govern the manufacture, sale, transportation, use and/ordisposal of this chemical. These regulations can vary by city, state, country or geographicregion. Information may be found by consulting the relevant Safety Data Sheet specific toyour country or region.
Additional Information
Solvay America, Inc. www.solvaynorthamerica.com Solvay Chemicals, Inc. www.solvaychemicals.us Solvay Chemicals Inc. Safety Data Sheets
www.solvaychemicals.us/EN/Literature/LiteratureDocuments.aspx Contact Solvay Chemicals, Inc. [email protected] NJ Department of Health & Senior Services Hazardous Substance Fact Sheets
http://web.doh.state.nj.us/rtkhsfs/factsheets.aspx
This summary was prepared in January, 2012
This summary was revised in September, 2013
NOTICETo our actual knowledge, the information contained herein is accurate as of the date ofthis document. However, neither Solvay America, Inc. nor any of its affiliates makes anywarranty, express or implied, or accepts any liability in connection with this informationor its use. This information is for use by persons at their own discretion and risk and doesnot relate to use of this product in combination with any other substance or any otherprocess. This is not a license under any patent or other proprietary right. The user alonemust finally determine suitability of any information or material for any contemplated usein compliance with applicable law, the manner of use and whether any patents areinfringed. This information gives typical properties only and is not to be used forspecification purposes. Solvay America, Inc. reserves the right to make additions,deletions or modifications to the information at any time without prior notification.Trademarks and/or other products of the company referenced herein are either trademarksor registered trademarks of the company mentioned or its affiliates, unless otherwiseindicated.

92
APPENDIX B
CALCULATIONS OF FEED RATE AND DILUTION FOR INTENDED PAA DOSES

93
0.25 mg/L:

94

95

96
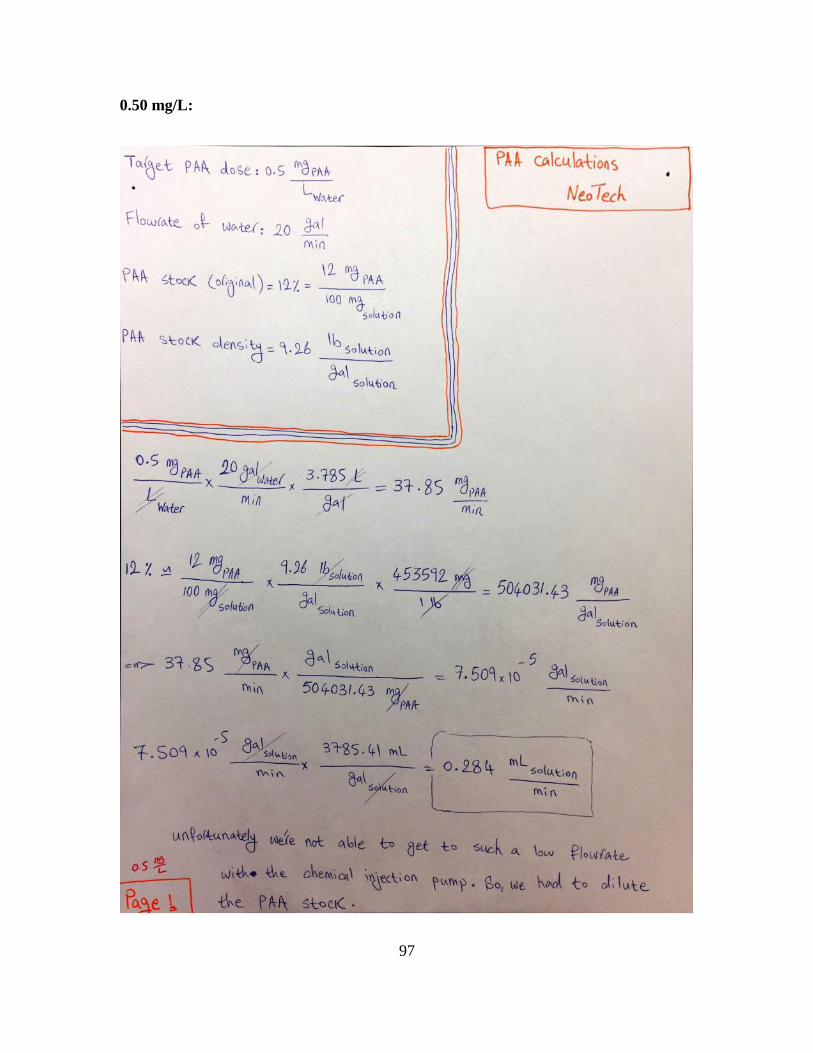
97
0.50 mg/L:

98

99

100

101
APPENDIX C
HACH TEST PROCEDURE TO MEASURE PERACETIC ACID (PAA)

102
Determination of Peracetic Acid (PAA) in Water
Concentration Range of 0.1 to 10 mg/L
Equipment and Reagents:
MR and HR Chlorine Pocket Colorimeter (PCII) – Hach PN 5870062 (Use HR program)
DR800 (Program 12)
DR900, DR1900, DR2800, DR3800, DR3900, DR5000, DR6000 (Program 88)
10-mL/1-cm Sample Cell – Hach PN 4864302
DPD Total Chlorine Reagent Powder Pillow, 25-mL, 100/pkg – Hach PN 1406499; DoNot use Free DPD Reagents
Test Procedure for PAA:
When using the PCII, make sure that the program is in the HR mode, use program 12 forthe DR800 series colorimeters,and for all other Hach colorimeters andspectrophotometers use program 88 for HR Total Chlorine, Hach Method 10070.
(1) Fill both 10 mL sample cells with the water sample. One of these cells will be theblank and the other will be the prepared sample.
(2) Place the blank into the instrument and press the ‘zero’ key.
(3) Add the contents of one DPD TOTAL 25-mL Chlorine powder pillow to the preparedsample cell.
(4) Cap the prepared sample cell and shake gently to mix the DPD powder. A pink colorwill develop indicating the presence of PAA.
(5) After 15 to 20 seconds after adding the DPD powder to the prepared sample cell,ensure that the DPD powder has dissolved and there are no air bubbles present (invertlightly to dislodge the air bubbles), use a lab wipe to clean off the 10-mL/1-cm cell.Between 45 and 60 seconds of reaction time, place the sample cell into the cellcompartment and then press ‘read’. Do not wait more than 60 seconds to read the sample.
(6) The results are in mg/L as total Cl2. Convert the mg/L Cl2 value to mg/L of PAA bymultiplying the value by 1.07. If you instrument has the built in dilution factor function,you can input the 1.07 with this option. mg/L PAA = 1.07 x mg/L Total Cl2 PAA.

103
BIOGRAPHICAL SKETCH
Samantha Cooper attended Arizona State University for her undergraduate career andreceived her Bachelor of Science in Engineering (B.S.E) in May 2015. She decided tocontinue her education because she was interested in gaining a better understanding ofwater treatment processes to apply this knowledge to her professional life. In addition toher work as a student, she has also been employed at an environmental engineeringconsulting firm, Valentine Environmental Engineers, for over three years. Projectsthrough her firm have included the pilot study for the PAA/ UV technology discussed inthis thesis, though on a larger scale for a water reclamation plant in Maricopa, Arizona(July-September 2015). This pilot study inspired the Master’s research idea. AfterSamantha graduates with a M.S Degree, she plans to continue to conduct studies, in theform of pilot studies, to further understand the PAA/UV emerging technology.