implementation of individual transferable quotas in ... · implementation of individual...
TRANSCRIPT

PO Box 1390, Skulagata 4120 Reykjavik, Iceland
Implementation of Individual Transferable Quota system inFisheries Management: The case of the Icelandic Fisheries
Liu XinshanDalian Fisheries University
China
Supervisor: Dr. Eyjolfur Gudmundsson, University of Akureyri
ABSTRACT
Since 1950s, the world marine fish resources have suffered the serious over-fishing.The marine resources subsequently have been in great danger. Quite diversemanagement regimes are used to regulate the fisheries globally. Among them, theindividual transferable quota (ITQ) system is claimed to achieve the sustainablefisheries. The report is to explore the Icelandic ITQ system carefully.
This paper first compares the various management measures and reviews the ITQtheory. Then the growth and implementation of the Icelandic ITQ regime areexamined carefully. And its performance and various controversies over the ITQsystem are analysed on the fisheries and social-economic data. It is demonstrated thatthe effect of Icelandic ITQ is quite positive. A well-defined and enforced ITQ systemcan meet the biological and economic goals of fisheries management. Under the ITQregime, the state of marine resources has been recovering and the economic efficiencyhas been improved largely. However, the current Icelandic ITQ system does notcreate a private property right over the fish stock. The ITQ system has not causeserious unemployment and destroyed the community economy in Iceland. The ITQsystem is very promising, although there are some flaws in the current Icelandic ITQregime. Finally, possible remedies of the flaws are discussed.
Keywords: ITQ, fisheries management, fisheries resources, fisheries economics,Iceland
Final Project 2000

Liu
2
TABLE OF CONTENTS
1. INTRODUCTION......................................................................................................32. What is an Individual Transferable Quota?................................................................3
2.1 Problem of over-fishing and choice faced by fishermen....................................42.2 Common fisheries management regimes ...........................................................4
2.2.1 Direct command-control fisheries management ........................................52.2.2 Indirect biological-economic fisheries management..................................5
2.3 The ITQ system..................................................................................................73. How the ITQ system works in Iceland? .....................................................................9
3.1 The role of fisheries in Icelandic economy ........................................................93.2 The evolution of the fisheries management system ...........................................9
3.2.1 Establishment of EEZ.................................................................................93.2.2 Growth of the ITQ regime........................................................................10
3.3 Icelandic ITQ system---its five pillars .............................................................113.3.1 Recognition of EEZ international ............................................................113.3.2 Setting of TAC .........................................................................................123.3.3 Surveillance of landings ...........................................................................123.3.4 A perfect market of quota transferability .................................................133.3.5 Biological support measures of an ITQ system .......................................13
4. Discussion and conclusion .......................................................................................144.1 The performance of the Icelandic ITQ system.................................................144.2 The controversies over the ITQ system............................................................17
4.2.1 The issue of initial permanent share allocation........................................174.2.2 Prediction of TAC ....................................................................................184.2.3 ITQ and private property right .................................................................194.2.4 Concentration of fishing concession, unemployment and communitystability .................................................................................................................204.2.5 Enforcement and administration cost .......................................................234.2.6 ITQ and high grading/discarding .............................................................25
5. Discussion and Conclusion ......................................................................................25ACKNOWLEDGEMENTS .........................................................................................27REFERENCES.............................................................................................................28

Liu
3
1. INTRODUCTION
This chapter is a brief introduction to the world fisheries, including the trend of worldlandings, the state of world fishery resource, and an urgent need of an efficientfisheries management regime.
Being one of the oldest economic activities, marine fisheries provide human beingswith a source of high quality protein and meet the cultural and life needs. Accordingto FAO, 1998 witnessed 86.3 million metric tons of fish, crustaceans, molluscs, etc.extracted from the broad sea and ocean. However, research work of biologist andofficial statistics have shown us the marine fish resources are suffering from seriousdepletion. As Figure 1 indicates, the world marine catches will likely reduce ratherthan increase in the future.
70
72
74
76
78
80
82
84
86
88
1985 1986 1987 1988 1989 1990 1991 1992 1993 1994 1995 1996 1997 1998
Mill
ion
tonn
es
Figure 1: World total nominal catches in marine fishing areas 1985-1998 (FAO 2000).
The world ocean productivity is close to its limit. Also, two bitter facts are concealedthat the low-valued fish is to take over the first position in species composition - in1992 the miscellaneous category ranked third - and that human being have beensuffering economic waste from fishing activities - very roughly estimated, $60 billionare wasted globally each year (Christy 1997). Low profitability and business failureshave been occurring in the world fishing industry. It is partly the force of varioussubsidies that help the fishing company to operate profitably (Porter 1997).
The problem of over-fishing has clearly general and now concerns all regions of theworld. It is indicated that 70% of the fish resources are overexploited, depleted, orrecovering from depletion (Garcia and Newton 1997).
2. WHAT IS AN INDIVIDUAL TRANSFERABLE QUOTA?
Since 1970s, the acronym ITQ has become more and more well known in the world.This chapter carefully examines the root of over-fishing and diverse fisheriesmanagement regimes used in the world, especially the ITQ system and its maincharacteristics.

Liu
4
2.1 Problem of over-fishing and choice faced by fishermen
Fish, as a source of food supply, is undoubtedly in great danger. Following theSecond World War, the call for the conservation of fish stocks has grown louder.Concerns for marine life has caused some bitter conflicts between countries and evenamong fishermen of the same country (Hart 1976). Many biologists and economistshave explored the reasons for these sufferings. The major root is attributed to thecommon property nature of fish swimming in the ocean (Warming 1911, Gordon1954, Scott 1955, Hardin 1968, Hannesson 1993). Figure 2 gives a clear picture ofeconomic incentives in fishing activity.
F is h in g r e v e n u e s
F is h in g e f fo r tO
C 0
A : O p t im a l e q u i l ib r iu m p o in tB : C o m p e t i t iv e e q u i l ib r iu m p o in tC 0 :N e c e s s a r y c o s ts b e fo r e f is h in g
A
B
F is h in g c o s ts
E CE O E M S Y
R e v e n u e /c o s t ($ )
F ig . 2 F is h e r y b io -e c o n o m ic s m o d e l
Under common property, competitive fishery will reach an equilibrium only when theexpansion in fishing effort has brought the stock size down to the point wheremarginal product is zero.
It is evident that common property has always driven fishermen into a dilemma. In theshort term, a fisherman catching fish from a common bank reduces the availability offish to other fishermen. It is obviously rational for a fisherman to expand his fishingeffort to catch more fish. A fisherman, who always prefers prudent fishing, will run aquite high risk of suffering great loss.
Therefore, the problem of over-fishing is a tragedy of the common, the tragedy of theexisting ocean order. It is not caused by ignorance of fishermen at all. All a fishermanthinks about is the fact that other fishermen's harvest would definitely reduce hisharvest if he had not expanded his fishing effort. Under common property of fish, it isnot reasonable to expect that a fisherman always take into account how his expansionof fishing effort affects fish growth and fish reproduction.
2.2 Common fisheries management regimes
In the half past century great effort and even fierce fighting to remove the commonproperty of ocean led to three global conferences on the laws of the sea. A modernconvention on the law of sea was generally accepted in 1982. Under this SeaConstitution, EEZ (exclusive economic zone) was established as a rule of
Liu
5
international law. This implies that more than 90% of marine fisheries resources canby controlled by individual coastal states (Laursen 1993).
Governments have been responding to the decline in fish stock. Quite diversemeasures are employed in the world. Basically, these measures can be divided intotwo groups: direct command-control measures and indirect biological-economicmeasures. This also reveals two main objectives of fisheries management:sustainability of fish supply and high fishery economic efficiency.
2.2.1 Direct command-control fisheries management
Direct command-control measures mainly contains fishing gear and methodsrestriction (e.g. minimum mesh-size restrictions, small fish-release devices, sortinggrid devices, etc.), fishing period closure (e.g. spawning season), fishing area closure(e.g. spawning area, nursery area, area quite close to shore, etc), and fish minimumsize limits, etc. It is generally acknowledged that biological regulations can lessen theexploitation of fish stock, provided that the various limits are correctly set andefficiently enforced. However, they do not necessarily alleviate fishermen's eagernessto increase their fishing effort because they do not undermine the root of over-fishingi.e. the common property of fish stocks. Finally, intense competition among fishermeninevitably erodes the accomplishments of biological regulations to achieveconversation objectives.
2.2.2 Indirect biological-economic fisheries management
Economically oriented measures generally cover fishing licence/permit, resources taxor charge/royalties/fee, TURF (territorial use right in fisheries), IQ (individual quota),ITQ, etc.
Fishing licence may be the most common tool of fisheries regulation in the world.Under the fishing licence, a fisherman/fishing firm (In practice a fishing licence isalways attached to a specified fishing vessel) must hold a certificate issued byfisheries administrative authority when fish is caught.
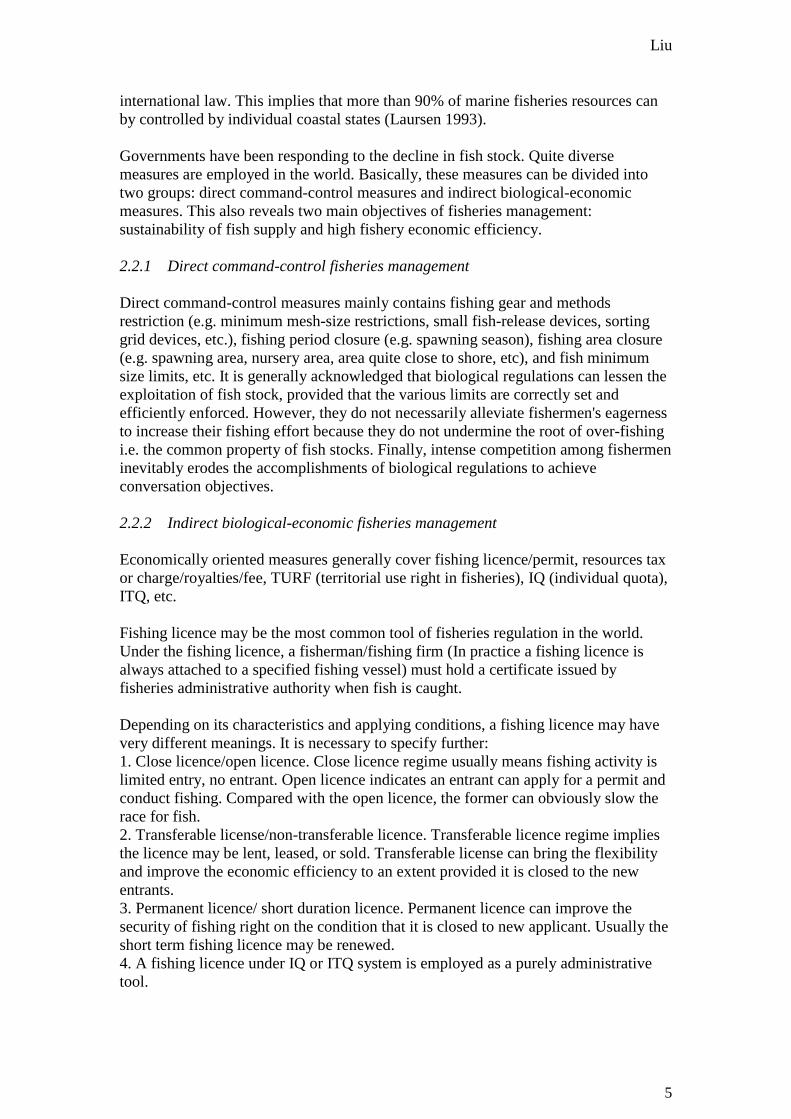
Depending on its characteristics and applying conditions, a fishing licence may havevery different meanings. It is necessary to specify further:1. Close licence/open licence. Close licence regime usually means fishing activity islimited entry, no entrant. Open licence indicates an entrant can apply for a permit andconduct fishing. Compared with the open licence, the former can obviously slow therace for fish.2. Transferable license/non-transferable licence. Transferable licence regime impliesthe licence may be lent, leased, or sold. Transferable license can bring the flexibilityand improve the economic efficiency to an extent provided it is closed to the newentrants.3. Permanent licence/ short duration licence. Permanent licence can improve thesecurity of fishing right on the condition that it is closed to new applicant. Usually theshort term fishing licence may be renewed.4. A fishing licence under IQ or ITQ system is employed as a purely administrativetool.

Liu
6
5. Measurable fishing licence / non-measurable fishing licence. In general, a licence isattached to a specified vessel when issued; it should match to the size of fishingvessel, e.g. horsepower or gross tonnage, etc.
A fishing licence was first introduced as a means of administrative management, likea driving licence. As such, it provided data and helped enforcement. It was usuallyseen as a certificate of fishing privilege by fisheries authority. It was what a fishermanneeded to act legally on a wild fish stock. Depending on the diverse characteristics,evaluation of the fishing licence is mixed. Generally speaking, it is very reluctant tosay that a fishing licence is an excellent regime alone because it does not restrict thetotal landings, unless it is completely closed to any new applicants and works togetherwith TAC (total allowable catch) regime.
Under TURF, a fishing area is allocated to a fishing entity, which has exclusive rightto the fish stock living in this fishing area. TURF is always regarded as the bestmethod in which property right to fish stock could be implemented. Main objectivesof fisheries management can be achieved completely. Unfortunately, it is only suitableto sedentary species such as oyster, mussels, scallop, and so on. Fish migration limitsits wide application.
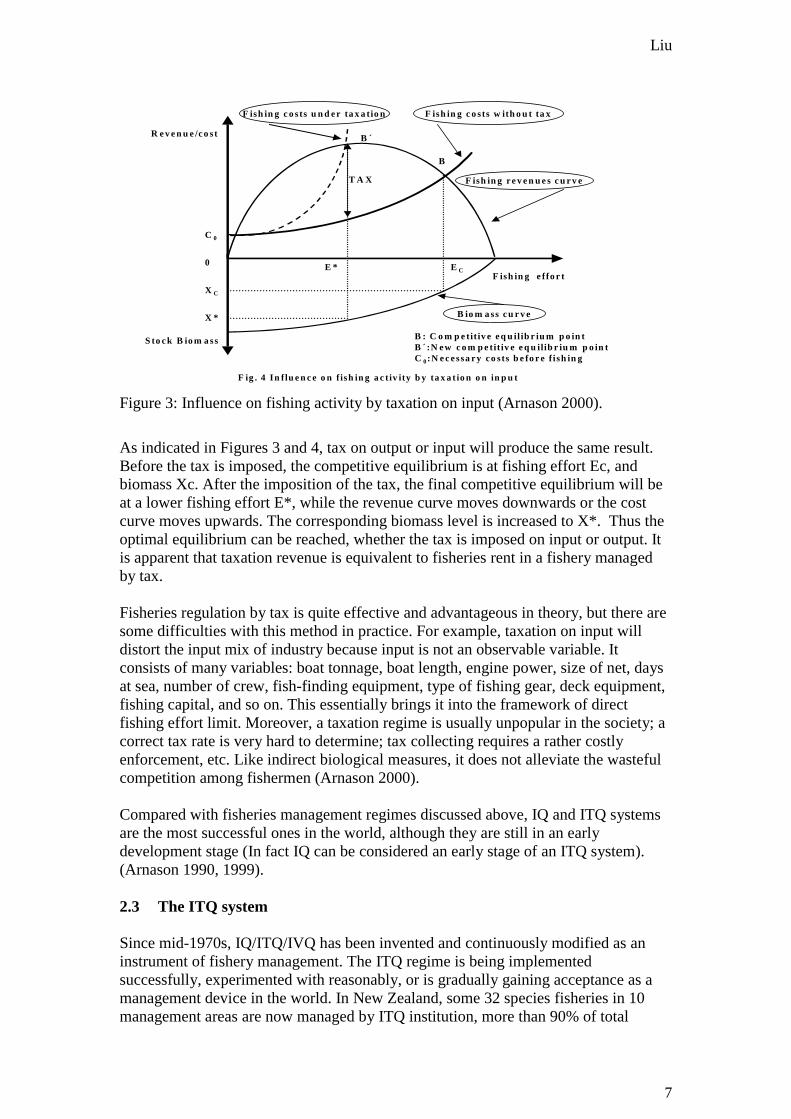
Fisheries regulation on the basis of taxation (or charge, royalties, fee) is quiteattractive. The self-defeating competition among fishermen stems fundamentally fromthe fact that fishing appears more profitable to individual fisherman than it is for thefishing industry as a whole. By imposing tax on the fishing, fisheries authority canefficiently remedy each fisherman's fishing behaviour to protect fish resource. Theinfluence on fishing activity by taxation is clearly revealed by Figure 3 and Figure 4(Arnason 2000).
B : C o m p e titive eq u ilib r iu m p o in tB ´:N ew c o m p e titiv e e q u il ib r iu m p o in tC 0:N e c e ssar y co sts b e fo r e fish in g
F ish in g r e ve n u e s w ith ou t ta xe d
F ish in g e ffo r t0
C 0
B
F ish in g co sts
E C
F ig . 3 In flu e n ce o n fish in g a ct iv ity b y ta x a tio n o n lan d in g -v a lu e
F ish in g re v e n u es ta x ed
B ´
E *
X C
X *
S toc k B iom a ss
R e v e n u e/co st
B io m ass c u rv e
T ax
Figure 2: Influence on fishing activity by taxation on landing-value (Arnason 2000).
Liu
7
F ig . 4 In flu e n c e o n f ish in g a c t iv ity b y ta x a t io n o n in p u t
B : C o m p e tit iv e e q u il ib r iu m p o in tB ´ :N e w c o m p e tit iv e e q u ilib r iu m p o in tC 0:N e c e ssa r y c o s ts b e fo r e f ish in g
S to c k B io m a ss
F ish in g e ffo r t0
C 0
B
F ish in g c o sts u n d e r ta x a tio n
E C
F ish in g r e v e n u e s c u r v e
B ´
E *
X C
X *
R e v e n u e /c o st
B io m a ss c u r v e
F ish in g c o s ts w ith o u t ta x
T A X
Figure 3: Influence on fishing activity by taxation on input (Arnason 2000).
As indicated in Figures 3 and 4, tax on output or input will produce the same result.Before the tax is imposed, the competitive equilibrium is at fishing effort Ec, andbiomass Xc. After the imposition of the tax, the final competitive equilibrium will beat a lower fishing effort E*, while the revenue curve moves downwards or the costcurve moves upwards. The corresponding biomass level is increased to X*. Thus theoptimal equilibrium can be reached, whether the tax is imposed on input or output. Itis apparent that taxation revenue is equivalent to fisheries rent in a fishery managedby tax.
Fisheries regulation by tax is quite effective and advantageous in theory, but there aresome difficulties with this method in practice. For example, taxation on input willdistort the input mix of industry because input is not an observable variable. Itconsists of many variables: boat tonnage, boat length, engine power, size of net, daysat sea, number of crew, fish-finding equipment, type of fishing gear, deck equipment,fishing capital, and so on. This essentially brings it into the framework of directfishing effort limit. Moreover, a taxation regime is usually unpopular in the society; acorrect tax rate is very hard to determine; tax collecting requires a rather costlyenforcement, etc. Like indirect biological measures, it does not alleviate the wastefulcompetition among fishermen (Arnason 2000).
Compared with fisheries management regimes discussed above, IQ and ITQ systemsare the most successful ones in the world, although they are still in an earlydevelopment stage (In fact IQ can be considered an early stage of an ITQ system).(Arnason 1990, 1999).
2.3 The ITQ system
Since mid-1970s, IQ/ITQ/IVQ has been invented and continuously modified as aninstrument of fishery management. The ITQ regime is being implementedsuccessfully, experimented with reasonably, or is gradually gaining acceptance as amanagement device in the world. In New Zealand, some 32 species fisheries in 10management areas are now managed by ITQ institution, more than 90% of total
Liu
8
landings in terms of value. In USA, the ITQ system was first instituted for the Atlanticsurf clam and ocean quahog fisheries in the waters of the mid-Atlantic states and NewEngland waters in 1990, in the wreckfish fishery on the southern East Coast in 1992,and in March 1995, for halibut and sablefish (blackcod) fishing off Alaska. Italy has aclam ITQ programme. Australia has an ITQ programme regulating more than 15species fisheries. South Africa manages its abalone fishery by the ITQ system.Canada has several fisheries that are managed by ITQ along both Atlantic and Pacificcoasts and in the Great Lakes. ITQs also are used to manage the Netherlands’ sole andplaice fishery. Although this is not a comprehensive list of all country fisheries underITQ system, it indicates that the ITQ regime is widely used internationally (Wesney1989, Pascoe 1993, Davides 1997, Arnason 1997, Major 1999).
Constructing an ITQ system basically has to contain the following four steps,although a uniform, unequivocal definition is not available.
1) Following the recommendations by fish biologists, fisheries authority annuallydetermines and declares a TAC for each commercial species fishery;
2) Mainly depending on historical landings and size of boat, eachfisherman/fishing firm is initially allocated a percentage of TAC for eachspecies (Individual percentage share quota, TAC-share or quota share), wherean ITQ is usually attached to a specified fishing vessel (also called IVQ).Allocation of TAC-share is conducted only once when ITQ is introduced. Anewcomer must through quota market to obtain his quota. A fisherman/fishingfirm can keep his TAC-share forever unless he actively transfers it to others.
3) The legal annual landing (LAL) from an individual fishing vessel is equal tothe product of its permanent TAC-share times the annual national TAC.(Individual tonnage catches quotas, annual catch entitlements, ACE).
4) Individual Permanent TAC-share and individual annual catch quotas areunlimitedly divisible in theory and may be freely transferred on the quotamarket.
Under an ITQ system, the total annual landings are limited by limiting eachfisherman’s annual catch to his legal annual landings (LALs). Depending on theactual state of the fish stock, a TAC is biologically determined annually. Thus, thebiological objective of the fishery regulation is achieved.How does an ITQ system look from an economic point of view? Because afisherman's catch is limited, competition among the fishermen will move from theamount of catch to fuel-saving, use of efficient fishing technology, quality of fishproduct, marketing system, price of product, etc. in order to increase their profits. Thiscompetition may be more intense than before, but it is beneficial to the whole fishingindustry. The economic efficiency of the fishing industry will be improved as theresult of this competition. Because the individual TAC-share is permanent andsubsequently a fisherman has an interest in the future state of the fish stock, hisenthusiasm to protect fish resources is increased. Because the ITQ system may bedivisible and tradable and a new entrant has to obtain fishing rights through a quotamarket, fish will always be extracted by the most effective fishermen. Furthermore, afisherman withdrawing from fishing industry can also sell his permanent share quotaand get financial rewards from the quota market.Therefore, it can be concluded that the ITQ system increases fishery economicefficiency to a large degree. The second objective of fishery management, the

Liu
9
sustainability of the resource, is also achieved. The reason for this is an ITQ systemcan successfully mitigate the common property nature of fish resource. An ITQsystem gives fishermen incentives to make efficient use of the fish stock. Thus, theITQ system is a quite powerful tool to achieve the objectives of fisheriesmanagement.In summary, an ITQ system is a fishery management institution, under which afisherman or fishing firm legally holds a defensible right to catch, land a certainquantity of fish, and this right is freely tradable in an asset market. The result is thatfishermen try to generate the biggest possible return from their share of the catch, byincreasing the value of landings, and reducing costs, and preferably co-operating withothers to increase the future profitability. Because of its perpetuity, the security ofaccess to fish stock of quota holders is guaranteed. Because of the limitation of thecatch landed by individual fishing vessel, protection of a fish resource can beaccomplished. Because of its divisibility and transferability, a market mechanism canwork well and subsequently the optimal economic outcomes to the fishing industry isachieved.
3. HOW THE ITQ SYSTEM WORKS IN ICELAND?
The theory behind an ITQ system is one thing, how it works in practice is another.This chapter will explore how an ITQ regime has developed and functioned inIcelandic fisheries.
3.1 The role of fisheries in Icelandic economy
It is often stated by Icelandic economists that the Icelandic economy is heavilydependent on fisheries; fisheries form the backbone of the national economy;economic performance in Iceland is largely based on the performance of the fishingindustry, its exports volume, and foreign market prices, etc. (Bjarnason 1996,Danielsson 1997). These assertions have been supported soundly by some economicstatistics. In 1993, fishing and fish processing contributed 15.4% of the GDP andemployed 11.3% of the working population; marine fish and fish products accountedfor 79% of the commodities exported and 55% of foreign earnings. According toArnason (1995), a 1% increase in the output value of the fishing industry willeventually lead to 0.45% increase in GDP. The significance of fisheries in theIcelandic economy also can be seen from its dominance in the nationalmacroeconomic system, its influence on the growth of wages and exchange rates. Fishconsumption per Icelander is over 90 kg annually (OECD 1997).The importance of fisheries in the Icelandic economy means that any changes offisheries policy and management regime have far-reaching effects on the Icelandicsociety.
3.2 The evolution of the fisheries management system
3.2.1 Establishment of EEZ
The history of Icelandic fisheries management may be a textbook example to mirrorthe development of the new world order of the sea in the late 20th century. It can bedivided into three distinct phases. Fisheries in Icelandic waters were completely

Liu
10
international fisheries before 1948. The years between 1948 and 1976 saw anunyielding campaign for Icelanders to gain the jurisdiction over fish stock (Table 1).From 1976 to present is characterised by the growth of the ITQ system.
Table 1: Extension of Icelandic Jurisdiction over fisheries around Iceland (Jonsson1982).
! 1948 Scientific Protection of the Fish Stocks on the Continental Shelf
! 1950, 1952 Extension to 4 miles, fishing area 43000 km2
! 1958,1961 Extension to 12 miles, fishing area 75000 km2
! July, 1972 Extension to 50 miles, fishing area 216000 km2
! July, 1975 Extension to 200 miles, fishing area 758000 km2
! 1982 UN Convention on the Law of the Sea was signed
! 1985 Iceland ratifies the UN Convention on the Law of the Sea, being the first state to do so
! 1994 UN Convention on the Law of the Sea entered into force
Having gained the complete jurisdiction over her fish stocks, Icelanders achieved thelegal prerequisite to the establishment of an ITQ system in Icelandic waters.
3.2.2 Growth of the ITQ regime
The growth of Icelandic ITQ system is very much a slow and painful learning process.It came being by trial and errors rather than by academic design in the office. Table 2exhibits its nearly 25-year development history.
Table 2: The chronology of the development of ITQ regime
" 1965 Inshore shrimp and scallop fisheries subjected to licences, effort restrictions and catchquotas.
" 1969 A TAC imposed on the summer-spawning herring fishery." 1972-1974 Herring fishery closure." 1973 A TAC in lobster was first set and vessel catch quotas issued." 1975 Legislation on processing and fishing of inshore shrimp and scallop passed. Seven
inshore shrimp areas established. The TAC for summer-spawning herring divided intoindividual vessel quotas (IVQs), although not permanent.
" 1976 A special Fisheries Act passed, giving the Minister powers to restrict access to thefishing grounds. TAC for the major demersal fisheries.
" 1977 Individual effort restrictions on fishing days introduced in demersal fisheries, but newentry was possible.
" 1979 IVQs for herring fishery made transferable." 1980 IVQs introduced in the capelin fishery, limited entry into capelin fishery." 1984 Licensing and IVQ in lobster fishery. A comprehensive system of ITQs was introduced
to the demersal fisheries. All vessels over 10 GRT were allotted a quota share based on theiraverage catch Nov. 1981-Oct. 1983. The annual tonnage quotas were transferable, but thepercentage share quotas were not transferable, except between the vessels owned by the sameowner. The larger vessels closed to demersal fisheries unless as a replacement for withdrawingcomparable vessels.
" 1985-1990 Effort restrictions in demersal fisheries. Vessels under effort restrictions may re-enter quota system based on the new track record. Vessels under 10 GRT open access until1988 and boats between 10-6 GRT until 1990.

Liu
11
Table 2 (cont.)
" 1986 IVQs for capelin were made transferable." 1988 Deep-sea shrimp fishery was subjected to ITQ. More than 90% of landings by value was
under ITQ." 1990 Fisheries Management Act passed. All vessels above 6 GRT and the important species
covered by a uniform ITQ system. Effort quota option was eliminated. Both permanent TAC-share and ACE may be divisible and transferable. Boats under 6 GRT operating with long-lines and hand-lines were allowed a period of adjustment before being incorporated within thesystem. The permanent percentage share quota between vessels owned by different ownerswas allowed. Fees to cover enforcement cost collected by Authority.
" 1993 Supreme Court decided the transfer of TAC-share should be taxed as transfer ofproperty, the transfer of ACE taxed as income for the seller and cost for buyer.
" 1995 Catch rule was made. Annual TAC for cod was set at 25% of the fishable biomass." 1998 only up to 50% of annual catch quota is freely transferable between different ownership.
If a vessel catches less than 50% of its quotas (measured in cod equivalents) in two subsequentyears, its quota is forfeited. A single firm is not allowed to hold more than 10% quota share ofcod and haddock, 20% of saithe, redfish, Greenland halibut, herring, offshore shrimp, andcapelin.
" 1998 ITQs were issued for the Atlanto-Scandian herring fishery." Sep. 1998 Quota Exchange established. All quota transfers must take place through the Quota
Exchange except between vessels owned by the same firm." Dec. 1998 Supreme Court ruled that Art.5, Act 38/1990, which privileges those who derive
their fishing rights from ownership of vessels during a specific period, is unconstitutional." Jan. 1999 Unconstitutional clause was revised. Any vessel can get a fishing permit as long as
it satisfies standard conditions about seaworthiness and registration." June 2000 The TAC for cod should not vary by more than 30000 MT between 2 continuous
fishing years." 2000 Supreme Court ruled that fishing without quota was illegal. The verdict strengthens the
legal basis of the ITQ system.
As indicated in table 2, the evolution of ITQ regime showed several markedlycharacteristics. (1) It was first introduced in herring fishery in response to thecollapse of stock and then extended to other dangerous fisheries. (2) It was extendedfrom the slow-valued fisheries to the high value fisheries. (3) The significance offishing effort restrictions gradually became weak. (4) The degree of exclusivity andtransferability of quotas were gradually stronger and more freely. (5) There was a fiveyear period (1985-1990) for fishermen to operate under two different managementregimes in ground fisheries. (6) An ITQ system was gradually accepted by thetraditional legal convention.The 25-year development of the ITQ system may imply that a new fisheriesmanagement institution has been accepted gradually by Icelanders.
3.3 Icelandic ITQ system---its five pillars
A practical ITQ system must contain some necessary components. This sectionexplores the major pillars of an ITQ system.
3.3.1 Recognition of EEZ international
That EEZ system was globally accepted as a rule of international law is the premise ofsuccessful implementation of an ITQ regime. In 1976, the international recognition ofIcelandic 200-mile EEZ made it possible to create the ITQ system. While the UN

Liu
12
Convention on the Law of the Sea grants the exclusive jurisdiction to coastal states, italso emphasises the importance of international co-operative management because offish migration. Effective co-operation between Iceland and her neighbour countriesensures the success of ITQ system in the Atlanto-Scandian herring fishery, oceanicredfish, capelin fishery, etc.
3.3.2 Setting of TAC
Setting of TAC in fact contains two steps - one is totally scientific advice from theMarine Research Institute (MRI) and the other is the final determination made byMinistry of Fisheries. This implies the combination of biological and social -economical objective that fisheries management seeks. When the ITQ was firstintroduced in demersal fisheries, the final TAC for cod determined by the Ministerwas usually higher than recommended by the MRI because the adverse effects on theeconomy had to be taken into account (Figure 5). In 1995 a special catch rule wasadopted: TAC for cod should be 25% of the fishable biomass. In June 2000, this rulewas amended so that the difference in the TAC for cod between two continuous yearsshould not exceed 30000 MT in order to stabilise the harvesting sector.
0
50
100
150
200
250
300
350
400
1984
1985
1986
1987
1988
1989
1990
1991
1992
1993
1994
1995
1996
1997
1998
1999
2000
1000
tonn
es
TAC recommendedTAC determined
Figure 4: Comparison between the TAC determined for cod and that recommended(MRI 2000).
3.3.3 Surveillance of landings
The success of an ITQ system to a large degree depends on whether the landings ofevery fishing vessel are formally and exactly registered. To achieve this, everylanding site has to be monitored effectively. TheDirectorate of Fisheries and localharbour authorities are responsible for the monitoring of landing activities. Figure 6illustrates how an ITQ system is run in Iceland. In addition, a good juridical system isa necessary part of the support system.The system also allows a good deal of flexibility of landing limit. (1) A vessel mayexceed its ACE for any given demersal species (cod not included) by 5% subject to acorresponding reduction in the ACE of other demersal species based on valuedetermined by Ministry. (2) Up to 20% of the ACE for each demersal species, deep-water shrimp, lobster and herring, 10% of ACE for scallops and 5% of ACE foroffshore shrimp may be postponed to the next year. (3) Vessel may also fish up to 5%in excess of its ACE for each demersal species, herring, and deep-water shrimp and3% for scallop and offshore shrimp subject to a corresponding reduction in thefollowing year.

Liu
13
Survey Data from Research Vessels and Catch landed
Fig. 6 Flow chart of Fisheries Management: Icelandic ITQ system
ACES for ITQ vesselsForeign vesselsCommon Quotas for
Boats < 6 GRT
Quota Exchange
Ministry of Fishery
Directorate of Fisheries
Marine Research Institute
TAC RecommendedTAC determined
Fishing at SeaCoast Guard
Harbor Authority Landing operation
Actual Landings, CPUELog book
Fisheries Inspectors
Ministry of Justice
weighing
Inspecting
Registration of Transferability
Inspecting
Inspecting
Max. fishing days or max. cod quotas
ACE vs landings
Figure 5: Flow chart of Fisheries Management - Icelandic ITQ system.
3.3.4 A perfect market of quota transferability
The ITQ system manages to define the quite special fishing rights, which make catchquota markets possible. Through voluntary quota exchange, the buyers and sellers canincrease their economic security respectively. Usually having a comparativeadvantage in fishing operation, the buyers tend to specialise in fishing, while thesellers can get financial compensation. Mutual gain is achieved. A properlyfunctioning quota market system should use the prices to co-ordinate the decisions ofbuyers and sellers. In September 1998, the Icelandic Quota Exchange (IQE) wasestablished. IQE facilitates the bidders to get more complete information. Howeveraccording to the Fisheries Management Act, owning a fishing vessel is a necessarycondition to hold quota and only 50% of annual catch quota can be transferred. Thisrestricts the market force.
3.3.5 Biological support measures of an ITQ system
A successful ITQ system also has to be strongly supported by some biologicalmeasures. These measures include permanent closed nursery areas, immediatetemporary closure of areas with excessive juveniles, 12-mile limit for large trawlers,mesh size limit. And a sorting grid is mandatory to avoid by-catch of juvenile fish inthe shrimp fisheries and devices for excluding juveniles in the demersal fisheries arealso mandatory in certain areas. There are also some requirements that small fish, i,e.cod and saithe less 50 cm, haddock less than 45 cm and redfish shorter than 33 cmmust be kept separate in the catch and must not exceed 7% of the cod catch and 10%of the saithe, haddock and redfish catch. They are not fully counted in calculations ofthe vessel used quota because of low value.
Liu
14
4. DISCUSSION AND CONCLUSION
This chapter explores the effects of ITQ regime, especially the various controversiesover its effects.
4.1 The performance of the Icelandic ITQ system
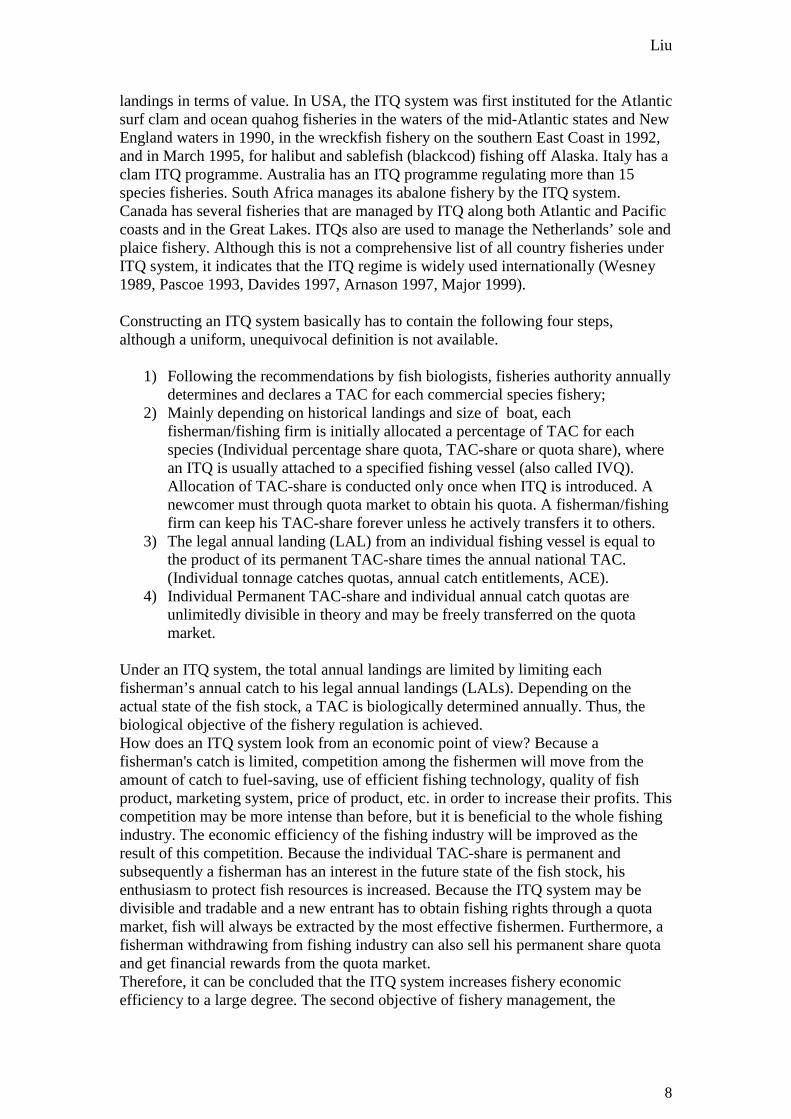
The introduction of the ITQ system to fisheries management is to improve theeconomic efficiency of fishing industry and accomplish the sustainable supply of fishand fish product. Generally speaking, the 2 goals have been achieved in Iceland. Theprogress towards the common goals is, of course, not in the same step in the differentfisheries because it was introduced at different times and in different forms, and moreimportantly, because each fishery has its own biological features.In 1979, the herring fishery was first subject to an ITQ regime. Herring is harvestedmainly in October to January. Figure 7 illustrates that the landings of herring haveincreased steadily since 1975. The stock of herring has recovered successfully(Jakobsson and Stefansson 1998). landings in 1999 are twice that of 1979. Thespawning stock biomass (SSB) in 1999 is 2.38 larger than in 1984. The herring stockhas been successfully rebuilt.
050
100150200250300350400450500550
1975
1977
1979
1981
1983
1985
1987
1989
1991
1993
1995
1997
1999
1000
tonn
es
Landings
TAC recom mended
SSB
Figure 6: The trend of landings, TAC recommended and SSB for summer-spawningherring stock (MRI 1996, 1999,2000).
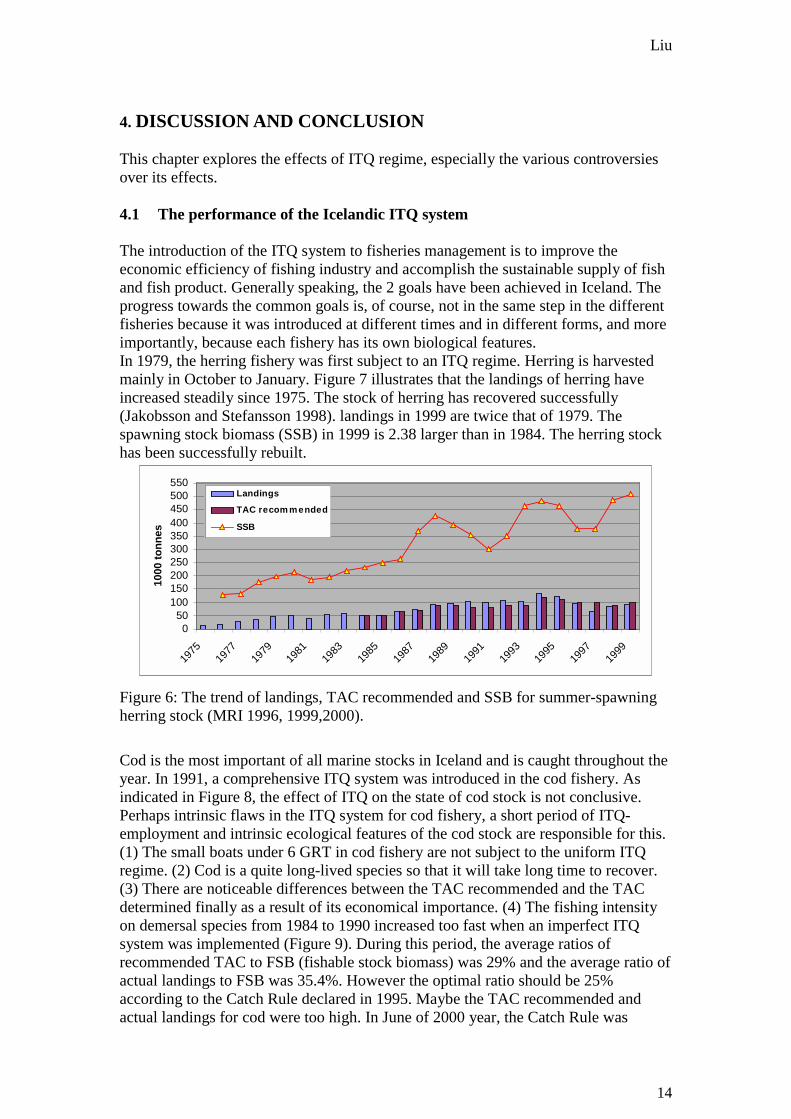
Cod is the most important of all marine stocks in Iceland and is caught throughout theyear. In 1991, a comprehensive ITQ system was introduced in the cod fishery. Asindicated in Figure 8, the effect of ITQ on the state of cod stock is not conclusive.Perhaps intrinsic flaws in the ITQ system for cod fishery, a short period of ITQ-employment and intrinsic ecological features of the cod stock are responsible for this.(1) The small boats under 6 GRT in cod fishery are not subject to the uniform ITQregime. (2) Cod is a quite long-lived species so that it will take long time to recover.(3) There are noticeable differences between the TAC recommended and the TACdetermined finally as a result of its economical importance. (4) The fishing intensityon demersal species from 1984 to 1990 increased too fast when an imperfect ITQsystem was implemented (Figure 9). During this period, the average ratios ofrecommended TAC to FSB (fishable stock biomass) was 29% and the average ratio ofactual landings to FSB was 35.4%. However the optimal ratio should be 25%according to the Catch Rule declared in 1995. Maybe the TAC recommended andactual landings for cod were too high. In June of 2000 year, the Catch Rule was

Liu
15
added: The TAC for cod should not vary by more than 30000 MT between 2continuous fishing years. It suggests that in a quite short period it is very difficult tocombine the biological considerations and economical considerations in demersalfisheries. Figure 8 also reveals the fishable stock of cod tends to increase slowly afterit reached the lowest point in 1992. The recovery of cod may be expected in thefuture.
0
200
400
600
800
1000
1200
1400
1600
180019
80
1981
1982
1983
1984
1985
1986
1987
1988
1989
1990
1991
1992
1993
1994
1995
1996
1997
1998
1999
2000
1000
tonn
es
TAC recommendedTAC determinedLandings (including other nations vessels)SSB for codFishable stock
Figure 7: The trend of landings, TAC recommended, fishable stock and SSB for codstock (MRI 2000).
One of primary purposes of an ITQ system is to provide an incentive to rationallymanage the fishing capital by the fishing industry itself. Under the influence of theITQ regime, the structure of Icelandic fishing fleet has changed largely. The numberof fishing vessels, the number of average fishermen employed, and the total fishingdays at sea tend to reduce gradually, while the average GRT of each vessel tends toincrease slightly (Figure 9).
10 0
15 0
20 0
25 0
30 0
35 0
40 0
45 0
50 0
55 0
60 0
65 0
1984
1985
1986
1987
1988
1989
1990
1991
1992
1993
1994
1995
1996
1997
1998
1999
Day
s or
tonn
age
9 3
9 6
9 9
1 02
1 05
1 08
1 11
1 14
No.
Ave rag e da ys a t s e a pe r tra wl e rAve rag e G RT pe r trawl e rNo . o f s te rn trawl e r
Figure 9 (a): the fleet of stern trawlers.

Liu
16
0
1020
30
4050
6070
80
90100
110
1984
1985
1986
1987
1988
1989
1990
1991
1992
1993
1994
1995
1996
1997
1998
1999
Day
s or
tonn
age
0
50
100
150
200
250
300
350
400
450
500
N0.
Average days at sea per boatAverage GRT per boatNo. of Boats-bottom gi l lnet
Figure 9 (b): the fleet of boats using gillnets.
0102030405060708090
100110120
1984
1985
1986
1987
1988
1989
1990
1991
1992
1993
1994
1995
1996
1997
1998
1999
Day
s or
tonn
age
050
100150200
250300
350400450
500550
No.
Ave rage days at se a pe r boatAve rage GRT pe r boatNo. of Boats-bottom lon g-l in e
Figure 9 (c): the fleet of boats using long-line.
Figure 8: The change of fishing fleet structure and fishing days at sea in demersalfisheries (Statistic Iceland 2000).
Figure 9 shows the change of fishing fleet structure with different fishing methods indemersal fisheries. There were 106 stern trawlers of 473 GRT on average in 1984, andreached 113 stern trawlers in 1992 with 514 GRT on average. In 1997 the number ofstern trawlers reduced to 109 with an average size of 607 GRT. Boats using longlineshow a similar trend but the GRT of boats using gillnets decrease as the number ofboats decline. It is worth noting that the number of fishing boats in the demersalfisheries increased quickly in the early years of the ITQ system and then reduced. It isclear that many people entered the demersal fisheries from 1984 to1990 in order to getquota. Then some of them exited from the fishing industry and some small boats weregradually combined into big boats by 1992. This suggests that the speculation can notbe avoided and an absolute allocation scheme of quotas is not available at all when thetransition of fisheries management regime takes place.The ITQ system can result in the rationalisation and modernisation of the fleets andencourage value-added fish processing. The mix of fisheries input becomes morerational and economic efficiency improves. Figure 9 also reveals the important fact

Liu
17
that the average fishing days at sea per vessel has reduced largely. It is suggested thatunder the ITQ system the fishing technology have been improved significantly.Figure 10 manifests that labour productivity is improved to a large degree. Theeconomic efficiency of the whole fisheries industry has been made better. Thelandings per fisherman increased from 229.3 tons in 1990 to 380.8 tons in 1998. Theexport fob-value of marine fish and fish products per worker in the fishing and fishprocessing sector increased from 4.74 million ISK in 1990 to 7.30 million ISK in1998.
05 0
10 015 020 025 030 035 040 045 050 055 0
1988
1989
1990
1991
1992
1993
1994
1995
1996
1997
1998
Ton
s
00 ,511 ,522 ,533 ,544 ,555 ,566 ,577 ,58
Mill
. ISK
La n di n gs pe r fi s h e rm a n
Export fo b-va l u e pe r wo rk e r i nfi s h i n g a n d proce s s i n g s e cto r
Figure 9: The trend of landings per fisherman and export for-value per worker infishing and processing sector (Statistic Iceland 2000).
Therefore, the past near two decades witnessed an adjustment in the structure of thefishing fleet and the gradual recovery of some depleted stocks. More importantly, anincrease in the economic rents has been seen. This is achieved to a large degree bymarket force, not by expansion of the administrative power of government. A well-defined and well-enforced ITQ regime can automatically balance the landings, thecapacity of resources and fishing capital.
4.2 The controversies over the ITQ system
Although the outcome of the ITQ regime is quite positive, its introduction to fisheriesmanagement has caused the various controversies. This section attempts to pinpointsome of the concerns regarding the ITQ system.
4.2.1 The issue of initial permanent share allocation
Being a mixed concept of economics and biology, the ITQ system indeed provides noguidance regarding who has qualification to be allocated the permanent TAC-shareand how many TAC-shares are given to every individual when it is initiallyintroduced to a specific fishery. How to allocate the TAC initially is a social issuerather than an economic one. Table 3 lists some examples adopted in some countries.

Liu
18
Table 3: Initial allocation of permanent share in some countries (Arnason 1997, Gerryand Mark 1988, Casey and Dewees 1995, Gauvin et al. 1994).
! Iceland: In 1973-1975 vessel quotas were equally allocated in shrimp, scallop and lobsterfisheries.
! Iceland: In 1975 the herring TAC was equally divided among the eligible vessels.! Iceland: In 1984 the TACs for demersal species were allocated normally on the basis of catch
history over 1981-1983 and an adjustment was also made owing to boat repairs or late entryinto the fisheries. In 1985-1990 vessels under effort options may re-enter quota system basedon the new track record.
! Iceland: In 1980 2/3 of quotas in the capelin fishery were allocated equally and 1/3 on thebasis of the hold capacity.
! Netherlands: In 1975 sole and plaice fishery quotas were allocated on the basis of historiccatch and the capacity of vessel (engine size).
! New Zealand: In 1982 deepwater trawl fisheries (for seven commercially important species)on the basis of their capital investment in the fishery.
! Australia: In October 1984 quota allocations were based on catch history (75%) andinvestment in the Southern Bluefin Tuna fishery (25%).
! Canada: In 1990 70% of an initial quotas for halibut were based on historic catch and 30% onthe length of the vessel.
! USA: In 1990 ITQs for ocean quahogs were based on the average catch between 1979 and1987.
! USA: In 1992 50% of quotas for wreckfish fishery were based on historic catch and 50%divided equally among all vessels.
As indicated in the table 3, the initial allocation of quotas was all bound to the activefishing vessels-----only an owner of fishing vessel was entitled to get quotas; thehistoric landings of each vessel and fishing capital were the only considerations andentitlements were given free of charge. No country allocated the quotas by auctionmarket. It is obvious that the harvesting history and present investment are respectedaltogether as much as possible by all countries. When no the best fair methods areavailable, to respect history and reality is a quite civilised and practical choice.Perhaps the number of family members should also be a consideration when an ITQsystem is introduced in a fishery with many small-scale fishers based on families. Theinitial allocation should allow small-scale fishers a better opportunity to participate inthe competition in the future. The introduction of a new institution certainly causesdisharmony in the whole society. Thus equity should be taken into account toincrease social acceptance.In addition, when allocating the TAC for cod annually according to the permanentTAC-share, the Minister is entitled to allocate a small special share to vessel ownerswho have suffered the most from the TAC reductions.
4.2.2 Prediction of TAC
One of the weaknesses of an ITQ system is the accuracy in the projection of TAC.The current biological methods and associated data used to provide advice for fisherymanagement are heavily criticised since the current biological models do not addressthe complex dynamics of marine ecosystems (Macglade 1999). The critics are correctbecause the current knowledge and understanding of marine fish stock is clearlyinsufficient to determine a correct and safe TAC, although various biological modelshave been created and modified for nearly a century. Especially when dealing with the

Liu
19
multi-species fisheries and change of marine physical-chemistry environment, thecurrent scientific methods of stock assessment are quite limited.However it is the market force created by an ITQ system that can reduce the risk ofbiological-prediction uncertainty. Continuous adjustments of TAC are inevitablebecause of the inherent of biological variability in fish stocks and their ecologicalinterrelationship. Whether the TAC is set too high or too low will not affect thestatement that the ITQ will maximise the economic rents from the TAC. Theunderstanding of marine ecosystem and ability to set a sustainable TAC will improveover time.
4.2.3 ITQ and private property right
Whether the ITQ system creates a new type of private property right is a veryinteresting topic, but quite meaningless in practice. On one hand, the catch quota (orTAC-share) is an attached to the fishing vessel, but on the other hand, it has its ownmonetary value and can be traded in the quota market and split like an ordinary assetin a divorce settlement. Thus it caused the serious debate on whether fish stock shouldbe “common or private” and whether the TAC-share holders should pay extra tax orfee for utilisation of fish stocks.Property rights are usually defined as the right to use, control, and obtain the benefitsfrom a good or service. Private property rights exist when property rights are (1)exclusively held by one owner (or jointly by a group of owners) and (2) transferableto others at the owner’s discretion (Gwartney and Stroup 1995). Anthony Scott (1999)attempted to visualise the combination of characteristics in a property right (Figure11).
T ransferab ility
D uration
E xclusiv ity
Security
F lex ib ility D iv isibility
F ig . 11 T he com bination of characteristics in a property r ight
Figure 10: The combination of characteristics in property right
Careful observation suggests that the current Icelandic ITQ regime does not certainlycreate a new type of private property. Article 1 of Fisheries management Act 1990states that the exploitable marine stocks of Icelandic fishing banks are the commonproperty of the Icelandic nation. It only stands for a harvest privilege in fact. First, theprice of ACE or TAC-share in the market does not only depend on the supply anddemand. It is heavily up to the TAC-setting. Second, no matter how well an ITQregime is defined, a quota-holders can never practically claim his right to a part of fishstock in waters, even when his share of fish stock is seriously harmed (it does notmatter whatever reason) because the habitat of fish has many functions and fish maymigrate. The purposes of fish habitat will absolutely increase with the improvements
Liu
20
in scientific technology. The idea of privatisation of marine fish stocks or ocean likeland is only a romantic dream. Should the technology of fencing the oceans becreated, fishing activities would be marine culture. Similarly the quota holders cannever exercise their rights without any interferences, even when the boats below 6GRT are subject to the ITQ regime. Third, the divisibility and transferability are notperfect because the quota is stringently attached to a fishing vessel. Much worse, 50%of ACE must be legally harvested in two consecutive fishing years. Otherwise quotashare will be cancelled. Finally, according to the UN Convention on the Law of theSea, the nature of a coastal state’s sovereign right over fish stock is also not clear.Privatisation of ocean resources does not have strong legal grounds internationally.In fact, attentive and time-consuming debate over private property in fisheries anddiscussion on enclosure the ocean have deviated from the primary purpose of creationof ITQ system. A cat, whether yellow or white, is a good cat as long as it can catch amouse (by Deng Xiaoping). An institution is of course good as long as it can preservethe fish resources and maximise the economic rents. Whether the quotas certificatecan be collateral for loan has not direct relationship with the goals of ITQ regime. It isonly depends on the agreement between the given bank and the specific quota-holder.Like virtual population analysis in fish stock assessment, an ITQ regime seems tocreate a virtual private property over a virtual share of fish stock----just virtual privateproperty.
4.2.4 Concentration of fishing concession, unemployment and community stability
The ITQ regime has been fiercely attacked in Iceland because it can encourage theconcentration of quotas. Further, it will cause the high unemployment and destroy theeconomy of community.Concentration of permanent TAC-share has very different measurements to assess andconcentration of quotas accordingly suggests quite different outcomes. (1) The TAC-share per fishing vessel becomes higher; (2) the geological distribution of TAC-share(registered ports of fishing vessels) contracts; (3) the number of fishing companiesand real quota-holders (including the vessel owners and stockholders of fishingcorporation) reduce.Under the ITQ system, the number of active fishing vessels absolutely reduces andfinally reaches an economic equilibrium point. This is just one of goals for ITQregime to seek. This will directly reduce the employment opportunities for fishermen(seamen) and indirectly affect the jobs in the whole fishing industry.As Figure 12 indicates, the average number of fishermen and employment in fishprocessing has gradually reduced since 1990 and 1995. However there is strongevidence that the ITQ regime has not caused serious unemployment (Figures 13, 14and 15).

Liu
21
0100020003000400050006000700080009000
1000011000
1984
1985
1986
1987
1988
1989
1990
1991
1992
1993
1994
1995
1996
1997
1998
1999
Average No. of fishermenEmployment in fishing sectorEmployment in fish processing
Figure 11: The average number of fishermen and employment in the fisheries(Statistic Iceland 2000).
Figure 13 shows the percentage of employment in fishing sector and fish processingsector has basically gone down since 1984. It is very interesting to note that the rate ofregistered unemployment and percentage of employment in fish processing industryexhibit a very similar tendency since 1992. It suggests that it is quite easy in Icelandto find new jobs in other industry for some workers who have to leave from fisheries.
00,5
11,5
22,5
33,5
44,5
55,5
66,5
77,5
88,5
99,5
1984
1985
1986
1987
1988
1989
1990
1991
1992
1993
1994
1995
1996
1997
1998
Percent of employment in fishing sectorPercent of employment in processing sectorRate of registered unemployment
Figure 12: Comparison between the rate of registered unemployment and percentageof employment in the fishing sector and fish processing sector (Icelandic StatisticsYearbook 1984-1999).
Figure 14 shows that the geological distribution of quota holdings. A clear trend isnoted that the quota holdings held in the Northeast have clearly increased and thequota holdings in Reykjavik and Western fjords have reduced since 1995. The trendof change of quotas held in other regions in not significant. Fig. 15 shows thegeological distribution of registered unemployment. It reveals that the unemploymentrate exhibits the quite similar tendency among all the regions. Compared with Figure14, only in the Northeast region is there a close relationship between the quota

Liu
22
holdings and unemployment rate that the rate of registered unemployment went down,while the quota holdings went up. However there are no indications in other regions.
02468
1 01 21 41 61 82 02 22 42 6
1991
1992
1993
1994
1995
1996
1997
1998
1999
R e y k j a vi kR e y k j a n e sW e s tW e s te r n f jo rd sN o rt h w e s tN o rt h e a s tEa s tS o u th
Figure 13: The geological distribution of quota holdings (Danielsson 2000).
00 ,5
11 ,5
22 ,5
33 ,5
44 ,5
55 ,5
66 ,5
7
1984
1985
1986
1987
1988
1989
1990
1991
1992
1993
1994
1995
1996
1997
1998
Re yk javi kRe yk jan e sW e stW e ste rn fjordsNorth we s tNorth e as tEas tS ou th
Figure 14: The geological distribution of registered unemployment (Statistic Iceland2000).
It is not very reasonable and logical to directly link the employment opportunities in aspecific region with its TAC-share holdings. First, fishing vessels may employ theseamen and land catch outside its region, even employ foreign workers and land itscatch in foreign ports. Second, TAC-share is only a percentage based on quota value.The big TAC-share held in a special region does not necessarily mean more jobsavailable there. The unemployment problem is a complicated social issue. It isdifficult to state what factors will have a seriously adverse impact on jobopportunities. The assertion that the geological contract of TAC-shares definitelydestroys the jobs is lack of strong ground. The whole Icelandic economy is quitestrong. Employment shift is quite easy to achieve.It is also revealed that the national employment does not have any close relationshipswith employment in fisheries. A contradictory relationship may be shown in Figures14, 15, and 16 because of very small contribution from the fisheries to the nationalemployment.The fallacy that the ITQ system causes the serious unemployment stems from a failureto recognise its secondary effects. The number of active fishermen must decline

Liu
23
owing to ITQ. However the ITQ system will definitely lower the cost and improve thelabour productivity, which will lead additional spending and jobs in other industries.For example, the ITQ system creates the new positions in the Icelandic QuotaExchange, some inspector positions, weighing officials, etc. Certainly in the short run,some people have to improve their employability to adapt new positions.The invention of computers and internet does not destroy jobs. The ITQ regimeresults in the mass-production and improved fishing technology and will not depriveof employment in the long run. The purpose of ITQ system is to improve theeconomic efficiency by improving the catch per unit effort. This will be accomplishedthrough reducing fishermen and fishing fleet. Even without the ITQ system, somecommunities may lose vessels and some communities may win vessels. Much worse,the depletion of fish stock may cause the complete closure of fishery. This cansuddenly give rise to a serious unemployment and finally destroy the communitystability.In essence, the ITQ system does not necessarily cause the excessive concentration offishing privilege because any Icelander can “catch fish” by investing in the stockmarket, not only by owning a fishing vessel. And no law prohibits more than oneperson owning one fishing vessel. Thus, analysing how many quota-shares one fishingcompany holds will misinterpret the concentration of fishing rights and further thenotion that the rich will become richer.The co-existence of quota market and stock market imply that the legal co-habitat ofTAC-share holding and vessel-owning will produce negative rather than positiveimpact on the fisheries economy and fair distribution of wealth.In order to reduce the economic oscillation in the community heavily based onfisheries, it is a wise choice to keep the small-operators free of the ITQ system. Theycan be allocated a common TAC-share according to their fishing history. However,this should be a closed fishing club. That the ITQ theory can improve the fishingefficiency is based on an important assumption: the quota-holders are willing totransfer their quotas when they feel their ratio of input and output is low enough. It iswell known that the smaller the fishing operator, the further from the real world thiseconomic assumption is. Thus, it would not have a significant impact on fishingproductivity even when all small-operators had been driven to quota market. The onlyoutcome is to hurt the fishermen feelings, destroy the traditional fisheries culture anddisrupt community stability suddenly, and finally make it difficult to accept thepowerful ITQ system.
4.2.5 Enforcement and administration cost
To function well, any fisheries regimes have to be enforced and monitored effectively.The ITQ system is criticised for leading to false reports and higher administrationcost. How to keep the actual landings of a specified vessel consistent with its quotasheld legally constitutes an important task of fisheries management indeed.In Iceland there are about 70 landing ports. The Directorate of Fisheries issues thescale certificates and licenses the weighing operators (employees of fishing harbourauthority) in each landing port. The licensed operators must weigh all landings on thecertified scales. A computer system links all the landing ports to Directorate ofFisheries and Icelandic Quota Exchange. Actual landing data are transmitted twice aday. In addition, some fisheries inspectors from Directorate of Fisheries observe thefishing activity on board and travel between the landing ports to check the landingactivity. Violations of fisheries laws and regulations are subject to fines, expropriation
Liu
24
of catch and gear, cancellation of fishing permit, and imprisonment depending on theseriousness.Under any fisheries institution, whether good or bad, it is possible for fishermen tobreak the rules to get private interest because every person in essence is selfish.Enforcement of ITQ is not only the duty of government but also the responsibility offishermen and quota holders. In practice it is not easy to misreport the landingsbecause fishing and landing activity are always conducted by a group of people.Further the additional incentive to inspect and report each other can be created byrewarding quota shares revoked from cheaters to reporters or by reallocating them toremaining quota holders. It is also noteworthy that the ITQ regime increases the futureinterest in fishery. It can similarly increase the willingness for operators to observe thelegal rules.The introduction of any new regimes will definitely increase the administration cost.However it is absolutely absurd and unreasonable to oppose the ITQ system for thisreason. Whether a new institution should be established should not at all depend uponits cost in practice. It should depend upon whether society needs this new institutionin the long run.Under the current Icelandic ITQ system, the quota-holder (the owner of active fishingvessel) must pay the following fees and taxes.(1) Directorate of Fisheries annually collects a fishing inspection fee ISK242 per ton
(cod equivalent) to fund the fishing inspection. The minimum is ISK 2700.(2) Directorate of Fisheries annually collects a quota fee, ISK 1230 per ton (cod
equivalent). This fee goes into the developing fund of fisheries.(3) Directorate of Fisheries collects fees for a general fishing permit, ISK 15000 per
year.(4) Vessel owners supply the fishing inspector with meals and facilities.(5) The seller of quota must pay a confirmation fee to the Directorate of Fisheries,
ISK 1800.(6) Weighing fee supports the weighing cost in landing ports.(7) Registration fee of quota-transferability is used to finance Icelandic Quota
Exchange, .13% of trade value.(8) Various taxes collected by state and municipal tax authorities.(9) Various harbour dues are collected by the harbour authorities.(10) Charges for vessel registration are collected by Maritime Administration.
It is suggested that the current ITQ regime be run on a basis of “cost recovery”. In anextreme case it seems that quota holders should also finance the Ministry of Fisheriesand other government organs relating to fisheries. As a result, the fishing industry willbe isolated from the rest of society.The concept of cost recovery is not a wise idea. It will potentially give rise to thedivision of social members, economical conflict between different occupationalgroups and political opposition. People live in a common society. In order to keep andimprove social harmony, tax paying is an ideal choice instead of quota fees becausenobody can clarify what expenditures should be recovered by quota-holders and whatexpenditures should be offered by all taxpayers. Since the current Acts stipulate thatall citizens own the marine fish stocks, it is reasonable and logical to impose a specialtax on quota holder to collect the resources rent. Weighing operators work for theState, not only for quota holders. Therefore, they should be supported by alltaxpayers.
Liu
25
There is no difference between the administration cost of ITQ regime and othergovernment expenditures.
4.2.6 ITQ and high grading/discarding
The concerns that ITQ system tends to cause serious high grading and discardingaffect its acceptance very adversely. The ITQ system indeed creates an excessiveincentive to grade highly and to discard more fish, usually too small and low valuedfish (Arnason, 1994, Anderson 1994).From economic point of view, it is rational for fishermen to discard the small fish inorder to maximise their earnings. Even without ITQ, discarding may take place. Noreliable method can be found to assess how serious the discarding the ITQ will giverise to. In order to reduce discarding, the practical means are to strengthen the directbiological measures by establishing temporary closure areas, strictly inspectingminimum mesh size, legally mounting special sorting devices, etc. The factorytrawlers should be closely watched because the processing machines may select theraw materials too highly. Fishing gear with more biological selectivity should be thetarget, although the current laws and regulations stipulate that the small fish landedmight be counted in the catch quota. Owing to the reduction of fishing effort, theadverse impact on the fish stock and its habitat caused by fishing activity mightlessen.
5. DISCUSSION AND CONCLUSION
The uniform ITQ regime has been employed for over 10 years, since 1991. Itsperformance is generally positive and very promising. However some flaws can alsobe identified in the current ITQ system. Some of them are intrinsic such as stockassessment, discarding, misreporting etc., which can not be eliminated. Other flawsare due to either poor system design or have historical roots, which can be eliminatedto make a better ITQ system in the future.From a political point of view, the stipulation that a fishing vessel without a quota cannot enter the quota market is discriminating against some citizens. From aneconomical point of view, this bridles the force of market mechanism. The fishingvessel is in fact a barrier of entry and exit to the quota market. As a result TAC-share(or ACE) becomes a special asset but with certain flaws. Subsequently its divisibilityand transferability are impaired. The initial allocation of TAC-share respected fishinghistory. To liberate the TAC-share holding from the shackles of a specific fishingvessel in the future is to respect the equity. The Quota Exchange may combine withthe Stock Exchange. The TAC-share for fish stock may be tradable like a special kindof stock.In order to avoid the concentration of fishing concessions and attack the speculation,the Fisheries Management Act stipulates that (1) a vessel must harvest at least 50% ofits ACE in 2 continuous fishing years, (2) the net transfer of ACE from any vesselwithin each year must not exceed 50%, and (3) no single fishing firm may hold morethan a given fraction of TAC for each species. However, this arbitrary command andcontrol subsequently restricts the scale of production. It will definitely generate anadverse impact on improving economic efficiency. Thus, to impose a special tax onthe excessive TAC-share holding is an ideal alternative. Also, taxation on excessiveTAC-share holders can distribute social wealth fairly like tax on individual income.
Liu
26
Instead of so-called cost recovery, a general tax may be imposed on all TAC-shareholders like tax on individual consumption. A general tax on all TAC-share holders isto collect the resource rent because the marine fish stocks are absolutely owned by allIcelanders.The stipulation that up to 20 %ACE of this fishing year may be harvested in the nextyear is not very necessary or appropriate. According to Catch Rule for cod, TAC isequal to 25% of fishable stock. It can infer that the actual landings may be 45%.Therefore in an extreme case the setting of biological TAC may be meaningless. Infact the ACE not caught may be transferred through the Quota Exchange.Small operators with boats under 6 GRT may form a separate fishing club. They canenjoy a permanent, fixed and common TAC-share, or an equal individual TAC-share,but it should be a closed club. If they like, they can also make it possible trade theirquotas within their club. To keep them free of the ITQ system is to respect thefisherman's culture and lifestyle.Although the 10-year history of the Icelandic ITQ system is quite short to draw aconvincing conclusion that the ITQ theory can save the world marine fish resourceand bring about sustainability of the fish supply, its performance in Iceland hasdemonstrated it is the best fisheries management regime.Regardless of whether ITQ represents a private property right or not, it has been usedto protect the fish resource to a large degree and improve the fisheries’ economicefficiency. It is completely impossible and unwise to reverse the process. In fact theobjective of fisheries management is a mix of economic, biological and social goals.Three goals always co-exist in tension with the pendulum of fisheries managementregime often swinging between the three goals. Fisheries management is as much anart as it is a science.The sharp political debate on some controversies does not always benefit society as awhole and does not lead to a consensus in the short term. All people, whethereconomist, biologist, fishers, or politicians, have to take the time to see the success ofthe ITQ system for themselves. A perfect ITQ regime has to be built up both in theoryand in practice.
Liu
27
ACKNOWLEDGEMENTS
Creating a project is always not an author's own effort. First I would like to expressmy many thanks to Dr. Eyjolfur Gudmundsson. Without his warm-hearted help,careful directions, and constructive comments, I would not have finished my project.My special thanks should also be given to Dr. Tumi Tomasson, whose pointedremarks gave an impetus to my ideas. I always feel indebted to Dr. Ragnar Arnason,whose valuable and wonderful teaching benefited my work on this report very muchand even my future.Here I would also like to express my appreciation to the following people for theirfriendly and generous help and directions: Thor Heidar Asgeirsson, Deputy director ofUNU Fisheries Training Programme; Asgeir Danielsson, Economist of NationalEconomic Institute; Sigurjon Adalsteinsson, Head of Dep. of Land-basedSurveillance, Directorate of Fisheries; Gudmundur Kristmundsson, Project managerof Dep. of fisheries management of Directorate of Fisheries; Birgir and Sigurdur, twoinspectors from Directorate of Fisheries; Höskuldur Steinarsson, an official from Dep.of fisheries management of Directorate of Fisheries; Arni Muli Jonasson, AssistantDirector of Directorate of Fisheries; Petur Bjarnason, Chairman of Icelandic FisheriesAssociation; Hannes H. Gissurarson, politics professor of the University of Iceland.Finally I am grateful for the good studying facilities provided by the Marine ResearchInstitute and University of Akureyri, Iceland.

Liu
28
REFERENCES
Anderson, L.G. 1994. An Economic Analysis of Highgrading in ITQ FisheriesRegulation Programmes. Marine Resources Economics 9:209-226.
Arnason, R. 1990. Minimum Information Management in Fisheries. CanadianJournal of Economics 3:630-653.
--- 1994. On catch discarding in Fisheries. Marine Resources Economics 9:189-207.
--- 1995. The Icelandic Fisheries: Evolution and Management of a Fishing Industry.London: Blackwell Science Ltd.
--- 1997. On the Icelandic ITQ System and its Consequences. In Petursdottir, G. ed.Property Rights in the Fishing Industry. Reykjavik: University of Iceland Press.
--- 1999. Advances in ITQ Fisheries Management. In Arnason, R. and Gissurarson,H.H. eds. Individual Transferable Quotas in Theory and Practice. Reykjavik:University of Iceland Press.
--- 2000. The Principles and Practice of Fisheries Management (in press).
Bjarnason, A. 1996. Export or Die--Icelandic Fishing Industry: the Nature andBehaviour of its Export Sector. Reykjavik: Fisheries Research, University of Iceland.
Casey K.E., Dewees, M.C. 1995. The effects of individual vessel quotas in the BritishColumbia Halibut Fishery. Marine Resources Economics 3:211-230.
Christy, F.T. 1997. Economic Waste in Fisheries: Impediments to Change andConditions for Improvement. In Pikitch, E.K., Huppert, D.D. and Sissenwine, M.P.eds. Global trends: Fisheries Management. Bethesda: American Fisheries Society.
Danielsson, A. 1997. Fisheries Management in Iceland. Ocean & CoastalManagement 35:121-135.
--- 2000. The quota transfers in Iceland: A descriptive 2000 (unpublished).
Davides, W. 1997. ITQs in the Netherlands. In Petursdottir, G. ed. Property Rights inthe Fishing Industry. Reykjavik: University of Iceland Press.
FAO 2000. Yearbook: fishery statistics capture production 1998.
Garcia, S.M. and Newton, C. 1997. Current Situation, Trends, and Prospects in WorldCapture Fisheries In Pikitch, E.K., Huppert, D.D. and Sissenwine, M.P. eds. Globaltrends: Fisheries Management. Bethesda: American Fisheries Society.
Gauvin, J.R., et al. 1994. Description and evaluation of the wreckfish fishery underindividual transferable quotas. Marine Resources Economics 2: 99-118.

Liu
29
Gerry. G. and Nayar, M. 1988. Individual Transferable Quotas in the Southern TunaFishery: An Economic Appraisal. Marine Resources Economics 4: 365-388.
Gissurarson, H.H. 1999. The Fishery: Agreeing on the Rules. In Arnason, R. andGissurarson, H.H. eds. Individual Transferable Quotas in Theory and Practice.Reykjavik: University of Iceland Press.
--- 2000. When ideas conspire with circumstances: Introducing individual transferablequotas in fisheries. Bilingual Journal of Interdisciplinary Studies 2:285-314.
Gordon, H.S. 1954. The Economic Theory of a Common Property Resource: theFisheries. Journal of Political Economy 62:124-142.
Gwartney, J.D. and Stroup, R.L. 1995. Microeconomics: Private and Public Choice.Fort Worth: The Dryden Press.
Hannesson, R. 1993. Bioeconomic Analysis of Fisheries London: Fishing NewsBooks.
Hardin, G. 1968. The Tragedy of the commons. Science 162:1243-1247.
Hart, J.A. 1976. The Anglo-Icelandic Cod War of 1972-1973: A case study of afishery dispute. Berkeley: Institute of International Studies, University of California.
Jakobsson, J. and Stefansson, G. 1998. Rational harvesting of the cod -capelin-shrimpcomplex in the Icelandic marine ecosystem. Fisheries research 37:7-21.
Jonsson, H. 1982. Friends in Conflict: The Anglo-Icleandic Cod Wars and the Lawand of the Sea. London: C. Hurst and Co. (Publishers) Ltd.
Laursen, F. 1993. Small powers at Sea. Dordrecht: Martinus Nijhoff publishers.
Macglade, J. 1999. Bridging disciplines: The role of scientific advice, especiallybiological modelling. In Kooiman, J., van Vliet, M. and Jentoft, S. eds. Creativegovernance---opportunities for fisheries in Europe. Aldershot: Ashgate PublishingLimited.
Major, P. 1999. The Evolution of ITQs in New Zealand. In Arnason, R. andGissurarson, H.H. eds. Individual Transferable Quotas in Theory and Practice.Reykjavik: University of Iceland Press.
MRI 1996. State of marine stocks in Icelandic waters 1999/2000.
MRI 1999. State of marine stocks in Icelandic waters 1999/2000.
MRI 2000. State of marine stocks in Icelandic waters 1999/2000.
OECD 1997. Towards Sustainable Fisheries: Economic Aspects of the Managementof Living Marine Resources.
Liu
30
Palsson, G. 1999. Individual Transferable Quotas: Unconstitutional Regimes? TheCommon Property Resource Digest 48:1-4.
Pascoe S. 1993. ITQs in the Australian SouthEast Fishery. Marine ResourcesEconomics 8:395-401.
Porter, G. 1997. Euro-African Fishing Agreements: subsidizing overfishing in Africanwatrs. In Subsidies and Depletion of World Fisheries: case studies. Washington D.C.:World Wildlife Fund.
Runolfsson, B.Th. 1999. The Icelandic System of ITQs: its nature and performance.In Arnason, R. and Gissurarson, H.H. eds. Individual Transferable Quotas in Theoryand Practice. Reykjavik: University of Iceland Press.
Scott, A. 1955. The History: The Objective of Sole Ownership. Journal of PoliticalEconomy 63:116-124.
--- 1999. Fishermen's Property Rights. In Arnason, R. and Gissurarson, H.H. eds.Individual Transferable Quotas in Theory and Practice. Reykjavik: University ofIceland Press.
Statistic Iceland 2000. Statistical Yearbook of Iceland 1990-1999. Reykjavík.
Warming, J. 1911. On Rent of Fishing Grounds. Translated by Peder Andersan andKirsten Stentorft. History of Political Economy 1983 15 (3): 391-396. DukeUniversity Press.
Wesney, D. 1989. Applied Fisheries Management Plans: Individual TransferableQuotas and Input Controls. In Neher, P.A., Arnason, R. and Mollett, N. eds. RightsBased Fishing. Dordrecht: Kluwer Academic Publishers.