implementation of oregon [ s pcpch program · 2020-06-27 · implementation of oregon [s pcpch...
TRANSCRIPT
IMPLEMENTATION OF OREGON’S PCPCH PROGRAM:
EXEMPLARY PRACTICE AND PROGRAM FINDINGS Final Report, September 2016
Prepared by:
Sherril Gelmon, DrPH
Neal Wallace, PhD
Billie Sandberg, PhD
Shauna Petchel, MPH
Nicole Bouranis, MA
OHSU & PSU School of Public Health and Mark O. Hatfield School of Government
Portland State University
506 SW Mill St.
Suite 670
Portland, OR 97201

Implementation of Oregon’s PCPCH Program: Exemplary Practice and Program Findings Executive Summary, September 2016
Study Aims
The Oregon Health Authority (OHA) contracted with Portland State University (PSU) to evaluate the implementation of the Patient Centered Primary Care Home (PCPCH) program, including: (Aim 1) to understand the organizational conditions and process improvement activities of “exemplary” PCPCH clinics; (Aim 2) to estimate the impact of the PCPCH program on the utilization and expenditure patterns of clinics’ clientele; and (Aim 3) to assess the general consistency and usefulness of PCPCH scoring in evaluating PCPCH performance.
Findings The study’s findings indicate that Oregon’s PCPCH program has been very successful in meeting the goals of cost-effective, system-wide care transformation embodied in the Triple Aim. The PCPCH program has fostered the following elements of health systems transformation as envisioned by OHA:
Encouraged clinics to embrace team-based care and continuous improvement, and to adopt a “patient centered lens.” This shift in organizational culture supports new clinic processes such as care coordination, shared decision-making and using data to drive actions, resulting in care teams that are more aware of patients’ goals.
Helped clinics to shift towards population-based strategies that will improve the health of groups of patients who share a diagnosis or demographic characteristics.
In terms of costs and utilization, the PCPCH program has:
Reduced total service expenditures per person by 4.2% or approximately $41 per person per quarter (~$13.50/month). Effects increased significantly the longer clinics were designated as a PCPCH, generally doubling from the first to third year of recognition.
Resulted in $13 in savings in other services, such as specialty care, emergency department and inpatient care, for every $1 increase in primary care expenditures related to the PCPCH program.
Saved an estimated $240M over its first three years. This amount should increase as more clinics become recognized and then continue to develop and mature in the program.
The relevance of PCPCH recognition in evaluating PCPCH performance was demonstrated as follows:
The cumulative effect of the six PCPCH attributes has more impact on cost and utilization measures than their independent effects. In addition, the 18 standards identified as core by PCPCH staff appear to better identify level of performance than the total PCPCH score.
Interviews revealed perceptions that while some of the attributes create organizational tension or conflicting priorities when implemented simultaneously, others are complementary.
While the program is a success overall, the study revealed some issues that can be addressed at the systems level (S), the program level (P), or through technical assistance (TA). These are critical considerations to advance the program’s goals and future success:
(S) Payment models and other financial arrangements do not currently incentivize clinics to operate in alignment with PCPCH program aims. Clinic leaders struggle to financially support the changes necessary for both general and top-tier recognition.
(S) Barriers to information exchange with other clinics and hospitals significantly impede PCPCH clinics. The lack of interoperability across EHR platforms can rarely be addressed by individual clinics.
(P) Considerable differences exist between PCPCH and non-PCPCH clinics. PCPCH patients are generally younger and Medicaid-insured. PCPCH designated clinics tend to be larger than non-PCPCH clinics or practices.

ii
(P) Terms such as “patient-centered” and “comprehensive whole-person care” are sometimes understood as describing a team’s or provider’s philosophy, rather than specific activities. This misunderstanding of program terminology can be a barrier to a clinic’s improvement.
(P) Patients have trouble understanding the relative value of different tiers of recognition. Patients also sometimes resist concepts like shared decision-making.
(TA) Clinics with adequate space and up-to-date technological resources flourished, while clinics with outdated EHRs and inadequate space reported obstacles to making changes.
(TA) Clinic leaders found training to support organizational cultural change to be critical, including: interpersonal communications; hiring practices; reductions in organizational hierarchy; transparency in planning and decision-making processes; and normalization of accountability through evaluation, information sharing, and solicitation and provision of feedback. Significant staff turnover was a common experience in early implementation but provided opportunities for new hiring strategies.
(TA) Clinics most affected by Medicaid expansion find that newly insured patients need time to learn to navigate the primary care system. These clinics need robust networks of social services as they serve patients whose housing, transportation, and economic situations complicate medical care.
Conclusions The findings demonstrate that the PCPCH program has achieved some noteworthy indicators of progress toward accomplishment of the Triple Aim in only a few years of operation. PCPCH designated clinics have accomplished significant transformation, resulting in greater effectiveness and efficiency, both within primary care and the larger health care system. These successes are not easily obtained or sustained, and take several iterations of experimentation and adaptation in which clinic leaders must be willing to examine all aspects of clinic process and culture. Dialogue and transparency at all levels of the clinic are essential. Ultimately, the larger health systems environment must support clinic and individual changes. Expanded support for clinics, and a continuing emphasis on creating this supportive environment for implementation, should both sustain the progress made and invite further engagement from primary care clinics across Oregon. For additional recommendations from the PSU research team related to these implementation findings, see Executive Summary Supplement: Recommendations.
Methodology The PSU research team worked with OHA program leaders to identify “exemplary” clinics at the time of evaluation based upon representativeness across participating PCPCH organizations, diversity of clinic characteristics, attestation scores, stability in ownership, and willingness to participate in the case study. Twenty clinics were selected and interviewed to assess their experience in the PCPCH program. In addition, PSU was provided access to Oregon APAC claims and eligibility data covering one year prior and three years following PCPCH program implementation (October 2010-September 2014). PCPCH program effects were identified as the “difference in difference” of pre- to post-designation changes within clinics that attained PCPCH designation to those who were never designated. All study protocols were approved by the PSU Institutional Research Board (IRB).
PCPCH Evaluation Team Investigators: Sherril Gelmon, DrPH, Neal Wallace, PhD, and Billie Sandberg, PhD Research Assistants: Shauna Petchel, MPH, and Nicole Bouranis, MA OHSU-PSU School of Public Health & Mark O. Hatfield School of Government Portland State University

iii
Executive Summary Supplement: Recommendations Based upon Program Findings September 2016
System Level Strategies: S-1: Reform payment mechanisms to provide incentives and rewards for participation in the PCPCH program, advancement along program tiers that increases program benefits, and adequate and sustainable reimbursement of critical and high-impact components of the PCPCH model. S-2: Develop and coordinate a more systematic approach and regional coordination to achieve interoperability of electronic health records (EHRs) across providers in Oregon.
Program-Specific Strategies: P-1: Monitor the considerable differences in patient and provider characteristics that exist between currently participating PCPCH clinics and those that have not yet opted in. P-2: Consider the implications of the findings that attainment of the six program attributes works collectively and not independently, and that the 18 standards identified as core by PCPCH staff appear to outperform total PCPCH score, in further efforts to develop the PCPCH recognition process. P-3: Adopt value-neutral program language that more clearly points to specific operational changes and avoids terminology that implies care was negligent or mishandled prior to PCPCH recognition. P-4: Work with other organizations and improvement-focused collaboratives to streamline and develop more universal definitions of core concepts and standards for required metrics. P-5: Use media and other strategies to raise public awareness of the value of PCPCH across Oregon. P-6: Emphasize through ongoing communications that the transformation aims of PCPCH are dependent upon the engagement or resistance of individual people within the clinics. Technical Assistance Strategies with Individual Clinics: TA-1: Support clinics to find or develop staffing to meet program documentation/reporting mandates. TA-2: Provide financial assistance for initial structural changes, facilities expansions, and technological improvements to equip clinics with the physical and digital resources that support the cultural and process changes that will be implemented through the PCPCH developmental process.
TA-3: Provide skill-building and training resources to support organizational cultural change. TA-4: Allow clinics a financial “grace period” to experiment with workflows, organization and team structures, and other processes for performance improvement without risking their bottom line. TA-5: Allow time to assess the patient culture and support the shift to PCPCH. TA-6: Meet clinics “where they are,” and avoid language that clinics may perceive as critical. TA-7: Provide examples of practices that illustrate workflow or documentation processes and reveal the intent behind each standard. Include examples of practices that do not meet the standards.

1
Table of Contents Introduction and Process .......................................................................................................................... 1
Overview of the PCPCH Program ...................................................................................................................... 1
Evaluating the PCPCH Program: Phase 3 .......................................................................................................... 1
Overall PCPCH Program Effects on Service Expenditures and Use: Aim 2 .................................................... 4
Overview ........................................................................................................................................................... 4
Comparison of PCPCH vs. Non-PCPCH Patients and Clinics .............................................................................. 5
Average PCPCH Program Effects....................................................................................................................... 6
PCPCH Program Effects by Year since PCPCH Designation ............................................................................. 11
Summary of Aim 2 Analyses and Findings ...................................................................................................... 11
Qualitative Findings from Exemplary Clinics: Aim 1 ................................................................................. 12
Health Systems Environment Themes ............................................................................................................ 13
Themes about Organizations and Clinics ........................................................................................................ 14
Themes about Microsystems of Care Delivery ............................................................................................... 15
Themes about the Patient Experience ........................................................................................................... 17
Summary of Aim 1 Analyses and Findings ...................................................................................................... 18
Assessment of PCPCH Attributes: Aim 3 .................................................................................................. 19
Attribute 1: Access to Care ............................................................................................................................. 21
Attribute 2: Accountability ............................................................................................................................ 22
Attribute 3: Comprehensive Whole Person Care .......................................................................................... 23
Attribute 4: Continuity ................................................................................................................................... 24
Attribute 5: Coordination and Integration..................................................................................................... 25
Attribute 6: Person and Family Centered Care .............................................................................................. 26
Summary of Aim 3 Analyses and Findings ...................................................................................................... 27
Recommendations ................................................................................................................................. 28
Conclusions ............................................................................................................................................ 31
Acknowledgements ................................................................................................................................ 33
Appendix 1 ............................................................................................................................................ 34
Effects of the Patient Centered Primary Care Home Program on Service Expenditures and Use: Aim 2 of the
Phase 3 Evaluation .......................................................................................................................................... 34
Introduction and Background ......................................................................................................................... 35
Study Design ................................................................................................................................................... 35
Data ................................................................................................................................................................ 35
Study Population ............................................................................................................................................ 35
PCPCH Clinic Cohort and Study Period ....................................................................................................... 35

2
Identifying PCPCH and non-PCPCH Primary Care Providers ....................................................................... 35
Identification and Attribution of Individuals to PCPCH vs. non-PCPCH Primary Care Status ..................... 36
Developing the Final Analytic Data Set....................................................................................................... 36
Use and Expenditure Measures .................................................................................................................. 36
Subject Clinical and Demographic Measures ............................................................................................. 37
Statistical Analysis........................................................................................................................................... 37
Results ............................................................................................................................................................ 38
Limitations ...................................................................................................................................................... 42
Conclusions ..................................................................................................................................................... 42
Appendix 2 ............................................................................................................................................ 43
Effects of High PCPCH Attribute Scores on Service Expenditures and Use: Additional Analyses for Aims 2
and 3 of the Phase 3 Evaluation ..................................................................................................................... 43
Background ..................................................................................................................................................... 44
Data ................................................................................................................................................................ 44
Clinic Scores on PCPCH Attributes .................................................................................................................. 45
Relationships Among PCPCH Attribute Scores ............................................................................................... 47
Effect of High PCPCH Score on Service Utilization and Expenditures ............................................................. 49
Effect of PCPCH Attributes on Cost and Utilization ........................................................................................ 50
Attribute 1: Access to Care ......................................................................................................................... 51
Attribute 2: Accountability ......................................................................................................................... 51
Attribute 3: Comprehensive, Whole-Person Care ...................................................................................... 52
Attribute 4: Continuity................................................................................................................................ 53
Attribute 5: Coordination and Integration ................................................................................................. 54
Attribute 6: Person and Family-Centered Care .......................................................................................... 55
Limitations ...................................................................................................................................................... 56
Conclusions ..................................................................................................................................................... 56
Appendix 3 ............................................................................................................................................ 58
Qualitative Findings from Exemplary PCPCH Clinics: Aim 1 of the Phase 3 Evaluation .................................. 58
Background and Study Design ........................................................................................................................ 59
Results of the Qualitative Analysis ................................................................................................................. 60
Cross-Cutting Themes ..................................................................................................................................... 60
Themes about the Health Systems Environment ....................................................................................... 61
Themes about Organizations and Clinics.................................................................................................... 64
Themes about Microsystems of Care Delivery ........................................................................................... 67
Themes about the Patient Experience ....................................................................................................... 72

3
Concluding Thoughts on Cross Cutting Themes ......................................................................................... 75
Themes by Attributes ..................................................................................................................................... 76
Attribute #1: Access to Care ....................................................................................................................... 76
Attribute #2: Accountability ....................................................................................................................... 77
Attribute #3: Comprehensive Whole Person Care ..................................................................................... 79
Attribute #4: Continuity.............................................................................................................................. 81
Attribute #5: Coordination and Integration ............................................................................................... 83
Attribute #6: Person- and Family-Centered Care ....................................................................................... 84
Conclusions: Exemplary Practices of PCPCH Clinics ........................................................................................ 86

1
Introduction and Process
Overview of the PCPCH Program The Patient Centered Primary Care Home (PCPCH) Program, which was established by the Oregon Legislature in 2009, is viewed as a key strategy in achieving the “Triple Aim” envisioned in health systems transformation — a healthier population, a better patient care experience, and more reasonable costs. Specifically, the PCPCH Program was established based on extensive research that demonstrates that the medical home model — clinical practices that provide comprehensive, coordinated care while taking into account family and community context — is uniquely positioned to provide care that is better coordinated and to advocate for patients’ needs more effectively.1 The PCPCH Program was previously overseen by the Office for Oregon Health Policy and Research (OHPR), and is now administratively housed within the Transformation Center of Oregon Health Authority (OHA). The PCPCH Program was tasked with (1) developing strategies to identify and qualify clinics2 for the PCPCH Program; (2) utilizing these same strategies to measure the quality of designated PCPCH clinics; (3) promoting the development of PCPCH clinics; and, (4) encouraging individuals who are covered by the Oregon Health Plan (OHP) to receive care in the PCPCH model. Pursuant to the first two tasks, in 2009 the OHA appointed a 15-member advisory committee which was comprised of patients, clinicians, and health plan and purchasing representatives to develop the standards that the PCPCH Program uses to describe the care delivered by PCPCH-designated clinics.3 The first set of standards developed by the committee was finalized and adopted in 2011; these were updated and a revised set of standards was implemented in 2014. A further revision has been adopted for use beginning in 2017, but these are beyond the scope of the present report. The standards were developed to reflect the six core attributes of the Oregon PCPCH Program, and are intended to reflect the perspective of the patient. The 2014 core attributes and standards are:
1. Access to Care: “Health care team, be there when we need you.” 2. Accountability: “Take responsibility for making sure we receive the best possible health care.” 3. Comprehensive Whole Person Care: “Provide or help us get the health care, information, and
services we need.” 4. Continuity: “Be our partner over time in caring for us.” 5. Coordination and Integration: “Help us navigate the health care system to get the care we need
in a safe and timely way.” 6. Person and Family Centered Care: “Recognize that we are the most important part of the care
team—and that we are ultimately responsible for our overall health and wellness.”
Evaluating the PCPCH Program: Phase 3 OHA initially contracted with Portland State University (PSU) in 2012 to evaluate the early implementation of the PCPCH program and understand the initial impact on recognized clinics and their performance. Through the first two phases of evaluation, limited general effects of the earliest PCPCH
1 Berenson, R.A., Hammons, T., Gans, D.N., et al. (2008). A house is not a home: Keeping patients at the center of practice redesign. Health Affairs, 27(5), 1219-1230. 2 For clarity, we use “clinic” to refer to organizations providing care. The term “practice” is reserved for describing actions and
behaviors of organizations’ staff, providers and clients. 3 Oregon Health Authority. (2012, October). Standards and measures for patient-centered primary care homes: Final report of the Patient-Centered Primary Care Home Standards Advisory Committee. Accessed from http://www.primarycarehome.oregon.gov on May 2, 2014.

2
adopters were identified, and both PSU researchers and OHA staff observed and documented considerable variation in the level of attainment of core attributes and standards across PCPCH clinics. As a result, OHA contracted with the PSU research team in 2014 for a third phase of evaluation to better identify the overall program effects on expenditures and service use; to explore the basis of these differences in attribute attainment across selected PCPCH clinics; and, to assess the extent to which individual attributes affect the financial and organizational performance of PCPCH clinics. These objectives would be accomplished through an in-depth examination of a select number of “exemplary” clinics and an analysis of Oregon All Payer All Claims (APAC) data for both recognized PCPCHs and other clinics included in the APAC database. Three aims were established for the Phase 3 evaluation, with a mixed methods approach adopted to maximize development of relevant evidence and enhance validity of analysis:
Aim 1: Examine up to 30 selected PCPCH clinics with exemplary designation scores on one or more of the six core attributes to understand the organizational conditions and process improvement activities that led to the exemplary scores. Qualitative methods were used to assess organizational context and behavior.
Aim 2: Assess and compare patterns of utilization and expenditure change across all PCPCH clinics with more detailed analyses of those with exemplary designation scores on one or more of the six core attributes (inclusive of those selected in Aim 1), to understand how and whether individual core attributes relate to these outcome domains. Quantitative methods were used to assess PCPCH performance from pre- to post-PCPCH designation.
Aim 3: Combining the findings from Aim 1 and Aim 2, assess the general consistency and usefulness of PCPCH attribution scoring in evaluating PCPCH performance and identify the organizational conditions and process improvement activities that are necessary to achieve performance improvement. The qualitative and quantitative findings were combined to develop critical links from clinic behavior to attribute scoring to clinic performance.
Each of these aims is explored in detail, including the methods used and specific findings, within the three appendices of this report. Selected highlights from the three appendices are synthesized and presented in the summary below. To accomplish Aim 1, the PSU research team selected recognized clinics for inclusion in the case study by reviewing a master list of the 408 clinics recognized under the 2014 standards as of December 2014, and triangulating multiple criteria. These selection criteria emphasized clinics’ scores on 18 of the PCPCH standards that Program staff had identified as core elements of the medical home model, rather than total PCPCH score. This process resulted in the identification of 70 clinics deemed exemplary and eligible for inclusion. A detailed explanation of the selection process to move from the 70 clinics to the case study selection is presented in Appendix 3. Ultimately, 20 exemplary PCPCH clinics participated in the case study portion of this evaluation, with diverse representation based upon geographic location, size, ownership, and practice specialty. Table 1 illustrates the distribution of selected clinics.

3
Table 1: Characteristics and Distribution of 20 Exemplary Clinics
Geography
Size (FTE) Ownership/
Affiliation Practice specialty
Region
5 – Rural 1 – 0-2 FTE primary practitioners
12– Independent, not affiliated with any other practice
14* – Family Medicine
11 – Columbia Willamette
4 – Urban Small
4 – 3-5 FTE primary practitioners
1 – Independent governance; part of an alliance (for economies of scale)
3* – Internal Medicine
2 – Cascades East
6 – Urban Medium
5 – 6-9 FTE primary practitioners
7 – Owned by a larger system 4 – Pediatrics 6 – Oregon Pacific
5 – Urban Large
10 – 10 or more FTE primary practitioners
1 – Northeast Oregon
*1 clinic identified as both Family Medicine and Internal Medicine
To accomplish Aim 2, four years of APAC data were used to assess the impact of the PCPCH program on expenditures and use of insurance covered services. These data covered a minimum of one year prior to the earliest designation of PCPCH clinics (October 2010 – September 2011) and up to three years after (October 2011 – September 2014). Individuals were selected during each study year who had at least one primary care visit, were Oregon residents, had consistent, full-year insurance coverage (medical and pharmacy), and received their primary care either exclusively from providers that received PCPCH designation during the study period (PCPCH) or from providers who never did (non-PCPCH). The final study population consisted of 1,128,234 distinct individuals (606,881 PCPCH and 599,990 non-PCPCH), representing approximately 500,000 person-year observations in each study year (roughly 50/50 PCPCH and non-PCPCH). These were in turn aggregated to quarterly observations representing 510 PCPCH and 8,435 non-PCPCH clinic billing units. To assess the impact of the PCPCH program on use and expenditures, changes in service use and expenditures among PCPCH providers before and after their PCPCH designation date were compared to changes over the same time period among non-PCPCH primary care providers. The net effect of the PCPCH program is the difference between these two changes or “differences.” This represents a standard evaluation design known as a “difference-in-difference” which identifies only those changes that can be attributed to the PCPCH program beyond any underlying general trends. These changes were assessed for all covered services and eight specific service types relevant to expected PCPCH effects: primary care office visits and procedures, specialty office visits and procedures, outpatient mental health care, non-therapeutic (diagnostic) radiology, laboratory, pharmacy, emergency department, and inpatient. Within each of these outcome domains, we assessed change in expenditures per person, expenditures per service user, and the likelihood of using service. In addition, we assessed the impact of the PCPCH program on average across the first three years of operation, as well as the effects of PCPCH clinics in their first, second or third year of PCPCH operation. Full details of this portion of the quantitative analyses related to Aim 2 can be found in Appendix 1. To accomplish Aim 3, scores for the six PCPCH attributes were provided by OHA for clinics receiving recognition under the 2014 PCPCH standards between January 2014 and March 2016. These scores

4
were merged with the APAC data set utilized in Aim 2. Factor analysis, frequency, and distribution of scores on the attributes are discussed in detail in Appendix 2. The pre-post assessment of utilization and expenditure measures employed in Aim 2 was repeated, further segmenting clinics to compare whether those achieving high scores on the attributes demonstrated different trends than lower scoring PCPCH clinics. During this phase, scores from the twenty exemplary clinics selected for Aim 1 were also compared with other clinics from the top quartile scores of all PCPCHs, verifying that clinics selected for inclusion in the qualitative phase of this assessment were in fact reflective of exemplary scores not only for total points but within the six attributes. This lends additional validity to the themes extracted from interviews, since these twenty exemplary clinics are not significantly different from top scoring clinics as a whole. Full details of this portion of the quantitative analyses related to Aim 2 may be found in Appendix 2. To further accomplish Aim 3, the research team then systematically reviewed and synthesized the findings from both the quantitative and qualitative analyses, seeking to identify key themes across the results and to provide a more complete, comprehensive picture of the PCPCH program and its contribution toward achievement of the Triple Aim, as well as the practices, challenges, and facilitators that lead to a successful PCPCH clinic. More specifically, the research team drew on the findings from the qualitative data from Aim 1 to develop hypotheses to expand the analysis from Aim 2. In this way, the research team was able to expand and elaborate the findings from both Aim 1 and Aim 2. Ultimately, this approach allowed the research team to identify and assess critical links among clinic characteristics and behavior, attribute scoring, and clinic performance, further investigating the relationship between the qualitative analyses and the quantitative performance analyses. Analyses of clinics’ scores on each attribute are provided, noting patterns in the distribution of scores that yield insights into clinics’ implementation strategies. This is paired with discussion of utilization and expenditure trends that were unique to clinics with top scores in specific attributes. The order of reporting on the first two aims below has been revised to provide a more logical progression of findings in this synthesis report. First, the major quantitative findings related to costs and outcomes developed from analysis of the APAC data are described (Aim 2). Then, the major themes developed from the qualitative findings obtained from in-person interviews and focus groups with the 20 exemplary clinics are presented (Aim 1). Third, each of the six PCPCH attributes is discussed, combining both quantitative and qualitative findings (Aim 3). Finally, we present a set of recommendations to OHA for consideration in developing future program strategies. These recommendations, based on our findings, suggest future actions for reducing barriers to implementation and expansion of the PCPCH program and for supporting the facilitation of the program for both exemplary clinics and those clinics that may be struggling with implementation or are thinking about going through the recognition process.
Overall PCPCH Program Effects on Service Expenditures and Use: Aim 2
Overview As noted above, the overall impact of the PCPCH program on service expenditures and use were identified by comparing changes among PCPCH providers from pre- to post-PCPCH designation to changes among non-PCPCH providers over the same time period (i.e., “difference-in-difference”). The following sections provide a summary of the results of these analyses. Full details may be found in Appendix 1. The narrative begins by reviewing the differences found in the characteristics of PCPCH vs. non-PCPCH patients and clinic size. These provide for important considerations regarding the current and likely future impact of the program as it expands. Then, summary findings for the overall PCPCH program analysis are provided, which represents the average effects of the PCPCH program during its
5
first three years of operation. Last, the summary findings for PCPCH providers during their first, second, and third year of operation as a PCPCH in comparison to the average program effects are presented. It should be noted that the progressive effects found as PCPCH clinics mature in the program potentially provide a better and more distinct picture of where the PCPCH program is headed. These effects also support the value of looking in depth at PCPCH clinics that have “gone farther” in attaining PCPCH attributes as captured in Aims 1 and 3.
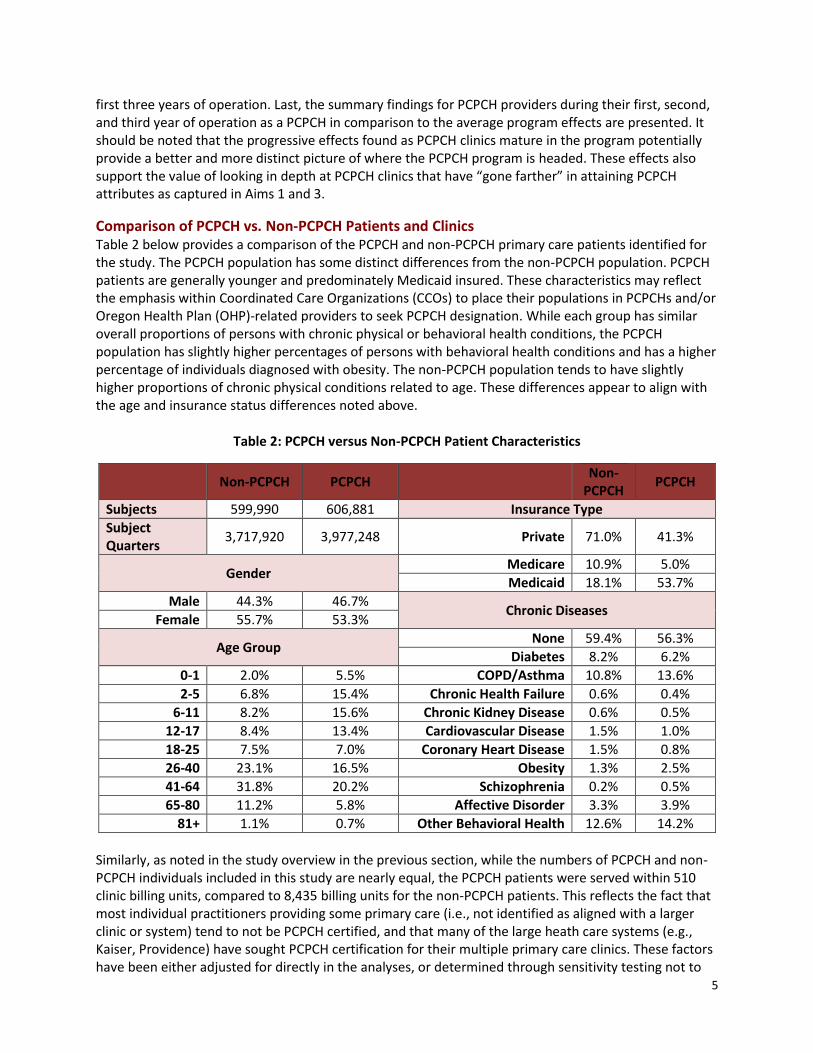
Comparison of PCPCH vs. Non-PCPCH Patients and Clinics Table 2 below provides a comparison of the PCPCH and non-PCPCH primary care patients identified for the study. The PCPCH population has some distinct differences from the non-PCPCH population. PCPCH patients are generally younger and predominately Medicaid insured. These characteristics may reflect the emphasis within Coordinated Care Organizations (CCOs) to place their populations in PCPCHs and/or Oregon Health Plan (OHP)-related providers to seek PCPCH designation. While each group has similar overall proportions of persons with chronic physical or behavioral health conditions, the PCPCH population has slightly higher percentages of persons with behavioral health conditions and has a higher percentage of individuals diagnosed with obesity. The non-PCPCH population tends to have slightly higher proportions of chronic physical conditions related to age. These differences appear to align with the age and insurance status differences noted above.
Table 2: PCPCH versus Non-PCPCH Patient Characteristics
Non-PCPCH PCPCH Non-
PCPCH PCPCH
Subjects 599,990 606,881 Insurance Type
Subject Quarters
3,717,920 3,977,248 Private 71.0% 41.3%
Gender Medicare 10.9% 5.0%
Medicaid 18.1% 53.7%
Male 44.3% 46.7% Chronic Diseases
Female 55.7% 53.3%
Age Group None 59.4% 56.3%
Diabetes 8.2% 6.2%
0-1 2.0% 5.5% COPD/Asthma 10.8% 13.6%
2-5 6.8% 15.4% Chronic Health Failure 0.6% 0.4%
6-11 8.2% 15.6% Chronic Kidney Disease 0.6% 0.5%
12-17 8.4% 13.4% Cardiovascular Disease 1.5% 1.0%
18-25 7.5% 7.0% Coronary Heart Disease 1.5% 0.8%
26-40 23.1% 16.5% Obesity 1.3% 2.5%
41-64 31.8% 20.2% Schizophrenia 0.2% 0.5%
65-80 11.2% 5.8% Affective Disorder 3.3% 3.9%
81+ 1.1% 0.7% Other Behavioral Health 12.6% 14.2%
Similarly, as noted in the study overview in the previous section, while the numbers of PCPCH and non-PCPCH individuals included in this study are nearly equal, the PCPCH patients were served within 510 clinic billing units, compared to 8,435 billing units for the non-PCPCH patients. This reflects the fact that most individual practitioners providing some primary care (i.e., not identified as aligned with a larger clinic or system) tend to not be PCPCH certified, and that many of the large heath care systems (e.g., Kaiser, Providence) have sought PCPCH certification for their multiple primary care clinics. These factors have been either adjusted for directly in the analyses, or determined through sensitivity testing not to

6
have a material impact on the study results. They do, however, suggest that as the program continues to expand, the characteristics of providers and patients is very likely to change, which may influence future dynamics of how the program may be managed and/or the overall impact of the program on the treatment system.
Average PCPCH Program Effects Figure 1 below provides a graphic summary of the average effects of the PCPCH program on service expenditures and use over the first three years of operation. The graphical results are based on the percentage rate of change in each outcome measure to allow comparability across the different service types. Each of the three columns within a service type (blue, red, green) represent the change in quarterly expenditures per person, expenditures per user, and rate of service use, respectively.
Overall, the PCPCH program was found to have reduced total service expenditures per person by 4.2% or approximately $41 per person per quarter (~$13.50/month). The overall expenditure reductions occurred despite a slight increase in the rate of overall service use of approximately 1%. Thus, total expenditures per service user actually declined slightly more by 4.8%, or approximately $61 per person per quarter (~$20.50/month). Across the specific service types there were increases in primary care and pharmacy, and reductions in all other service types including specialty care, emergency department and inpatient care. Of these changes in per person expenditures, only total, specialty care and inpatient were statistically significant, although at least one of the three service outcome measures is statistically significant in each service category. Along with the overall reduction in service expenditures, the general pattern of treatment change appears to be positively aligned with expectations for the PCPCH program. Use of primary care increases while expenditures for services that it would be expected to substitute for – specialty care, emergency department, inpatient care – generally decrease. Notably the declines in emergency department and inpatient care per person are largely due to reductions in expenditures per user, while rates of use either stayed the same (inpatient) or increased (emergency department). This could be consistent with a focus on “higher users” of those services. The increases in pharmacy use and expenditure may signal complementarity with increased primary care. That is, patients with more primary care engagement may be more likely to fill and complete their prescriptions. Other service areas have mixed effects. Laboratory and diagnostic radiology show little change in expenditures per person but both appear to show slight increases in rates of use coupled with decreased expenditures per user. Specialty mental health care has notably large proportional opposite swings in rate of use (down) and expenditure per user (up) resulting in a modest decrease in expenditure per person. This potential reduction in specialty mental health care could be seen as a “negative” result unless it reflects positive substitution of primary care for persons with less serious mental health conditions. If PCPCHs are more likely to treat (and bill) persons with less serious mental health conditions, it is possible that rates of specialty mental health use would decline while the per user expenditures, reflecting more seriously ill patients, would then appear higher.

7
-4.2%
3.1%
-3.6%
-13.3%
0.0%
-1.0%
5.1%
-5.3%
-15.9%
-4.8%
-1.6% -1.5%
7.2%
-3.2%-2.8%
3.7%
-8.6%
-4.7%
1.0%
4.3%
-2.9%
-13.7%
0.9%
3.2%
1.6%
5.0%
-1.9%
-20.0%
-15.0%
-10.0%
-5.0%
0.0%
5.0%
10.0%
Total Primary Care Speciality Care Mental Health Radiology Lab Pharmacy EmergencyDepartment
Inpatient
Figure 1: Overall Change in Expenditures per Person, Expenditures per User, and Likelihood of Service Use
$/Person
$/User
% Use

8
-4.2%*
3.1%
-3.6%*
-13.3%
0.0%-1.0%
5.1%*
-5.3%
-15.9%*
-3.5%
2.7%
-0.8%
-10.6%
-0.3%
0.7%
4.3%
-2.5%
-14.1%*
-5.0%*
3.4%
-8.7%*
-15.3%
-0.8%-3.6%
5.9%*
-9.0%*
-17.8%*
-8.6%*
6.0%*
-11.1%*
-32.7%
7.5%
-9.2%
12.2%*
-19.2%*
-26.4%*
-35.0%
-30.0%
-25.0%
-20.0%
-15.0%
-10.0%
-5.0%
0.0%
5.0%
10.0%
15.0%
Total Primary Care Speciality CareMental Health Radiology Lab Pharmacy EmergencyDepartment
Inpatient
Figure 2: Changes in Expenditures per Person Overall and by Year of PCPCH Designation
(* = statistically significant at p < .05)
Overall
Year 1
Year 2
Year 3

9
-4.8%*
-1.6%-1.5%
7.2%
-3.2%* -2.8%
3.7%
-8.6%*
-4.7%-4.1%*
-1.2%
-1.6%
4.4%
-2.9% -2.4%
3.0%
-6.7%*
-3.0%
-5.5%*
-2.3%-1.2%
15.2%
-4.1%*-3.5%
4.8%
-12.9%*
-10.7%*-10.0%*
-2.5% -2.8%
16.0%
-1.8%
-5.1%
8.6%
-17.9%*
-20.6%*
-25.0%
-20.0%
-15.0%
-10.0%
-5.0%
0.0%
5.0%
10.0%
15.0%
20.0%
Total Primary Care Speciality CareMental Health Radiology Lab Pharmacy EmergencyDepartment
Inpatient
Figure 3: Change in Expenditures per User Overall and by Year of PCPCH Designation
(* = statistically significant at p < .05)
Overall
Year 1
Year 2
Year 3

10
1.0%*
4.3%*
-2.9%
-13.7%*
0.9%
3.2%*1.6%
5.0%*
-1.9%
0.9%*
3.3%*
1.2%
-7.0%*
1.1%
3.0%*
1.0%
4.8%*
-2.9%
1.0%*
5.8%*
-10.5%*
-23.3%*
-0.2%
3.2%* 2.3%*
5.4%
-0.6%
2.1%*
8.3%*
-12.2%*
-36.2%*
3.6%*
6.0%* 5.7%*4.9%
4.1%
-40.0%
-35.0%
-30.0%
-25.0%
-20.0%
-15.0%
-10.0%
-5.0%
0.0%
5.0%
10.0%
15.0%
Total Primary Care Speciality CareMental Health Radiology Lab Pharmacy EmergencyDepartment
Inpatient
Figure 4: Change in Rates of Service Use Overall and by Year of PCPCH Designation
(* = statistically significant at p < .05)
Overall
Year 1
Year 2
Year 3

11
PCPCH Program Effects by Year since PCPCH Designation Figures 2, 3 and 4 above provide a comparison of the average effects of the PCPCH program over three years, with the effects broken down for PCPCH clinics by year since designation. These figures illustrate trends in expenditure per person, expenditure per user and rates of use respectively. Of note here is that the effects found for PCPCH clinics in their third year are often double or triple those found on average over three years or in their first year of designation. Thus, it appears that PCPCH clinics “mature” over time as clinics improve their relative competency in providing patient centered primary care. For example, PCPCH clinics in their third year of PCPCH designation had total expenditure reductions that were more than double the three-year average at 8.6%, or approximately $85 per person per quarter (~$28.00/month). Similarly, reductions in expenditure per user (10%, or approximately $128 per user per quarter (~$43.00/month)) and increases in rates of overall service use (>2%) also more than doubled. Expenditures per person increases in primary care and pharmacy, and decreases in specialty care, emergency department and inpatient, were all found to double or triple among third year PCPCHs compared to the three-year average. This pattern appears generally consistent across the measures of expenditure per user and rates of use as well.
Summary of Aim 2 Analyses and Findings The analysis of the PCPCH program’s impact on service expenditures and use over its first three years strongly suggests that it has been successful in its goal of transforming primary care in Oregon consistent with the Triple Aim. While this analysis is more in line with the “reducing cost of care” arm of the Triple Aim, the changes in patterns of service use and expenditure are consistent with improvements in population health as well as the individual experience of care. Total expenditures per person were reduced while increasing rates of service use on the whole. Investments in enhanced “upstream” primary care services resulted in reductions in expensive “downstream” specialty care, emergency department, and inpatient care consistent with the expectations for the program. These results suggest that for every $1 increase in primary care expenditures resulting from the PCPCH program, there was $13 in savings on average, ranging from $12.50 for first year PCPCHs to $14 for clinics in their third year of recognition. Given that there were approximately 1 million primary care users per quarter in Oregon from 2012-2014, if roughly half received care from PCPCHs (consistent with the study findings), an estimate of the annual PCPCH program savings through its first three years based on the study results would be approximately $80M per year on average and could increase to $160M as the same set of PCPCH providers matured in the program. Applying these same estimates to the entire primary care population in Oregon would double these estimates to $160M and $320M per year. The progression of effects as the PCPCH clinics’ duration in the program increases has important implications for the measurement and future expectations of the PCPCH program outcomes, but also in regard to its design and management. First, it is clear that what is seen in terms of PCPCH program effects is determined in part by how it is viewed. If this had been an evaluation of only the first year of the program, one would likely find somewhat positive service patterns with few definitive effects. This is consistent with the initial PCPCH evaluation (PSU Evaluation of PCPCH Implementation, Phase I, 2012) that covered only PCPCH clinics designated in the first quarter of the program over their first year of designation. More importantly, the effects seen on average or in a particular year likely understate the potential future impact of the program. As more PCPCH clinics mature in the program, its positive effects may dramatically increase. As the program continues to expand in the near future, its apparent impact will be dictated by the ratio of mature to new PCPCHs. This may create temporary “stalls” in measured impact if there is a large influx of new clinics and positive “bumps” if not.

12
From a program design and management standpoint, the progressive results found in this study suggest that the concept of setting a more “moderate” bar for initial designation to bring clinics into the “PCPCH fold”, with the expectation that they could then progressively increase their competencies in patient centered primary care, is both feasible and functional. This puts a premium on the program management functions that support the measurement of PCPCH standard attainment and the structures, such as the Patient Centered Primary Care Institute (PCPCI), that supports the maturation and development of expertise and competence of PCPCH clinics. Last, the results suggest that paying close attention to the experience of the most “mature” PCPCHs in terms of attainment of PCPCH attributes should provide very useful information for understanding the future direction and success of the program. The experience of “exemplary” PCPCH clinics provided in this report, both in terms of how they became exemplary and what issues they still struggle with, helps provide future direction for PCPCH program emphasis, and what it needs to do or continue doing).
Qualitative Findings from Exemplary Clinics: Aim 1 Interviews were conducted at 20 identified “exemplary” clinics with the dual goals of understanding clinics’ experiences of the process of implementing the PCPCH model of care, and identifying lessons learned and promising practices for replication. Through these interviews, a number of overarching themes were identified that are applicable across the six PCPCH attributes (see Appendix 3 for more detail). These overarching findings are organized using the four levels defined in Donald M. Berwick’s4 framework for the redesign of the U.S. health care system, which serve as the foundation for the Triple Aim (and for Oregon’s health systems transformation): (1) the environment of laws, rules, payment, accreditation, and professional training that shapes organizational action; (2) the organizations that house and support microsystems; (3) the small operating units or “microsystems” that actually provide care to the patient; and, (4) the patient experience. Table 2 summarizes this study’s cross-cutting themes as organized by Berwick’s larger categories. Table 3: Organization of Cross-Cutting Themes by Berwick’s Framework for Health System Redesign
The health systems environment 1. Clinics’ understanding of PCPCH 2. Medicaid expansion 3. Payment model and financial incentives 4. Workforce and retention issues
Organizations and clinics 1. Leadership 2. Adopting a culture of continuous improvement 3. Technology 4. Physical space and capacity constraints
Microsystems 1. Scheduling 2. Teams and team members 3. Standardization of workflow and protocols 4. Care coordinators and other new roles
The patient experience 1. Patients’ understanding of PCPCH 2. Shared decision-making 3. Patient role on the team and in quality improvement efforts
4 Berwick, D.M. (2002). A user’s manual for the IOM’s ‘Quality Chasm’ report.” Health Affairs, 20(3), 80-90.

13
Health Systems Environment Themes Since the passage of the Affordable Care Act, many initiatives aiming to transform the health care system have been launched, including Oregon’s PCPCH program and Coordinated Care Organizations (CCOs), the multi-state Comprehensive Primary Care Initiative, and multiple learning collaboratives. At the same time clinic patterns are changing with the accelerated adoption of electronic health records (EHRs). Four themes were derived from this study that relate to changes within the larger health systems environment in which clinics are implementing the PCPCH model. While these themes are not specific to the PCPCH program, they substantially influenced clinics’ experiences of implementation. The first theme relates to PCPCH and the primary care context. For many clinics, the changes occurring under PCPCH implementation and the impact of these changes were difficult to separate from the influence of other transformation initiatives. Some of the difficulty of isolating the experience of PCPCH implementation stems from the fact that clinics implemented some changes prior to PCPCH recognition in preparation for attestation; other changes stem from similar or overlapping criteria across PCPCH and other initiatives. Rather than creating redundancy, these alignments across improvement initiatives helped clinics prioritize among an “overwhelming” array of recommendations and mandates. Furthermore, participants noted that while concepts such as team-based care or care coordination are articulated within the PCPCH model, there was often confusion about what these concepts should look like in practice. While the willingness to embrace change in the face of significant ambiguity is a hallmark of exemplary PCPCH clinics, there is also evidence that some confusion remains regarding what some of the six PCPCH attributes mean. Similarly, as these clinics have integrated PCPCH concepts and standards, they have perceived tensions between some standards and mandated performance metrics. For example, there is a perceived tension between providing care that will meet performance metrics and providing care that is always responsive to patient goals and needs. How these tensions manifest in PCPCH scores is further explored in the discussion below about Aim 3. This challenge was mentioned particularly within the context of providing culturally sensitive care, where clinics serving large minority and/or immigrant populations note that some concepts like shared decision-making do not always translate as intended across cultures and patient populations. The second theme is the context of the Medicaid expansion in Oregon, as this co-occurred with PCPCH implementation for many of these clinics. Clinic leaders reported that their new patient populations are presenting with much more complex needs for both medical and non-medical services, which strains a system of care delivery that is already struggling to adapt to new processes and requirements. As these PCPCH clinics have expanded to meet growing demand, they have also invested significant time and resources helping newly-insured patients understand and navigate the system as intended. The third system-level theme is the impact of the payment model and financial incentives. Clinic leaders expressed that the traditional fee-for-service payment model does not incentivize or reimburse for many of the care processes that must be incorporated to successfully adopt the PCPCH model. Increased emphasis on communication with patients, coordination of care among multiple specialists and social service providers, and screenings and preventive measures do not necessarily correspond with an increase in available time or reimbursement. Administrators shared that current financial incentives may still not be adequate to build support among providers for moving up the PCPCH tiers, particularly given that even when patients recognize the PCPCH designation, they do not fully understand the tier structure or perceive the value of the PCPCH designation. Grant funding and financial incentives have been critical support for these clinics, providing some flexibility to make changes without fear of immediate loss of revenue, and time to experiment with new PCPCH concepts before making a long-term commitment to changing clinic workflows.

14
As the model of care changes, new skills and paradigms of care must be taught and learned, in order to be adopted successfully. Thus a fourth system-level theme is workforce and retention issues. PCPCH clinics are challenged by many of the same workforce shortages and waves of provider retirement that are affecting primary care clinics in general. Integration of allied health professionals has proven to be a particularly complicated undertaking for small independent clinics and rural clinics. Without the economies of scale of larger health systems, these clinics face challenges recruiting staff to fill part-time positions. Issues such as provider shortages, new demands for use of technology in the clinical setting, change fatigue, delegating responsibilities, and patient relationships all affect clinics’ ability to implement various aspects of the PCPCH model. These examples reflect a perceived disconnect between how the primary care workforce is trained and what is currently needed in practice. New skills and models of care include effective communication, conflict management, and working in teams. At the same time, some clinic leaders felt that while transitions in staffing due to burnout are very difficult, they allowed clinics to recruit and hire staff and providers who are more enthusiastic to work in a primary care home environment. PCPCH recognition is viewed as a strong signal to both potential and existing employees and providers about a clinic’s values and its vision for the future.
Themes about Organizations and Clinics Following Berwick’s model, the next level of analysis is the organization. Four themes were derived here. The first is leadership. A specific champion or key individual was often instrumental in pioneering the PCPCH transition. These individuals embraced the concept of a primary care home, articulated a vision for how the model could benefit the clinic, and worked hard to build support in the face of significant initial resistance. Providers and lead administrators frequently were the champions, although in some cases there were “grassroots” actions among staff to become a PCPCH. Exemplary clinics embraced shared leadership, encouraging participation at all levels of the organization, and allowing a significant reduction in organizational hierarchy as the PCPCH program has become embedded within the clinic.
The second organization-level theme is adoption of a culture of continuous improvement. The PCPCH model requires a shift in clinic culture regarding improvement practices and change management. Exemplary clinics have embraced a clinic-wide attitude that PCPCH stimulates an ongoing evolution of the clinic’s workflows and protocols. With this comes an increased tolerance for experimentation, if not acceptance and expectation of change, and a greater comfort with regular evaluation, use of data to inform decision-making, and dissemination of results. Individual and team-level training, organizational development, and sharing of knowledge are all key, as is participation in learning collaboratives. A large number of clinic leaders have participated in learning collaboratives or other multi-site initiatives, and credit both PCPCH and these learning collaboratives for their success in organizational transformation and shift in culture. The shift toward improvement strategies as routine practice has empowered individual team members and patients to identify additional opportunities for change, increased their resilience to adapt and encouraged team members to serve as trainers for one another.
Exemplary clinics are intentional in their efforts to make change processes transparent and understood by all staff within the clinic. They report structured and formalized change management processes that explicitly articulate goals, processes, and evaluation criteria. Planning efforts are managed intentionally by inter-professional groups of staff and providers to provide a holistic view of the likely impact of proposed changes from multiple perspectives. Feedback was solicited at the beginning and throughout implementation, and results were shared openly following both successes and failures. The inclusion of multiple perspectives and more participatory decision-making, through clinic-wide initiatives or patient advisory councils, was perceived as improving clinics’ collective decision-making abilities. A third organizational theme is the use of technology. The EHR was viewed as a critical tool for communication among team members and for capturing data for reporting. Two success factors

15
demonstrated repeatedly were having an EHR that is customizable, and having expertise—either within the clinic or via technical support—to make ongoing adjustments as clinic workflows shifted over time. Exemplary clinics made frequent modifications to their EHRs and were constantly looking for new ideas and new technology to improve workflows. Clinics achieved significant efficiencies in preventive services by using their EHR to automate appointment reminders to patients, and to extract relevant data to assist clinic staff to scrub charts in advance of appointments. Nonetheless, issues in EHR design and adaptability often raised challenges for issues such as tracking continuity of visits, data extraction for reporting on metrics, and customization, as well as lack of interoperability across EHR platforms between and among clinics and local health systems. This latter issue was a significant impediment to efficiency and a frustrating barrier to achieving some of the larger goals of health systems reform. The bottleneck of interoperability lead some exemplary clinics to consider strategies such as agreement on a single EHR platform across a network, selection of an EHR on the basis of its compatibility with other hospitals and specialist clinics, or agreements with local hospitals for remote database access. The fourth organizational theme is physical space and capacity constraints. Clinic leaders cited the importance of workspace design in facilitating the transition to team-based care. These clinics frequently co-locate teams within open workspaces where providers interact more informally with staff, taking providers out of private offices or provider-only rooms. This was noted as substantially improving the flow and frequency of communication among members of the care team. Co-location of team members also affected how a clinic approached staff meetings, and co-located teams were available to one another regularly and relied on more informal communication. Lack of physical space was a frequently cited concern for many clinics as they scaled up to serve larger patient populations, and there were challenges finding space for new additions to the care team such as behavioral health providers.
Themes about Microsystems of Care Delivery Transition to the PCPCH model has involved profound and often continuous change at the microsystem level -- “the small units of work that actually give the care the patient experiences … a small team of people, combined with their local information system, a client population, and a defined set of work processes.”5 The themes here illustrate these changes through the perspective of the organizational unit that directly shapes the patient’s experience of care.
The first microsystem level theme is scheduling. Exemplary clinics experimented with a number of new options for patients to schedule appointments. For patient-initiated appointments, clinics typically begin by attempting to schedule an appointment with the patient’s primary care provider (PCP). If that option is not available, clinics – facing pressure to see patients as quickly as possible – have leveraged teams, pairing physicians with mid-level providers on a single team, which then serves as the primary backup. Unless the reason for the visit is especially urgent, a team member will encourage the patient to wait to see their own physician or another provider in their team before scheduling with a provider outside the team, but interviewees noted that this model is often frustrating to patients. Exemplary clinic leaders also describe several ways they have proactively initiated appointment scheduling with patients, using their EHRs to generate lists of patients who need a specific service and then reaching out to schedule an appointment or utilizing their EHR’s patient portal to send automated reminders. Clinics have also taken a more hands-on role in assisting patients with scheduling referrals. Rather than tasking the patient with calling an outside provider to make an appointment, the care or referral coordinator contacts the provider to schedule the appointment, often before the patient leaves
5 Berwick, p. 84.

16
the clinic. This new process has established stronger relationships between the clinic and specialist offices, and clinics described having better awareness of the referral options in their community along with a better understanding of the challenges patients may have faced previously in scheduling referrals. The second theme at the microsystem level is that of teams and team members. Clinics have experimented with a variety of team structures that continue to evolve as new positions such as behavioral health specialists are integrated within the clinic. The options for team-based care vary with clinic size, and smaller clinics often treat the entire clinic as a single team. Clinic leaders described the transition to teams as being difficult, but with significant positive results. Communication plays a critical role in building a successful team. Several clinic leaders reported they now provide much more proactive care because all team members share an expanded sense of responsibility for outcomes and are more likely to speak up when they note something needing to be done. Providers expressed relief that they no longer feel solely responsible for the clinic’s outcomes, and acknowledged that working as a team allows the group to leverage strengths of individual team members and ask for assistance when it is needed. Team-based care was also perceived as improving staff morale and enhancing the collective problem-solving abilities of the clinic. Clinics have created dedicated positions for coordination of referrals, prescription refills, and complex care coordination, freeing up providers, medical assistants, and scribes to focus on direct care while these new staff tend to the many administrative steps that must occur for individual patents between visits. Each staff member may have a defined role, but many are cross-trained to provide coverage when other staff are out of the office or during busy times. This cross-training is noted as improving staff members’ awareness of the larger clinic system. Staff members are encouraged and expected to work to “the top of their license” which has particularly affected the role of the medical assistant. The third microsystem theme is standardization of workflows and protocols. Clinic leaders noted the importance of standardizing workflows and protocols to ensure consistent provision of care and thorough documentation, which included training staff in a standardized manner. Cross-training supports standardization, allowing care team members to cover for one another seamlessly when clinic hours expand or when a member of the care team is out on leave. It has also underscored a need for more thorough documentation of care, as members of the care team rely increasingly on the EHR to document work in progress or to pick up where another member of the team had left off. Standardization of protocols is also a powerful tool that allows clinics to automate frequently occurring steps in the care process. Clinic leaders reported that this automation is critical for maximizing the efficiency of providers’ time with patients. At the same time, the volume of new screenings clinics must collect, as well as the burden of documentation related to screenings, is widely cited as a point of frustration and burnout. Exemplary clinics were proactively experimenting with alternative options for collecting screenings in order to reduce the sense that screenings were becoming a barrier to providers’ ability to engage with patients and respond to their reasons for seeking care. The fourth and final microsystem theme is care coordination, which stands out as an integral component of exemplary PCPCH practice; many clinics referred to it as the “biggest” or “best” change to come out of PCPCH implementation. The terminology of care coordination varies widely across clinics and there is not a universal understanding of what this role constitutes; clinics have adopted foundational concepts such as a focus on managing transitions of care, but have also tailored roles, titles and scope of work to their individual settings. Clinics approach care coordination and case management similarly, and while these roles are professionally distinct, they appear to fall along a spectrum of related

17
activities and services, with the degree of complexity of the role sometimes dictated more by the staff available to the clinic than by a clearly defined scope of practice. While roles vary across clinics, care coordinators have come to be highly valued for the support they provide to patients and to members of the care team. Some clinics assigned care coordinators to each team, while other established a stand-alone team of care coordinators and nurse case managers that supported all teams. Coordinators may “step-in” for primary providers, who are not always available for patients with chronic conditions or complex care who need frequent support or communication with the clinic. They also served an important role for helping patients to understand appropriate points of access to the health care system, facilitating “soft hand-offs” from one phase of care to another, monitoring regular check-ins of high-risk patients, reconciling medications, and conducting follow-up calls to all patients discharged from a hospital stay. Care coordinators play an important role in developing relationships and lines of communication with other local clinics and organizations. Care coordinators often developed a depth of knowledge about social services and safety net resources in the community and were able to help patients secure transportation, food assistance, or other supports that were affecting their health outcomes.
Themes about the Patient Experience Patients’ experience of care is changing with the adoption of the PCPCH model. These changes highlight a shift in the understanding of patients’ rights and responsibilities that may be more apparent to clinic staff than to patients themselves. Many of these shifts raise considerations for implementing the PCPCH model of care in culturally sensitive ways. The first theme relates to patient engagement and communication with the care team. Patients who are comfortable with technology and have high levels of English literacy generally have enthusiastically engaged in the use of patient portals and email communication with the clinic, and therefore benefit from automated reminders, online scheduling options, and remote access to medical records. However, elderly patients and those for whom English is a second language struggle to take advantage of these new options. This has raised interesting considerations regarding equity as clinics explore integration of patient-facing technologies to streamline and speed up clinic processes. Patients with complex care needs respond well to having more frequent communications with the clinic. Patients with infrequent care needs and no relationship to a specific clinic were more likely to use the emergency department for routine care; patients with frequent contact did so rarely. Team-based care provides more potential points of contact for a patient, and rather than complicating care, these options increase the likelihood that a patient will find a care team member (such as a mid-level provider or care coordinator) with whom they feel comfortable communicating about sensitive social, family, or financial situations. Providers who spoke openly with patients about the clinic’s accountability metrics reported patients were more likely to follow through with their own care plans. Strengthened relationships between patients and team members have given clinics a more holistic view of patients’ lives, providing context for how they are engaging with the clinic and their care plans. This more complete understanding has helped clinics shift away from an emphasis on general patient compliance to understanding specific reasons why patients are sometimes unable or unwilling to follow through with recommended care and instead develop alternative strategies to respond to these barriers. The second patient theme is shared decision-making. As clinics move from an emphasis on patient compliance to a shared plan of care, patients must be active participants in their care. Several clinics are using externally-developed shared decision-making tools. Shared decision-making was described as
18
requiring flexibility and compromises from both the patient and the provider, and a willingness of the care team to modify workflows or protocols when they do not work for a specific patient. Clinics have struggled to implement shared decision-making with patients whose culture holds different communication norms, and perceive that some patients are uncomfortable with providers stepping out of the role of authoritarian expert. As well, some clinic leaders have expressed frustration that metrics sometimes seem constructed around what is readily quantifiable, rather than what matters to individual patients’ long-term health and well-being. While PCPCH clinics have embraced a team model of care and shared decision-making, patients may very well still view their relationship with the clinic and the care team as one that is hierarchical and perhaps even paternalistic. The third patient-related theme focuses on the patient role on the team and in quality improvement efforts. Many exemplary clinics have taken steps to actively engage patients in clinic improvement efforts, with mixed success. Clinics were positive about the value of patient feedback, but note significant challenges in acquiring it. In particular, smaller clinics noted that patient surveys may be cost prohibitive and their smaller volume of patient visits mean it can take too long to collect representative data. There are concerns that, in a period of rapid clinic transformation, it is difficult to contextualize patient feedback that may have been collected before or after a change was made in the clinic. Survey results seem to be most meaningful when shared quickly after collection, when staff are able to relate feedback to recent activities. Several clinics have experimented with establishing patient advisory groups. These groups are sometimes convened as one-time focus groups, and other times as standing Patient and Family Advisory Committees (PFACs) that meet periodically. Clinics described significant challenges both in gaining provider support for PFACs and recruiting patients who are willing and able to participate. Clinics with standing PFACs initially solicited general feedback on ideas for improving the patient experience at the clinic, but some transitioned to engaging their committees to provide input on proposed changes and workflows that the clinic sought to implement. Multiple clinics noted receiving patient feedback, either directly or through their PFAC, that patients seem tired of responding to multiple quality surveys, dampening enthusiasm for future CAHPS or other survey efforts. In addition, the recruitment of patients to participate in improvement activities has been an ongoing challenge; certain subpopulations, such as native English speakers or retired patients, tend to be heavily represented on PFACs because they have time to participate and are more easily reached through engagement strategies.
Summary of Aim 1 Analyses and Findings As demonstrated through this thematic discussion, implementation of the PCPCH program – and what can help or hinder clinics in the process – is best considered and understood at multiple levels. Across the four overarching themes, it appears that clinic progress in PCPCH is hindered by the following:
A workforce unprepared for large-scale change;
Payment models and other financial arrangements that do not incentivize clinics to operate in a manner concordant with the values and aims of the PCPCH program;
For some clinics, a rapid and large-scale increase in patient populations presenting with complex issues;
A lack of adequate space and understanding of essential technologies; and,
A patient population that may not understand or have been adequately educated on their role(s) in team-based care.
At the same time, the following practices and understandings seem to help clinics not only implement the PCPCH program successfully but also embrace it as the “right” way to provide care:

19
A collective understanding of where their clinic “fits” in the larger efforts to reform the health system and better the health of both patients and the population as a whole;
Leadership (at any level of the clinic) that embraces the values and aims of the PCPCH program and excites others in the clinic to do the same;
An ability to harness the power of teams to facilitate patient care;
Standardization of policies and practices;
Integration of the role of care coordinator; and,
An organizational culture that embraces a willingness to experiment, adapt, and learn.
Assessment of PCPCH Attributes: Aim 3 This section explores clinics’ experiences implementing the six PCPCH attributes. Drawing from the interviews with the 20 exemplary clinics and factor analysis of attribute scores, the discussion below summarizes clinics’ perceptions of the barriers and facilitators to implementation as well as their perceived outcomes. The impact assessment of APAC claims data employed in Aim 1 is also extended to explore how being a top scoring PCPCH clinic, as well as top scores on each of the six attributes, affects cost and utilization measures. A detailed analysis of clinic performance on attribute scores and explanation of analytic methods is provided in Appendix 2. Qualitative interviews with exemplary PCPCH clinics revealed perceptions that some attributes are complementary when implemented simultaneously, while others create tension or conflicting priorities for clinics. Clinics also perceived varying degrees of difficulty in implementing the six attributes which, combined with the variation in points available across attributes, may influence how clinics prioritize action on selected aspects of the PCPCH model. Factor analysis revealed that all of the six attribute scores move together in the same direction, but to varying degrees. In other words, as clinics’ scores increase in any one PCPCH attribute, they tend to also increase across the other attributes. In no case are there inverse relationships among attribute scores. In particular, the Accountability (Attribute #2), Comprehensive Whole Person Care (#3), Coordination & Integration (#5) and Person- and Family-Centered Care (#6) attributes appear to operate together in ways that support strong scores across all four categories; scores in these categories are strongly aligned. To the extent that exemplary PCPCH clinics’ performance is defined by high total scores and points, this success is characterized primarily by exceptional scores in the four attributes listed above and less so by scores in Continuity (#4), which is less consistent even among top scoring clinics, and Access to Care (#1), which seems fairly easily attained by most clinics. While PCPCH clinics’ total point scores on the Continuity attribute are not poor overall and Continuity scores tend to rise as other attribute scores rise, average scores mask a divergence: clinics are more often falling into one of two groups, scoring well on Continuity and Access to Care, or on the other four attributes. Fewer than half of top scoring PCPCH clinics also scored high on the Continuity attribute. In fact, as clinics attain high scores in the four attributes listed above, they may reach an upper limit in their ability to implement the Continuity attribute. Lack of movement in the Access to Care attribute as other attribute scores rise may simply be due to the fact that scores in this attribute were generally high among all PCPCHs, with relatively smaller variation across all clinics. Clinics may be attaining this attribute early in the recognition process with less

20
opportunity for advancement later on. Interviews indicated that several clinics perceived this attribute to be relatively simple to achieve by comparison. By combining program data on clinics’ scores with the APAC claims data used in Aim 1, the effect of having a high total score and high score on the 18 core standards was also assessed, as well as the effect of high attribute scores, to better understand clinics’ patterns of service utilization and expenditures. In some cases, there is a trend toward higher use of services but at lower cost, which taken together appear as little or no change in a clinic’s total per-person costs despite representing significant underlying changes.
Table 4: Differences in Trends between High Scoring and Other PCPCHs
Acc
ess
Acc
ou
nta
bili
ty
Co
mp
reh
ensi
ve
Co
nti
nu
ity
Co
ord
inat
ion
Pe
rso
n-C
ente
red
18
Co
re S
tan
dar
ds
Tota
l Sco
re
Primary Care Procedures Cost per person
Cost per user
Utilization
+ + +
-- --
-- --
--
+ +
+ + +
+ + +
Primary Care Visits Cost per person
Cost per user
Utilization
+ + --
+
+
-- --
--
--
-- --
+ +
+* + +
+* + +
Specialty Care Cost per person
Cost per user
Utilization
+*
+
+ +
+ + --
--
+* +* +*
-- -- +
-- --
Mental Health Care Cost per person
Cost per user
Utilization
-- -- --
-- -- --*
+ +* +
+ +* --
+ + --
-- -- +
+ + +
+ +
Radiology Services Cost per person
Cost per user
Utilization
+ +
--
-- -- +
-- --
-- --
+ +
-- --
-- --
Laboratory Services Cost per person
Cost per user
Utilization
-- --
+ + +
--* --
-- --
+ +
+* + +*
-- -- --
-- -- --
Emergency Department Cost per person
Cost per user
Utilization
+ + +
+ + +*
-- --* +
+ + +
+* --*
+ +
+ --* +
+ -- +
Inpatient Care Cost per person
Cost per user
Utilization
-- -- +
-- -- --*
-- -- +
-- +* --
-- --* --
+ + +
+ --* +
+ -- +
Pharmacy Cost per person
Cost per user
Utilization
-- -- --
+ + --
+* + --
+ + --
+ + +*
+ +
-- --*
-- + --
Total Services Cost per person
Cost per user
+
+ +
+ +
-- --
+ +
+ --

21
Table 4 above indicates how trends for high scoring PCPCHs differed from trends for all other PCPCHs in rates of service utilization, cost per user of services and cost per person across the clinic. This table should be interpreted as follows: “+” indicates the trend for high scoring clinics was higher than the trend for other clinics; the “—“ indicates the trend for high scoring clinics was lower than the trend for other clinics; and, trends measured as less than 1% change were left blank. Asterisks represent trends that were statistically significant at the 5% level. It should be noted that these are relative differences between the trends of the two groups of clinics over time, not differences in performance from non-PCPCH clinics. A more detailed explanation of how the PCPCH program as a whole has affected cost and utilization measures relative to non-PCPCH clinics may be found in Appendix 1. While high total score and high score on the 18 core standards are strongly correlated, differences for clinics scoring higher on the 18 core standards were generally larger and more distinct statistically than for overall total score. This suggests that the 18 core standards capture differences in higher performing clinics better than total score. Overall, clinics with high scores on the 18 core standards did not demonstrate differences in total service utilization or expenditures compared with lower scoring PCPCH clinics, but they did demonstrate differences in patterns of use that suggest a shift away from diagnostic services and pharmacy claims and toward primary care visits and mental health care. This may reflect themes from interviews indicating clinics are investing in care that involves more routine and ongoing in-person contact with patients. Some increases in utilization, such as those seen in emergency department and inpatient care, were accompanied by statistically significant reductions in the cost per user of these services. The following discussion summarizes findings by each attribute, integrating observations from both the qualitative and quantitative analyses.
Attribute 1: Access to Care “Health care team, be there when we need you.” Quantitative analysis revealed that PCPCH clinics are scoring relatively well on this attribute. The top quartile of PCPCHs (i.e., high scorers) achieved on average 80% of the possible points in this category, while other PCPCHs earned 64%. Because of this narrow range, scores on this attribute are not as highly correlated with overall PCPCH scores. Clinics that are high scorers for the PCPCH program overall are only slightly more likely (52%) to be high scorers on this attribute than other clinics (48%). This may partly explain why no significant differences were observed in the overall service utilization or expenditure patterns of clinics with high and low scores in the Access to Care attribute. While some clinic leaders perceive Access to Care to be the easiest attribute to meet, clinics that saw a large increase in their Medicaid patient population struggled to meet the demand as well as educate patients about the patient-centered primary care home model of care. Clinics rose to the challenge, however, by embracing team-based care so that they were able to stagger coverage to meet extended hours and days of operation, provide same-day appointments, be “on-call” 24 hours a day, and maintain continuity of care. The key here seems to be clinics’ willingness to experiment with various scenarios to meet the needs and expectations of their particular patient populations. Clinics experienced some resistance from clinic staff or providers by extending hours and increasing expectations for work contributed, but, as the previous section of the report demonstrated, workforce training and, in some cases, staff turnover, ultimately have allowed clinics to employ an engaged workforce that understands the importance of patient access to care.
Utilization -- +* *=p < 0.05

22
This understanding of the importance of access for patients also translates to clinic leaders’ ongoing strategizing to reduce patients’ utilization of emergency departments. Exemplary clinics have implemented both proactive and reactive steps to shift how patients seek care. Educational materials are shared widely, and EHRs are used to help automate reminder calls and automated letters for appointments. Others have used care coordinators to help facilitate transportation to and from appointments. All of these strategies are helping exemplary clinics to put in place measures to increase access to care, and also to ensure that patients take advantage of clinic access.
Attribute 2: Accountability “Take responsibility for making sure we receive the best possible health care.”
“It keeps us accountable” was a common response when interviewees were asked whether the PCPCH program has helped their clinic. While there is variation in how clinics perceive the mechanics of the PCPCH program to have helped them, they agreed that having clear standards and being evaluated against them is a useful exercise and is generally needed in the field. In order to meet the standards of the Accountability attribute, clinics have incorporated collection, reporting, and utilization of data to improve care at both the individual patient and clinic population levels. The number of metrics used varies between clinics; some track many while others track only those metrics deemed most meaningful for their clinic. Most clinics have been challenged by both the large volume of documentation as well as the use of EHRs, which require modification in order to capture data and generate necessary reports that can exceed staff capacity. However, the documentation and reports have offered positive outcomes of improved tracking of referrals and better tracking of transitions of care, and have forced conversations about information exchange between clinics.
There is much wider variation in scores among PCPCHs on this attribute. The top quartile of clinics achieved 70% of available points, while remaining clinics have attained only 33%. In relative terms, this attribute is where high scoring clinics are distinct from other PCPCHs by the widest margins (82% of high scorers in this category were also high scorers overall). In absolute terms, however, this category is where both high scoring and other clinics are attaining the fewest available points among all the attributes, suggesting that even high scoring clinics are struggling with implementation of this attribute’s standards related to Accountability. Clinics with high scores on the Accountability attribute showed a downward trend in total use of services compared with lower-scoring PCPCHs. This lower level of service provision was accompanied by an increase in the average cost per user of services, and an increase in the total cost of care per person across the clinic. Patterns of use within service types also reveal some unexpected differences. High scoring clinics in this category demonstrated a statistically significant 48% drop in use of specialty mental health services as well as a downward trend in spending on specialty mental health care, relative to other PCPCH clinics. This trend was accompanied by higher trends in use and cost of emergency department services than was seen in other PCPCHs. To the extent that these differences are undesirable, they may reflect two themes that emerged from the interviews: (1) that clinics perceive the volume of new documentation to be a barrier to provision of high quality care; and, (2) that performance metrics may encourage or mandate care that is not aligned with patients’ goals or needs.
Some clinics have experienced resistance from providers who feel that the new emphasis on accountability implies that they had not previously provided good care or that accountability standards are an intrusion. Conversely, some providers shared that their attitudes changed over time, and the emphasis on performance metrics ultimately kept people from just assuming that good intentions meant good outcomes. Exemplary clinics use comparative metrics among providers and teams to initiate

23
conversations about how different workflows might be affecting measurable patient outcomes. Clinic leaders shared that friendly competition and the celebration of successes encourage improvement.
Clinic leaders emphasized that their successes begin with clearly articulated goals. A significant amount of time is invested in working towards these goals, with some clinics stepping away from revenue-generating care processes to close for all or part of the day to engage in structured improvement work (using PDSA cycles). Some clinics utilized committees for improvement initiatives while others created separate committees for specific improvement issues. Clinic changes are iterative, often not leading directly to the intended outcome, with modification and repeated testing of new changes several times before the goal is achieved.
Attribute 3: Comprehensive Whole Person Care “Provide or help us get the health care, information, and services we need.” Scores on this attribute are mixed, with high scoring clinics attaining 87% of available points while others earn 57%. Compared with other attributes, this attribute is moderately linked to total high score, with 76% of high scoring clinics in this category also achieving high PCPCH scores overall. High scorers on this attribute demonstrated a statistically significant 14.34% decrease in per user cost of emergency department services and a reduction in per person costs relative to other clinics, despite emergency department utilization trending upward. While the increase in emergency department utilization is unexpected, the decrease in cost suggests that these clinics are more proactively managing complex conditions outside of emergency department settings. This attribute may also be driving the overall increase in mental health expenditures for high scoring PCPCH clinics. While utilization of mental health services trended upward slightly in clinics with high scores for this attribute, cost per user and average cost per person trended upward much more dramatically with a 27.62% increase relative to other clinics, though this difference was only approaching statistical significance. Expenditures toward pharmacy services were also statistically significantly higher than other clinics, which may be attributable to more proactive management of chronic conditions. Clinics expressed the most enthusiasm about working towards this attribute and many stated that it exemplifies what primary care should be. This attribute has driven a dramatic shift in how providers and staff view themselves within a larger system for which they share accountability. For some clinics, the reality of meeting this attribute has pushed them to expand their definition of primary care, particularly with regard to integration of mental health care and social services. At the same time, this attribute has created significant pressures on clinics to introduce many more screenings and discussions of health promotion and disease prevention in a shift toward more preventive services. Clinics have taken major steps to standardize the pre-visit process by having medical assistants take on additional non-clinical responsibilities. These tasks, which include scrubbing charts and contacting patients to establish goals for their visits, have been overwhelming for some clinics. Many interviewees stated that medical assistants frequently come in on days off or work unpaid hours in order to catch up on their other duties. Care coordination has become critical for preserving provider and medical assistant time for patient care. Standardization is also key in order to accurately document the work they provide between visits and accelerate transitions in care. Partnerships with specialists and community resources are critical. Some interviewees stated that their clinics established formal agreements to facilitate referrals with nursing homes and specialists. They also stay current with community resources through frequent phone calls to social service organizations or by joining relevant email lists. Some clinics shared that care

24
plans have been particularly meaningful, targeting very sick patients whose care in the earlier days of their disease may have missed important steps such as explaining basic elements of the disease process. Filling these gaps in patient understanding helps them better manage their diseases and saves unnecessary costs. Some frustration was noted, however, that the mandate to create care plans for high risk patients does not always target patients who will benefit from the process. Some interviewees stated their clinics establish care plans for patients on a case-by-case basis rather than following the standard protocol.
All clinics recognized the importance of mental and behavioral health services within primary care; however, clinic leaders noted that they are a “Pandora’s box,” with providers reluctant to open it unless they have the tools to respond to what they find. Knowing that specialists are available, either within the clinic or through reliable referrals, makes providers much more comfortable conducting mental health screenings and engaging patients in difficult conversations. As a recognized PCPCH clinic, several clinics began integrating behavioral and mental health services onsite in the clinic. Behavioral health providers are on-call within the clinic and are brought into patient visits for “warm hand-offs,” providing seamless care both in planned and unanticipated conversations with patients. They also help patients with mental health challenges to manage their care plans, navigate the care system, and help coordinate non-mental health referrals. When more extensive mental health care is needed, behavioral health providers facilitate referrals to outside mental health specialists. In some cases, clinics cannot afford to keep behavioral health providers on staff. Clinics noted that challenges remain in billing for behavioral health services that prevent these positions from becoming self-sustaining. Exemplary clinics that cannot integrate behavioral health within their clinics make a point to reach out to mental health providers in their community and establish formal relationships to facilitate referrals.
Attribute 4: Continuity “Be our partner over time in caring for us.” Scores on this attribute are strong across most PCPCH clinics, and this attribute demonstrates the smallest range in scores between high scorers and all other clinics. High scoring clinics achieved 87% of available points while other clinics achieved 67%, on average. However, as seen with the Access attribute, there is weak correlation between being a high performer on Continuity and being a high performer overall. In fact, less than half (44%) of the clinics that achieved top status in this category were high scorers for total PCPCH points. High scoring clinics on Continuity showed flat or slight downward trends in utilization relative to other PCPCH clinics across all service categories with the exception of emergency department utilization, though none of these differences were statistically significant. Per user cost of services trended down for primary care and were flat across other categories with two notable exceptions. There was a statistically significant 12.40% higher cost per user of inpatient services. Coupled with lower rates of inpatient utilization, this still resulted in lower per person average inpatient expenditures and may reflect a shift toward more proactive outpatient care for all but the sickest patients. While utilization of mental health services trended down slightly, per user cost of services increased by 29.3%, resulting in a large difference in per person mental health costs in clinics with high scores for Continuity. Given that mental health claims captured here reflect specialty mental health services provided outside of routine care settings, this increase in utilization may reflect a shift toward more informal behavioral health services provided in the primary care setting, as well as a shift toward specialty mental health care for fewer but higher need patients.

25
Clinics approached the Continuity attribute from many directions, but it is most often discussed within the context of team-based care and managing transitions of care. Continuity of care between providers and patients is valued by both, but interviewees describe patients’ preferences for continuous care extending beyond primary providers to other members of the care team. Patients will ask for preferred receptionists, medical assistants, and care coordinators. Continuity in care coordination proves to be especially important to patients with complex needs. In some cases, because the care coordinator interacts more frequently with these patients than their provider, preserving continuity in this relationship has become more important.
Continuity is often tracked within panels. Patient panels are most often described as being organized by risk stratification or diagnosis, but some clinics prioritize assignment of families to a single provider panel or intentionally weight panels with equal numbers of high-risk patients to spread workloads more evenly across providers. Increasing panel size is common due to increasing numbers of Medicaid patients but team-based care makes it possible for clinics to meet the needs of these larger patient panels. Multiple interviewees expressed frustration that experimenting with team structures to find the right approach has undermined the clinic’s performance metrics for this attribute. Exemplary clinics have taken proactive steps to streamline and improve continuity of processes of care. Clinics describe that the PCPCH program’s emphasis on continuous, current information within a patient’s chart has shortened transitions of care and time between care steps in the clinic. Several interviewees described dedicating staff to managing and expediting fulfillment of prescriptions. In some cases, this person is a pharmacist who conducts medication reconciliations and supports providers in care planning. In other cases, reconciliation is managed by a care coordinator or dedicated “refills coordinator.”
Information exchange with other clinics and hospitals remains a challenge, and being able to communicate with these entities via an EHR greatly facilitates speed and continuity of care. Many interviewees reported that outside specialist offices and hospitals assume information has been transmitted or is externally accessible via an electronic system when it is not. Clinics have made more progress coordinating with hospitals than with specialists. Several clinics secured EHR access to their local hospital and can see if their patients have visited the emergency department or have been admitted; many of those who do not have electronic access have formal agreements where the hospitals inform the clinic if any of their patients are seen. Multiple clinic leaders noted that they have implemented tracking of information exchange, flagging specialists and providers who most often neglect to send patient records to contact them with a threat to discontinue referrals if information sharing does not improve. Several interviewees perceived that emergency department utilization decreased as clinics have been notified more often when their patients are seen in the emergency department. Most clinics have implemented standardized protocols for follow-up calls to patients after emergency department utilization or hospital discharge, and some clinics have gone further, scheduling follow-up visits with all patients to discuss discharge orders, adjust care plans, or simply review steps that could have prevented the hospital visit.
Attribute 5: Coordination and Integration “Help us navigate the health care system to get the care we need in a safe and timely way.” This attribute is an important contributor toward total PCPCH score, providing the most possible points and exceeding the point value of the smallest two attributes combined. High scoring clinics demonstrated excellence in this attribute, achieving on average 90% of available points (the highest attainment for this group across all six categories) while other clinics average 57%.

26
Clinics with the highest scores on Coordination and Integration demonstrated significantly different patterns in use and expenditures toward emergency department and inpatient services relative to other PCPCH clinics. There was a statistically significant 15.13% increase in the cost per user of emergency department services, but total emergency department use fell 18.18%, resulting in little overall difference in average per person emergency department costs. Use of inpatient care also fell, accompanied by a 14.91% reduction in per user inpatient cost. Together, these differences in trends suggest high scoring clinics on Coordination and Integration may be more effectively steering patients away from emergency department services for all but the most severe needs. Clinics with high scores on the Coordination and Integration attribute demonstrated a statistically significant 1.73% higher rate of total service utilization compared with other PCPCH clinics even after controlling for the effect of total high score. The upward trend in utilization of all services in the Coordination and Integration attribute is notable because it occurred along with a downward trend in cost per user of services and total per person costs. This affirms themes from the interviews in which clinics expressed positive impressions of the impact of care coordination. As clinics constructed patient panels and began to standardize workflows and protocols, opportunities emerged to adopt care and improvement strategies across populations rather than on a case-by-case basis. Exemplary clinics have shifted toward thinking of and talking about care strategies that will improve the health of groups of patients who share a diagnosis or demographic characteristic, and are more often articulating connections between the clinic’s workflows and population health measures.
With access to high-level data points about the clinic’s population of patients, clinic leaders can more strategically make decisions about which services to provide or which staffing is most needed rather than relying on outside advice. Many clinics were initially focused on challenges related to getting information into their EHR, but the interviews reveal they are now just as often grappling with how to extract data for reporting on quality metrics and population health markers. These difficulties are exacerbated by the fact that many clinics report being unable to afford dedicated staffing for data management and analysis, despite recognizing that these tasks are complex. Exemplary clinics work around this by using third-party data tools and shifting a tech-savvy staff member into a role that gives them responsibility for data management.
Being able to communicate with other members of the team and with outside specialty clinics via the EHR streamlines and accelerates the care coordination process. Interviewees expressed benefiting not only from a more comprehensive view of the patient’s care, but also feeling a heightened sense of responsibility for the totality of care rather than just individual steps within the care process. This responsibility is demonstrated in the significant steps exemplary clinics take to ensure patient referrals are completed. Some interviewees shared that once the clinic began tracking referrals in earnest, they were dismayed to realize how often patients are not able to follow through. This realization spurred conversations with patients and among teams to identify where changes can be made. Care coordinators focus efforts on helping patients understand how to navigate the health system and more often proactively manage the referral process for patients. This process was much simpler in clinics that are part of a network, while independent clinics had additional work to build referral networks and coordinate communication among clinics.
Attribute 6: Person and Family Centered Care “Recognize that we are the most important part of the care team—and that we are ultimately responsible for our overall health and wellness.” This attribute is another example, in addition to the Accountability attribute, where scores are mixed and both high scoring and other clinics appear to struggle. High scoring clinics attained 74% of possible
27
points while other clinics averaged 48%. This attribute is also the smallest of the six, with 40 points possible. High scores in this attribute are strongly linked with high PCPCH scores overall: of those clinics that do achieve high status on this attribute, nearly all (87%) are clinics that have also achieved high scores overall. Relative to other clinics, two differences stand out among clinics with the highest scores on Person and Family Centered Care. Use of specialty care services trends substantially upward, accompanied by an increase in cost per user that results in an overall 13.73% increase in per person cost of specialty care. Utilization of laboratory services also increased significantly, as did cost per person. In the context of this attribute’s standards, the reason for these differences is not clear. Availability of patient supports such as translation services and educational materials may be reducing barriers to patients’ completion of specialty and diagnostic referrals.
The interviews reveal a disconnect between how clinics understand this attribute and the content of the attribute’s specific standards. This appears rooted in interviewees’ struggling with the perception that primary care should be, by definition, “patient centered.” This dissonance around the language of this attribute may be a hindrance to clinics more intentionally embracing the practices outlined in the standards, such as translation services, culturally sensitive care, and patient satisfaction surveys. However, clinic leaders also, sometimes explicitly and sometimes implicitly, talked about members of the clinic adopting a “patient centered lens” that supports decision-making and helps the clinic know how to select among competing priorities. Clinics discuss this attribute more often as a philosophy or approach that guides how the other attributes are implemented, rather than as a set of standards.
Many interviewees noted that their clinic is providing services in multiple languages and proactively addressing language and literacy barriers to care, but this is more often presented as an inherent part of how the clinic has always operated, or began to operate as a result of shifting patient demographics. It is less often mentioned in the context of this attribute. A few interviewees reported struggling with the time required to be truly patient-centered and the tension of providing patient-centered care in an environment that is increasingly structured and deadline driven, particularly given the time needed to use shared decision-making tools, which cannot be incorporated with other clinic demands. Despite this tension, most clinics reported that care coordination and shared decision-making have resulted in teams that are more aware of patients’ goals and are more likely to understand a patient’s health behaviors in the context of their life and family situations.
Exemplary clinics indicate it is important to explain the PCPCH concept to patients. Clinics have made efforts to keep patients more aware and engaged in ongoing clinic changes, prioritizing time for communication through newsletters, social media and patient portals to update patients on new hires, changes in clinic services and health promotion materials. Patients increasingly are viewed as team members who have a stake in the clinic’s work and partner with the clinic toward their mutual goals.
Summary of Aim 3 Analyses and Findings
The intent of the Aim 3 attribute analysis was to identify whether and to what extent service use patterns and expenditures changed for patients served in PCPCHs with high scores on the individual attributes compared to other clinics. The analysis indicates that in most cases, while the PCPCH attributes clearly influence cost and utilization measures, they rarely do so in ways that are independent and can be attributed to a specific attribute; the cumulative effect of the PCPCH attributes has more impact than the independent effects. In one notable exception, the Coordination and Integration attribute appears to increase provision of care overall, with downward trends in associated costs. This corroborates themes from the qualitative portion of this analysis, which noted that clinics cite care

28
coordination as dramatically improving care for patients with complex needs. Overall, these results suggest that the PCPCH program’s current approach to awarding tier recognition on the basis of total points rather than minimum points within each attribute category is an effective strategy.
Not surprisingly, there are significant interactive effects among the attributes when they are implemented together that are likely very different than the results that would be found if each attribute were implemented and evaluated in isolation. While high scores in each of the six attributes in isolation yields inconsistent and sometimes unintended outcomes, in combination these attributes act to gradually shift provision of care upward and simultaneously reduce costs when compared to lower-scoring PCPCH clinics.
Recommendations Clinics’ initial embrace of the ideals of the PCPCH program spurred them to continuously find a way to implement the primary care home model and make it work for them. This has resulted in substantial care transformation and savings generally, with dramatic improvements as PCPCH clinics have worked to increase their initial competencies in providing patient centered primary care. Achieving PCPCH program goals has required strong and consistent clinic leadership and in some cases nothing short of a complete transformation of the clinics’ organization culture. Yet they still need support. Maintenance and strengthening of the PCPCH program and its system supports for participating clinics, including financial incentives and remuneration that recognizes the considerable external savings generated by PCPCH clinics, are investments that could expand both the program and the substantial systemic benefits it provides. If more clinics are to opt into PCPCH recognition and if recognized clinics are to seek higher tiers of recognition, thus sustaining and growing the PCPCH program and model of care, a number of challenges should be addressed. The following recommendations for actions and specific strategies are framed at the systems level (S), the program level (P), and through technical assistance (TA). A brief summary of the findings previously presented is offered for each to reinforce the evidence underlying the recommendation. At the system level, the following strategies are suggested:
S-1: Reform payment mechanisms to provide incentives and rewards for participation in the PCPCH program, advancement along program tiers that increases program benefits, and adequate and sustainable reimbursement of critical and high-impact components of the PCPCH model such as care coordination and team-based care. o Payment models and other financial arrangements do not currently incentivize clinics to operate
in alignment with the aims of the PCPCH program. Care coordination has become critical for preserving provider and medical assistant time for patient care, and team-based care is necessary to meet the needs and expectations of patients, particularly for clinics with increases in populations. Clinic leaders report struggling to financially support the changes necessary for both general and top-tier recognition.
S-2: Develop and coordinate a more systematic approach and regional coordination to achieve interoperability of electronic health records (EHRs) across providers in Oregon. The lack of interoperability is an issue that significantly impedes clinics but can rarely be addressed at the level of an individual clinic. A coordinated approach would benefit not only PCPCH clinics but also the specialty clinics and hospitals with which they interact. o Information exchange with other clinics and hospitals remains a challenge. The lack of
interoperability across EHR platforms is an issue that significantly impedes clinics but can rarely be addressed at the level of an individual clinic. Being able to communicate via an EHR greatly

29
improves speed and continuity of care. A coordinated approach would benefit not only PCPCH clinics but also the specialty clinics and hospitals with which they interact.
With regard to the PCPCH program itself, the following recommendations are made, recognizing that new PCPCH recognition standards will be implemented in 2017:
P-1: Monitor the considerable differences in patient and provider characteristics that exist between currently participating PCPCH clinics and those that have not yet opted in, to identify program efforts that could assure continued expansion of the program. o PCPCH patients are generally younger, Medicaid-insured, and have slightly higher prevalence of
behavioral health conditions and obesity. Non-PCPCH patients have slightly higher proportions of chronic physical conditions related to age. PCPCH designated clinics tend to be larger than non-PCPCH clinics or practices.
P-2: Consider the implications of the findings that attainment of the six program attributes works collectively and not independently, and that the 18 standards identified as core by PCPCH staff appear to outperform total PCPCH score, in further efforts to develop the PCPCH recognition process. o Qualitative interviews revealed perceptions that while some attributes create tension or
conflicting priorities when implemented simultaneously, while others are complementary. Quantitative analysis affirmed that the cumulative effect of the PCPCH attributes has more impact on cost and utilization measures than the independent effects, with the exception of the Coordination and Integration attribute.
P-3: Adopt value-neutral program language that more clearly points to specific operational changes, and avoids terminology that may generate resistance by implying negligence or wrongdoing in how clinics provided care prior to PCPCH recognition. o Qualitative interviews revealed that the terms such as “patient-centered” and “comprehensive
whole-person care” are understood as describing a team’s or provider’s values and philosophy, rather than specific clinic activities. The implication that providers were not previously “patient-centered” creates defensiveness that becomes a barrier to improvement.
P-4: Work with other organizations and improvement-focused collaboratives to streamline and develop more universal definitions for core concepts and standards for required metrics. Consideration should be given to minimizing the number of ways clinics are required to document or measure similar activities and outcomes. o Clinics that worked with other collaboratives with similar metrics and that also offered technical
assistance or peer support found it easier to implement specific PCPCH standards. Clinics have been challenged by the requirements of a large volume of data collection and documentation, especially when they must document the same activities and outcomes for each specific collaborative.
P-5: Use media and other strategies to raise public awareness across Oregon of the value of PCPCH recognition and the distinctions among levels of recognition. o PCPCH recognition is a strong signal to both potential and existing employees and providers
about a clinic’s values and its vision for the future; however, this does not translate to the general population. Some clinics offer brochures and informed conversations with patients about PCPCH’s purpose and philosophy but still report that their patients have trouble understanding the program’s intent or the relative value of different tiers of recognition.
P-6: Emphasize through ongoing communications that the transformation aims of PCPCH are dependent upon the engagement or resistance of individual people – both staff and patients – within the clinics. Success requires that the larger health systems environment be supportive of the individuals implementing and experiencing change.

30
o Clinic leaders reported staff pushback and turnover among those who did not perceive PCPCH to be beneficial or worth the work it required. There were also reports of patients with little interest in becoming engaging in shared decision making as an active member of their own health care team. Clinic leaders cited these examples as hindrances to implementation; conversely clinics with staff and patients on board with PCPCH transformation cited those individuals as facilitators.
Finally, the following recommendations are made relative to how the Program supports individual clinics, given the importance of technical support of both recognized clinics and those aspiring to recognition:
TA-1: Support clinics to find or develop staffing to meet the documentation/reporting requirements of the program. Concomitant with this challenge is a need to develop clinics’ ability to utilize their EHR to access and report relevant data. This consideration is especially critical for smaller and independent clinics whose size does not support staff with specialized database training, and for rural clinics that may not have access to workers with these skills. o Clinics incorporated collection, reporting, and utilization of data to improve care at both the
individual patient and clinic population level. This has increased demands on a workforce that struggles to find available time and is often in the midst of staff turnover.
TA-2: Provide financial assistance for initial structural changes, facilities expansions and technological improvements to equip clinics with the physical and digital resources that support the cultural and process changes that will be implemented through the PCPCH developmental process. o Clinics with outdated EHRs and lack of adequate space conducive to team-based care reported
obstacles to making changes. Clinics with adequate spaces and up-to-date technological resources flourished, and acknowledged those resources as a facilitator to implementation. With access to high-level information about the clinic’s population of patients, clinic leaders can more strategically make decisions about which services to provide or which staffing is most needed rather than relying on outside advice.
TA-3: Provide skill-building and training resources to support organizational cultural change, including: interpersonal communications; hiring practices that emphasize aptitude for team-based care; reductions in organizational hierarchy; transparency in planning and decision-making processes; and normalization of accountability at all levels of the clinic through evaluation, information sharing, and solicitation and provision of feedback. o Clinic leaders who participated in skill-building and training related to this topic through other
learning collaboratives or within their larger system organization found them helpful for improving “office skills” that normally are not taught in clinic settings.
TA-4: Allow clinics a financial “grace period” to experiment with workflows, organization and team structures, and other processes for performance improvement without risking their bottom line. This need is particularly noted in the early stages of PCPCH implementation when clinics may struggle with staff turnover. Clinics that strive for immediate top-tier recognition status should be encouraged to achieve initial recognition status first before moving up through the tiers. o The workforce is unprepared for large-scale change and thus experimentation with leadership,
workflows, and organizational structure is critical, but these are perceived as significant financial risks. This process requires time, patience, and adaptation from the clinics, particularly in the beginning of PCPCH implementation when many clinics struggle with staff turnover.
TA-5: Allow time to assess the patient culture and support the shift to PCPCH, particularly for new Medicaid patients and complex patients, who are not accustomed to shared decision-making for their own health care. Clinics that have been most affected by the Medicaid expansion face unique challenges as they care for newly insured patients and may need additional time to help patients learn to navigate the primary care system. These clinics also need access to robust networks of

31
social resources as they serve patients whose housing, transportation and economic situations complicate medical care. o Clinics most affected by the Medicaid expansion face unique challenges as they care for newly
insured patients and may need additional time to help patients learn to navigate the primary care system. These clinics also need access to robust networks of social resources as they serve patients whose housing, transportation, and economic situations complicate medical care.
TA-6: Meet clinics “where they are” and avoid language that clinics may perceive as critical of their pre-PCPCH ways of providing patient care. Emphasize improvement as a continuous process as patient populations change and the health systems environment evolves. o Clinics in the earliest stages of implementation require a collective understanding of where they
“fit” in the larger efforts to reform the health system. Staff and providers without this larger context may see their implementation challenges as a reason to give up or a sign of dysfunction within their specific clinic. It is important to emphasize that improvement is a continuous process rather than a destination, involving changes in culture as well as practice.
TA-7: Provide examples of practices that not only illustrate workflow or documentation processes, but also demonstrate the intent behind each standard. This is important as clinics may be choosing measures that are easy to track but may not be most beneficial for understanding the health of their patient population. It may also be helpful to provide examples of practices that do not meet the standards. o Clinics may be choosing measures that are easy to track but may not be most beneficial for
understanding the health of their patient population because they do not know how to capture and document the more appropriate measures. Offering examples or processes for capturing metrics that are beneficial for patient populations can resolve the issue. Additionally, providing examples of practices that are not appropriate for meeting standards can help aspiring PCPCH clinics determine how their practices match up to a recognized practice.
Conclusions
This examination of 20 exemplary PCPCH clinics as well as extensive analysis of the APAC data for all PCPCHs has yielded insights into the practices that make some clinics exemplary, as well as identifying some of the barriers that impede the implementation and sustainability of the PCPCH program and some of the facilitators of the program’s success. It is evident that exemplary clinic leaders embrace and champion the concept of a learning organization6. PCPCH recognition is a strong signal to both potential and existing employees and providers about a clinic’s values and its vision for the future. While none of the interviewees used the term “learning organization” specifically, review of the results and analysis shows that exemplary clinics that are successfully implementing the PCPCH program are engaged in the following:
Systems thinking. Clinic leaders are willing to examine all the processes and practices of their organization in order to assess and improve its collective performance.
Personal mastery. Clinic leaders value individual learning among their staff, and thus work to facilitate training, development, and continuous self-improvement so that all staff can work “to the top of their license.”
6 Senge, P. (1990). The Fifth Discipline. London: Century Business Publishers.

32
Mental models. Clinic leaders and staff continuously question their mental models -- the assumptions about how the clinic should operate and how the work should be done. They are willing to “unlearn” ways of doing things that no longer are sufficient.
Shared vision. Through leadership, organization culture changes, and (sometimes) staff turnover, exemplary clinics have been able to develop a shared vision of the meaning of care and how it is provided, which provides focus and energy to keep learning.
Team learning. Individual clinic staff are learning, which enhances team learning, which in itself allows the staff to grow more quickly and build the problem-solving capacity of the clinic through better access to knowledge and expertise. Clinic teams have been enabled to engage in shared dialogue, discussion and open communication about both successes and failures without fear of reprisal, thus allowing for the creation, acquisition, dissemination, and implementation of knowledge across the clinic.
For the PCPCH program to be sustained and spread further, OHA will need to address barriers to the program’s implementation and sustainability to assist both exemplary clinics to sustain a learning organization model and support those clinics that are either struggling with or thinking about PCPCH implementation. Clinics must be aware that PCPCH implementation is a long and arduous process, and while there is potential for a return on investment in the long run, it requires considerable investment of resources in the beginning. Clinics need support and suggested remedies in these specific areas: an unprepared workforce, insufficient financial incentives, complex patient populations, and difficulty with organizational capacity and technology issues. As well, OHA will need to provide continued support and technical assistance in the areas that facilitate program implementation and sustainability, including support for enacting leadership and culture change; care coordination; standardization of work flows, processes, and procedures; and ways to effectively harness the power of team-base care.
The results of these analyses indicate that Oregon’s PCPCH program has been very successful in meeting the goals of cost-effective, system-wide care transformation embodied in the Triple Aim. The findings also affirm key aspects of the program’s existing design and management. For example, the 2016 PCPCH Program strategy of establishing a more moderate tier for initial PCPCH designation with support to move up through the tier system appears to be both functional and beneficial in encouraging and supporting clinics to engage in the program. The creation and management of program supports to generate and recognize improvement in clinics’ PCPCH standing have also clearly reaped benefits. OHA and the PCPCH program staff should be commended for developing and sustaining a successful state initiative. As with any program, no matter how successful, there is always room for improvement. The analyses of exemplary clinics’ experiences and of the relationship of attributes and attribute scoring on PCPCH program outcomes provide several concrete areas to continue program improvement efforts.

33
Acknowledgements The authors extend their thanks to former OHA employees Dr. Jeanene Smith and Ms. Nicole Merrithew for their support since 2011 to conduct multiple phases of evaluation of the implementation of OHA’s PCPCH Program. We also appreciate the ongoing assistance from PCPCH Program staff Meg Bowen, Amy Harris, Deepti Shinde, Evan Saulino and Chris Carrera, and from Chris DeMars in the OHA Transformation Center. This work could not have been completed without the contributions of several graduate research assistants who worked with the research team. In addition to those listed as co-authors of this report, we also acknowledge the contributions in the early phases of this work of Rebekah Bally, Cally Johnson, Kelsey Priest and Stefan Shearer. Finally, the authors extend their thanks to the PCPCH clinicians and administrative staff who generously contributed their time and input to this evaluation. Their willingness to host members of the research team and engage in candid conversations provided robust input to the findings. Their excellence is demonstrated not only by their exemplary implementation of the PCPCH model but also through their commitment to advancing the larger field of primary care.

34
Appendix 1
Effects of the Patient Centered Primary Care Home Program on Service Expenditures and Use: Aim 2 of the Phase 3 Evaluation
Prepared by: Neal Wallace, PhD
Shauna Petchel, MPH
OHSU & PSU School of Public Health Portland State University
September 2016

35
Introduction and Background This report provides the study design details and results for the PCPCH quantitative assessment of cost and utilization. This arm of the Phase III PCPCH evaluation was designed to assess the effects of PCPCH designation on the service utilization patterns and expenditures across all adopters of the PCPCH model in Oregon over the first three years of the program.
Study Design The intent of the PCPCH quantitative assessment of cost and efficiency is to assess the impact of the PCPCH program on service utilization and expenditures for Oregonians receiving primary care at PCPCH clinics during the PCPCH program’s first three years. This study employs a generalized “difference-in-difference” design that accommodates the staggered designation of PCPCH clinics to assess the net impact of PCPCH’s expenditure and use of all insurance covered services and eight specific service types. The design compares pre-to-post-PCPCH designation expenditure and utilization changes in PCPCH clinics to those found for non-PCPCH primary care clinics. The difference in these pre-post changes is the estimated net effect of PCPCH designation on patient utilization and expenditure. In addition to estimating the overall effect of the PCPCH program in its first three years, we also separately estimated the effects of PCPCH clinics that are in their first, second or third year of designation to identify whether effects would be expected to increase with program maturity.
Data The main data sources for the study were the Oregon All Payer All Claims (APAC) database and the PCPCH designation database, both provided to the PSU research team by the Oregon Health Authority (OHA). Service utilization and expenditure data are derived from the APAC medical and pharmacy claims for calendar years 2010-2014. APAC eligibility files were used to identify Oregon residents, determine spans of insurance coverage, insurance coverage type, and individual demographic characteristics. PCPCH clinics were identified from the PCPCH designation database covering designation from initial program implementation in October 2011 through early 2015. This database includes a variety of clinic identifying information including practice and parent organizational National Provider Identifiers (NPIs). PCPCH NPIs were checked against the CMS National Plan and Provider Enumeration System (NEPPES) registry to corroborate, correct or augment NPI data for the PCPCH clinics. The APAC provider file was used to crosswalk PCPCH NPI’s with APAC billing identifiers to identify PCPCH related individuals and their service claims. The APAC Provider file and the NEPPES registry were also used to identify Oregon-based providers within the APAC data.
Study Population PCPCH Clinic Cohort and Study Period The study period encompassed four study years over the period October 1, 2010 through September 30, 2014. The October 2011 through September 2014 period reflects the first three years of the PCPCH program after the earliest PCPCH clinic designation date of October 1, 2011. An additional year of “pre-data”, from October 2010 to September 2011 was included to provide a minimum of one year of data prior to the earliest designated PCPCHs. PCPCH clinics identified in the study were limited to those with initial designation dates prior to September 2014 and with continued designation through September 2014. These criteria yielded 510 PCPCH clinics. Identifying PCPCH and Non-PCPCH Primary Care Providers Primary care providers were identified as any APAC billing provider with at least one claim for a primary care visit within the APAC data covering the study period. A primary care visit was identified consistent with OHA’s dashboard definition based on Milliman Healthcare Cost Group (HCG) codes provided in the APAC data (HCG’s P32c, P42, and P43). Using a combination of the PCPCH designation database, APAC

36
provider file and NEPPES registry data, we identified whether APAC billing identifiers for these primary care providers matched PCPCH NPIs and/or were Oregon based providers, as well as identifying their provider crosswalk key identifier. The APAC provider crosswalk id (PROV_CW_KEY) links APAC billing identifiers connected to the same billing provider NPI, as well as linking across NPIs that represent common clinic billing units. Given the complexity of billing practices (and hence billing identifiers) in relation to NPIs, we used clinic billing units defined by unique provider crosswalk key identifier to define units of observation within the study. Clinic billing units that incorporated at least one billing identifier directly linked to PCPCH NPIs were identified as PCPCH clinic billing units, while all others were identified as non-PCPCH primary care clinic billing units. Identification and Attribution of Individuals to PCPCH vs. non-PCPCH Primary Care Status The initial study population included 1,192,435 individuals who were identified in at least one of the four study years as having had: (1) consistent residence in Oregon; (2) consistent, full year insurance medical and pharmacy coverage; and, (3) at least one primary care visit to an Oregon-based provider. Individuals were only retained in the study sample for study years in which they met the three initial selection criteria and thus provided from one to four study year observations. Each individual’s primary care visit claims in a study year were aggregated by provider crosswalk key identifier to clinic billing units. Individuals were then empirically attributed to a specific provider billing unit in each study year based on plurality of visits or last visit in case of a tie. Each individual’s primary care visit claims in a study year were subsequently aggregated in total to identify the percentage of primary care visits provided by PCPCH identified clinic billing units. The final study population was identified by selecting individuals in each study year who either received 100% of their primary care visits from PCPCH or non-PCPCH identified clinic billing units. This yielded a final sample of 1,128,234 individuals consisting of 606,881 PCPCH and 599,990 non-PCPCH attributed individuals. Developing the Final Analytic Data Set To accommodate the statistical analytic approach used, and in concert with the focus on program and clinic level effects, the unit of analysis for the study was defined as a clinic billing unit quarter. Individual service use, expenditure, and clinical/demographic characteristics were aggregated by attributed clinic billing unit for each study quarter. This yielded 100,084 observations in the final data set. These included 7,380 PCPCH and 92,704 non-PCPCH quarterly observations representing 510 PCPCH and 8,435 non-PCPCH primary care clinic billing units. Use and Expenditure Measures The main outcome measures for the study were the percentage of subjects using service, average expenditures per service user, and average expenditures per subject in a quarter. These outcome measures were applied to all covered services in the APAC data and eight specific service types relevant to PCPCH performance: primary care office visits and procedures, specialty office visits and procedures, outpatient specialty mental health services, non-therapeutic radiation, laboratory, pharmacy, emergency department, and inpatient. Expenditures were measured as the sum of insurance and individual (out of pocket) payments.

37
Subject Clinical and Demographic Measures A variety of subject characteristics were included in the analysis to account for variation in practice billing unit composition over time. These subject characteristics were aggregated to the clinic billing unit quarter and thus measured as percentages. They included: gender, nine age groups, sixteen specific insurance types, and physical and behavioral condition markers. The physical and behavioral condition markers included diabetes, COPD/asthma, chronic heart failure, chronic kidney disease, coronary heart disease, cerebrovascular disease, obesity, schizophrenia, affective disorders, and other behavioral health conditions. These were identified and assigned to individuals based on their claims (diagnosis) history across the entire study period.
Statistical Analysis All study results were estimated using two-way fixed effects (clinic billing unit and quarter) ordinary least squares (OLS) regression with weights equal to the number of subjects represented in each quarterly clinic billing unit observation. This statistical model provides a “difference-in-difference” estimate of the PCPCH program effects while taking into account the variable designation dates of PCPCH clinics. Standard errors were adjusted for clustering on clinic billing unit. All study results were estimated using STATA 12. PCPCH program effects were identified by the coefficient of binary variables identifying PCPCH observations for quarters on or after their PCPCH designation date. For the overall three-year program effects, this involved a single binary variable for all PCPCH related quarterly observations on or after PCPCH designation date. For the analysis of program effects based on the number of years post-PCPCH designation, three binary variables were used, breaking all PCPCH related quarterly observations into three sets of observations reflecting quarters 1-4, 5-8, or 9-12 (i.e., years 1-3), after designation. The estimated effects from the regression analyses reflect the absolute magnitude of change attributable to the PCPCH program in terms of percentage points of service use or dollars of expenditure per user or subject. To provide an additional, relative (percentage based) measure of PCPCH program effects that can be compared across service types, we divided the absolute effects by estimates of the average quarterly outcome values for PCPCH clinic billing units derived from the regression models. All aggregate subject clinical and demographic characteristics measures were included in the regression analyses. Appropriate use of control variables in this analytic context is predicated on the assumption that all distinct subject groups, defined by the combination of control variables applied, exist in both groups under comparison. Without this common “support”, propensity score or other matching techniques are typically applied to create it. We used standard statistical techniques to test for commonality or “support” across the PCPCH and non-PCPCH samples. We found that while the samples were not perfectly supported, less than 1% of subjects could not be matched by characteristics. These subjects generally represented unique combinations of chronic illnesses and age. As the unmatched subjects are nearly equally distributed across the PCPCH and non-PCPCH samples and are a very small percentage of the total, the analysis proceeded without explicit matching.

38
Table 1: PCPCH versus Non-PCPCH Subject Characteristics
Non-PCPCH PCPCH Non-
PCPCH PCPCH
Subjects 599,990 606,881 Insurance Type
Subject Quarters
3,717,920 3,977,248 Private 71.0% 41.3%
Gender Medicare 10.9% 5.0%
Medicaid 18.1% 53.7%
Male 44.3% 46.7% Chronic Diseases
Female 55.7% 53.3%
Age Group None 59.4% 56.3%
Diabetes 8.2% 6.2%
0-1 2.0% 5.5% COPD/Asthma 10.8% 13.6%
2-5 6.8% 15.4% Chronic Health Failure 0.6% 0.4%
6-11 8.2% 15.6% Chronic Kidney Disease 0.6% 0.5%
12-17 8.4% 13.4% Cardiovascular Disease 1.5% 1.0%
18-25 7.5% 7.0% Coronary Heart Disease 1.5% 0.8%
26-40 23.1% 16.5% Obesity 1.3% 2.5%
41-64 31.8% 20.2% Schizophrenia 0.2% 0.5%
65-80 11.2% 5.8% Affective Disorder 3.3% 3.9%
81+ 1.1% 0.7% Other Behavioral Health 12.6% 14.2%
Results Table 1 above presents the clinical and demographic characteristics of the PCPCH and non-PCPCH subjects included in the study based on their total quarterly observations. Given the large sample size, all differences in characteristics are statistically significant. The PCPCH population has some distinct differences from the non-PCPCH population. PCPCH subjects are generally younger and predominately Medicaid insured. These characteristics may reflect the emphasis within CCOs to place their population in PCPCHs. While each group has similar overall proportions of persons with chronic physical or behavioral health conditions, the PCPCH population has slightly higher percentages of persons with behavioral health conditions and has a higher percentage of individuals diagnosed with obesity. The non-PCPCH population tends to have slightly higher proportions of chronic physical conditions related to age. These differences appear to align with the age and insurance status differences noted above.
Table 2: PCPCH Program Effects on Quarterly Expenditures per Person
Years of PCPCH Designation
Service Type Overall Year 1 Year 2 Year 3
Total -$40.73 * -$33.85 -$48.85 * -$84.58 *
-4.2% -3.5% -5.0% -8.6%
Primary Care $3.33 -$2.93 $3.70 $6.48 *
3.1% 2.7% 3.4% 6.0%
Specialty Care -$1.60 * -$0.35 -$3.90 * -$5.01 *
-3.6% -0.8% -8.7% -11.1%
Mental Health -$3.11 -$2.52 -$3.63 $7.79
-13.3% -10.6% -15.3% -32.7%
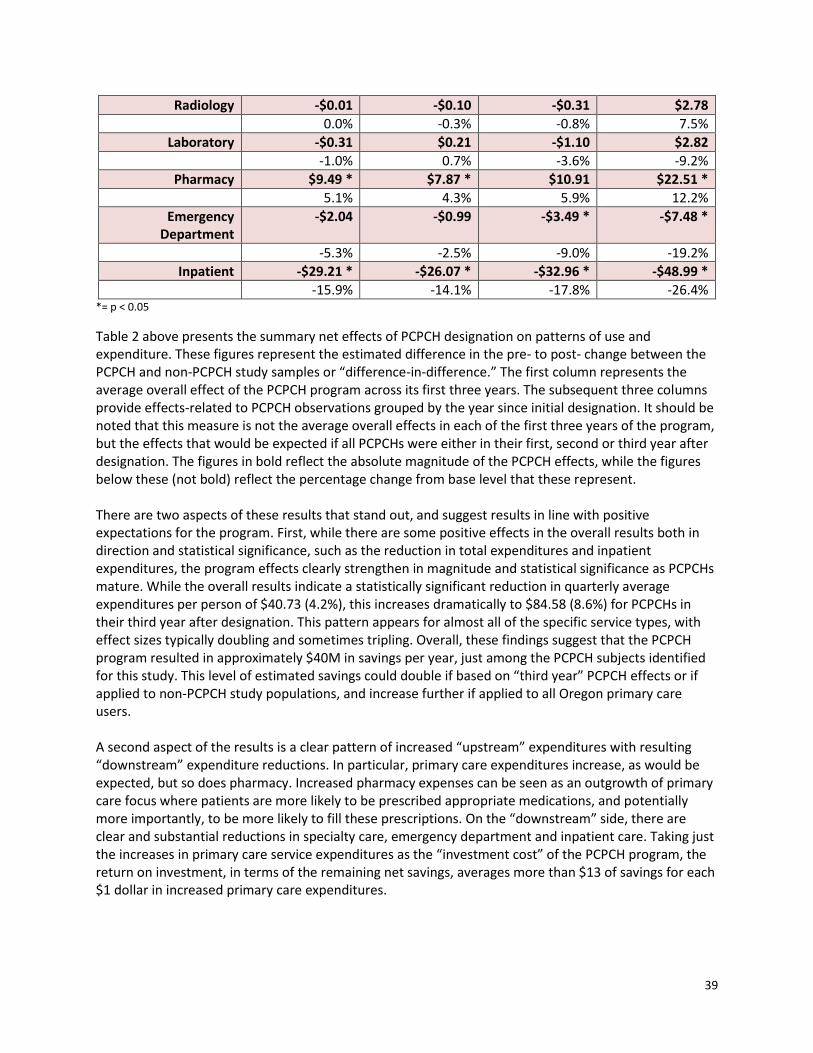
39
Radiology -$0.01 -$0.10 -$0.31 $2.78
0.0% -0.3% -0.8% 7.5%
Laboratory -$0.31 $0.21 -$1.10 $2.82
-1.0% 0.7% -3.6% -9.2%
Pharmacy $9.49 * $7.87 * $10.91 $22.51 *
5.1% 4.3% 5.9% 12.2%
Emergency Department
-$2.04 -$0.99 -$3.49 * -$7.48 *
-5.3% -2.5% -9.0% -19.2%
Inpatient -$29.21 * -$26.07 * -$32.96 * -$48.99 *
-15.9% -14.1% -17.8% -26.4% *= p < 0.05
Table 2 above presents the summary net effects of PCPCH designation on patterns of use and expenditure. These figures represent the estimated difference in the pre- to post- change between the PCPCH and non-PCPCH study samples or “difference-in-difference.” The first column represents the average overall effect of the PCPCH program across its first three years. The subsequent three columns provide effects-related to PCPCH observations grouped by the year since initial designation. It should be noted that this measure is not the average overall effects in each of the first three years of the program, but the effects that would be expected if all PCPCHs were either in their first, second or third year after designation. The figures in bold reflect the absolute magnitude of the PCPCH effects, while the figures below these (not bold) reflect the percentage change from base level that these represent. There are two aspects of these results that stand out, and suggest results in line with positive expectations for the program. First, while there are some positive effects in the overall results both in direction and statistical significance, such as the reduction in total expenditures and inpatient expenditures, the program effects clearly strengthen in magnitude and statistical significance as PCPCHs mature. While the overall results indicate a statistically significant reduction in quarterly average expenditures per person of $40.73 (4.2%), this increases dramatically to $84.58 (8.6%) for PCPCHs in their third year after designation. This pattern appears for almost all of the specific service types, with effect sizes typically doubling and sometimes tripling. Overall, these findings suggest that the PCPCH program resulted in approximately $40M in savings per year, just among the PCPCH subjects identified for this study. This level of estimated savings could double if based on “third year” PCPCH effects or if applied to non-PCPCH study populations, and increase further if applied to all Oregon primary care users. A second aspect of the results is a clear pattern of increased “upstream” expenditures with resulting “downstream” expenditure reductions. In particular, primary care expenditures increase, as would be expected, but so does pharmacy. Increased pharmacy expenses can be seen as an outgrowth of primary care focus where patients are more likely to be prescribed appropriate medications, and potentially more importantly, to be more likely to fill these prescriptions. On the “downstream” side, there are clear and substantial reductions in specialty care, emergency department and inpatient care. Taking just the increases in primary care service expenditures as the “investment cost” of the PCPCH program, the return on investment, in terms of the remaining net savings, averages more than $13 of savings for each $1 dollar in increased primary care expenditures.

40
Table 3: PCPCH Program Effects on Quarterly Expenditures per Service User
Years of PCPCH Designation
Service Type Overall Year 1 Year 2 Year 3
Total -$61.44 * -$52.52 * -$70.67 * -$128.02 *
-4.8% -4.1% -5.5% -10.0%
Primary Care -$3.37 -$2.62 -$4.85 -$5.38
-1.6% -1.2% -2.3% -2.5%
Specialty Care -$3.14 -$3.24 -$2.50 -$5.78
-1.5% -1.6% -1.2% -2.8%
Mental Health $58.41 $35.28 $121.12 $128.15
7.2% 4.4% 15.2% 16.0%
Radiology -$7.89 * -$7.15 -$10.20 * -$4.40
-3.2% -2.9% -4.1% -1.8%
Laboratory -$3.16 -$2.70 -$3.91 -$5.73
-2.8% -2.4% -3.5% -5.1%
Pharmacy $13.26 $10.58 $16.74 $30.25 *
3.7% 3.0% 4.8% 8.6%
Emergency Department -$75.83 * -$59.75 * -$114.22 * -$159.18 *
-8.6% -6.7% -12.9% -17.9%
Inpatient -$757 -$485 -$1,718 * -$3,322 *
-4.7% -3.0% -10.7% -20.6% *=p < 0.05
Table 3 above presents the PCPCH program’s net effect (difference-in difference) on expenditures per service user. These results also confirm the progressive effects of PCPCHs as they mature in the program. They also indicate that most of the savings generated are coming from reductions in expenditure levels for individuals receiving services, as opposed to reducing the likelihood of receiving services. The average reduction in expenditures per user is $61.44 (4.8%), increasing to $128.02 for PCPCHs in the third year after designation. These are each at least 50% higher than their equivalent expenditure per person estimates. This pattern of reduction in service intensity for service users is particularly evident for emergency department and inpatient services, which would be consistent with reductions within “higher users” of those services. Similarly, the increase in pharmacy and reductions in specialty care expenditures appear to be fueled in part by increases and decreases, respectively, in per user expenditures, although these effects do not generally reach statistical significance. Notably, primary care and mental health expenditures per user, although not statistically significant, move in opposite directions to expenditures per person. Mental health expenditures per user show large absolute and percentage increases, while primary care expenditures per person are negative.

41
Table 4: PCPCH Program Effects on Quarterly Rates of Service Use
Years of PCPCH Designation
Service Type Overall Year 1 Year 2 Year 3
Total 0.72% * 0.65% * 0.73% * 1.56% *
0.97% 0.88% 0.98% 2.10%
Primary Care 2.19% * 1.70% * 2.95% * 4.24% *
4.27% 3.35% 5.80% 8.33%
Specialty Care -0.60% 0.25% -2.21% * -2.58% *
-2.90% 1.16% -10.46% -12.20%
Mental Health -0.42% * -0.22% * -0.74% * -1.15% *
-13.69% -6.99% -23.27% -36.22%
Radiology 0.12% 0.16% -0.03% 0.51% *
0.87% 1.10% -0.18% 3.63%
Laboratory 0.79% * 0.74% * 0.78% * 1.48% *
3.21% 3.02% 3.16% 6.01%
Pharmacy 0.79% * 0.50% 1.11% * 2.80% *
1.61% 1.02% 2.28% 5.73%
Emergency Department 0.27% * 0.26% * 0.30% 0.27%
4.96% 4.77% 5.44% 4.90%
Inpatient -0.02% -0.03% -0.01% 0.05%
-1.87% -2.88% -0.63% 4.10% *=p < 0.05
Table 4 above provides the results for the PCPCH program’s effect on the probability of service use in a quarter. Overall, the likelihood that PCPCH patients used any service in a quarter increased slightly, and increased additionally for PCPCHs with longer duration of designation. Thus, PCPCHs were able to reduce expenditures even while their patients tended to receive services more frequently. In general, much like the previous expenditure results, effects increased progressively with PCPCH designation time. Likelihood of receiving primary care treatment and pharmacy increased, while specialty care decreased commensurate with the increases in expenditures per person found above. The probability of receiving lab services increased, but decreases in expenditures per user did not generally raise lab expenditures per person. Radiology and inpatient care were largely unchanged. Use of the emergency department did increase, despite reductions in expenditures per user and per person. There were also large proportional decreases in probability of specialty mental health service use, which are juxtaposed with the large increases in expenditures per user noted above. Overall, the PCPCH program’s effect was largely to increase use of services except for ambulatory specialty physical and mental health services. The increase in primary care use fits with program expectations and the increases in pharmacy and lab could be seen as ancillary effects of greater primary care contact. Similarly, the reduction in physical health specialty care may reflect direct substitution of primary for specialty care. The increase in emergency department use and decrease in mental health specialty care are less clearly in line with PCPCH program objectives. The mental health effect may signal more, and perhaps more general, behavioral conditions are being met and billed within the primary care setting. This would lower the rate of use of billed specialty mental health care, and potentially raise expenditures per user if they reflect patients with more severe mental health conditions. The increase in emergency department use is more puzzling, but may reflect greater engagement with the treatment system overall. Notably, this increase does not appear to be related with increases in inpatient care.

42
Limitations There are a number of potential limitations inherent in the study design that should be considered. First, by focusing on individuals who had to be receiving some primary care to be included in the study, the study design does not provide any information on overall levels of access to primary care services related to the PCPCH program. By selecting only individuals with consistent, full (study) year coverage, the results also do not reflect individuals with partial year coverage or changes in coverage type. As the outcomes are measures in the same (annual) periods of measured primary care use, the study design also cannot determine the effect of prior primary care or PCPCH use on future treatment patterns. The strength of this design is in looking at primary care clinic patterns, given some annual primary care use, and their relationship to quarterly service patterns during the same annual observation periods. In addition, both PCPCH clinics and patients look much different than non-PCPCH. There are many more non-PCPCH clinic billing units per patient than for PCPCH. This reflects the fact that many of the PCPCH clinics are some of the largest clinics in the state. At the same time, individual primary care practitioners tend not to be PCPCH designated, reflecting most of the additional non-PCPCH observations. Removing these “small” clinic billing units from analysis, however, does not materially change the results. The PCPCH patient population was found to significantly younger and much more likely to be Medicaid (or SCHIP) covered. While our test for support suggests that there are sufficient “matches” across the large samples to allow consistent estimates of the PCPCH program effects despite these overall differences, the results of the analysis reflect the “mean” of the sampled Oregon primary care population. Thus, while these results may be more generalizable in one sense, the specific effect sizes for a patient population matching current PCPCH panels are likely different.
Conclusions The intent of this study was to identify whether and to what extent service use patterns and expenditures changed for patients served in PCPCHs compared to non-PCPCH clinics during the first three years of the PCPCH program. The study findings indicate that the PCPCH program has been effective overall in reducing overall expenditures per person, even while increasing the extent to which their patients are “touching” the treatment system. These overall effects appear to be largely driven by increased primary care service use resulting in less specialty care, emergency department and inpatient expenditures. On the whole, the increased expenditures on primary care were estimated to return over $13 in savings for each $1 of additional primary care expenditure. The study findings also indicate a clear progression in PCPCH program effects related to duration of clinics’ experience in the PCPCH program. Clinics in their third year of PCPCH designation had nearly twice the expenditure reducing effect as the program on average and nearly three times that of PCPCHs in their first year of designation. These effects were also more likely to be statistically significant, suggesting that many program effects take time to be measurably apparent. These progressive results are also consistent with the PCPCH program’s operation and philosophy of setting a more moderate bar for initial PCPCH designation and then providing support and recognition for increased PCPCH program standards through the “levels” of designation. Overall, the study results suggest very strong and potentially increasing positive impacts of the PCPCH program, consistent with overall program expectations. Recognized PCPCH clinics appear to be able to significantly reduce overall expenditures by increasing “upstream” primary care provision to reduce “downstream” specialty and hospital based services.

43
Appendix 2
Effects of High PCPCH Attribute Scores on Service Expenditures and Use: Additional Analyses for Aims 2 and 3 of the Phase 3 Evaluation
Prepared by: Neal Wallace, PhD
Shauna Petchel, MPH
OHSU & PSU School of Public Health Portland State University
September 2016

44
Background The following report provides a supplemental analysis to the quantitative assessment of cost and efficiency described in detail in Appendix 1. This arm of the evaluation was designed to explore how service utilization and expenditure patterns differed in high-scoring PCPCH clinics when compared with other clinics, looking at overall PCPCH score and scores within each of the six PCPCH attribute categories. High scoring clinics are defined as those within the top quartile of cumulative points on the 18 core standards of exemplary performance identified by PCPCH staff. The six PCPCH attributes are Access to Care (“Access”), Accountability, Comprehensive Whole-Person Care (“Comprehensive”), Continuity, Coordination and Integration (“Coordination”), and Person and Family Centered Care (“Patient Centered”). Clinics accrue points within each category, and the sum of the attribute scores comprises a clinic’s total points. The number of points possible in each attribute is not equally weighted (see Figure 1). For instance, the Coordination attribute contributes more points to a clinic’s total score than the Access and Patient-Centered attributes combined.
1. Access (50 maximum) (13%) 2. Accountability (70 maximum) (18%) 3. Comprehensive (60 maximum) (16%) 4. Continuous (65 maximum) (17%) 5. Coordinated (95 maximum) (25%) 6. Patient Centered (40 maximum) (11%) Maximum Points Possible = 380
Qualitative interviews with exemplary PCPCH clinics revealed perceptions that some attributes are complementary while others can be difficult to implement simultaneously. Since clinics accrue points within these six categories independently, the discussion below reveals how clinics’ scores on specific attributes relate to scores on other attributes, and to total PCPCH scores. This is meaningful for understanding whether and where there is tension or synergy among the attributes. This analysis also measures two pre-post effects: the change in service utilization and expenditures among clinics with high scores on the 18 core standards identified by program staff and the same changes among all other PCPCHs, or the “difference-in-difference.” By comparing the pre-post effects in these two categories of clinics, we estimate the net effect on overall performance of being identified as a high-scoring PCPCH clinic within these 18 standards. This method is repeated comparing high-scoring clinics to other clinics within each of the six attribute categories in order to estimate the value of a high score in each individual attribute.
Data Two main data sources were used in this analysis. The categories of service utilization and expenditure data (APAC) are described in detail in Appendix 1. The APAC data was merged with scores for the six PCPCH attributes comprising the 2014 recognition criteria, which were provided by Oregon Health Authority for clinics receiving program recognition between January 2014 and March 2016. A small number of clinics were dropped from the analysis when an exact match could not be identified, yielding a final sample of 5,804 PCPCH and 100,328 non-PCPCH billing units.
Access13%
Accountability
18%
Comprehensive16%
Continuous17%
Coordinated25%
Person Centered
11%
Figure 1: Source of Maximum Available Points

45
Using these data, the PCPCH clinics were segmented and variables were constructed identifying high-scoring (at or above the 75th percentile) and lower-scoring clinics for each attribute and for total high score on the 18 core attributes. The PCPCH clinics were also segmented into “exemplary” and “other”, with exemplary status assigned to the twenty clinics included in the qualitative phase of this study. All study results were estimated using STATA 14.
Clinic Scores on PCPCH Attributes Tables 1-3 below provide patterns and distributions for the six attribute scores within the 20 exemplary clinics (where interviews were conducted), top-quartile scoring, and all other PCPCH clinics recognized between January 2014 and March 2016.
Table 1: Comparison of Mean Attribute Scores and % of Available Points Earned
Twenty Exemplary Clinics
Top Scoring Clinics All Other Clinics
Mean Scores
% of Maximum
Points Earned
Mean Scores
% of Maximum
Points Earned
Mean Scores
% of Maximum
Points Earned
Access 42.75 86% 40.11 80% 32.14 64%
Accountability 46.25
66% 49.25
70% 23.25 33%
Comprehensive 52.25
87% 51.90
87% 33.99 57%
Continuous 56.00
86% 56.23
87% 44.59 67%
Coordinated 89.25
94% 85.37
90% 48.07 51%
Patient-Centered 31.00 78% 29.40 74% 19.06 48%
Total Score 317.50 84% 312.28 82% 201.11 53%
The twenty exemplary clinics interviewed for the qualitative arm of this evaluation were selected to reflect high scoring PCPCH clinics in general. To confirm this, Table 1 compares mean scores on the six attributes for the exemplary clinics to all clinics above the 75th percentile in the 18 core standards, and to all other PCPCH clinics. Exemplary clinics outperformed the top quartile of clinics on four of the attributes and underperformed slightly on two attributes. The mean total score for the exemplary clinics was slightly higher than the mean score for the top quartile of clinics. In other words, exemplary status was defined by strong cumulative scores across the PCPCH attributes, as well as within the attributes. The scores of the twenty exemplary clinics make them an appropriate proxy for high scoring PCPCHs overall, providing validity to the qualitative findings presented in this report. Table 1 also compares mean attribute scores of all high scoring clinics against other PCPCHs to assess where high scorers show the greatest relative strength on the PCPCH point scale. Clinics scoring high on total points could hypothetically be achieving high scores through better-than-average scores across all attributes, or by particularly strong scores in attributes worth the most points coupled with average or

46
even weak scores on the attributes with fewer possible points. Table 1 shows that, compared with other PCPCHs, mean attribute scores were higher for all six attributes among high scoring PCPCH clinics. In absolute terms, high scoring clinics most strongly outperformed in the Coordination attribute, scoring on average 37 points higher than other clinics. High scoring clinics are achieving 90% of all possible points toward this attribute while other clinics averaged just 51% of available points. However, because the attributes are not equivalent in their maximum possible points (Coordination is the highest-value attribute), absolute point differences would be expected to be larger for attributes worth more possible points. In relative terms, the largest difference in scores is actually shown in the Accountability attribute, with the top quartile of clinics scoring, on average, 112% higher than the lower three quartiles of clinics. Notably, the Accountability attribute is where both high scoring and other PCPCH clinics are earning the fewest of possible points. High scoring clinics earn 70% of the available points within this attribute, while other clinics are averaging just 33%. While high scoring clinics are relatively exceptional on this attribute by a wide margin, they still appear to be struggling more here than with the other attributes. This is also true of the exemplary clinics. The smallest difference in absolute points between high scoring and other PCPCHs was within the Access attribute, with top quartile clinics scoring 8 points higher on average. This smaller gap is primarily due to strong scores among lower quartile clinics, which earn on average 64% of all possible Access points, while high scoring clinics earn 80%. This adds strength to a theme from the qualitative findings: clinics perceive the Access attribute as the easiest attribute to achieve. The smallest relative difference in scores is also within the Access attribute, with the top quartile of clinics scoring on average 24% higher than all other clinics. High scoring clinics earned 80% of points possible in this category while other clinics averaged 64%. Mean scores provide a helpful snapshot of average performance within a group, but it is also useful to understand where scores vary most and least within these groups. Since there are differences in the available points across attributes, and because points are often awarded cumulatively as clinics meet increasingly stringent criteria for standards within the attributes, it might be expected that high scoring clinics are those that do well in attributes with the most available points. This is also useful for understanding where clinics may be struggling the most to advance within attributes.
Table 2: High Scoring Clinics’ Scores on Attributes by Decreasing Point Value
Clinics Below 25th Percentile
within Attribute
Clinics Between 25th-75th Percentile
within Attribute
Clinics Above 75th Percentile within
Attribute
Coordination (95 points) 0 28 (21%) 106 (79%)
Accountability (70 points) 3 (2%) 28 (21%) 103 (77%)
Continuous (65 points) 12 (9%) 66 (49%) 56 (42%)
Comprehensive (60 points) 0 60 (45%) 74 (55%)
Access (50 points) 15 (11%) 62 (46%) 57 (43%)
Person-Centered (40 points) 12 (9%) 70 (52%) 52 (39%)
Table 2 above presents the range of scores on individual attributes (presented in order of decreasing point value) among the highest scoring quartile of clinics. This analysis investigates whether high scoring clinics are more consistently high scoring in attributes worth more points than in attributes worth fewer points. There is some evidence that high scoring clinics outperform on higher value attributes: nearly all high scoring clinics (79%) also achieved high values in the Coordination attribute, worth 95 points, and

47
no high scoring clinics were in the bottom percentile on this attribute. As attributes decrease in point value, the proportion of clinics achieving high status in each attribute also falls. Only 39% of high scoring clinics were also high scoring on the Person and Family Centered Care attribute, worth the fewest points, and 9% scored in the bottom percentile of PCPCHs on this attribute. This pattern is also evident among the twenty exemplary clinics. Table 3 below presents the range of scores on individual attributes among the twenty exemplary clinics. Ninety-five percent of exemplary clinics were in the top quartile of scores for the Coordination attribute, worth the most possible points, and none were in the lowest quartile. Meanwhile 50% of exemplary clinics were in the top quartile for Person-Centered, the attribute worth the fewest points, while 15% were in the bottom quartile. This suggests that high scoring PCPCH clinics may be influenced by the relative weight of each attribute toward total points.
Table 3: Exemplary Clinics’ Scores on Attributes by Decreasing Point Value
Below 25th Percentile
Between 25th-75th Percentile
Above 75th Percentile
Coordination (95 points) 0 1 (5%) 19 (95%)
Accountability (70 points) 2 (10%) 4 (20%) 14 (70%)
Continuous (65 points) 1 (5%) 11 (55%) 8 (40%)
Comprehensive (60 points) 0 9 (45%) 11 (55%)
Access (50 points) 3 (15%) 3 (15%) 14 (70%)
Person-Centered (40 points) 3 (15%) 7 (35%) 10 (50%)
Relationships Among PCPCH Attribute Scores Interviews with exemplary clinics revealed perceptions that implementation of standards within certain attributes supported or impeded implementation of standards within other attributes. To test this, principal factors analysis was performed on all available PCPCH attribute scores using STATA’s factor command to identify whether there are distinct groupings of attributes that tend to rise and fall in alignment with one another. This is useful for exploring when scores within one category may be influencing scores within other categories as well as overall. Factor analysis on combinations of the six attribute scores revealed that scores on all attributes moved together in the same direction7. In other words, as clinics’ scores increased in any one PCPCH attribute, they tended to also increase to varying degrees across the other attributes. In no case are there inverse relationships among attributes. This is noteworthy because some clinics perceive tension and conflicting goals within attributes that make it difficult to achieve high scores across categories. We did not observe, for instance, that when scores in the Access attribute are strong, scores in the Continuity attribute fall. Nor did we observe that scores on the Accountability attribute are inversely related to scores on the Person-Centered attribute (in fact, they move quite strongly together).
7 Factor analysis revealed one significant factor of eigenvalue=2.39.

48
Table 4: Factor Loadings and Unique Variables
Attribute Factor Loadings Uniqueness
Access 0.5624 0.5729
Accountability 0.7071 0.4636
Comprehensive 0.6290 0.5385
Continuity 0.3328 0.8434
Coordination 0.7306 0.4413
Person-Centered 0.7309 0.4214
Table 4 above presents factor loadings (measuring the degree of relatedness) and corresponding uniqueness of clinics’ scores on each of the individual attributes. As PCPCH scores increase, higher factor loadings indicate that the Person-Centered, Coordination and Accountability attributes are strongly aligned, with slightly less alignment with the Comprehensive, Continuity and Access attribute scores. Lack of alignment of the Access and Continuity attributes with other attributes may be due to the fact that scores in these categories are generally high among all PCPCHs, with relatively smaller variation between high scoring and other clinics. Clinics may be attaining these attributes early in the recognition process with less opportunity for advancement. Scores in the Comprehensive attribute are more varied among PCPCHs however; the lesser degree of alignment in this attribute as clinics attain higher scores may suggest a somewhat greater degree of difficulty in implementation or specific challenges that arise as clinics achieve high scores in the other attributes. Notably, Continuity is the most unique among the attributes. While Continuity scores generally move in the direction of the other attributes as total PCPCH score rises, they do so to a much smaller degree, suggesting that if there are synergistic effects on scores when clinics implement the attributes together, these synergies are having less impact on successful implementation of the Continuity standards.
Table 5: Frequency of High Attribute Score with Total High Score
Attributes Top Quartile Clinics All Other Clinics
Access 52% 48%
Accountability 82% 18%
Comprehensive 76% 24%
Continuity 44% 56%
Coordination 82% 18%
Person-Centered 87% 13%
The uniqueness of the Continuity attribute is further reflected in which clinics are high scoring for this attribute. Table 5 above presents a comparison of how frequently clinics with high scores for overall points are also achieving high scores in the six attribute categories. Less than half (44%) of high scoring clinics for overall points also scored high on the Continuity attribute. In fact, clinics that were not high scoring overall were actually more frequently high scoring in Continuity (56%). By contrast, 87% of high scoring clinics were also high scoring on the Person-Centered attribute, compared with 13% of low scoring clinics. While earlier tables indicated that clinics’ scores on the Continuity attribute are not poor overall, those averages mask a discrepancy: clinics are more often falling into one of two groups, scoring well on Continuity and Access, or on the other four attributes.

49
Combined with the factor analysis, these results suggest that, overall, implementation of the six individual attributes tends to lift total PCPCH scores without penalizing scores on other attributes. As scores increase in one attribute, they tend to increase in the others. Specifically, the Accountability, Comprehensiveness, Coordination and Person-Centered attributes appear to operate together in ways that support strong scores across all four categories. However, there is some evidence that, to the extent that exemplary PCPCH performance is defined by high total scores, this success is characterized primarily by exceptional scores in these four attributes and less so by scores in Continuity (which are less consistent even among high scoring clinics) and by Access, which seems fairly easily attained by most clinics. In fact, as clinics reach high scores in the other four attributes, they may reach an upper limit in their ability to implement the Continuity attribute.
Effect of High PCPCH Score on Service Utilization and Expenditures To assess the relationship between PCPCH scores and service cost and utilization, the difference-in-difference method employed in Appendix 1 was replicated below for clinics earning PCPCH recognition on or before September 2014. This analysis compares cost and utilization outcomes in high scoring PCPCH clinics (above the 75th percentile for total points on the 18 core standards) with outcomes of all other PCPCHs below that threshold to assess whether there are measurable differences in performance that manifest as clinics achieve higher scores within attributes.
Table 6: Performance of High Scoring PCPCH Clinics Relative to Other PCPCHs
Per Person Costs Per User Costs Utilization
Primary Care Services 4.72% + 1.43% 2.03%
Primary Care Visits 7.80% * 3.22% 2.93% +
Specialty Care Services -1.91% -2.78% 1.93%
Mental Health Services 28.59% + 16.23% 1.33%
Radiology Services -0.41% -2.87% -2.33%
Laboratory Services -2.76% -1.59% -1.08%
Emergency Department 1.38% -8.13% ** 10.18% +
Inpatient Services 3.25% -12.98% * 4.38%
All Non-Pharmacy Services 0.38% -0.59% 0.74%
Pharmacy -3.37% 0.11% -3.48% *
All Services -0.27% -0.85% 0.39% p<.1=+, p<.05=*, p<.01=**, p<.001=***
Table 6 presents the estimated difference in the pre- to post- change between high scoring clinics and all other clinics, or the “difference-in-difference” between the two groups over time. Since the practical significance of these differences depends on the initial levels of service use or expenditure, the relative rate of change is provided, effectively adjusting the absolute magnitude of change to take into account the baseline levels of service use or expenditure. The rates of change estimates can be compared across service types. Four differences in service use and expense stand out in terms of statistical significance: primary care, emergency department, inpatient services and pharmacy claims. Differences approaching statistical significance were also noted in mental health services.

50
High-scoring clinics’ total expenditures on primary care visits were 7.8% higher than lower scoring PCPCHs. This was accompanied by a marginally significant 2.9% increase in utilization of primary care visits and a marginally significant 4.7% increase in the total cost of primary care services and procedures. Overall, these results suggest high scoring clinics are increasing their expenditures on primary care visits at rates that are significantly higher than what is seen in other PCPCH clinics, and utilization of these visits is also trending upward. The cost of emergency department services was 8.13% lower per user in high scoring clinics but offset by a marginally significant 10.18% increase in emergency department utilization, resulting in a small uptick in total emergency department expenditures. No differences were noted in utilization rates of inpatient services (i.e. hospital admissions), or in total cost of inpatient care, but high scoring clinics’ cost per user of inpatient services decreased 12.98%. There was no difference noted in pharmacy expenditures, but high scoring clinics did demonstrate a statistically significant 3.4% decrease in pharmacy claims. Coupled with the increase in primary care visit expenditures, this suggests that high scoring clinics may be prioritizing other types of care during primary visits. A large (28.6%) increase in total mental health expenditures was noted in high scoring clinics, but this measurement did not meet statistical significance. No differences in utilization of specialty care, diagnostic or inpatient services were noted in high scoring clinics relative to other PCPCHs. To the extent that high scoring clinics are reducing the cost of care in emergency departments and inpatient stays, this appears to be related to increasing expenditures on visits with primary care and mental health providers rather than other service types, a finding that is consistent with the interviews with exemplary clinics.
Effect of PCPCH Attributes on Cost and Utilization While clinics implement attributes simultaneously and each attribute clearly has implications for other attributes, it is likely that each attribute contributes different effects to the overall outcomes seen in high scoring clinics. The discussion below explores whether high scores on specific attributes result in effects that are distinct from the effect of high PCPCH scores as a whole. The tables below present the estimated difference in the pre- to post- change between high-scoring clinics (above the 75th percentile) and all other clinics for that specific attribute, or the “difference-in-difference” between the two groups over time. Because factor analysis indicated that the PCPCH attributes move together, we control for whether a clinic also had a total high PCPCH score (i.e., was high-scoring on other attributes that may also be influencing the observed difference). Total high score is used rather than controlling for individual attributes because of the high degree of correlation among the attributes. With very few exceptions, the effect of high scores on individual attributes does not appear to affect service utilization or cost outcomes in ways that are distinct from the effect of a total high PCPCH score. While differences were noted, these differences largely disappeared after controlling for high overall PCPCH score on the 18 core standards. This is consistent with previous findings that the attribute scores are complementary and move together; the same is true for attribute effects. Where differences remain, they are discussed below. These differences can be interpreted as independent effects of implementation of a specific PCPCH attribute rather than an effect of the attributes together. In practice, attributes are not implemented in isolation, but these analyses provide information regarding how scores on individual attributes may be contributing to clinics’ observed changes in patterns of service utilization and cost.

51
Attribute 1: Access to Care We hypothesized that high-scoring clinics on the Access attribute would exhibit higher utilization of, and expenditures for, primary care services, as barriers to care were reduced and patients became more likely to be seen in the clinic. We further hypothesized that high-scoring clinics would exhibit lower expenditures and utilization of emergency department services as patients were more effectively redirected away from the ED for urgent care. Table 7 below presents selected results of the net effects of the Access attribute on patterns of use and expenditure. Contrary to our hypotheses, we observed no statistically significant differences in utilization rates or costs of primary care or emergency department services in clinics with high scores on the Access attribute when compared to other PCPCH clinics.
Table 7: Performance of High-Scoring Clinics (Access Attribute) Relative to Other PCPCHs
Per Person Costs Per User Costs Utilization
Primary Care Services 0.26% 0.80% -0.97%
Primary Care Visits 2.32% 4.22% -2.73%
Specialty Care Services 8.45% + -0.25% 7.62%
Mental Health Services -18.76% -10.74% -5.90%
Radiology Services 4.98% 2.59% 0.85%
Laboratory Services -2.87% -0.90% -2.98%
Emergency Department 5.19% 1.31% 7.84%
Inpatient Services -2.73% -5.79% 4.00%
All Non-pharmacy Services 2.04% 0.58% 0.36%
Pharmacy -2.79% -2.18% -2.11%
All Services 1.22% 0.36% 0.27% p<.1=+, p<.05=*, p<.01=**, p<.001=***
We observed an unanticipated and marginally statistically significant difference in cost of specialty care services. High-scoring clinics’ total expenditure on specialty care was 8.45% higher, accompanied by an increase in utilization and a slight decrease in cost per user of specialty services. Patients at clinics with high scores on the Access attribute are more likely to be utilizing specialty care services, though at similar per user cost to other clinics. Overall, clinics with high scores on the Access attribute exhibited no significant differences from other PCPCHs in total service utilization or cost of care after controlling for the overall effect of being a high scoring PCPCH. Attribute 2: Accountability We hypothesized that high-scoring clinics on the Accountability attribute would exhibit higher utilization of and expenditures for primary care and laboratory services, as clinics optimized provision of services following implementation of tracking and reporting on clinic performance metrics. We predicted no other differences among higher and lower-scoring clinics.
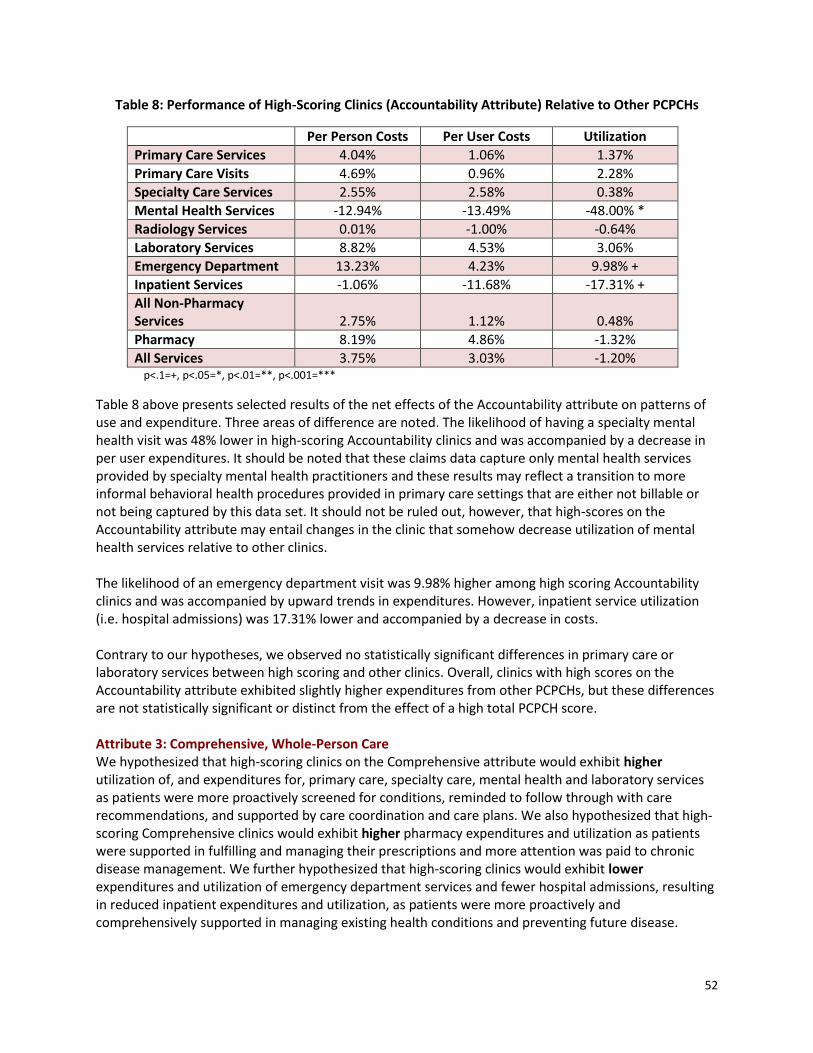
52
Table 8: Performance of High-Scoring Clinics (Accountability Attribute) Relative to Other PCPCHs
Per Person Costs Per User Costs Utilization
Primary Care Services 4.04% 1.06% 1.37%
Primary Care Visits 4.69% 0.96% 2.28%
Specialty Care Services 2.55% 2.58% 0.38%
Mental Health Services -12.94% -13.49% -48.00% *
Radiology Services 0.01% -1.00% -0.64%
Laboratory Services 8.82% 4.53% 3.06%
Emergency Department 13.23% 4.23% 9.98% +
Inpatient Services -1.06% -11.68% -17.31% +
All Non-Pharmacy Services 2.75% 1.12% 0.48%
Pharmacy 8.19% 4.86% -1.32%
All Services 3.75% 3.03% -1.20% p<.1=+, p<.05=*, p<.01=**, p<.001=***
Table 8 above presents selected results of the net effects of the Accountability attribute on patterns of use and expenditure. Three areas of difference are noted. The likelihood of having a specialty mental health visit was 48% lower in high-scoring Accountability clinics and was accompanied by a decrease in per user expenditures. It should be noted that these claims data capture only mental health services provided by specialty mental health practitioners and these results may reflect a transition to more informal behavioral health procedures provided in primary care settings that are either not billable or not being captured by this data set. It should not be ruled out, however, that high-scores on the Accountability attribute may entail changes in the clinic that somehow decrease utilization of mental health services relative to other clinics. The likelihood of an emergency department visit was 9.98% higher among high scoring Accountability clinics and was accompanied by upward trends in expenditures. However, inpatient service utilization (i.e. hospital admissions) was 17.31% lower and accompanied by a decrease in costs. Contrary to our hypotheses, we observed no statistically significant differences in primary care or laboratory services between high scoring and other clinics. Overall, clinics with high scores on the Accountability attribute exhibited slightly higher expenditures from other PCPCHs, but these differences are not statistically significant or distinct from the effect of a high total PCPCH score. Attribute 3: Comprehensive, Whole-Person Care We hypothesized that high-scoring clinics on the Comprehensive attribute would exhibit higher utilization of, and expenditures for, primary care, specialty care, mental health and laboratory services as patients were more proactively screened for conditions, reminded to follow through with care recommendations, and supported by care coordination and care plans. We also hypothesized that high-scoring Comprehensive clinics would exhibit higher pharmacy expenditures and utilization as patients were supported in fulfilling and managing their prescriptions and more attention was paid to chronic disease management. We further hypothesized that high-scoring clinics would exhibit lower expenditures and utilization of emergency department services and fewer hospital admissions, resulting in reduced inpatient expenditures and utilization, as patients were more proactively and comprehensively supported in managing existing health conditions and preventing future disease.

53
Table 9: Performance of High-Scoring Clinics (Comprehensive Attribute) Relative to Other PCPCHs
Per Person Costs Per User Costs Utilization
Primary Care Services -2.10% -2.65% -0.61%
Primary Care Visits -2.21% -2.97% -0.23%
Specialty Care Services 4.42% 3.34% -3.98%
Mental Health Services 27.62% + 22.28% 2.26%
Radiology Services -2.58% -3.72% 1.40%
Laboratory Services -10.81% + -5.04% -0.42%
Emergency Department -3.12% -14.34% ** 7.14%
Inpatient Services -4.29% -8.45% 3.97%
All Non-Pharmacy Services -2.77% -2.58% -1.10%
Pharmacy 9.76% * 12.25% * -2.12%
All Services -0.32% 0.09% -0.82% p<.1=+, p<.05=*, p<.01=**, p<.001=***
Table 9 presents results of the net effects of the Comprehensive attribute on patterns of use and expenditure. As expected, high-scoring Comprehensive clinics’ total expenditures on mental health were 27.62% higher, a marginally significant difference from other clinics that was accompanied by a slight increase in utilization of mental health services. High scoring clinics also exhibited statistically significant increases in pharmacy expenditures (both per user and total costs) compared with other clinics, though this was accompanied by a slight decrease in pharmacy claims. Meanwhile total expenditures on laboratory services were 10.81% lower and accompanied by a slight decrease in total utilization. There was an unexpected upward trend in utilization of emergency department services; however, this increase was accompanied by a statistically significant 14.34% decrease in cost per user of these services, resulting in lower total emergency department expenditures. Contrary to our hypothesis, we observed no statistically significant decreases in use or cost of inpatient services compared with other clinics. We observed no differences in use or cost of primary or specialty care services. Overall, clinics with high scores on the Comprehensive attribute exhibit slightly downward trends in cost and utilization of most services that is offset by an upward trend in pharmacy costs, resulting in no overall differences when compared with other PCPCH clinics. Attribute 4: Continuity We hypothesized that high-scoring clinics on the Continuity attribute would exhibit higher utilization of, and expenditures for, primary care and specialty care services as patients were supported by teams who more proactively managed transitions in care and information exchange among care providers. We also hypothesized that high-scoring Continuity clinics would demonstrate higher pharmacy expenditures and utilization as clinics more proactively managed prescription refills and reconciled medications during transitions in care.
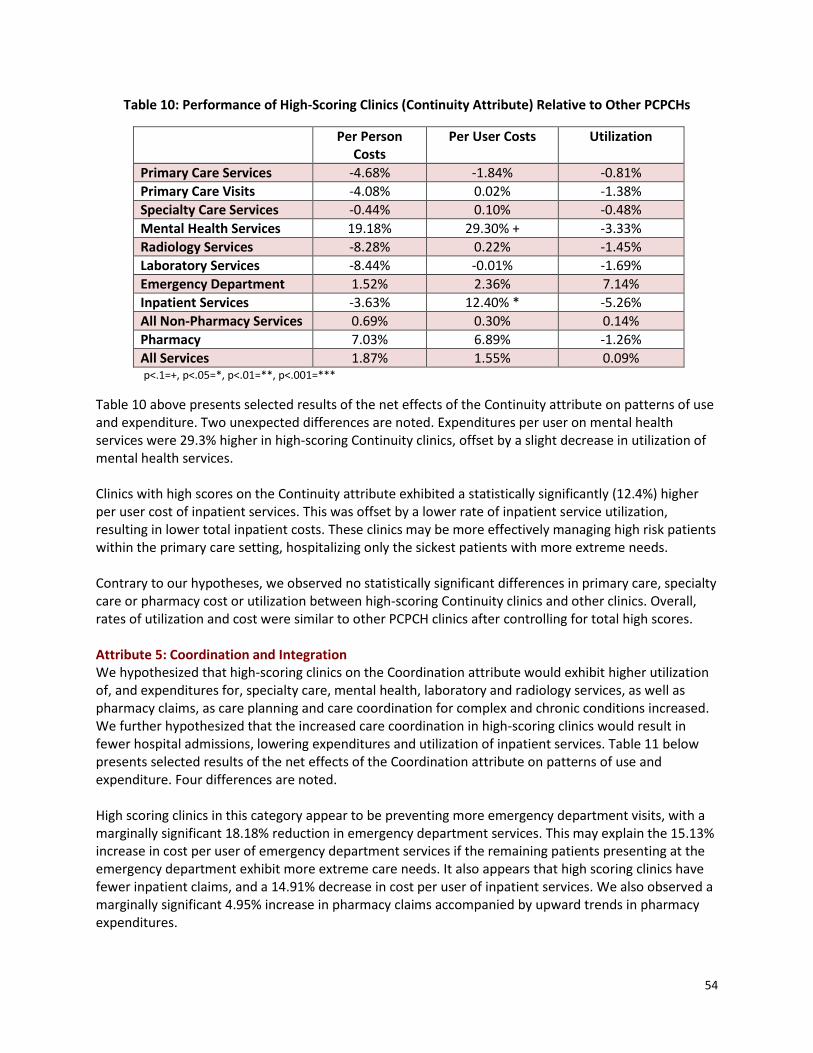
54
Table 10: Performance of High-Scoring Clinics (Continuity Attribute) Relative to Other PCPCHs
Per Person Costs
Per User Costs Utilization
Primary Care Services -4.68% -1.84% -0.81%
Primary Care Visits -4.08% 0.02% -1.38%
Specialty Care Services -0.44% 0.10% -0.48%
Mental Health Services 19.18% 29.30% + -3.33%
Radiology Services -8.28% 0.22% -1.45%
Laboratory Services -8.44% -0.01% -1.69%
Emergency Department 1.52% 2.36% 7.14%
Inpatient Services -3.63% 12.40% * -5.26%
All Non-Pharmacy Services 0.69% 0.30% 0.14%
Pharmacy 7.03% 6.89% -1.26%
All Services 1.87% 1.55% 0.09% p<.1=+, p<.05=*, p<.01=**, p<.001=***
Table 10 above presents selected results of the net effects of the Continuity attribute on patterns of use and expenditure. Two unexpected differences are noted. Expenditures per user on mental health services were 29.3% higher in high-scoring Continuity clinics, offset by a slight decrease in utilization of mental health services. Clinics with high scores on the Continuity attribute exhibited a statistically significantly (12.4%) higher per user cost of inpatient services. This was offset by a lower rate of inpatient service utilization, resulting in lower total inpatient costs. These clinics may be more effectively managing high risk patients within the primary care setting, hospitalizing only the sickest patients with more extreme needs. Contrary to our hypotheses, we observed no statistically significant differences in primary care, specialty care or pharmacy cost or utilization between high-scoring Continuity clinics and other clinics. Overall, rates of utilization and cost were similar to other PCPCH clinics after controlling for total high scores. Attribute 5: Coordination and Integration We hypothesized that high-scoring clinics on the Coordination attribute would exhibit higher utilization of, and expenditures for, specialty care, mental health, laboratory and radiology services, as well as pharmacy claims, as care planning and care coordination for complex and chronic conditions increased. We further hypothesized that the increased care coordination in high-scoring clinics would result in fewer hospital admissions, lowering expenditures and utilization of inpatient services. Table 11 below presents selected results of the net effects of the Coordination attribute on patterns of use and expenditure. Four differences are noted. High scoring clinics in this category appear to be preventing more emergency department visits, with a marginally significant 18.18% reduction in emergency department services. This may explain the 15.13% increase in cost per user of emergency department services if the remaining patients presenting at the emergency department exhibit more extreme care needs. It also appears that high scoring clinics have fewer inpatient claims, and a 14.91% decrease in cost per user of inpatient services. We also observed a marginally significant 4.95% increase in pharmacy claims accompanied by upward trends in pharmacy expenditures.
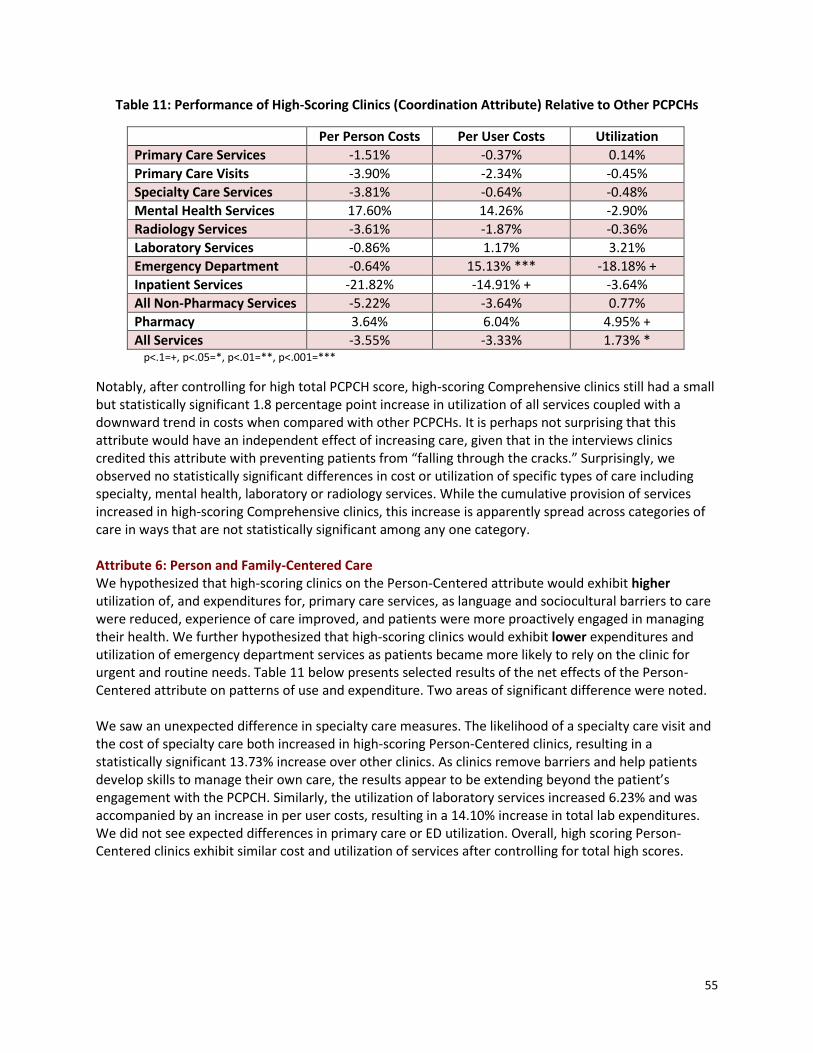
55
Table 11: Performance of High-Scoring Clinics (Coordination Attribute) Relative to Other PCPCHs
Per Person Costs Per User Costs Utilization
Primary Care Services -1.51% -0.37% 0.14%
Primary Care Visits -3.90% -2.34% -0.45%
Specialty Care Services -3.81% -0.64% -0.48%
Mental Health Services 17.60% 14.26% -2.90%
Radiology Services -3.61% -1.87% -0.36%
Laboratory Services -0.86% 1.17% 3.21%
Emergency Department -0.64% 15.13% *** -18.18% +
Inpatient Services -21.82% -14.91% + -3.64%
All Non-Pharmacy Services -5.22% -3.64% 0.77%
Pharmacy 3.64% 6.04% 4.95% +
All Services -3.55% -3.33% 1.73% * p<.1=+, p<.05=*, p<.01=**, p<.001=***
Notably, after controlling for high total PCPCH score, high-scoring Comprehensive clinics still had a small but statistically significant 1.8 percentage point increase in utilization of all services coupled with a downward trend in costs when compared with other PCPCHs. It is perhaps not surprising that this attribute would have an independent effect of increasing care, given that in the interviews clinics credited this attribute with preventing patients from “falling through the cracks.” Surprisingly, we observed no statistically significant differences in cost or utilization of specific types of care including specialty, mental health, laboratory or radiology services. While the cumulative provision of services increased in high-scoring Comprehensive clinics, this increase is apparently spread across categories of care in ways that are not statistically significant among any one category. Attribute 6: Person and Family-Centered Care We hypothesized that high-scoring clinics on the Person-Centered attribute would exhibit higher utilization of, and expenditures for, primary care services, as language and sociocultural barriers to care were reduced, experience of care improved, and patients were more proactively engaged in managing their health. We further hypothesized that high-scoring clinics would exhibit lower expenditures and utilization of emergency department services as patients became more likely to rely on the clinic for urgent and routine needs. Table 11 below presents selected results of the net effects of the Person-Centered attribute on patterns of use and expenditure. Two areas of significant difference were noted. We saw an unexpected difference in specialty care measures. The likelihood of a specialty care visit and the cost of specialty care both increased in high-scoring Person-Centered clinics, resulting in a statistically significant 13.73% increase over other clinics. As clinics remove barriers and help patients develop skills to manage their own care, the results appear to be extending beyond the patient’s engagement with the PCPCH. Similarly, the utilization of laboratory services increased 6.23% and was accompanied by an increase in per user costs, resulting in a 14.10% increase in total lab expenditures. We did not see expected differences in primary care or ED utilization. Overall, high scoring Person-Centered clinics exhibit similar cost and utilization of services after controlling for total high scores.

56
Table 12: Performance of High-Scoring Clinics (Person-Centered Attribute) Relative to Other PCPCHs
Total Costs Per User Costs Utilization
Primary Care Services 4.97% 3.33% 0.20%
Primary Care Visits 3.67% 2.98% -0.91%
Specialty Care Services 13.73% * 6.87% + 11.44% +
Mental Health Services -1.83% -14.48% 8.57%
Radiology Services 4.34% 1.61% 0.36%
Laboratory Services 14.10% * 7.62% 6.23% **
Emergency Department 7.56% -0.41% 1.89%
Inpatient Services 5.05% 3.63% 4.17%
All Non-Pharmacy Services 2.42% 1.37% 1.07%
Pharmacy -2.18% -1.95% -0.42%
All Services 1.63% 1.20% 0.54% p<.1=+, p<.05=*, p<.01=**, p<.001=***
Limitations There are a number of potential limitations inherent in the study design that should be considered. As factor analysis revealed, because the six attributes move together, isolating the effect of individual attributes on cost and utilization measures is difficult. Among PCPCH clinics, it is rare to perform well on a single attribute and poorly on the others. Different analytic approaches exploring the interaction effects in more detail may yield different results. It is also important to note that that “difference-in-differences” measures the difference between the trajectories of high-scoring PCPCH clinics and other clinics, not the absolute trajectory of either group. For example, if primary care expenditures are rising among all clinics, they would need to rise faster among high-scoring PCPCHs to show as an increase in this analysis. Conversely, if primary care expenditures among high-scoring PCPCHs were rising, but rising more slowly than other clinics, that would manifest as a decrease; yet it would be inappropriate to say costs were falling. Similar trajectories between both groups would manifest as no difference. This analysis does not provide conclusions about the absolute change in cost or utilization among these clinics, only how they differ across groups. Finally, because the PCPCH attestation relies on self-reported implementation of the program’s standards, there is the potential for error within the scoring process itself. Attesting clinics are randomly selected for site visits at which point applications are verified, but these represent a small portion of all PCPCH clinics.
Conclusions The intent of this analysis was to identify whether and to what extent service use patterns and expenditures changed for patients served in PCPCHs with high scores on the individual attributes compared to other clinics. The analysis indicates that, in most cases, while the PCPCH attributes clearly influence cost and utilization measures, they rarely do so in ways that are independent and can be attributed to a specific attribute; the cumulative effect of the PCPCH attributes has more impact than the independent effects. In one notable exception, the Coordination attribute appears to increase provision of care overall, with downward trends in associated costs. This corroborates themes from the qualitative portion of this analysis, which noted that clinics cite care coordination as dramatically improving care for patients with complex needs.
57
Not surprisingly, there are significant interactive effects of the attributes when they are implemented together that are likely very different than the results that would emerge if each attribute were implemented and evaluated in isolation. While high scores on each of the six attributes in isolation yields inconsistent and sometimes unintended outcomes, in combination these attributes act to gradually shift provision of care upward and simultaneously reduce costs when compared to lower-scoring PCPCH clinics. Overall, these results suggest that the PCPCH program’s current approach to awarding tier recognition on the basis of total points rather than minimum points within each attribute category is effective. As well, the results suggest that future evaluation could yield additional insights into ways that the attributes interact to amplify or mute changes in cost and utilization measures that would otherwise be observed if specific attributes were implemented in isolation.

58
Appendix 3
Qualitative Findings from Exemplary PCPCH Clinics: Aim 1 of the Phase 3 Evaluation
Prepared by: Sherril Gelmon, DrPH Billie Sandberg, PhD
Shauna Petchel, MPH Nicole Bouranis, MA
OHSU & PSU School of Public Health and Mark O. Hatfield School of Government
Portland State University
September 2016

59
Background and Study Design Aim 1 of Phase 3 of this evaluation is to articulate elements of "exemplary practice" through a case study of a select group of the highest scoring clinics. The PSU research team selected recognized clinics for inclusion in the case study by reviewing a master list of the 408 clinics recognized as PCPCHs under the 2014 standards as of December 2014, and identifying the 70 highest ranked PCPCH clinics based upon application scores, three-star designation criteria, composite attribute scores, site visit findings (when available), and PCPCH program staff assessments. The PSU research team developed protocols for the selection and assessment of the clinics, which were then reviewed and approved by the PSU Institutional Review Board (IRB). In order to solicit participation in the study, a member of the PSU team initially contacted clinics via email and then followed up by telephone and email. In some cases, clinics agreed or declined quickly; in others, several months went by before receiving a definitive response. As a result, the process of selection of study clinics took longer than anticipated. The original intent was to identify up to 30 exemplary clinics that would be representative of the entire population of recognized PCPCH clinics. Where multiple clinics or sites within a single organization were recognized as PCPCHs, the top-ranked clinic was invited to participate; if it declined, the next highest ranked clinic within that organization was invited, in order to avoid duplication by organizational entity. A comparable substitution strategy was used based upon other organizational variables, rather than simply working down the list by ranking. Ultimately, 20 exemplary PCPCH clinics participated in this evaluation, with diverse representation based upon geographic location, size, ownership, and clinic specialty.8 In addition, the included clinics were not known to be experiencing organizational or leadership instability. Table 1 illustrates the distribution of selected clinics.
Table 1: Characteristics and Distribution of 20 Exemplary Clinics
Geography Size (FTE) Ownership/ Affiliation
Practice Specialty
Region
5 – Rural 1 – 0-2 FTE primary practitioners
12– Independent, unaffiliated with any other practice
14* – Family Medicine
11 – Columbia Willamette
4 – Urban Small
4 – 3-5 FTE primary practitioners
1 – Independent governance; part of an alliance (for economies of scale)
3* – Internal Medicine
2 – Cascades East
6 – Urban Medium
5 – 6-9 FTE primary practitioners
7 – Owned by a larger system
4 – Pediatrics 6 – Oregon Pacific
5 – Urban Large
10 – 10 or more FTE primary practitioners
1 – Northeast Oregon
*1 clinic identified as both Family Medicine and Internal Medicine
8 As noted in Appendix 2, PCPCH program scores rely on self-reported clinic data that is verified by program staff through random site visits during the attestation process. Among the twenty clinics interviewed, four had previously received a site visit from OHA to verify the accuracy of their attested implementation of the PCPCH standards.

60
Once a clinic’s leaders agreed to participate, a member of the PSU team conducted a prescreening telephone interview with a clinic representative, typically the clinic manager. Based upon information gathered during the prescreening interview, the evaluation team worked with the clinic to set up a time to conduct on-site interviews with administrative and clinical leaders, and, if feasible, a focus group with other key staff involved in the PCPCH process. All prescreening interviews, on-site interviews, and focus groups were recorded and transcribed. Transcriptions were stripped of all identifiers and then assigned an identification number to remove the possibility of identifying a clinic and to ensure the confidentiality of the respondents’ identities. Research assistants were trained to use Atlas.ti qualitative software to code the transcripts. The transcripts were individually coded by two researchers (double-blind coding); the results were then reconciled by a third researcher to ensure the validity of analysis.
Results of the Qualitative Analysis The following narrative presents results from an extensive review and analysis of the transcripts of the interviews and focus groups conducted with clinic personnel. This discussion builds upon and adds to the preliminary analysis presented in the Interim Report9, submitted to OHA in February 2016. The first part of the discussion presents themes synthesized from the findings that are applicable across all six attributes of the Oregon PCPCH program. This is followed by discussion of key themes specific to each of the six attributes. In many cases, clinics utilized interview time to discuss barriers they encountered while implementing the PCPCH program or challenges they are still experiencing. We have noted these challenges along with instances of breakthroughs, solutions, and promising practices that these exemplary clinics have utilized successfully. The report concludes with a summary of the key themes raised in this report, based on the perspectives shared.
Cross-Cutting Themes Throughout the dozens of interviews and focus groups conducted with the twenty exemplary clinics, several overarching themes were identified that are applicable across the six PCPCH attributes. These findings are organized using the four levels defined in Donald M. Berwick’s10 framework for the redesign of the U.S. health care system, which serve as the foundation for the Triple Aim: (1) the environment of laws, rules, payment, accreditation, and professional training that shapes organizational action; (2) the organizations that house and support microsystems; (3) the small operating units or “microsystems” that actually provide care to the patient; and, (4) the patient experience. Table 2 provides a guide for understanding the cross-cutting themes as organized by Berwick’s larger categories.
9 Gelmon, S.B., Sandberg, B., Petchel, S. and Bouranis, N. (February 2016). Insights from exemplary practices: Evaluation of the implementation of Oregon’s Patient-Centered Primary Care Home (PCPCH) Program. Interim Report. Portland, OR: Portland State University. 10 Berwick, 2002.
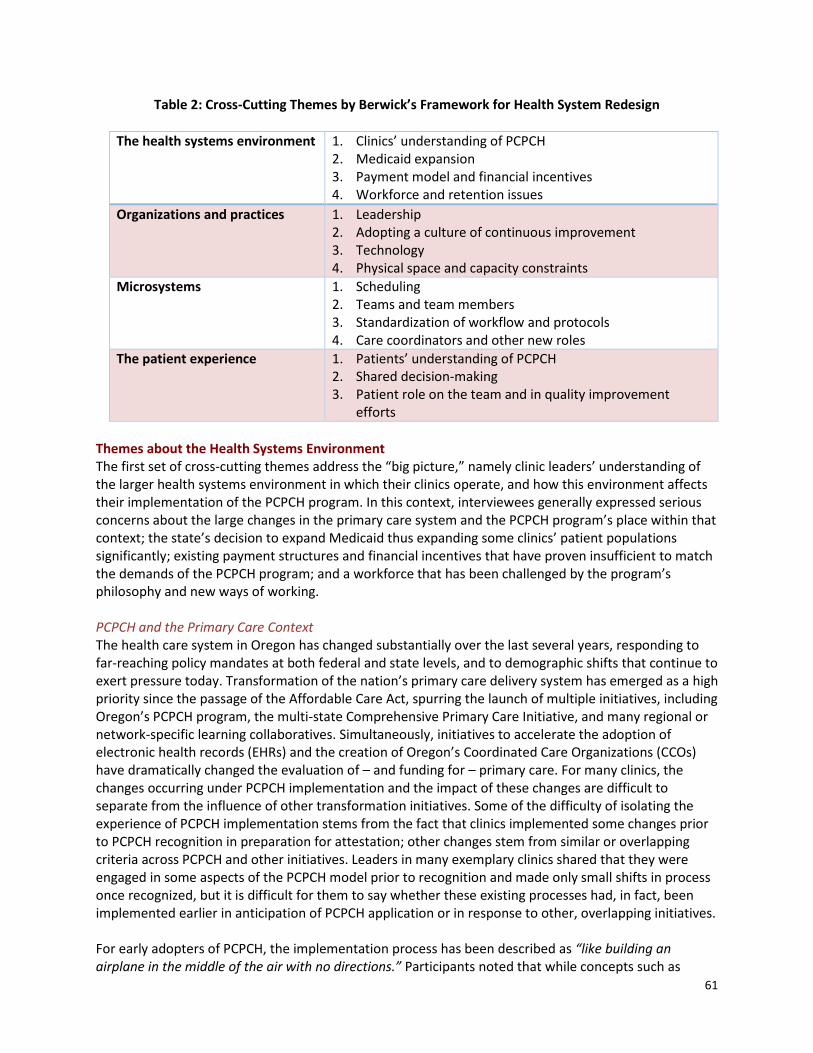
61
Table 2: Cross-Cutting Themes by Berwick’s Framework for Health System Redesign
The health systems environment 1. Clinics’ understanding of PCPCH 2. Medicaid expansion 3. Payment model and financial incentives 4. Workforce and retention issues
Organizations and practices 1. Leadership 2. Adopting a culture of continuous improvement 3. Technology 4. Physical space and capacity constraints
Microsystems 1. Scheduling 2. Teams and team members 3. Standardization of workflow and protocols 4. Care coordinators and other new roles
The patient experience 1. Patients’ understanding of PCPCH 2. Shared decision-making 3. Patient role on the team and in quality improvement
efforts
Themes about the Health Systems Environment The first set of cross-cutting themes address the “big picture,” namely clinic leaders’ understanding of the larger health systems environment in which their clinics operate, and how this environment affects their implementation of the PCPCH program. In this context, interviewees generally expressed serious concerns about the large changes in the primary care system and the PCPCH program’s place within that context; the state’s decision to expand Medicaid thus expanding some clinics’ patient populations significantly; existing payment structures and financial incentives that have proven insufficient to match the demands of the PCPCH program; and a workforce that has been challenged by the program’s philosophy and new ways of working. PCPCH and the Primary Care Context The health care system in Oregon has changed substantially over the last several years, responding to far-reaching policy mandates at both federal and state levels, and to demographic shifts that continue to exert pressure today. Transformation of the nation’s primary care delivery system has emerged as a high priority since the passage of the Affordable Care Act, spurring the launch of multiple initiatives, including Oregon’s PCPCH program, the multi-state Comprehensive Primary Care Initiative, and many regional or network-specific learning collaboratives. Simultaneously, initiatives to accelerate the adoption of electronic health records (EHRs) and the creation of Oregon’s Coordinated Care Organizations (CCOs) have dramatically changed the evaluation of – and funding for – primary care. For many clinics, the changes occurring under PCPCH implementation and the impact of these changes are difficult to separate from the influence of other transformation initiatives. Some of the difficulty of isolating the experience of PCPCH implementation stems from the fact that clinics implemented some changes prior to PCPCH recognition in preparation for attestation; other changes stem from similar or overlapping criteria across PCPCH and other initiatives. Leaders in many exemplary clinics shared that they were engaged in some aspects of the PCPCH model prior to recognition and made only small shifts in process once recognized, but it is difficult for them to say whether these existing processes had, in fact, been implemented earlier in anticipation of PCPCH application or in response to other, overlapping initiatives. For early adopters of PCPCH, the implementation process has been described as “like building an airplane in the middle of the air with no directions.” Participants noted that while concepts such as

62
team-based care or care coordination are articulated within the PCPCH model, there was often confusion about what these concepts should look like in practice. Moreover, there seemed to be few real-world examples to turn to. The willingness to embrace change in the face of significant ambiguity is a defining characteristic of these exemplary clinics, whose leaders often spoke openly about their mistakes or uncertainty in their interpretation of PCPCH concepts, and described their experience as a long and ongoing “trial and error” process. Yet, there is also evidence of dissonance in these clinic leaders’ understanding of the six PCPCH attributes that continues today. Staff and providers often expressed that the clinic had always been “patient-centered” or “comprehensive” in its services, but further discussion revealed they were using these terms generally rather than referring to the specific standards as articulated in the PCPCH program attributes. To illustrate, one interviewee stated,
[Lead clinician]: … I think we were patient-centered before patient-centered was cool because we always took care of kids from the time that they were born. So, we have continuity of care across the whole care continuum so newborn outpatient, back to in-patient if they’re sick. We’ve always done that. So, that has continued.
As these clinics have integrated PCPCH concepts, they have perceived tensions between some standards and mandated performance metrics. In particular, clinic leaders have expressed that it is challenging to implement the standards for Access and Continuity at the same time because offering on-demand services or extended hours undermines a clinic’s ability to ensure a patient is seen consistently within their own care team. For example, as stated by one interviewee:
[Clinic staff member]: Access and continuity are diametrically opposed. If you’re expected to be seen by your PCP or their small team and the family needs an appointment right now, you can’t do both. That’s where the patient and family centered stuff should come in to play … what’s the family preference? The continuity one is the biggest burr under my saddle, in terms of how the practice operates.
Similarly, there is a perceived tension between providing care that will meet performance metrics and providing care that is always responsive to patient goals and needs. This challenge was mentioned particularly within the context of providing culturally sensitive care, where clinics serving large minority and/or immigrant populations note that some concepts like shared decision-making do not always translate as intended across cultures and patient populations.
Medicaid Expansion The findings in this report should be considered within the context of the Medicaid expansion in Oregon, as Medicaid expansion co-occurred with PCPCH implementation for many of these clinics. Since 2014, Oregon has enrolled 436,000 newly eligible Medicaid enrollees (a 71 percent increase)11. Clinic leaders reported that their new patient populations are presenting with many needs/complaints due to previously deferred care and much more complex needs for both medical and non-medical services, which strains a system of care delivery that is already struggling to adapt to new processes and requirements. Many of these patients have until recently relied on emergency departments and safety net clinics for basic services, and face a steep learning curve as they engage with the primary care system (also addressed below in the discussion of the patient experience). As these PCPCH clinics have
11 Oregon Health Authority, July 2016 1115 waiver submission to CMS. http://www.oregon.gov/oha/OHPB/Documents/Waiver%20Renewal%20Submission.pdf

63
expanded to meet growing demand, they have also invested significant time and resources helping newly-insured patients understand and navigate the system as intended. This has been accomplished in a number of ways, from new patient orientations and lobby posters about accessing care to automated follow-up calls triggered when a patient unnecessarily utilizes emergency department services to remind them that the clinic has extended hours and phone access.
Impact of the Payment Model and Financial Incentives Clinic leaders expressed that the traditional fee-for-service payment model does not incentivize or reimburse for many of the care processes that must be incorporated to successfully adopt the PCPCH model. Clinics that communicate electronically or by phone with patients and with outside providers note that these activities are often unbillable, even though they may save time, provide care more efficiently, or prevent the unnecessary utilization of emergency services. Additionally, new support roles such as care coordinators sometimes lack an obvious or sustainable funding strategy. One clinic leader emphasized that standardization of workflows and protocols is critical for maximizing billing of reimbursable activities. Several clinics struggled to find qualified insurance billers, particularly those with experience in Medicaid claims. Providers have also felt pressure to incorporate increasing numbers of screenings and preventive measures into visits without seeing a corresponding increase in available time or reimbursement. One clinic secured buy-in for the transition to PCPCH by freezing provider salaries during the change to allow time for the clinic to adjust, and noted they could not have moved forward without this step. Administrators shared that current financial incentives may still not be adequate to build support among providers for moving up the PCPCH tiers, particularly given that even when patients recognize the PCPCH designation, they do not fully understand the tier structure. The perceived value to patients of the PCPCH designation appears to be a key consideration of providers and clinic administrators. Grant funding and financial incentives have been critical support for these clinics, providing the flexibility and breathing room needed to make changes without fear of immediate loss of revenue. Grant funding has also played an important role in allowing clinics time to experiment with new PCPCH concepts so that providers can see a concept in action before making a long-term commitment to changing clinic workflows. Providers who were initially skeptical or thought PCPCH wouldn’t “pencil out” sometimes were not convinced until after they had seen the results of the change. Workforce and Retention Issues PCPCH clinics are challenged by many of the same workforce shortages and waves of provider retirement that are affecting primary care clinics in general. Integration of allied health professionals has proved to be a particularly complicated undertaking for small independent clinics and rural clinics. Without the economies of scale of larger health systems, these clinics face challenges recruiting staff to fill part-time positions. Clinic leaders often talked about provider shortages in the context of new demands for use of technology in the clinical setting, which are causing people to consider early retirement rather than learn a new way of delivering care. Some providers have also resisted delegating responsibilities and patient relationships, affecting clinics’ ability to implement aspects of the PCPCH model such as extended hours. These specific examples exemplify a larger theme uncovered during interviews: a perceived disconnect between how the primary care workforce is trained and what is currently needed in practice. As the model of care changes, new skills and paradigms of care must be taught and learned, in order to be adopted successfully. The pressure to adapt to these new demands sometimes manifests as resistance from staff and providers who have been trained under different models of care, even when there is general support for the objectives of PCPCH.

64
Resistance and burnout (often leading to waves of turnover early in the PCPCH implementation process) was a frequent experience for many clinics, with interviewees reporting staff skepticism and resistance to a variety of new protocols and processes. Even among more supportive staff, change fatigue often set in following periods of rapid transformation. Several clinic leaders reported that the person tasked with leading the PCPCH transition “burned out” and left, leading to challenges in continuing or maintaining progress that had been made. Turnover later came to be viewed as a positive outcome, allowing for recruitment of staff and providers who were more enthusiastic to work in a primary care home environment. The following quotation illustrates this point:
[Lead Administrator]: … That was one of the positives about having a full-staff turnover. It was a tremendous loss, but some of what we lost were some bad habits. We were able to set some standards of interpersonal relations. We were able to start fresh and that was a strength.
Some clinic leaders reported that their hiring strategies changed substantially post-PCPCH implementation, with new employees hired for their adaptability and willingness to work in a team, rather than for skills or years of experience. For example, one interviewee stated:
[Lead Clinician]: It’s interesting, we hire now absolutely for culture and not for skill. We feel skill is something you can train and culture you can’t. … it’s really less about what does your resume look like and more about how do you connect with patients, how are you with us?
PCPCH recognition is a strong signal to both potential and existing employees and providers about a clinic’s values and its vision for the future. Clinics that invested heavily in training in the early days of PCPCH implementation experienced setbacks when some of these staff moved on from the clinic. New employees are more often being trained on PCPCH concepts “on the job.” General orientation and training practices have also changed significantly, with many clinics providing training in effective communication, conflict management, and how to work as part of a team to all new hires.
Themes about Organizations and Clinics At the organizational and clinic level, it became increasingly clear during the interviews and focus groups that both tangible and intangible issues play significant roles in defining what made these clinics exemplary. The tangible – primarily, the implementation and use of EHRs as well as the availability and use of physical space in the clinic – significantly affects clinics’ abilities to work effectively in teams. Similarly, the intangibles of leadership and the development of a culture that values change and continuous improvement substantially inform the extent to which clinics embraced the PCPCH program and its philosophy for providing care in a new way.
Leadership Clinic leaders spoke frequently of a specific champion or key individual who was instrumental in pioneering the PCPCH transition. These individuals embraced the concept of a primary care home, articulated a vision for how the model could benefit the clinic, and worked hard to build support even in the face of significant initial resistance. In other cases, enthusiasm for PCPCH adoption was widespread, and the role of the champion focused on solidifying the team’s commitment to seeing the transition through when challenges inevitably emerged. Notably, while most clinics shared similar perspectives on the importance of a champion, this role was filled differently across exemplary clinics.

65
Providers and lead administrators frequently filled the role of champion, and made it their mission to explain the importance of PCPCH transformation through education, demonstrations, and frequent discussions with other providers and staff. These factors proved to be critical to comprehension and eventual buy-in of other team members. Staff observed that providers were particularly successful as champions because they could “speak the language” to other providers. Rather than driving decisions and changes, champions were often facilitators or unsung heroes, helping those who were struggling to adapt and reminding everyone of the reason for the change when people would get discouraged. Other clinic leaders describe PCPCH implementation as initially grassroots or “trickle up” because staff embraced the PCPCH vision faster than providers. The opportunity to play a more meaningful role in the clinic’s direction is motivating to staff, who were often eager to share their perspectives on priorities for change and suggestions for implementation. The following quotation illustrates this point well:
[Lead clinician]: I’ve been in a number of places that are fairly hierarchical … the employees might not see it, but I’ve never seen a place that’s been so sensitive to getting feedback and input for change. I think that’s helped make the change easier. The staff feels like they’ve gotten input … A flatter organizational structure where someone can walk up to [the CEO] and make a suggestion and, right or wrong, he’ll consider it.
Exemplary clinics are noteworthy for embracing shared leadership, encouraging participation at all levels of the organization, and allowing a significant reduction in organizational hierarchy as PCPCH has become embedded within the clinic. Adopting a Culture of Continuous Improvement Implementation of the PCPCH model has brought with it a significant shift in clinic culture regarding improvement practices and change management. Rather than viewing change as a transition from point A to point B, exemplary clinics seem to have adopted and even embraced a clinic-wide attitude that PCPCH was just the beginning of what will now be an ongoing evolution of the clinic’s workflows and protocols. With this has come an increased tolerance for experimentation, if not acceptance and expectation, and a greater comfort with evaluation, use of data to inform decision-making, and dissemination of results. The shift toward improvement strategies as routine practice has both empowered individual team members and patients to identify additional opportunities for change and increased their resilience to adapt. Many clinics do not have time or resources for structured trainings for all staff members, so “just in time” trainings are provided between and among team members as needed. Team members will also attend conferences or webinars, then report back and teach others what was learned during the training. The inclusion of multiple perspectives and more participatory decision-making through clinic-wide initiatives or patient advisory councils is perceived as improving the collective decision-making abilities of clinics. For example, as stated by one interviewee:
[Lead administrator]: … We do a lot of team-based care as compared to what used to be a very physician-centric, provider-centric world … the medical assistants, in my opinion, passively waited for an instruction from “God” before a step was made and God forbid you proactively make a move without an instruction from “God”, because then you would be considered thinking too much of yourself. … to where we’re at now, which is a tremendous amount of things are done … there’s an ownership amongst the staff that didn’t exist before. The physicians have begun to see the power in that.

66
Furthermore, goals are more thoroughly understood throughout the clinic, pitfalls are more often anticipated, and success is more widely celebrated. A large number of the clinic leaders interviewed also have participated historically and/or currently in learning collaboratives or other multi-site initiatives, and credit both PCPCH and their respective learning collaboratives for transforming them into better clinics. A few clinic leaders reported that their learning collaborative provided very useful on-site technical assistance to coach them through implementation of specific PCPCH standards where needed, or engaged the entire collaborative to simultaneously implement a standard in order to share perspectives and lessons learned. Other clinics made use of learning collaborative partnerships by sending team members to “shadow” their counterparts at clinics that had successfully adopted PCPCH practices. Exemplary clinics are intentional in their efforts to make change processes transparent and understood by all staff within the clinic. They are likely to report structured and formalized change management processes that explicitly articulate goals, processes, and evaluation criteria. Planning efforts are managed intentionally by inter-professional groups of staff and providers to provide a holistic view of the likely impact of proposed changes from multiple perspectives within the clinic. Feedback was solicited at the beginning and throughout implementation, and results were shared openly following both successes and failures. Technology With recent mandates for Meaningful Use and other electronic health record (EHR) promising practices, many clinic leaders found themselves adapting to rapid technological changes at the same time that they were implementing PCPCH. Many clinic leaders stated that an EHR brought the PCPCH model together, and was a critical tool both for communication among team members and for capturing data for reporting. Two success factors demonstrated repeatedly are having an EHR that is customizable, and having expertise—either within the clinic or via technical support—to make ongoing adjustments as clinic workflows shifted over time. Exemplary clinics made frequent modifications to their EHRs and were constantly looking for new ideas and new technology to improve workflows. Some clinics opted to hire IT staff to assist with the fast-paced technological changes while others chose to hire clinical staff with prior educational or work experience with EHRs. Where clinics had on-site IT staff, they became an important member of the PCPCH implementation process, ensuring providers and staff had technological support for the changes they were trying to make in clinic workflows and procedures. Clinics achieved significant efficiencies in preventive services by using their EHR to automate appointment reminders to patients, and to extract relevant data to assist clinic staff to scrub charts in advance of appointments. Some clinics struggled to adapt their EHRs for PCPCH outcomes reporting, and noted that even with the addition of supplemental software, challenges remain. For example, one clinic noted that their EHR cannot track continuity of visits within a team because it is only designed to track continuity for single providers; default security profiles had to be overridden to allow team members such as medical assistants to access certain chart information. In addition to software limitations, clinics ran into difficulties when staff were not adequately trained to enter EHR data in standardized ways, resulting in an inability to find needed information or generate reports needed to document PCPCH performance. Small clinics and those with specialty patient populations also struggled to adapt their EHR for their unique needs, and some clinics felt they were at a disadvantage in their EHR’s ability to report on metrics unless they invested in expensive software or dedicated IT staff. One clinic customized their EHR with color-coding to focus staff attention on critical data entry points for reporting. Another clinic
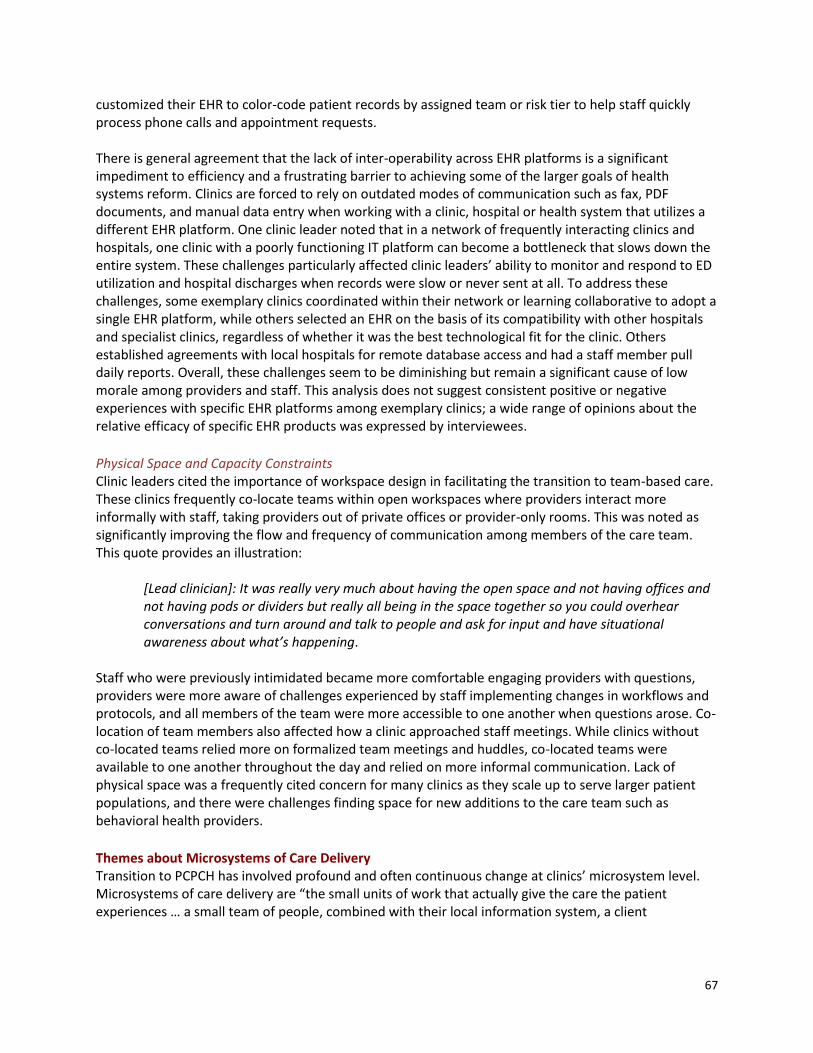
67
customized their EHR to color-code patient records by assigned team or risk tier to help staff quickly process phone calls and appointment requests. There is general agreement that the lack of inter-operability across EHR platforms is a significant impediment to efficiency and a frustrating barrier to achieving some of the larger goals of health systems reform. Clinics are forced to rely on outdated modes of communication such as fax, PDF documents, and manual data entry when working with a clinic, hospital or health system that utilizes a different EHR platform. One clinic leader noted that in a network of frequently interacting clinics and hospitals, one clinic with a poorly functioning IT platform can become a bottleneck that slows down the entire system. These challenges particularly affected clinic leaders’ ability to monitor and respond to ED utilization and hospital discharges when records were slow or never sent at all. To address these challenges, some exemplary clinics coordinated within their network or learning collaborative to adopt a single EHR platform, while others selected an EHR on the basis of its compatibility with other hospitals and specialist clinics, regardless of whether it was the best technological fit for the clinic. Others established agreements with local hospitals for remote database access and had a staff member pull daily reports. Overall, these challenges seem to be diminishing but remain a significant cause of low morale among providers and staff. This analysis does not suggest consistent positive or negative experiences with specific EHR platforms among exemplary clinics; a wide range of opinions about the relative efficacy of specific EHR products was expressed by interviewees.
Physical Space and Capacity Constraints Clinic leaders cited the importance of workspace design in facilitating the transition to team-based care. These clinics frequently co-locate teams within open workspaces where providers interact more informally with staff, taking providers out of private offices or provider-only rooms. This was noted as significantly improving the flow and frequency of communication among members of the care team. This quote provides an illustration:
[Lead clinician]: It was really very much about having the open space and not having offices and not having pods or dividers but really all being in the space together so you could overhear conversations and turn around and talk to people and ask for input and have situational awareness about what’s happening.
Staff who were previously intimidated became more comfortable engaging providers with questions, providers were more aware of challenges experienced by staff implementing changes in workflows and protocols, and all members of the team were more accessible to one another when questions arose. Co-location of team members also affected how a clinic approached staff meetings. While clinics without co-located teams relied more on formalized team meetings and huddles, co-located teams were available to one another throughout the day and relied on more informal communication. Lack of physical space was a frequently cited concern for many clinics as they scale up to serve larger patient populations, and there were challenges finding space for new additions to the care team such as behavioral health providers.
Themes about Microsystems of Care Delivery Transition to PCPCH has involved profound and often continuous change at clinics’ microsystem level. Microsystems of care delivery are “the small units of work that actually give the care the patient experiences … a small team of people, combined with their local information system, a client

68
population, and a defined set of work processes.”12 The following discussion traces these changes through the perspective of the organizational unit that directly shapes the patient’s experience of care, from their initial encounter with a PCPCH clinic’s scheduling system to their experience of ongoing care management for complex conditions.
Scheduling Patient care often starts and ends with the scheduling process, and scheduling is in many ways the linchpin for a clinic that seeks to provide team-based care. Exemplary clinics have experimented with a number of new options for patients to schedule appointments. For patient-initiated appointments, clinics typically begin by attempting to schedule an appointment with the patient’s primary care provider (PCP). This seemingly straightforward process is complicated by a number of factors. With the transition to extended hours, patients have many options for accessing the clinic when their PCP is not available. In order to minimize unnecessary ED utilization, clinics face pressure to see the patient as quickly as possible. Exemplary clinics have leveraged teams to address this challenge, pairing physicians with mid-level providers on a single team, which then serves as the primary backup. Unless the reason for the visit is especially urgent, a team member will encourage the patient to wait to see their own physician or another provider in their team before scheduling with a provider outside the team, but interviewees note that this model is often frustrating to patients. Exemplary clinic leaders also described several ways they have proactively initiated appointment scheduling with patients. Some clinics offer standing monthly appointments for patients with complex or chronic conditions, or schedule phone check-ins with patients between visits to answer questions, monitor changes, and encourage the patient to keep their next appointment. Clinics also emphasize well-visits for older patients as a way to give undivided attention to preventive services instead of primarily focusing on specific ailments that often dominate patient-initiated visits. Clinics have also used their EHRs to conduct clinic-wide chart review for specific preventive services, generating lists of patients who need a specific service and then reaching out to schedule an appointment or utilizing their EHR’s patient portal to send automated reminders. Clinics have also taken a more hands-on role in assisting patients with scheduling referrals. Rather than tasking the patient with calling an outside provider to make an appointment, the care or referral coordinator contacts the provider to schedule the appointment, often before the patient leaves the clinic. This new process has established stronger relationships between the clinic and specialist offices, and clinics describe having better awareness of the referral options in their community along with a better understanding of the challenges patients may have faced previously in scheduling referrals. Clinic leaders also note patients are more often following-through on referrals because health literacy, language barriers, and motivation are less likely to impede the process. Furthermore, patients are more likely to bring up concerns about ability to pay or lack of transportation that the clinic can work with them to address.
Teams and Team Members Team-based care is a hallmark of the PCPCH program, and recognized clinics have transitioned away from the traditional hierarchical model of provider and assistant and now work in clinic teams. However, what is noteworthy in the findings here is that clinics have experimented with a variety of team
12 Berwick, p. 84.

69
structures that continue to evolve as new positions such as behavioral health specialists are integrated within the clinic. The options for team-based care vary with clinic size, and smaller clinics often treat the entire clinic as a single team. Clinic leaders described the transition to teams as being quite difficult, but with significant positive results. Initial resistance to the team model stemmed from provider hesitancy in delegating tasks to other members of the team, as well as staff hesitation to take on greater responsibility. These concerns subsided as team members developed stronger relationships and trust. Several clinic leaders report they now provide much more proactive care because all team members share an expanded sense of responsibility for outcomes and are more likely to speak up when they note something needing to be done. The following quotation illustrates this point:
[Clinic staff member]: I think it’s been more helpful not only for patients but also for employees. They feel more empowered and they feel like they have a voice in the clinic now and they get more fulfillment from their position because they can actually help that patient. They get to talk to them and they get to help them through whatever they’re going through and for all of us, because we’re all very caring, that’s such a big part of our job and now that we get that one on one time with them, that’s huge.
Providers expressed relief that they no longer feel solely responsible for the clinic’s outcomes, and acknowledge that working as a team allows the group to leverage strengths of individual team members and ask for assistance when it is needed. Team-based care is also perceived as improving staff morale and enhancing the collective problem-solving abilities of the clinic. While some clinic leaders described the transition to teams as creating an “all hands on deck” mentality, it also provides new opportunities and a need for specialization of roles within the team. Clinics have created dedicated positions for coordination of referrals, prescription refills, and complex care coordination, freeing up providers, medical assistants, and scribes to focus more exclusively on direct care while these new staff tend to the many administrative steps that must occur for individual patents between visits. Each staff member may have a defined role, but many are cross-trained to provide coverage when other staff are out of the office or during busy times. This cross-training is noted as improving staff members’ awareness of the larger clinic system. Staff members are encouraged and expected to work to “the top of their license.” As well, having teams comprised of staff with varying backgrounds and experiences allows individuals to become quasi-specialists within their larger scope of practice who are then relied on by others for their expertise. The role of medical assistants has been particularly affected. In addition to their previous tasks of taking medical histories and vital signs, they also now administer vaccinations and screenings and coordinate prescription refills and referrals. Many interviewees stated that team-based care is the bridge that makes meeting the PCPCH standards for both Access and Continuity attainable. Team structure facilitates completion of tasks, such as documentation of visits or referrals to specialists while the patient is at the clinic. Clinics that construct their teams to include front desk staff are overwhelmingly positive about the benefits, noting that these employees provide an expanded view of the patient’s status and needs to the care team. Front desk staff included in team discussions about workflows can also provide important suggestions for streamlining and improving the integration of front office and back office processes. While working in teams is viewed positively, clinic leaders also emphasized the important role of communication. Many clinics have specifically engaged in training to enhance communication skills within teams. Others cited the importance of frequent encouragement for staff. Fear of making a mistake or getting into trouble was widespread as employees transitioned into new roles and responsibilities, and these clinics proactively encouraged asking questions and normalized the concept

70
of different learning styles. As clinics have evolved from initial implementation of PCPCH to continuous improvement, teams have come to play an important role as microsystems where changes can be piloted on a small scale and then evaluated for effectiveness prior to rollout to the clinic as a whole. Teams that are enthusiastic about a proposed change often volunteer to pilot it, which then reduces resistance from more reluctant teams as they have an opportunity to observe the change, ask questions, and identify potential pitfalls prior to implementation within their team or larger clinic. This quote provides an illustration:
[Clinic staff member]: We try to keep it really small and work the bugs out, so we don’t affect everybody, and then we move it out from there. Once we get to the rest of the clinics, we can say, “We did take the time to do process improvement on this and make sure that we’ve built the best mousetrap. Here you go.” If we send it out and they come back and say, “This is horrible and we can’t do it,” then we’re going to go back and go ... if it’s something that we’re required to meet for PCPCH or NCQA or something, we’re going to think through a better way to do it.
Standardization of Workflows and Protocols Clinic leaders described that as they transitioned to team-based care and providers were no longer in a position to monitor all the activities of the care team, it became increasingly important to standardize workflows and protocols to ensure consistent provision of care and thorough documentation. Clinics recognized the necessity for training staff in a standardized manner. Cross-training supports standardization, allowing care team members to cover for one another seamlessly when clinic hours expand or when a member of the care team is out on leave. It has also underscored a need for more thorough documentation of care, as members of the care team rely increasingly on the EHR to document work in progress or to pick up where another member of the team had left off. This quote illustrates this practice:
[Lead administrator]: … Really putting together and changing up our documentation so it included: what was the outcome of the visit; what were the follow up components; who was involved; did it go on to the physician; did it go on to the scheduler; what was the closure on it … we used to just have a note that said, “Sore throat … 4x/day … appointment” and did include all the components of what we did or said. I think we were already doing those things, but documenting them and making them more formalized has been a part of it.
Standardization of protocols is also a powerful tool that allows clinics to automate frequently occurring steps in the care process. Front desk staff are trained and empowered to share screening tools as part of the paperwork provided at the beginning of a visit, in order to streamline the rooming process for medical assistants. Clinics established standing work orders that allowed medical assistants to pre-emptively order routine lab tests before the provider would see the patient, if such steps aligned with the patient’s existing care plan or the patient met pre-established criteria. Clinic leaders reported that this automation is critical for maximizing the efficiency of providers’ time with patients. At the same time, the volume of new screenings clinics must collect, as well as the burden of documentation related to screenings, is widely cited as a point of frustration and burnout. Exemplary clinics were proactively experimenting with these alternative options for collecting screenings in order to reduce the sense that screenings were becoming a barrier to providers’ ability to engage with patients and respond to their reasons for seeking care. Clinic leaders reported various ways they initially approached standardization of processes. Many clinics developed age-specific checklists of standard care early in the PCPCH implementation process, then engaged in a clinic-wide review of patient medical records to flag needed preventive services or overdue

71
care. Some accomplished this by dedicating a staff position to chart scrubbing while others used automated features in their EHRs or contracted with an outside company. Other clinics did not engage in a clinic-wide review at a single point in time, but adopted checklists and screened patients’ charts on a rolling basis or as they came to the clinic. In many cases, whether clinics conducted this review at a single point in time or over time, the review process also provided an opportunity to stratify patients into panels by risk level or specific diagnosis. With these panels in place, clinics could begin to incorporate proactive measures at the population level rather than case-by-case for individual patients. One interviewee expresses this point succinctly:
[Clinic staff member]: …I think [PCPCH] also pushes the population management issue in a way that wasn’t being done before. Our asthma work started before the medical home with a project we were working on with another IPA we used to have a relationship with. That was sort of the venture into population management, but that mindset is different because of PCPCH. We’re not just thinking about the patient in front of us, but the whole panel of patients.
Care Coordination Care coordination stands out as an integral component of exemplary PCPCH practice; many clinics referred to it as the “biggest” or “best” change to come out of PCPCH implementation. The following quote succinctly illustrates this point:
[Clinic staff member]: … I find that [care coordination] really has wrapped that team concept in more because everyone kind of has a key person they are able to go to and say, "I need help with this. I don't know what to do with this."
Clinic leaders described being initially confused about the concept of care coordination, and one interviewee described that in the early days of PCPCH implementation, the care coordinator was “the dumping ground” for tasks that providers and staff did not want to do. The terminology of care coordination varies widely across clinics and there does not appear to be a universal understanding of what this role constitutes; clinics have adopted foundational concepts such as a focus on managing transitions of care, but have also tailored roles, titles and scope of work to their individual settings. Clinics approach care coordination and case management similarly, and while these roles are professionally distinct they appear to fall along a spectrum of related activities and services, with the degree of complexity of the role sometimes dictated more by the staff available to the clinic than by a clearly defined scope of practice. Several clinics have further segmented the care coordinator role into specialized positions for referral coordinators or prescription refill coordinators. Others noted that care coordinators are an important resource for meeting ever-increasing documentation requirements. While roles vary across clinics, care coordinators have come to be highly valued for the support they provide to patients and to members of the care team. Some clinics assigned care coordinators to each team, while others established a stand-alone team of care coordinators and nurse case managers that supported all teams. Many define coordinators as a “step-in” for the physicians. Because of time constraints, providers are not always available for patients with chronic conditions or complex care who needed frequent support or communication with the clinic; care coordinators fill this gap, providing an alternate point of contact for the patient, who was trusted and familiar with their needs. They also served an important role for helping patients to understand appropriate points of access to the health care system. Coordinators are utilized to facilitate “soft hand-offs” from one phase of care to another, were assigned panels of high-risk patients for regular check-ins, or were tasked with reconciling medications and

72
conducting follow-up calls to all patients discharged from a hospital stay. Once a provider has worked with a chronically ill patient to develop a care plan, much of the ongoing care management can be delegated to the care coordinator. In some cases, clinics report that they developed a generic care plan template for an entire panel of patients who shared a diagnosis, and then a provider or a care coordinator would work with the patient to customize the care plan from the template. This quote offers an example:
[Lead administrator]: … we were really overwhelmed with the idea of thirteen thousand patients, how we get care plans for each patient, and risk stratifying the patients. So, our initial foray into that was to develop provisional care plans on categories of patients, like diabetics, hypertensions, and asthmatics and begin to customize those generic care plans to the individual patient. The nurse care manager was the one primarily doing that work.
Care coordinators have played an important role in developing relationships and lines of communication with other clinics and organizations in the community. Several clinic leaders note that communication about referrals with specialty clinics had initially been a challenge, and care coordinators are tasked with not only following up with patients but also with specialists to ensure follow-through. Others note that clinics lacked information about social services they could refer patients to, and their care coordinators developed a depth of knowledge about safety net resources in the community and were able to help patients secure transportation, food assistance, or other supports that were affecting their health outcomes. These networks of care are vital, as illustrated by this quote:
[Lead clinician]: Use your community resources. Be really involved with the community. Don't ever think you are going to do it by yourself. It's really important, not just the webinars, but making friends. Really knowing your [hospital name] ER, your [hospital name] ER docs, knowing who to call when you have substance abuse emergency. Knowing who to call ... who has a mental health urgent care facility Knowing those community resources is really important for us to ensure our patients are safe. Not just for the fact of the patient-centered medical home, but the premise is to coordinate and provide flexibility, safely ensure that patients are accountable for their health care. You need to know who in the community to follow up on that with you. So, yeah, for us the biggest thing was, honestly, just knowing who your networks are.
Themes about the Patient Experience While the PCPCH program seeks to shift many of the workflows and processes of care delivery, interviewees describe several other ways in which patients’ experience of care has changed. These changes highlight a shift in the understanding of patients’ rights and responsibilities that may be more apparent to clinic staff than to patients themselves. Many of these shifts, such as a greater understanding of a patient’s social-emotional context, are described positively. Others, such as the integration of shared decision-making tools, are more nuanced and suggest inconsistent results across clinics and patient populations. Several of these themes raise considerations for implementing the PCPCH model of care in culturally sensitive ways. Patient Engagement and Communication with the Care Team The use of technology to facilitate care has been embraced by some patients and created new challenges for others. Patients who are more comfortable with technology and with high levels of English literacy generally have enthusiastically engaged in the use of patient portals and email communication with the clinic. Thus, they benefit from automated reminders, online scheduling options, and remote access to medical records. Many clinics reported that reception has been mixed, however, with elderly patients and with patients for whom English is a second language, both of whom are

73
struggling to take advantage of these new options. One clinic noted that among their population of low-income patients, many of whom experienced sporadic homelessness or other financial hardship, access to technology was not consistent enough to be a useful communication tool. This has raised interesting considerations regarding equity as clinics explore integration of patient-facing technologies to streamline and speed up clinic processes. One clinic asks patients about their preferred communication method and learning style as part of the initial visit and the care team reviews this information during early morning “huddles” as they prepare for the day. Other clinics emphasized the need for staff to use plain language and active listening to ensure patients are not confused or just repeating what the provider wants to hear. An example can be found in this quote:
[Clinic staff member]: … so, to me, it's important and is also a lesson that I've learned more, is to really listen to [the patients]. Because they will say what you want to hear. And you have to make sure that you are listening, and not ... making sure that that patient doesn't fall through the cracks.
This finding in itself demonstrates that while PCPCH clinics have embraced a team model of care and shared decision making, patients may very well still view their relationship with the clinic and the care team as one that is hierarchical and perhaps even paternalistic.
Several interviewees noted that patients with complex care needs respond well to having more frequent communications with the clinic. One clinic noted that contrary to their assumptions, patients with infrequent care needs and no relationship to the clinic are most likely to use the emergency department for routine care; patients with frequent contact did so rarely. This quotation neatly demonstrates this important point:
[Lead administrator]: … what I discovered from looking at this … which was the coolest thing but we haven’t had time to act on it completely yet … our sickest patients weren’t going to the ED unnecessarily, they’re coming here because they have a relationship with us. When they go to the ED, it’s for chest pain at 2am when they should’ve gone. It’s the people we have the most casual relationship with. They don’t feel connected to us … absolutely back to the relationship issue. When you start looking back at all this stuff, every single indicator is about whether you have a relationship with the patient.
Team-based care provides more potential points of contact for a patient, and rather than complicating care, these options increase the likelihood that a patient will find a care team member with whom they feel comfortable communicating. This is especially noted in instances where patients are intimidated by physicians but are willing to speak more openly with mid-level providers or care coordinators about sensitive social, family, or financial situations. One interviewee noted that as a patient became more comfortable with the care team, they became excited to “show off” improved health outcomes to team members during visits. Providers who spoke openly with patients about the clinic’s accountability metrics reported patients were more likely to follow through with their own care plans. Strengthened relationships between patients and team members have given clinics a more holistic view of patients’ lives, providing context for how they are engaging with the clinic and their care plans. This more complete understanding has helped clinics shift away from an emphasis on general patient compliance to understanding specific reasons why patients are sometimes unable or unwilling to follow through with recommended care and instead develop alternative strategies to respond to these barriers. Many exemplary clinics noted they are serving low-income populations with many barriers to care; patients may forego filling prescriptions if they cannot afford a copay, while others are

74
embarrassed to admit they have low literacy and do not understand their care instructions. The transition to PCPCH has highlighted these barriers where they may have previously been overlooked. Shared Decision-Making Interviewees described clinics as moving away from the concept of patient compliance, but noted an emerging recognition that once a plan of care has been agreed on, patients must be active participants in their care. Several clinics note they have begun utilizing externally-developed shared decision-making (SDM) tools, though these are more likely to be mentioned in the context of CPCI and NCQA improvement initiatives than in the PCPCH recognition process. One clinic conducted pre-visit phone calls to all patients to solicit their goals for the visit, and described this process as being more effective than attempting to identify patient goals during the visit. Another clinic described modifying their EHR to more easily integrate (and capture use of) SDM tools during patient visits. SDM is described as requiring flexibility and compromises from both the patient and the provider, and a willingness of the care team to modify workflows or protocols when they do not work for a specific patient. Several clinics mention that SDM appears to be more positively received by younger, white, and American born patients. Clinics have struggled to implement shared decision-making with patients whose culture holds different communication norms, and perceive that some patients are uncomfortable with providers stepping out of the role of authoritarian expert. Interviewees report that patients who are not accustomed to being the primary decision maker within their family or community also struggle with SDM practices, regardless of age or cultural identity. Other interviewees noted that some patients seem frustrated by the time invested in SDM during visits, and seem to prefer that providers simply present a plan of action.
While clinic leaders’ perceptions of performance metrics are discussed in more detail below, it is noted here that some clinic leaders perceive tension between providing care that is responsive to patients’ goals and meeting short-term performance metrics of current improvement initiatives such as PCPCH. In particular, some clinic leaders have expressed frustration that metrics sometimes seem constructed around what is readily quantifiable, rather than what matters to individual patients’ long-term health and well-being. To illustrate this point, one interviewee notes:
[Lead clinician]: … one thing that I worry about with the PCPCH model is the focus on outcomes and whether that is patient-centered or not. So we think it’s good for a person’s health for their A1C to be in control if they have diabetes, but if we prioritize that number above and beyond maybe other things the patient might care about because we can’t necessarily measure those things very effectively, I worry whether we’re being patient-centered in that way and so I think that’s a challenge we’ll have to try and figure out how to overcome as we move forward with everything that we do here.
Patient Role on the Team and in Quality Improvement Efforts Many exemplary clinics have taken steps to actively engage patients in clinic improvement efforts, with mixed success. Interviewees were generally positive about the value of patient feedback, but noted significant challenges in acquiring it. Clinics that have participated in CAHPS surveys of patient satisfaction cite the information as quite useful, providing focus for improvement priorities and challenging assumptions about when, where, and how patients want to receive care. Smaller clinics noted that these surveys are sometimes cost prohibitive and their smaller volume of patient visits mean it can take too long to collect representative data; some small clinics report success constructing their own surveys using free or low cost software such as SurveyMonkey. Larger clinics experience fewer of these challenges, but some interviewees raise concerns that in a period of rapid clinic transformation, it

75
is difficult to contextualize patient feedback that may have been collected before or after a change was made in the clinic. Survey results seem to be most meaningful when shared quickly after collection, when staff are able to relate feedback to recent activities. Several clinics have experimented with establishing patient advisory groups. These groups are sometimes convened as one-time focus groups, and other times as standing Patient and Family Advisory Committees (PFACs) who meet periodically. Clinics describe significant challenges both in gaining provider support for PFACs and recruiting patients who are willing and able to participate, an issue addressed in more detail below. Providers have been skeptical that patients will provide meaningful feedback, though most are pleasantly surprised and become supportive over time. Clinics with standing PFACs initially solicited general feedback on ideas for improving the patient experience at the clinic, but some transitioned to engaging their committees to provide input on proposed changes and workflows that the clinic sought to implement. PFACs have provided useful suggestions to clinics on integration of shared decision-making tools and prioritization of screenings. Multiple clinics noted receiving patient feedback, either directly or through their PFAC, that patients seem tired of responding to multiple quality surveys, dampening enthusiasm for future CAHPS or other survey efforts. The recruitment of patients to participate in improvement activities has been an ongoing challenge; interviewees noted that certain subpopulations, such as native English speakers or retired patients, tend to be heavily represented on PFACs because they have time to participate and are more easily reached through engagement strategies. Some staff and providers worry that the people with the most barriers to care are also least likely to participate. Exemplary clinics have made considerable efforts to reach out to underserved populations; one interviewee noted the clinic had created a PFAC specifically for Latino and Spanish-speaking patients. This quotation illustrates this strategy:
[Clinic staff member]: … we started it with the Hispanic parents with special needs children because we felt like they were a voice that got lost in the health care system … So that was a very positive experience for us. From that focus group, it evolved into a Parent Advisory, where we meet quarterly. And then, our most recent challenge now is that we are integrating additional parents. We want it to not just represent our Hispanic population, so we are integrating other special needs Anglo parents, as well as non-special needs ... So, there are some challenges in meeting as we have integrated them. We have two meetings with them combined so far. But, the challenge is making sure that our Hispanic parents still continue to feel comfortable sharing their voice. Our Anglo parents are very outgoing and very talkative. Managing that and making sure things are translated and being interpreted as they are being shared, so we do a lot of, "Okay, stop.” So, it's I think a challenge, but a very positive challenge.
Concluding Thoughts on Cross Cutting Themes As demonstrated through this thematic discussion, implementation of the PCPCH program – and what can help or hinder clinics in the process – is best considered and understood at multiple levels. Across the four overarching themes, it appears that clinic progress in PCPCH is hindered by the following:
A workforce unprepared for large-scale change;
Payment models and other financial arrangements that do not incentivize clinics to operate in a manner concordant with the values and aims of the PCPCH program;
For some clinics, a rapid and large-scale increase in patient populations presenting with complex issues;
A lack of adequate space and understanding of essential technologies; and,
A patient population that may not understand or have been adequately educated on their role(s) in team-based care.

76
At the same time, the following practices and understandings seem to help clinics not only implement the PCPCH program successfully but also embrace it as the “right” way to provide care:
A collective understanding of where their clinic “fits” in the larger efforts to reform the health system and better the health of both patients and the population as a whole;
Leadership (at any level of the clinic) that embraces the values and aims of the PCPCH program and excites others in the clinic to do the same;
An ability to harness the power of teams to facilitate patient care;
Standardization of policies and practices;
Integration of the role of care coordinator; and,
An organizational culture that embraces a willingness to experiment, adapt, and learn.
Themes by Attributes The six sections below present themes that emerged from the interviews and focus groups that are specific to the six PCPCH program attributes. They reflect how clinics understand these concepts, how they talk about them, and what they perceive to be specific facilitators and barriers to successful implementation of each attribute and the related standards. Attribute #1: Access to Care Clinic leaders reported different perceptions about this attribute depending on how dramatically their patient populations increased with the Medicaid expansion. Some clinics receiving a large influx of previously uninsured patients have struggled to scale up rapidly to meet increased demand, and also to raise awareness among patients who have been accustomed to accessing care through emergency departments. However, a number of clinics perceive Access to Care to be the easiest of the PCPCH attributes to meet because they have been able to identify the specific barriers their patients face to accessing care and respond appropriately with operational changes. Most clinics have expanded hours of operation to include early morning, late evening, and weekend appointment options. It was not unusual to hear that clinics are open twelve hours a day or longer, either every day or several days per week. However, many clinics also report that these changes pre-date PCPCH implementation. Clinics stagger provider schedules to achieve full coverage throughout the day and week. One clinic notes that even part-time providers are required to work four days per week to ensure continuous availability. Notably, extended hours are cited as a point of tension with employees. Two clinics specifically note they do not have extended hours because providers have been unwilling to accommodate this change. Leaders of clinics that have made the transition note that over time, it has become “less of a big deal” for existing staff, but remains a barrier to recruiting new employees. Clinics have also implemented 24-hour “on-call” coverage during hours when the clinic is closed. Some accomplish this by splitting phone duties among providers or care managers. Others contract with a third-party answering system and make providers available as needed in response to urgent situations. Some clinics cite the cost of answering services as a significant financial burden. Clinics have experimented with a number of scheduling strategies to reduce emergency department utilization. Some clinics have transitioned entirely to same-day appointments and walk-in visits for all patients, noting that some patients seem more satisfied waiting in the lobby for their provider to become available than accepting a same-day appointment at a specific time. Others intentionally reserve blocks of time each day, releasing same-day appointments in the morning. One clinic blocks same-day visits for all providers to ensure PCP availability, releasing the appointments for all open appointments for urgent care visits one hour in advance. Some clinics make walk-in appointments

77
available throughout the day while others restrict access to narrower windows of time. Another clinic established a “rapid admission” agreement with the nearby hospital to bypass the emergency department when patients need to be admitted to the hospital. As previously noted, several interviewees perceive the Access to Care and Continuity attributes to be in conflict; ensuring provider continuity is difficult while also offering maximum flexibility in how patients access the clinic. Teams are cited as an important strategy for overcoming this tension. Clinics construct teams with pairs of physicians and mid-level providers who can cover for one another when the patient’s PCP is not available for a same-day or urgent care appointment. The role of the medical assistant has been maximized to the full scope of practice, providing vaccinations, drawing blood samples and conducting screenings in addition to vital measurements and health histories typically collected during the patient rooming process. Clinics have experimented with options for more efficiently conducting routine or maintenance appointments through strategies such as group visits, phone calls, or emails via patient portals to maximize availability of provider visits for more urgent needs. Despite these actions, challenges remain when clinics cannot be reimbursed for these alternative methods of care provision. It is apparent that even with these operational changes to a clinic’s hours and modes of access, patient awareness of these options and habitual emergency department use remain challenging. One clinic reported that hospitals have aggressively competed for urgent care business, advertising short waiting times on billboards near the clinic. One interviewee, located on a health system campus, described how, while dropping off laboratory samples at the nearby hospital, she observed one of her patients waiting in the ED to see if she could be seen sooner, despite being scheduled for an urgent-care appointment in the clinic that afternoon. Exemplary clinics have responded to these challenges by implementing both proactive and reactive steps to shift how patients seek care. Educational materials about extended hours and modes of access are shared widely in patient information packets, lobby posters, and examination room computer screen savers. One clinic selected an EHR that integrated with the nearby emergency department to receive real-time alerts so that the clinic could contact and redirect patients to the clinic for urgent care appointments if they checked in at the emergency department. Others use follow-up calls or automated letters to remind patients of hours and options. In contrast to these barriers for on-demand appointments, clinics have identified several ways to respond when patients face barriers to routine appointments. Several interviewees reported that patients with chronic illnesses or disabilities have difficulty traveling to the clinic. Even when a friend or family member is available to provide assistance, patients are sometimes reluctant to ask for help if the person would have to wait for them at the clinic during a scheduled procedure or for a walk-in appointment. Clinics leverage phone visits where possible to reduce the need for in-person appointments, and transportation assistance is one of the most frequently cited aspects of care coordination. Most clinics address this challenge by partnering with a community-based organization to provide assistance, but a few clinics reported making home visits or even providing transportation to the clinic. Transportation concerns also extend beyond transport to the clinic – patients also frequently face barriers to filling pharmacy prescriptions or accessing specialist offices. One interviewee reported that the region’s Coordinated Care Organization has staffed a team of patient navigators who are on-call specifically to arrange transportation to clinics and pharmacies.
Attribute #2: Accountability “It keeps us accountable” was a common response when interviewees were asked whether PCPCH has helped their clinic. While there is variation in how clinics perceive the mechanics of the PCPCH program

78
to have helped, clinics agree that having standards and being evaluated against them is a useful exercise and is generally needed in the field. This quote offers an illustration:
[Clinic staff member]: ... it’s just added more organization, which is good because you can get pretty disorganized if you’re left to do what you will do by yourself. … so I think it’s good incentive for people in general, for caregivers in general to have that forced documentation and organization.
Some interviewees noted they arrived at this belief after initial skepticism or resentment that PCPCH program metrics are a government mandate on how to do their jobs. The PCPCH program specifically is cited as keeping the emphasis on patient care where other improvement initiatives are more focused on business outcomes. In order to meet the standards of the Accountability attribute, clinics have incorporated collection, reporting, and utilization of data to improve care at both the individual patient and clinic population level. It is noted that EHR systems are rarely designed for the care processes of PCPCH, and significant modification is needed to enable systems to generate the necessary reports. Most interviewees expressed that while they support the intention behind this attribute, the volume of documentation, particularly for clinics engaged in multiple improvement initiatives, can be overwhelming and exceed their capacity to keep up. However, clinics also cited several positive outcomes of documentation requirements, including improving tracking of referrals, forcing conversations about information exchange between clinics, and better tracking of transitions of care. There is no consensus among clinics on the right number of metrics. Some clinics track many, with elaborate dashboards, while others track just a few that they find most meaningful for their clinic and population. Some clinics have experienced resistance from providers who feel that the new emphasis on accountability implies they had not previously provided good care or that it was an intrusion. One provider admitted that he wishes there was more evidence that data collection would improve outcomes, but he recognizes the irony that such evidence could not be produced until there was data:
[Lead administrator]: … it’s very difficult because their intentions are so good and without the data … data drives everything. It’s one of the things I’m ashamed about. Looking back on all the years I’ve been in this business and how little actual data has been … has ever mattered, “I know I’m doing a good job, because I intend to and I was well-trained … but I don’t know how many diabetic patients I have, and I don’t know from a population health management how well controlled their A1c’s are, but I’m doing the best I can.” Getting out of that mindset and actually looking at the cold, hard facts … only 40% of your blood pressure patients are controlled ... they have to go through this period where they feel they’ve been asleep at the wheel. Some of them just can’t tolerate the self-examination. Everything related to that, they reject it, they won’t look at it … some arrive at the surrender/what can we do stage. Some will go into retirement and never get there.
Conversely, some providers shared that their attitudes changed over time, and the emphasis on performance metrics ultimately kept people from just assuming that good intentions meant good outcomes. Other providers were supportive of the need for accountability but questioned whether the metrics they were currently tracking actually mattered for long-term outcomes:
[Lead clinician]: … but really, we’re [primary care providers] like that 10% slice of the pie, right? We’re not all that much when you think about what actually affects health and wealth and

79
productivity and well-being. So if we in medicine can stop being so egocentric and focused on ourselves and really figure out what parts we can play in the whole, I think that’s really exciting. So I think the data piece is going to help get us there but right now we’re still measuring hemoglobin A1Cs. Right? Which is a surrogate marker and it may or may not mean anything, right? I’m sure it means something. I’m not sure it’s the most meaningful.
Exemplary clinics use comparative metrics between providers and between teams to initiate conversations about how different workflows might be affecting measurable patient outcomes. Several interviewees shared that their clinics use friendly competition among teams in order to keep people engaged and normalize the experience of talking about performance. They emphasize the importance of celebrating successes and use ongoing tactics such as gift cards, certificates of appreciation, and public recognition at meetings to encourage improvement. Clinic leaders also noted that having clearly articulated goals is critical for both ensuring understanding and encouraging team members to hold one another accountable. To achieve this, clinics create committees to lead clinic improvement initiatives and report back on results over time. Clinics sometimes have one committee that led multiple efforts, while others create independent committees around single issues to share leadership and responsibility. Exemplary clinics have invested significant time, both organizationally and from individual leaders, in shepherding clinic improvement processes. While one clinic stressed the importance of not placing responsibility on a single person in order to avoid fueling resentment and burnout, others noted that leadership participation in improvement initiatives is critical for sending a signal to staff that it is a priority. Interviewees acknowledged that collecting and using performance data in systematic ways requires significant and ongoing investments of time from the clinic, and this investment of time comes at a cost, pulling providers and staff away from revenue-generating care processes. To signal support for improvement activities, several clinics close for partial or full days during implementation of major changes to bring the entire staff together for planning or discussion of the learning from improvement (PDSA) cycles; many continued these clinic closures on an ongoing basis once it became evident that the time was important. Clinic changes are iterative, often not leading to the intended outcome and needing modification and repeated testing of new changes several times before the goal is achieved. This quote offers an example:
[Clinic staff member]: … I think we are on care plan, like, PDSA number 7 now. And each one is a wonderful idea that is going to work, and we are so excited about it and you implement it and you realize three or four times down the road, this is not going to work, and you've gotta do something else.
While the mechanisms of change vary across clinics, several express the importance of helping all members of the team to see the “why” rather than just the “what” of change. Staff are more likely to remain engaged and adaptable when they understand why it matters, and when they are included throughout the process in reviewing and discussing results. All of these strategies are vital for clinics to maintain and strengthen the culture of continuous improvement that was previously discussed.
Attribute #3: Comprehensive Whole Person Care Clinics have been most excited to work towards this attribute and many state that it exemplifies what primary care should be. This attribute has driven a dramatic shift in how providers and staff view

80
themselves within a larger system for which they share accountability. For some clinics, the reality of meeting this attribute has pushed them to expand their definition of primary care, particularly in regard to mental health care and social services. Clinic leaders described this shift very positively, as illustrated here:
[Lead clinician]: … it’s really opened my eyes to see how much easier it is to manage this patient whenever we’ve implemented a care manager panel that touches base with them every couple of weeks to get the social services involved with that too. I think it’s all under the auspices of preventive health and to putting out fire before they occur. We’ve been doing it long enough and I definitely see not just the objective data, but the subjective data as well.
At the same time, this attribute has created significant pressure on clinics to introduce many more screenings and discussions of health promotion and disease prevention in a shift toward more preventive services. Clinics have taken major steps to standardize the pre-visit process, relying heavily on medical assistants to scrub charts, calling patients to establish goals for the visit, and confirming adequate time on the schedule for complex visits. Many clinic leaders reported that their medical assistant staff are overwhelmed, coming in on days off, or working extra unpaid hours to catch up on charting and documentation. Care coordination has become critical for preserving provider and medical assistant time for patient care. In order to accommodate the workload shift, job processes and tasks are being standardized to accelerate transitions in care. For instance, chart notes have changed to include steps taken before and after a patient visit so that care coordinators can facilitate the after-visit transition to specialists, pharmacies, or community resources. Many clinic leaders stressed the importance of having partnerships with specialists and community resources, and establish formal agreements with local mental health clinics, nursing homes, and other specialists to facilitate referrals. Care coordinators also reach out to social service organizations or sign up with email lists to stay on top of resources available in the community, as illustrated in this quote:
[Clinic staff member]: … I've seen [the care coordinator] spend two hours trying to find resources for a patient who was going to be homeless, and she found her a resources to contact so she wouldn't be homeless anymore. It's not just about medical care anymore. It's about the whole person. They look at the whole person, and not just their healthcare.
One clinic leader reported that their care coordinators make site visits to all specialty clinics in the referral network so that they can describe in detail what the patient can expect to experience. In doing so, the clinic leaders feel more confident that referrals are translating into the expected patient care. Some clinic leaders shared that care plans have been particularly meaningful, targeting very sick patients whose care in the earlier days of their disease may have missed important steps such as explaining basic elements of the disease process. Filling these gaps in patient understanding helps them better manage their diseases and saves unnecessary costs. This quotation illustrates this point:
[Lead clinician]: … out of everything I’ve learned from my years as a primary care home, I think this saves the most money for the system and it’s relatively easy to implement, because this is where all the cost in healthcare is: the seriously ill chronic comorbid individuals who are either at risk for repeated hospitalizations, or have already had them, and aren’t taking full responsibility for their self-monitoring and care because nobody sat down and educated them about

81
monitoring their weight for heart failure, knowing when they’re aggravated with their asthma and COPD …
Some frustration was noted, however, that the mandate to create care plans for high risk patients does not always target patients who will benefit from the process. Exemplary clinics often identify patients who staff believe will benefit from a care plan on a case-by-case basis, rather than following a standard protocol. Some clinics distinguish between behavioral and mental health care while others do not, but all clinics recognize the importance of mental health services within primary care. Despite this recognition, clinic leaders noted mental health concerns are a “Pandora’s box,” with providers reluctant to open it unless they have tools to respond to what they find. Unfortunately, many clinics had previously experienced major challenges when referring patients for outside mental health care. Knowing that specialists are available, either within the clinic or through reliable referrals, makes providers much more comfortable conducting mental health screenings and engaging patients in difficult conversations:
[Lead physician]: … So what would happen is we would make a referral, which would be a general blanket referral, and patients would call everyone they could. And we could give them a list of people to call and they would come back a month later and say, “I called all of them half didn’t answer, a third said they couldn’t see me for 6 months, and the other third didn’t take my insurance and so I gave up.” So the ability to integrate that and do warm hand-offs has been huge. It’s obvious that mental health affects everything else and so that part has been huge. So that was just a glaring piece in the whole-person care that was missing and no longer is.
As a recognized PCPCH, several clinics began integrating behavioral and mental health services onsite in the clinic. Behavioral health providers are on-call within the clinic and pulled into visits for “warm hand-offs,” providing seamless care both in planned and unanticipated conversations with patients. When more extensive mental health care is needed, behavioral health providers facilitate referrals to outside mental health specialists. In other cases, behavioral health providers help patients with mental health challenges to manage their care plans, navigate the care system, and help coordinate non-mental health referrals. The impact of behavioral health integration is not limited to providing care to patients with specific mental health care needs. Several clinics note that behavioral health providers provide more general support to patients with complex chronic diseases and their families through motivational interviewing and support. In some cases, clinics cannot afford to keep behavioral health providers on staff. Clinics note challenges remain in billing for behavioral health services that prevent these positions from being self-sustaining. Exemplary clinics that cannot integrate behavioral health within their clinics make a point to reach out to mental health providers in their community and establish formal relationships to facilitate referrals. Attribute #4: Continuity Clinics approach the Continuity attribute from many directions, most often within the context of team-based care and managing transitions of care. First, in terms of team-based care and provider continuity, there did not appear to be a consensus understanding of how to implement the standards for this attribute. One interviewee described having a provider available to cover other providers’ patients, while a few clinics pair physicians with mid-level providers and attempt to minimize crossover between physicians. One interviewee described having on-call providers for same day appointments when a PCP’s schedule is full. There is uncertainty about how to meet performance metrics for this attribute while also implementing team-based care, extended hours, and same day service.

82
Continuity of care between providers and patients is valued by both, but interviewees described patients’ preferences for continuous care extending beyond PCPs to other members of the care team. Patients will ask for preferred receptionists, medical assistants, and care coordinators. Continuity in care coordination proves to be especially important to patients with complex needs. In some cases, because the care coordinator interacts more frequently with these patients than their provider, preserving continuity in this relationship has become more important. One clinic described that patients’ preferences for continuous care with their PCP are so strong that they will sometimes decline earlier available appointments in evenings and over weekends for urgent needs – a rare negative comment among primarily positive views of this attribute. Continuity is often tracked within panels. Patient panels were most often described as being organized by risk stratification or diagnosis, but some clinics prioritize assignment of families to a single provider panel or intentionally weight panels with equal numbers of high-risk patients to spread workloads more evenly across providers. Increasing panel sizes is a common challenge for clinics that have been assigned more Medicaid patients but have not been able to hire more staff. Team-based care makes it possible for clinics to meet the needs of these larger patient panels, but multiple interviewees express frustration that experimenting with team structures to find the right approach has undermined the clinic’s performance metrics for this attribute. Another clinic notes that the rapid turnover in staff experienced at the commencement of PCPCH implementation further exacerbated this issue. Provision of care within a consistent team is less valuable to patients when members of the team frequently change. Exemplary clinics have also taken proactive steps to streamline and improve continuity of processes of care. Clinic leaders described that the PCPCH program’s emphasis on continuous, current information within a patient’s chart has shortened transitions of care and time between care steps in the clinic. Several interviewees described dedicated staff to manage and expedite fulfillment of prescriptions. In some cases, this person is a pharmacist who conducts medication reconciliations and supports providers in care planning. In other cases, reconciliation is managed by a care coordinator or dedicated “refills coordinator.” One clinic has established a prescription protocol that standardizes recurring prescriptions to 28-day cycles always ending mid-week in order to eliminate issues with patients running out of medication over the weekend or needing refills processed on Friday afternoons. Information exchange with other clinics and hospitals remains a challenge, and being able to communicate with these entities via an EHR greatly facilitates speed and continuity of care. One clinic noted that patients do not understand the lack of technological integration that exists between health care settings. They assume providers share an integrated information system, and providers note that this often leads to patients omitting critical information about care they have received in other settings. This quote illustrates this finding:
[Lead physician]: … the patient assumes that everybody else has access to [this information]. Same with any medication change, any change in management. Nothing is integrated. So we really rely on the patient to, like, tell their cardiologist that this medication changed. And patients don’t do that. You know, you ask them “Any changes?” And they say “No.” And then when you actually get specific … yea, walk through it, they’re like “Oh, that changed, and that changed, and that changed.” But they just … you know, there’s no good way to do that. Other than being fully integrated which nobody’s been able to do.
This confusion also extends to outside specialist offices and hospitals when they assume information has been transmitted or is externally accessible via an electronic system when it is not.

83
Clinics have made more progress coordinating with hospitals than with specialists. Several clinics secured EHR access to their local hospital and can see if their patients have visited the emergency department or have been admitted. Others have formal communication agreements in place so that the hospital will inform the clinic if any of their patients are seen. Multiple clinic leaders noted they have implemented tracking of information exchange, flagging specialists and providers who are most often neglecting to send patient records and contacting them with a threat to discontinue referrals if information sharing does not improve. Clinics that took this step reported positive results and much improved response times, but note this is an ongoing process that needs to be monitored and repeated regularly because non-PCPCH clinics and hospitals have different (and sometimes conflicting) priorities. Several interviewees perceived that emergency department utilization decreased as clinics have been notified more often when their patients are seen. Most clinics have implemented standardized protocols for follow-up calls to patients after emergency department utilization or hospital discharge, and some clinics have gone further, scheduling follow-up visits with all patients to discuss discharge orders, adjust care plans, or simply review steps that could have prevented the hospital visit.
Attribute #5: Coordination and Integration As clinics constructed patient panels and began to standardize workflows and protocols, opportunities emerged to adopt care and improvement strategies across populations rather than on a case-by-case basis. Exemplary clinics have shifted toward thinking of and talking about care strategies that will improve the health of groups of patients who share a diagnosis or demographic characteristic, and are more often articulating connections between the clinic’s workflows and population health measures. With access to high-level data points about the clinic’s population of patients, clinic leaders can more strategically make decisions about which services to provide or which staffing is most needed rather than relying on outside advice. Clinics that began to analyze and utilize their EHR data sometimes discovered surprising and useful insights about patterns of utilization. For example,
[Lead Administrator]: … one of the analyses we did on our ER visits is we identified … I think it was 39% of those ER visits were due to falls. And that's when we rolled out the falls risk program. And, there was a large percentage of Medicare patients that were falling and in the quarter after we started the falls risk, we only had an 8 patients that had been admitted into the ER due to a falls injury. And the first quarter of this year, two and a half months into it, I only had one patient.
Many clinics were initially focused on challenges related to getting information into their EHR, but the interviews revealed they are now just as often grappling with how to extract data for reporting on quality metrics and population health markers. Slight differences in data entry practices across providers make entire data points inaccessible via reports, and some data collected for performance metrics are not intuitive for care team members in all situations. These difficulties are exacerbated by the fact that many clinic leaders reported being unable to afford dedicated staffing for data management and analysis, despite recognizing that these tasks are complex and, in other clinics, often managed by people with specialized training. Exemplary clinics employ various workarounds such as purchasing third-party data tools to supplement or operate independently from their EHR. Others use basic Excel spreadsheets. Often, a team member within the clinic naturally emerged who was either a “data geek” or invested in helping the clinic to successfully utilize data. Some clinics shifted this person’s role over time to more explicitly make room for data management. In other clinics, the task has been integrated with existing responsibilities. Several clinics cited data management support as an area in which grant (or other external) funding would be particularly beneficial.
84
Being able to communicate with other members of the team and with outside specialty clinics via the EHR streamlines and accelerates the care coordination process. Some clinics described the EHR as a communication hub for teams, who rely on it as a central repository for complete and up-to-date information about patients. Interviewees expressed benefiting not only from a more comprehensive view of the patient’s care, but also feeling a heightened sense of responsibility for the totality of care rather than just individual steps within the care process. This quotation illustrates this important point:
[Lead administrator]: … We now feel responsible for the patients all the time. We feel responsible for knowing how the story ended. Whether they picked up their medication, whether they got their needed resource. We developed a lot of abilities to follow through on whether the patients are getting what they need.
This responsibility for “how the story ended” is demonstrated in the steps exemplary clinics take to ensure patient referrals are completed. Some interviewees shared that once the clinic began tracking referrals in earnest, many have been dismayed to realize how often patients are not able to follow through. This realization spurred conversations with patients and among teams to identify where changes can be made. One interviewee shared that while the clinic has focused on building patients’ trust of providers and staff within the clinic, that trust did not extend outside to specialist offices. Care coordinators focus efforts on helping patients understand how to navigate the health system and more often proactively manage the referral process for patients. This quote offers an example:
[Lead administrator]: … One of the things they do is every Friday, if they have an open referral that’s on their desk, the referring offices get a phone call from them, “Have you scheduled the patient for their colonoscopy yet? What date is it? Why haven’t you called her? We want to put it in our records when she’s scheduled.” They keep track of whether the visit is scheduled or not, bug the offices, and don’t close the referral on their desktops until the report is received back.
This process was much simpler in clinics that are part of a network, while independent clinics had additional work to build referral networks and coordinate communication among clinics. As well, one clinic incorporates screening for motivation and several others incorporate shared decision-making tools to attempt to identify patients’ barriers to referral follow-through during the visit. Finally, it is worth noting that while end-of-life planning is a component of the Coordination and Integration attribute, this subject is rarely raised by clinics in interviews and few examples were given. Attribute #6: Person- and Family-Centered Care The interviews revealed a significant disconnect between how clinics understand this attribute and the content of the attribute’s standards. This disconnect appears rooted in interviewees’ struggling with the perception that primary care should be, by definition, “patient centered.” To admit struggling with this attribute would be a disproportionately grave failure in comparison with struggling with the other attributes of the PCPCH program. This dissonance around the language of this attribute may be a hindrance to clinics more intentionally embracing the practices outlined in the standards, such as translation services, culturally sensitive care, and patient satisfaction surveys. While “we have always been patient centered” is perhaps the most consistent theme to surface about this attribute during interviews, clinic leaders also, sometimes explicitly and sometimes implicitly, talked about members of the clinic adopting a “patient centered lens” that supports decision-making and helps the clinic know how to select among competing priorities. For instance,

85
[Clinic staff member]: …The one thing I’ve noticed we’ve started talking about is with … becoming a Tier 3 and a 3-Star, you hear a lot of talk in the clinic about being patient-centered. You know, “Is it patient-centered to do this?” We have a dial up front that says how far along we are. No one likes to change that dial the wrong way. We like to bring it back to green. But they know it’s patient-centered so they talk a lot about “is what we’re doing patient-centered?” and you hear that a lot in the clinic and so vocalizing that is one of the things that I think we’ve really … we were doing it, we just weren’t talking about it.
Clinic leaders discussed this attribute more often as a philosophy or approach that guides how the other attributes are implemented, rather than as a set of standards. Other interviewees described patient-centeredness as a kind of destination to be reached at the end of PCPCH implementation, reflecting that the PCPCH program has given clinics the practical tools to become patient-centered. Many interviewees noted that the clinic is providing services in multiple languages and proactively addressing language and literacy barriers to care, but this often was an inherent part of how the clinic has always operated, or began to operate as a result of shifting patient demographics. Exemplary clinics pay particular attention to the demographic makeup of their patients, customizing educational materials for these groups, integrating multiple language options into their EHR for after-visit summaries, and proactively recruiting bilingual employees or employees with shared cultural identity. In some instances, group visits help to leverage the limited time of bilingual staff. A few interviewees reported struggling with the time required to be truly patient centered and the tension of providing patient-centered care in an environment that is increasingly structured and deadline driven. Some interviewees reflected that staff and providers feel shared decision-making tools are too time consuming and cannot be incorporated with the other demands on clinics. In other cases, clinics struggle to reconcile this concept with care of patients who sometimes present with substance use disorders or mental health crises, when it becomes less clear how to empower patients to take an active role in the care process. One clinic has gone so far as to turn away patients who are “drug shoppers.” Despite this tension, most clinic leaders reported that care coordination and shared decision-making have resulted in teams that are more aware of patients’ goals and are more likely to understand a patient’s health behaviors in the context of their life and family situations. Exemplary clinic leaders expressed that it is important to explain the PCPCH concept to patients, and several did so through letters or patient “agreements” that were signed with initial paperwork. Clinics have made efforts to keep patients more aware and engaged in ongoing clinic changes, prioritizing time for communication through newsletters, social media and patient portals to update patients on new hires, changes in clinic services and health promotion materials. In these many small ways, patients have come to be viewed as members of the team who have a stake in the clinic’s work and who partner with the clinic toward their mutual goals.
[Clinician]: …They value that we’re doing our best and putting out there that we still have work to do … they’re more willing to pitch in and give their advice and opinions, just even off the cuff during visits, which is amazing. Coming from the perspective of a physician that doesn’t know everything, putting it out there that we’re doing quality improvement, that becomes okay. Patients are much more comfortable with exploring things through with us.

86
Conclusions: Exemplary Practices of PCPCH Clinics This examination of 20 exemplary PCPCH clinics has yielded insights into the practices that make them exemplary, as well as identifying some of the barriers that impede the implementation and sustainability of the PCPCH program and some of the facilitators of the program’s success. These barriers and facilitators to program success were discussed at the end of the section on cross-cutting themes; the following discussion focuses on defining what makes an exemplary clinic. From the data gathered from interviews and focus groups with 20 exemplary clinics, it is evident that clinic leaders embrace and champion the concept of a learning organization13. While none of the interviewees used this term specifically, review of the results and analysis shows that exemplary clinics that are successfully implementing the PCPCH program are engaged in the following:
Systems thinking. Clinic leaders are willing to examine all the processes and practices of their organization in order to assess and improve its collective performance.
Personal mastery. Clinic leaders value individual learning among their staff, and thus work to facilitate training, development, and continuous self-improvement so that all staff can work “to the top of their license.”
Mental models. Clinic leaders and staff continuously question their mental models – the assumptions about how the clinic should operate and how the work should be done. They are willing to “unlearn” ways of doing things that no longer are sufficient.
Shared vision. Through leadership, organization culture changes, and (sometimes) staff turnover, exemplary clinics have been able to develop a shared vision of the meaning of care and how it is provided, which provides focus and energy to keep learning.
Team learning. Individual clinic staff are learning, which enhances team learning, which in itself allows the staff to grow more quickly and build the problem-solving capacity of the clinic through better access to knowledge and expertise. Clinic teams have been enabled to engage in shared dialogue, discussion and open communication about both successes and failures without fear of reprisal, thus allowing for the creation, acquisition, dissemination, and implementation of knowledge across the clinic.
For the PCPCH program to be sustained and spread further, OHA will need to address barriers to the program’s implementation and sustainability to assist both exemplary clinics to sustain a learning organization model and those clinics that are either struggling with or thinking about PCPCH implementation. Clinics must be aware that PCPCH implementation is a long and arduous process, and while there is potential for a return on investment in the long run, it requires considerable investment of resources in the beginning. Clinics need support and suggested remedies in these specific areas: an unprepared workforce, insufficient financial incentives, complex patient populations, and difficulty with organizational capacity and technology issues. As well, OHA will need to provide continued support and technical assistance in the areas that facilitate program implementation and sustainability, including support for enacting leadership and culture change; care coordination; standardization of work flows, processes, and procedures; and ways to effectively harness the power of team-base care. These recommendations are discussed in more detail in the main synthesis report.
13 Senge, 1990.