implementation of qbd for existing products
TRANSCRIPT

Implementation of QbD for Existing Products An Example from GSK Australia

Jonathan Parks
B.Sc (Hons) from Monash University in 1990
Started at Glaxo (as it was called then) in 1991 as a Development Chemist in Pharmaceutical Development – Worked on the development of Blow-Fill-Seal (BFS) products for nebulisation and Dry Powder Inhalation (DPI) products
Moved into Manufacturing/Quality Assurance for GSK in 2001 – Led the QC Technical and Laboratory Operations and Steriles and Inhaled Product Groups
Moved to Technical as a Technical Project Leader in 2009 – Work on the interface with R&D and GMS called NPI – New Product Introduction
– Sterile and Inhaled New Products for Current and Emerging Markets
– Collaboration with Monash University Institute of Pharmaceutical Science (MIPS)
– Manage the implementation of Product Lifecycle Management (PLM) (or QbD) at site – “Product Owner” for all DPI products

OVERVIEW OF TODAY
• QbD = Key Quality requirements for the development, manufacture and control of drug products – Drug Product Pharmaceutical Development
– Quality by Design (QbD) Approaches
– Product Control Strategy
– Product Lifecycle Management (PLM) Approach to ensure ongoing Product Robustness
• How these feed into the final registered details – Drug Product Pharmaceutical Development
– Control of Critical Steps (In Process Controls – IPC)
– Drug Product Specifications
• Example of Ventolin Nebules – Virtual product tour where we will follow the product through the manufacturing and how the Product Control Strategy supports the Quality and
Robustness of the Product Manufacture process
Drug Product Pharmaceutical Development
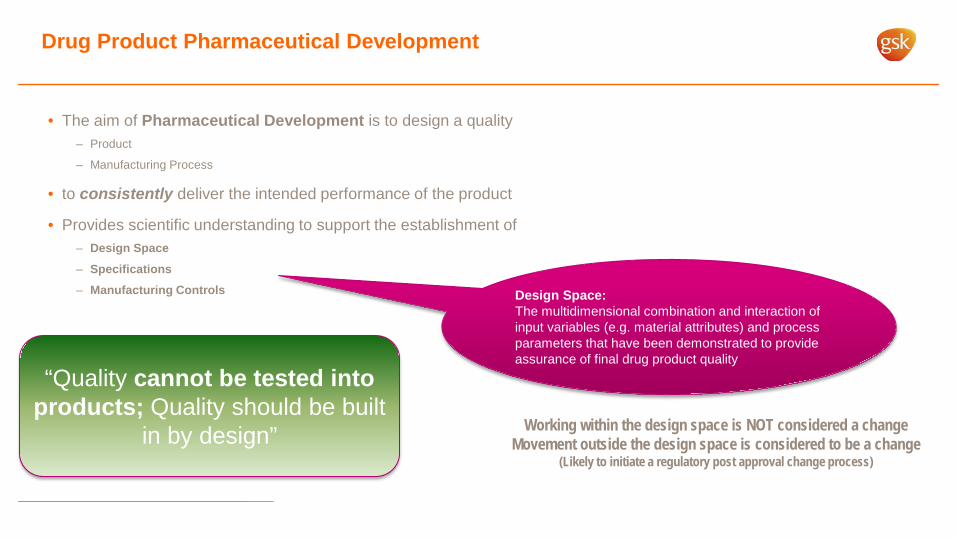
• The aim of Pharmaceutical Development is to design a quality – Product
– Manufacturing Process
• to consistently deliver the intended performance of the product
• Provides scientific understanding to support the establishment of – Design Space
– Specifications
– Manufacturing Controls Design Space: The multidimensional combination and interaction of input variables (e.g. material attributes) and process parameters that have been demonstrated to provide assurance of final drug product quality
“Quality cannot be tested into products; Quality should be built
in by design” Working within the design space is NOT considered a change Movement outside the design space is considered to be a change
(Likely to initiate a regulatory post approval change process)

Minimal Approaches
• Components of the Drug Product – Drug Substance/s
– Excipient/s
• Drug Product – Formulation Development
– Overages
– Physicochemical and Biological Properties
• Manufacturing Process Development
• Container Closure System
• Microbiological Attributes
All aspects that are Critical to Product Quality should be determined and
control strategies justified
Critical formulation attributes and process parameters are generally
identified through an assessment of the extent to which their variation can have
impact on the quality of the drug product
“Oliver” Top Gear Africa Challenge Gets the job done but the journey can be rough, interrupted,
require frequent changes and always the potential for catastrophic failure
Left to Right Thinking

Enhanced Quality by Design (QbD) Approaches
• Choose to conduct Pharmaceutical Development studies that can lead to an enhanced knowledge of product performance over a wider range of material attributes, processing options and process parameters.
• Demonstrate a higher degree of understanding
• Facilitates an expanded design space
• Opportunity to develop flexible regulatory approaches: – risk-based regulatory decisions (reviews and inspections)
– manufacturing process improvements, within the approved design space described in the dossier, without further regulatory review
– reduction of post-approval submissions
– real-time quality control, leading to a reduction of end-product release testing
Toyota Hilux (Top Gear North Pole Special) More ROBUST Approach to the Challenge
Right to Left Thinking
Enhanced, Quality by Design Approaches (Combination of ICH Q8, Q9 and Q10)
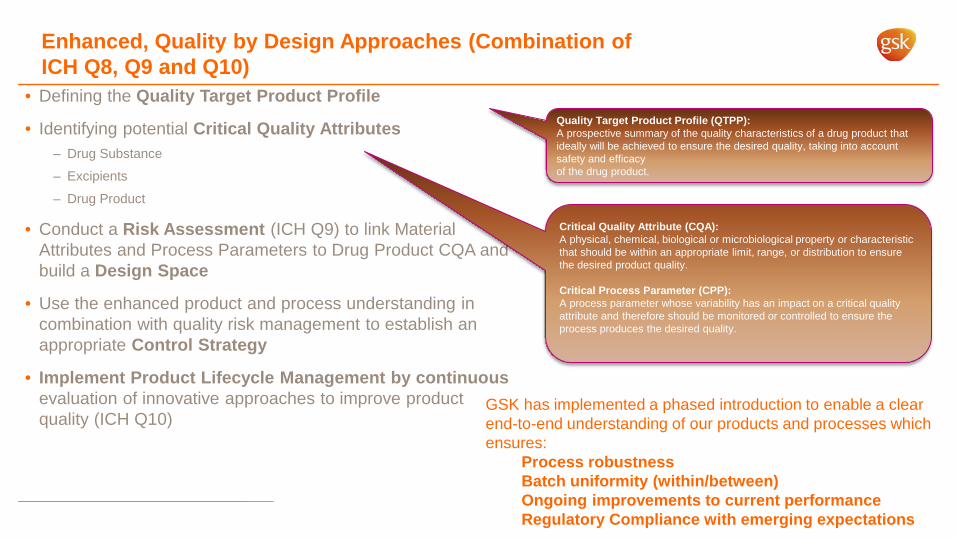
• Defining the Quality Target Product Profile
• Identifying potential Critical Quality Attributes – Drug Substance
– Excipients – Drug Product
• Conduct a Risk Assessment (ICH Q9) to link Material Attributes and Process Parameters to Drug Product CQA and build a Design Space
• Use the enhanced product and process understanding in combination with quality risk management to establish an appropriate Control Strategy
• Implement Product Lifecycle Management by continuous evaluation of innovative approaches to improve product quality (ICH Q10)
Quality Target Product Profile (QTPP): A prospective summary of the quality characteristics of a drug product that ideally will be achieved to ensure the desired quality, taking into account safety and efficacy of the drug product.
Critical Quality Attribute (CQA): A physical, chemical, biological or microbiological property or characteristic that should be within an appropriate limit, range, or distribution to ensure the desired product quality. Critical Process Parameter (CPP): A process parameter whose variability has an impact on a critical quality attribute and therefore should be monitored or controlled to ensure the process produces the desired quality.
GSK has implemented a phased introduction to enable a clear end-to-end understanding of our products and processes which ensures:
Process robustness Batch uniformity (within/between) Ongoing improvements to current performance Regulatory Compliance with emerging expectations

Pharm’ Development
Tech’ Transfer
Commercial Manufacture
Process Performance
& Product Quality
Monitoring
Risk
Assessment (ICH Q9)
Product Control Strategy
Validation Lifecycle Approaches (ICH Q10)
Stage 1 Process Design documents are developed (Development History, Technology Transfer, Risk
Assessment, Draft Product Control Strategy).
Stage 2 the Product Control
Strategy is demonstrated to be fit for purpose.
Stage 3 is used to capture changes, trend and demonstrate that the process
is still operating in a state of control.
Process Design
(Stage 1)
Process Qualification
(Stage 2)
Continued Process
Verification (Stage 3)
Validation Master Plan
Validation Summary
Change Control
For Existing Products - Pragmatic Start with Stage 3 (Data Trending)

• Product & Process Risk Management
• Risks are associated with the quality, safety and efficacy of the product itself – How the product behaves during processing
– How it interacts with equipment, devices, packaging and its environment.
• Single team, structured approach focussed on product and process understanding
• Supports development of good control strategies and standard work
• The RA is maintained through the product lifecycle, regularly reviewed and updated in response to change
• Key Tools – Process Definition Diagrams – Mechanism Maps – Failure Mode and Effects Analysis (FMEA).
Risk Assessment
AIM: To predict risks based on knowledge and process understanding and implement mitigation
plans to prevent issues from occurring
RA’s if correctly executed (leading to an effective control strategy) will reduce the likelihood of problems
occurring.
FILLING OF DYE PRESS
ATTRITION
BUILD UP OFMATERIAL ON
HOPPER OUTLET
ATTRITION
SHEAROVER-MIXINGRESULTS INCOMPLETE
COVERAGE OFPARTICLES
REDUCES H2 BONDFORMATION UPON
COMPACTIONS

Product Control Strategy
• A control strategy is designed to ensure that a product of required quality will be produced consistently. – Derived from the Risk Assessment (plus any pharmaceutical development studies which have identified sources of variability that can impact product quality
and should be controlled)
• A control strategy can include the following: – Control of input material attributes based on an understanding of their impact on manufacture process or product quality
– Product specifications
– Controls for unit operations that have an impact on downstream processing or product quality
– In-process or real-time release testing in lieu of end-product testing
– A monitoring program (e.g., full product testing at regular intervals) for verifying multivariate prediction models.
• A control strategy can include different elements. For example, one element of the control strategy could rely on end-product testing, whereas another could depend on in process testing.
• Used to define the batch manufacturing record, testing regime, validation approach and registered product specification
Spec
ifica
tion
Valid
atio
n
= + + +
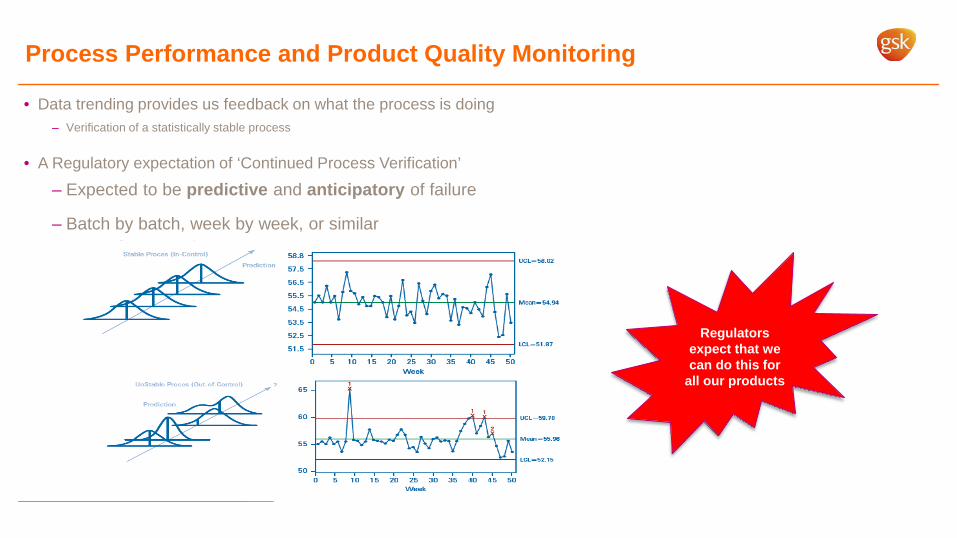
Process Performance and Product Quality Monitoring
• Data trending provides us feedback on what the process is doing – Verification of a statistically stable process
• A Regulatory expectation of ‘Continued Process Verification’
– Expected to be predictive and anticipatory of failure
– Batch by batch, week by week, or similar
Regulators expect that we can do this for
all our products

CHANGE CONTROL – BECAUSE NOTHING STAYS THE SAME!
• Innovation
• Continual Improvement
• Output of process performance and product quality monitoring
• CAPA (Corrective and Preventative Action)
• All changes MUST be evaluated properly using an effective change management system that – Is Timely and Effective
– Provides a high degree of assurance there are no unintended consequences of the change.
– Utilises quality risk management to evaluate ALL proposed changes against • The Marketing Authorisation • Design Space (where established) • Current Product and Process Understanding.
– Involved expert teams contributing the appropriate expertise and knowledge from relevant areas (e.g., Technical, Manufacturing, Quality, Regulatory Affairs and Medical), to ensure the change is technically justified
– Monitors the effectiveness of the change after implementation
• The cumulative effect of change should also be undertaken at regular intervals (usually through Process Performance and Product Quality Monitoring) to confirm product quality
DRIVE PRODUCT CHANGE

VENTOLIN NEBULES (VNS)
• SALBUTAMOL is a selective β2 adrenoceptor agonist.
– At therapeutic doses it acts on the β2 adrenoceptors of bronchial muscle, with little or no action on the heart. With its fast onset of action, it is particularly suitable for the management and prevention of asthma attack
– Available in many respiratory dose formats (DPI, MDI, Oral Syrups, Respirator Solutions)
• VENTOLIN NEBULES (VNS) – Solution Dose form administered to the lungs with the use of a
portable nebuliser system
– Available as both 2.5mg/2.5mL and 5mg/2.5mL strengths
– Marketed in Australia and many markets across Europe, Middle East, Asia, Africa, North and South America.

• Derived from
• Regulatory Guidance on Inhalation Products (EMEA/CHMP/QWP/49313/2005)
• Based on Dose Form/Intended use of the product
• Ventolin Nebules is Single Dose Nebulised Product
• Standard aqueous drug product specification tests. Refer to ICH Q3B (Impurities) and ICH Q6A (Specifications)
• e.g. ID, degradation products, pH, isotonicity
• Specification values based on • Observed range of variation in batches evaluated in-vivo
studies
• Process Capability data
• Stability data
• Note different tests and limits may apply at release versus shelf life . Shelf life acceptance criteria should be derived from stability data and the changes observed on storage
00 Month 0000 Presentation title in footer
VNS DRUG PRODUCT CQA’s

VNS MANUFACTURING PROCESS

VNS CONTROL STRATEGY IMPLEMENTING THE PRODUCT CONTROL STRATEGY
• CQAs / CPPs (and their defined ranges) define the Design Space
• What’s needed is to translate this Control Strategy effectively into STANDARD WORK across all product and process operations
• Consider 4 Areas:
Capability
•The capability of the people maintaining, setting-up, running and managing the process (Understanding)
Engineering
•The processes for maintaining the validated state of the equipment over the long term (Reliability)
Setup
•The way the equipment is setup to ensure the CPPs / CQAs are under control at the start of the batch (Batch Document / SOP)
Ongoing operation
•What is measured / trended and what actions are taken to ensure the CQAs / CPPs remain under control (IPC Checks / Product Quality Monitoring)
Compliance with Control Strategy
Compliance with Control Strategy
Assurance of Final Product Quality =

Single Best Ways (SBW’s) in place for steps that are critical to the process/considered higher risk of going wrong
Product Robustness Boards are being developed • Situated in Production • Reviewed regularly by Production/Technical/Quality/Validation • Contain
• Summary PCS information • Ongoing Process Performance Information as it related
to Product Quality/Robustness • GEMBA sheets to enable PCS understanding across the
value stream to be assessed
• Intended to enable a focus on the Product and share and improve people capability and understanding
Ideas for how to Integrate Product Control Strategy into Production Product Robustness Boards and Single Best Ways

Ideas for how to Integrate Product Control Strategy into Production
18
Critical Process Parameters (CPP) Control Chart
As part of the PPA process the CPP’s (as identified in the Control Strategy) are also trended at the point of use by operators.

Process Performance and Product Quality Monitoring (Product Performance Assessment - PPA)
19
Wider PPA Team
Review
Core PPA Team Review
First Line Review
Escalation
Problem Solving
Data Entry and Review by Data Owners Known changes are recorded in data entry sheet. Issues identified
to escalate to Core Team.
Routine Review by Core PPA Team Detailed statistical review of each product. Major rule breakages identified and
escalated to Wider Team. Initiate PSG’s. Implement JDI’s. Prepare Product Dashboard and PPA Log for Wider PPA Team Review.
Formal Review by Wider PPA Team Review each Product Dashboard and escalation items. Review and approve all decisions taken. Ensure appropriate actions are in place to mitigate all risks and confirm product robustness and
capability. Issue Product Dashboard and PPA Log with all actions and decisions tracked. Escalate serious risks to SQC.

Signal to Stop – An Example of the Value of Real Time Product Quality Monitoring and knowing your Product and when something “feels wrong”
(10.0)
0.0
10.0
20.0
30.0
40.0
50.0
DK81
46DK
8149
SP00
03SP
0004
SP00
05SP
0007
SP00
08SP
0009
SP00
10SP
0011
SP00
12SP
0013
SP00
14SP
0015
SP00
16SP
0017
SP00
18SP
0019
SP00
20EV
0001
SP02
69SP
0270
SP02
71EV
0269
SP02
72SP
0273
SP02
74SP
0275
EV02
71SP
0276
SP02
77SP
0278
SP02
79EV
0273
SP02
80SP
0281
SP02
83SP
0284
SP02
85SP
0286
SP02
87SP
0288
SP02
89SP
0290
SP02
91EV
0275
SP02
92SP
0293
SP02
94SP
0295
SP02
96SP
0302
SP03
03SP
0304
SP03
60EV
0276
SP03
61SP
0366
SP03
67EV
0279
SP03
68SP
0369
SP03
70SP
0372
SP03
73SP
0374
BatchHighest Delivered Dose Average1 SD 2 SD3 SD LSLUSL 5 per. Mov. Avg. (Highest Delivered Dose)
Provisional Ppk 1.14
• Dry Powder Inhaler Product – Uniformity of Delivered Dose (Highest Individual Dose) Trend • Trend shows typical variation given the nature of the test (sample prep, individual dose test) • Sudden change with high (OOS) result • Campaign had already made further batches – another high result (Atypical) noted • Considered sufficiently unusual to trigger a “signal to stop” • RCA determined to be due to inappropriate storage of the current lot of API • Manufacture commenced with new lot of API – trend returned to normal. • Control Strategy Updated

Benefits of QbD to Existing Products
• Benefit to PRODUCT QUALITY – Captures the key Quality requirements for a drug
product
• Benefit to MANUFACTURING PROCESS PERFORMANCE
– Improves Operational Efficiency
– Less Down time
– Better Yields
• More Robust Manufacturing Processes
= a More Robust Product
• Benefit to the Patient at the end of the Supply Chain
Production
QbD
Quality

QUESTIONS ?

BACKUP SLIDES

Control Chart Rules
• Documented Data Trending Plan states what parameters are trended for each product – Typically trend all drug product and input material CQA’s (Critical Quality Attributes) and Critical Process Parameters (CPP’s) as determined in the RA
– Trend against historical data (typically a minimum of 30 batches)
– Look for PPA Rule Breakages using three Control Chart Rules
Product Performance Assessment – Boronia Approach 24
Control Chart Rules
Run Rule 1: Single point outside 3 std deviations
Run Rule 2: 8 consecutive points on one side of center line
Run Rule 3: 7 consecutive points increasing or
decreasing

Capability (Ppk) Interpretation
Ppk
OOS Risk
(PPM*)
Process Status
Ppk > 2 <0.002 Highly capable
2>Ppk > 1.33 0.002 -63 Capable
1.33>Ppk > 1 63 - 2700 Marginally capable (Risk of OOS)
Ppk < 1 >2700 Incapable (Significant risk of OOS)
*PPM=Parts Per Million
Low Ppk • Process Off Target and Low Variability (Ppk<Pp) • Process On Target and High Variability (Ppk≈Pp)
Note
• Ppk interpretation in PPM is based on the assumption of data distribution is Normal • Non-normal data distribution needs different approach of capability assessment