implementing a pavement management systemco-asphalt.com/wp-content/uploads/2016/04/... · • asset...
TRANSCRIPT

Implementing a
Pavement Management SystemPASER Based – City of Omaha, NE

Introductions
JESS HASTINGS, PEProject Manager10 Years of Experience
TIM O’BRYAN, PESenior Project Manager30 Years of Experience

Introduction
• 29 Offices in 16 States
• +600 Professionals
Full-Service Consulting Firm• Transportation Focus• Value Engineering and Planning Background• Asset Management
Pavement Management Experience• Cities, Counties, DOT’s and Airports• PCI Evaluations• PASER Evaluations
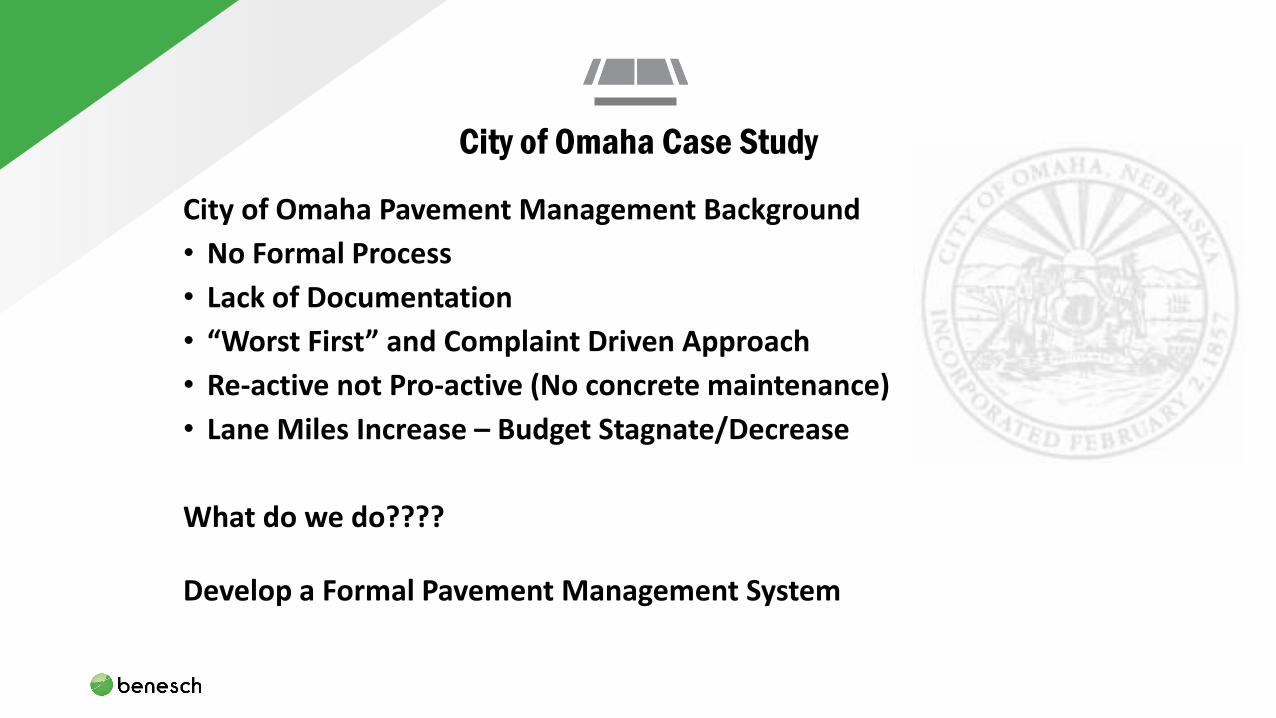
City of Omaha Case Study
City of Omaha Pavement Management Background
• No Formal Process
• Lack of Documentation
• “Worst First” and Complaint Driven Approach
• Re-active not Pro-active (No concrete maintenance)
• Lane Miles Increase – Budget Stagnate/Decrease
What do we do????
Develop a Formal Pavement Management System

Why Pavement Management?
• Save maintenance and reconstruction costs
• Provides systematic method of maintaining network
• Increase longevity of pavement
• Assists with prioritization of maintenance and repair work
• Integrates scheduling and different department efforts
• Assist decision-makers with budgets
• Improve effectiveness of resources spent on network

Why Pavement Management?
• Pavement does not deteriorate in a linear fashion
Age of Pavement

Why Pavement Management?
• Increase Pavement Longevity with Routine Maintenance
Age of Pavement

Why Pavement Management?

Step 1 – Define Network
City of Omaha, Nebraska
• Approximately 4,600 lane miles of roadway
Roadway Classification Lane miles
• Major and Minor Arterials ---- 1175
• Collector Streets ----------------- 351
• Local Roadways ------------------ 3008
• Park and Frontage Roads------ 62
Roadway Surface Lane miles
• Asphalt --------------------------- 1788
• Concrete -------------------------- 2598
• Brick ------------------------------- 60
• Unimproved --------------------- 150

Step 2 – Establish a Standard Rating System
Objectives
• Consistent and Comprehensive Process • Functional and Easy to Maintain• Ability to Coordinate with other Divisions • Tool to Educate Decision Makers • Cost effective
Internal Assessment
• Integrate Existing Data• Review historical resurfacing cycles • Develop Program Objectives

Step 2 – Establish a Standard Rating System
Many Different Choices• Very Simple >>>>>> Extremely Complex
Items Considered• Subjectivity• Amount of Measurements• Specific Distresses and Locations• Ability to Utilize Empirical Software• Modelling and Projecting• Simplicity for Non-Technical Personnel to Understand

Step 2 – Establish a Standard Rating System
PAvement Surface Evaluation and Rating (PASER)• Developed by the University of Wisconsin• Visual Inspections with Rating System• Easy and cost effective to implement• Correlates rating to maintenance activity
*The Michigan Transportation Asset Management Council selected PASER as the statewide standard

PASER Rating System
PASER Rating System for Paved Roadways (Asphalt or Concrete)
Rating Condition Needed Maintenance or Repair1 FAILED Needs total reconstruction.2 VERY POOR Severe deterioration. Needs reconstruction with extensive base repair.3 POOR Needs major patching & structural overlay or complete recycling.4 FAIR Significant aging and first signs of need for strengthening. Would benefit from recycling or overlay.5 FAIR Surface aging, sound structural condition. Needs sealcoat or nonstructural overlay.6 GOOD Shows sign of aging. Sound structural condition. Could extend life with sealcoat.7 GOOD First signs of aging. Maintain with routine crack filling and minor patching.8 VERY GOOD Recent sealcoat or new road mix. Little or no maintenance required.9 EXCELLENT Recent construction or overlay, like new. No maintenance required.10 EXCELLENT New Construction. No maintenance required.

PASER Rating System
PASER Rating System for Asphalt Roadways
4 Major Categories for Asphalt Pavement Distress
• Surface Defects
o Raveling, flushing, polishing
• Surface Deformation
o Rutting, shoving, heaving
• Cracks
o Transverse, reflective, alligator
• Patches and Potholes

PASER Rating System
PASER Rating System for Concrete Roadways
4 Major Categories for Concrete Pavement Distress
• Surface Defects
o Spalling, polishing, map cracking, rebar
• Joints
o Longitudinal and transvers
• Cracks
o D-cracking, Corners, Random
• Deformation
o Blow ups, faulting, heaves,patches, potholes, utilities

PASER Rating System
PASER Rating System for Unpaved Roadways (Gravel or Sealcoat)
Rating Condition Needed Maintenance or Repair1 FAILED Complete rebuilding required. 2 POOR Needs addition of aggregate plus drainage maintenance.3 FAIR Needs routine regrading plus minor ditch maintenance.4 GOOD Good crown and drainage.5 EXCELLENT Excellent crown and drainage

PASER Rating System
PASER Rating System for Gravel Roadways
5 Major Categories for Gravel Road Evaluations
• Crown
• Drainage
• Ditches and culverts
• Gravel Layer
• Thickness and quality
• Surface Deformation
o Washboarding, potholes, ruts• Surface Defects
o Dust and loose gravel

PASER Rating System
PASER Rating System for Brick and Unimproved Roadways
Rating Condition Needed Maintenance or Repair1 POOR Reconstruction needed.2 FAIR Significant grading required.3 GOOD Routine maintenance or spot grading helpful.4 VERY GOOD No improvement needed.

PASER Rating System
PASER Rating System for Brick Roadways
2 Major Categories for Brick Road Evaluations
• Defects
o Gaps, breaks, joint erosion,settlement, patches
• Ride Quality

Step 3 – Establish Network Condition Baseline
• Integrate/Convert Existing Data to PASER Rating
• Establish Roadway Network Segments (To and From)
• Determined a Conversion Method by Comparisons & Assumptions
Conditions Concrete Ride Concrete Base Concrete Patching Concrete Cracking Concrete Joints Concrete Spalling
1 Excellent No signs of any base failure No patches No cracksAll joint patterns are normal
and sealedNo spalling
2Can feel joints and areas of
grade when driving
Little base failure; Possible blowup -fix w/ concrete
repair
Little patching; utility cuts poured back with concrete
Shrinkage & random cracking (1-2 times/block)
Wide, unsealed joints; Not too late to seal; Joints in
good shape
Slight spalling @ time of construction
3Can feel several joints, cracks, and some base
failure
Surface off grade, up to 2X per block
Little patching (low areas by inlets); Fix w/ conc. repair
Longitudinal cracks on 1 side (I.e. sewer trench) Max.
1/panel
Off grade joints w/ some spalling; Not to late to seal
Slight spalling Mostly salt damage
4Very bad ride; Asphalt and
concrete repairs feltSeveral areas of base repair;
Too late for repair?
Several asphalt patches, too late for concrete repair,
good asphalt base3-4 cracks per panel
Over 50% of joints patched, spalled and failed; Beyond
sealingOver 50% of area spalled
5 Next to impossibleBase is shot; Possible conc. removal and replacement
before asphalt
Beyond conc. panel repair; 1/3 asphalt surface, possible
R & R with concrete
Beyond concrete panel repair
All joints spalled and asphalt patched; all joints failed
Entire area spalled
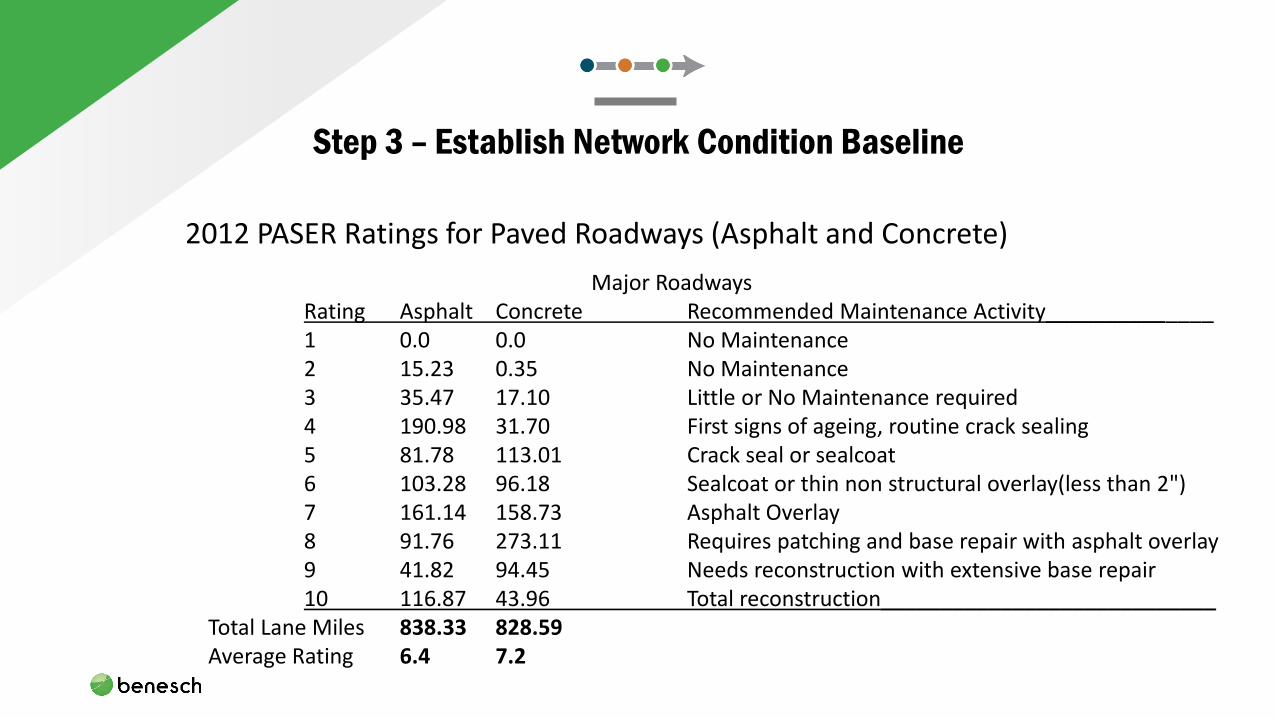
Step 3 – Establish Network Condition Baseline
2012 PASER Ratings for Paved Roadways (Asphalt and Concrete)
Major RoadwaysRating Asphalt Concrete Recommended Maintenance Activity______________1 0.0 0.0 No Maintenance2 15.23 0.35 No Maintenance3 35.47 17.10 Little or No Maintenance required4 190.98 31.70 First signs of ageing, routine crack sealing5 81.78 113.01 Crack seal or sealcoat6 103.28 96.18 Sealcoat or thin non structural overlay(less than 2")7 161.14 158.73 Asphalt Overlay8 91.76 273.11 Requires patching and base repair with asphalt overlay9 41.82 94.45 Needs reconstruction with extensive base repair10 116.87 43.96 Total reconstruction____________________________
Total Lane Miles 838.33 828.59Average Rating 6.4 7.2
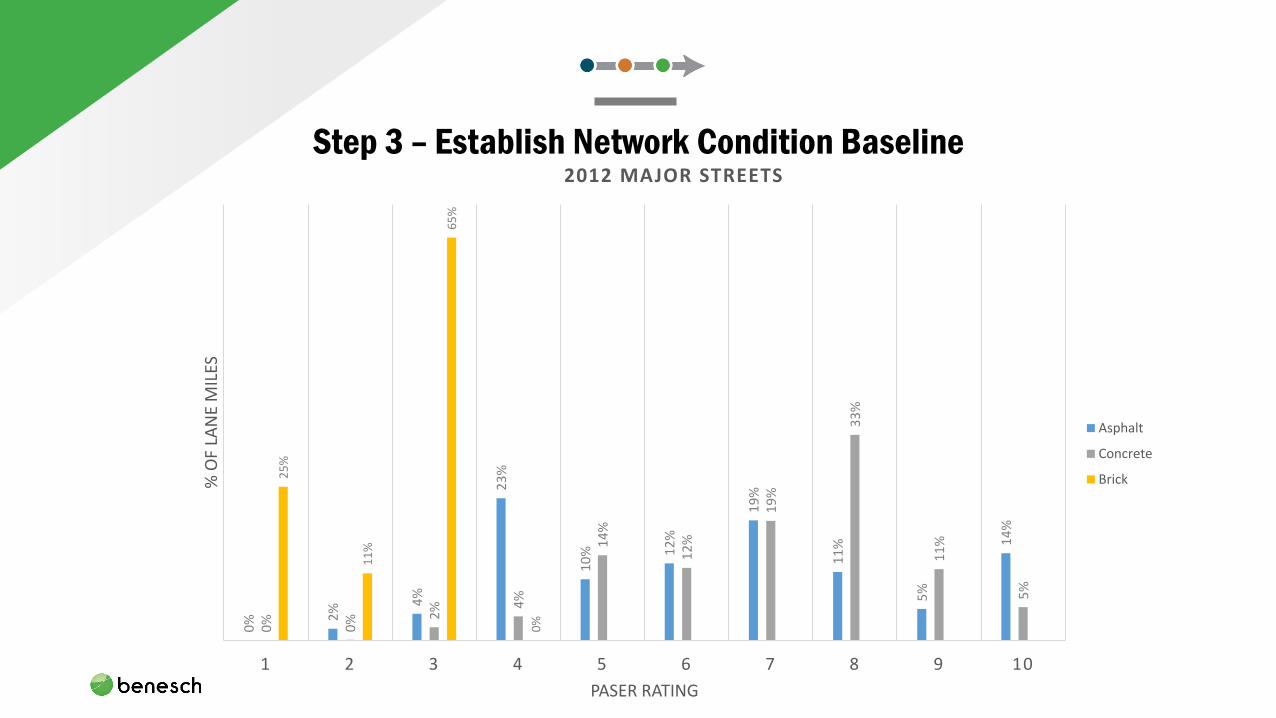
Step 3 – Establish Network Condition Baseline
0% 2
%
4%
23
%
10
% 12
%
19
%
11
%
5%
14
%
0% 0% 2
% 4%
14
%
12
%
19
%
33
%
11
%
5%
25
%
11
%
65
%
0%
1 2 3 4 5 6 7 8 9 10
% O
F LA
NE
MIL
ES
PASER RATING
2012 MAJOR STREETS
Asphalt
Concrete
Brick

Step 4 – Identify Condition Targets
• Overall Rating of 7 for Paved Major/Arterial Roadways
• Overall Rating of 6 for Paved Collector and Local Roadways
• Overall Rating between 2 and 3 for Gravel and Sealcoat Roadways
• Overall Rating of 3 for Brick and Unimproved Roadways
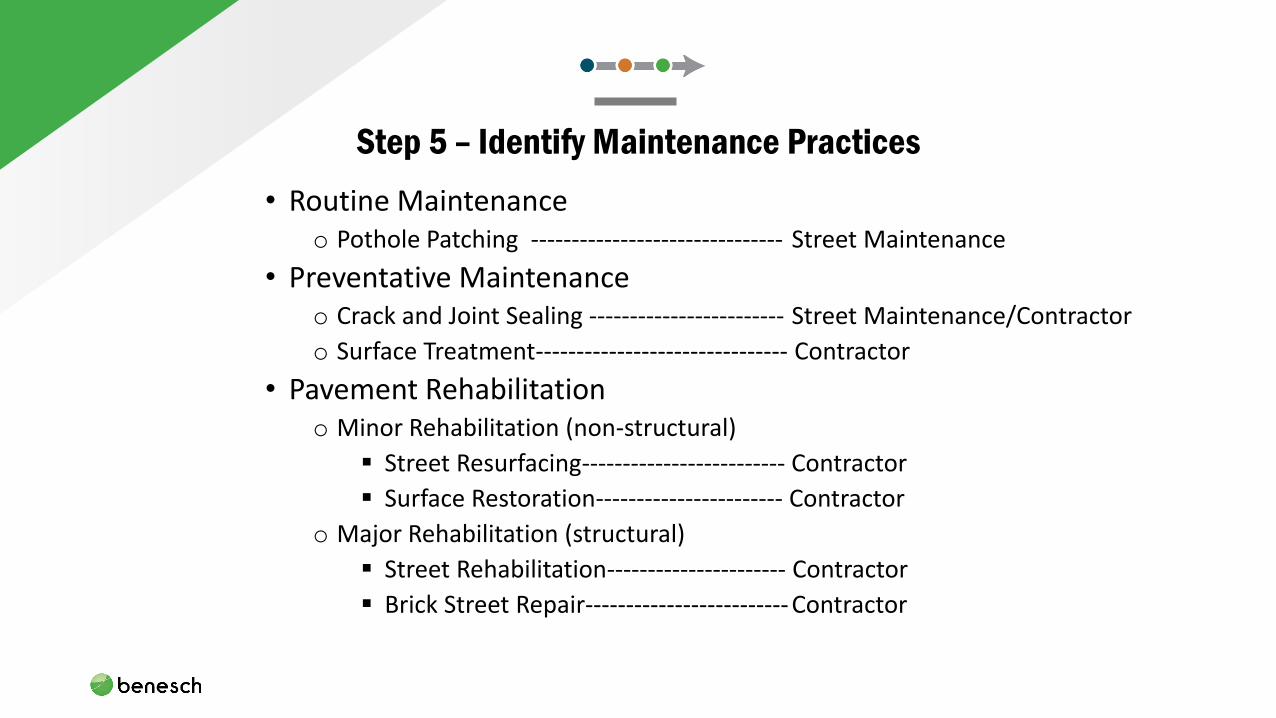
Step 5 – Identify Maintenance Practices
• Routine Maintenanceo Pothole Patching ------------------------------- Street Maintenance
• Preventative Maintenanceo Crack and Joint Sealing ------------------------ Street Maintenance/Contractor
o Surface Treatment------------------------------- Contractor
• Pavement Rehabilitationo Minor Rehabilitation (non-structural)
Street Resurfacing------------------------- Contractor
Surface Restoration----------------------- Contractor
o Major Rehabilitation (structural)
Street Rehabilitation---------------------- Contractor
Brick Street Repair------------------------- Contractor

Step 5 – Identify Maintenance Practices

Step 5 – Identify Funding Needs
• Educate Decision-Makers & Elected Officials
• Where we were at
• Where we need to be
• Assess Annual Budget – What Does it Accomplish
• Determine Life Cycle Costs and Correlating Annual Budgets
• What’s the Cost for Target Life Cycle / Condition Ratings?
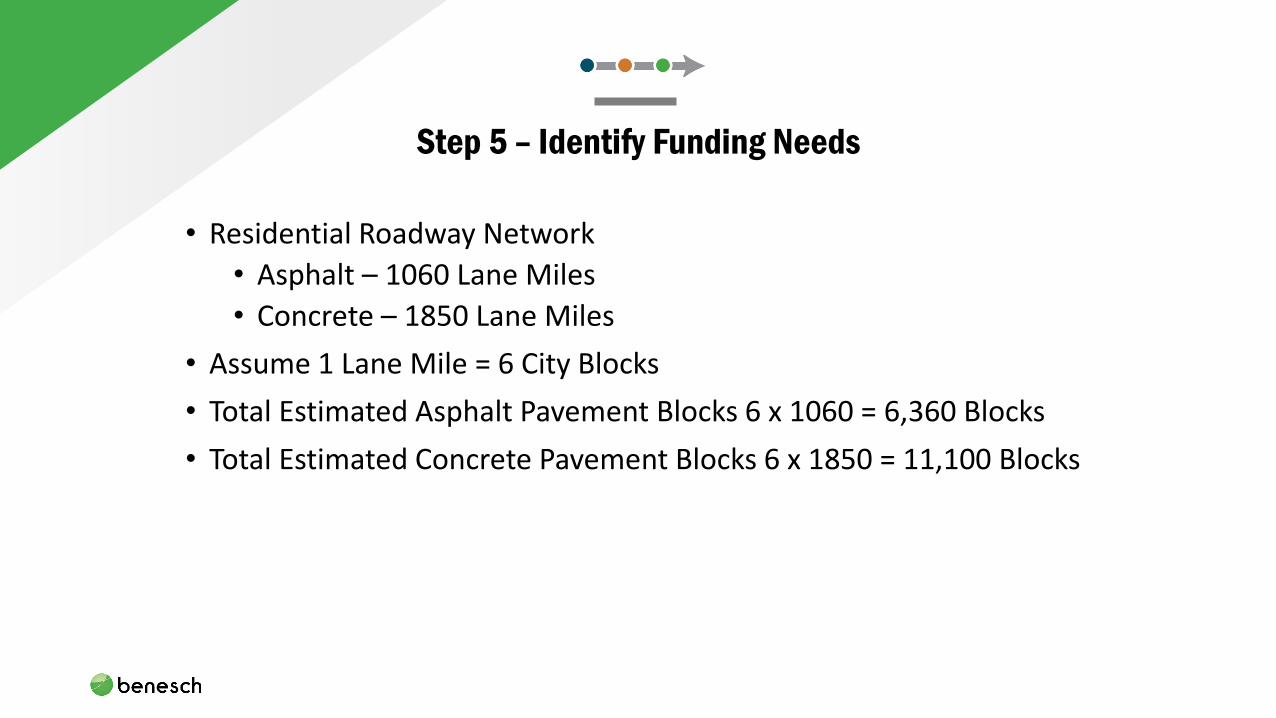
Step 5 – Identify Funding Needs
• Residential Roadway Network
• Asphalt – 1060 Lane Miles
• Concrete – 1850 Lane Miles
• Assume 1 Lane Mile = 6 City Blocks
• Total Estimated Asphalt Pavement Blocks 6 x 1060 = 6,360 Blocks
• Total Estimated Concrete Pavement Blocks 6 x 1850 = 11,100 Blocks

Step 5 – Identify Funding Needs
Estimated Cost to Maintain One Asphalt Residential Block
• Assumes life expectancy of 16 years for asphalt roadways
• Cost includes resurfacing and maintaining (crack sealing)
Resurface One Block $10,725Base Repair and Utility Adjustments $1,275Install ADA Curb Ramps (4 corners) $12,000Crack Sealing (4 year, 8 year, 12 year) $8,820 Estimated Cost to Maintain One Block $32,820

Step 5 – Identify Funding Needs
• 6,360 Blocks of Residential Asphalt Roadways
• For a 16 Year Life Cycle 6,630 ÷ 16 = 398 Blocks/year
• Cost to maintain 398 Blocks/year X $32,820 = $13,045,950
Cost to Maintain at various Life Cycles
Life Cycle 24 22 20 18 16Blocks per year 265 289 318 353 398Cost to resurface $6,360,000 $6,938,181.82 $7,632,000 $8,480,000 $9,540,000Crack Seal Year 4 $779,100 $849,927 $934,920 $1,038,800 $1,168,650Crack Seal Year 8 $779,100 $849,927 $934,920 $1,038,800 $1,168,650Crack Seal Year 12 $779,100 $849,927 $934,920 $1,038,800 $1,168,650Total Cost $8,697,300 $9,487,964 $10,436,760 $11,596,400 $13,045,950

Step 5 – Identify Funding Needs
Remember to Identify Funding by Departments and Programs!
• Previous example had potentially 3 different departments or programs and therefore different budgets or sources
Department/ProgramResurface One Block $10,725 StreetsBase Repair and Utility Adjustments $1,275 StreetsInstall ADA Curb Ramps (4 corners) $12,000 SidewalkCrack Sealing (4 year, 8 year, 12 year) $8,820 Maintenance
Step 6 – Implement Pavement Management Plan
• Have decision makers and/or elected officials understand current and target conditions of network
• Appropriate funds to different identified strategies
• Determine cycle for re-rating roadways
• Monitor and update roadway network ratings based on work performed and ratings
• Research and implement new strategies

Results of City’s Pavement Management System
• Increase of Streets Funding
• Increase of Funding Sources
• State and Federally funded projects
• Established Documented System
• Increase in Overall Network Rating
• Acceleration of City’s ADA Network
• Development of City’s Asset Management Plan


2015 PASER Ratings for Paved Roadways (Asphalt and Concrete)2012 Major 2015 Major
Rating Asphalt Concrete Asphalt Concrete 1 0.0 0.0 0.0 0.0 2 15.23 0.35 1.8 0.03 35.47 17.10 12.59 0.0 4 190.98 31.70 117.81 19.26 5 81.78 113.01 92.26 92.77 6 103.28 96.18 148.14 149.207 161.14 158.73 169.02 281.04 8 91.76 273.11 166.51 263.55 9 41.82 94.45 113.2 110.1110 116.87 43.96 112.35 27.17
Total Lane Miles 838.33 828.59 933.68 943.1 Average Rating 6.4 7.2 7.0 7.2
Results of City’s Pavement Management System

Results of City’s Pavement Management System
0% 0% 1
%
13
%
10
%
16
% 18
%
18
%
12
%
12
%
0%
0%
0% 2
%
10
%
16
%
30
%
28
%
12
%
3%
40
%
57
%
3%
0%
1 2 3 4 5 6 7 8 9 10
% O
F LA
NE
MIL
ES
PASER RATING
2015 MAJOR STREETS
Asphalt
Concrete
Brick

Future Goals of City’s Pavement Management System
• Integrate Database into City’s GIS System
• Add additional features
• Curb and gutter
• Shoulders
• Median Surfacing
• Guardrail
• Implement Alternative Pavement Preservation and Preventative Maintenance Methods

Additional Information and Sources
• MGPEC
• State and Local Agencies
• FHWA, NHI, NCHRP, AASHTO
• LTAP
Jess Hastings, PE Tim O’Bryan, PE
303-771-6868 402-333-5792

Questions ?
?