implementing methodologies and practices to reduce air...
TRANSCRIPT

Implementing Methodologies and Practices to Reduce air pollution Of
the subway enVironmEnt
01/10/2014 - 31/03/2018
Coordinador: Consejo Superior de Investigaciones Científicas (611.526 €)
Miembros asociados: Ferrocarril Metropolita de Barcelona, S.A (76.063 €) Transports de Barcelona, S.A (25.038 €)
El objetivo del proyecto es proporcionar a las autoridades de transporte de los países europeos las
medidas/estrategias adecuadas para reducir las concentraciones de material particulado (PM), y sus
componentes químicos, en el aire del metro.
PARTICIPANTES
CALENDARIO

El metro transporta > 100 millones de pasajeros al día en el mundo
Las concentraciones de PM10 en los andenes pueden ser más elevadas que los 50 µg/m3 permitidos en el exterior (no hay legislación)
La composición química de este PM es muy diferente del PM en el ambiente exterior.
¿POR QUÉ ESTUDIAR EL AIRE EN EL METRO?

Barcelona 18-186 µg/m3 (12-99 µg/m3 L9)
Barcelona 17-99 µg/m3 (11-18 µg/m3 L9)
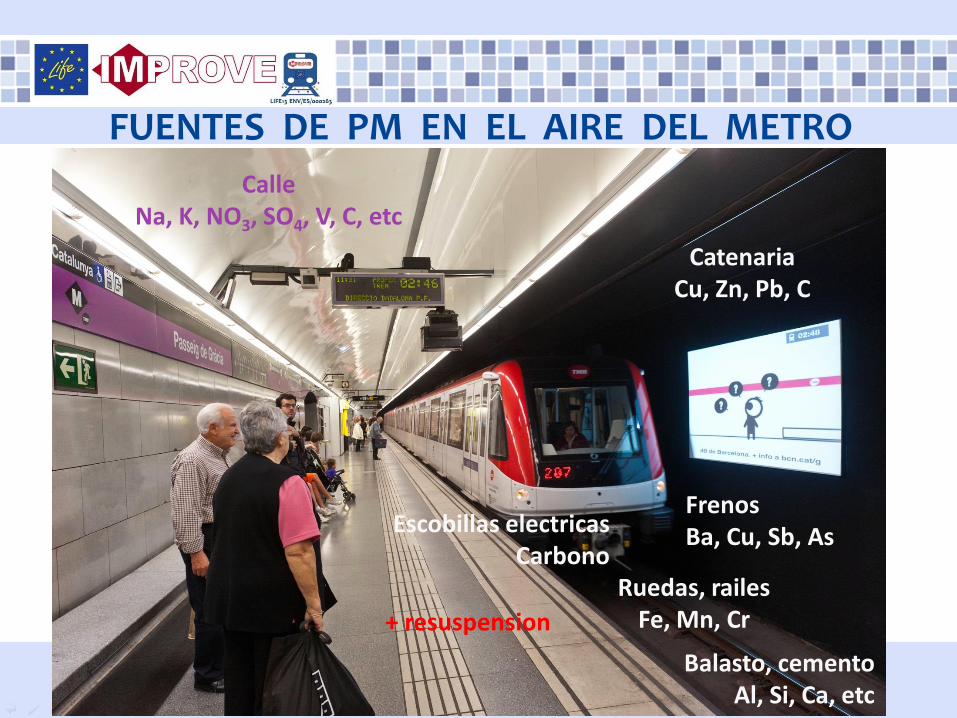
Ruedas, railes Fe, Mn, Cr
Frenos Ba, Cu, Sb, As
Catenaria Cu, Zn, Pb, C
+ resuspension
Calle Na, K, NO3, SO4, V, C, etc
Escobillas electricas Carbono
Balasto, cemento Al, Si, Ca, etc
FUENTES DE PM EN EL AIRE DEL METRO

Diseño de la estación: vía única / doble, puntos de acceso, la profundidad, los sistemas de ventilación, sistemas andén cerrado
Diseño de tren: frenos, ruedas, aire acondicionado, catenaria … Frecuencia de los trenes y el efecto pistón El número de pasajeros La contaminación por el aire exterior de la ciudad
VARIABLES
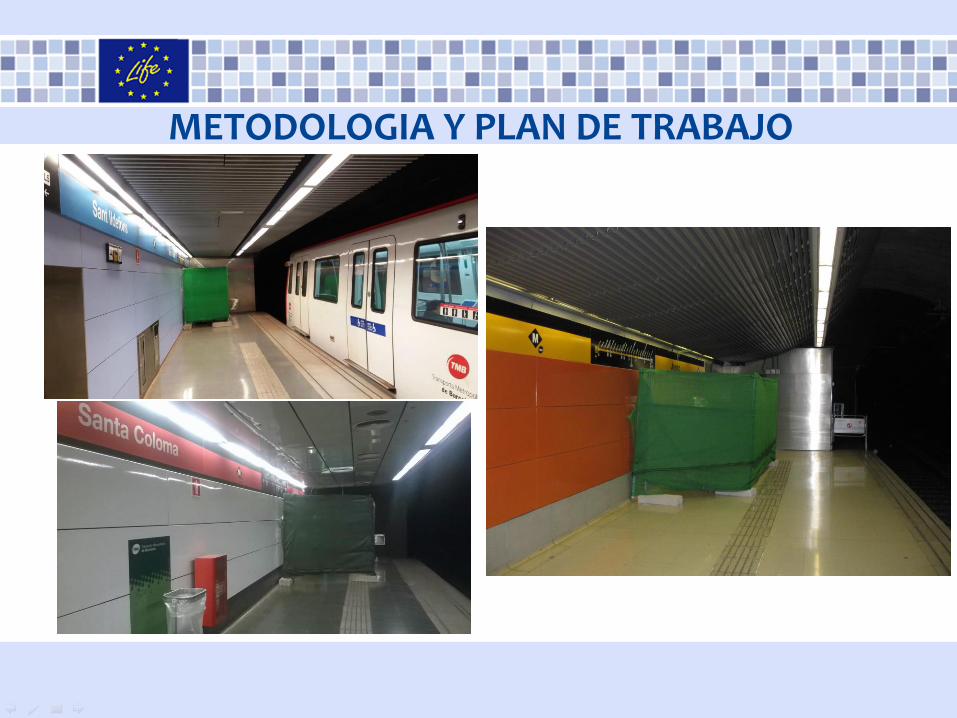
METODOLOGIA Y PLAN DE TRABAJO

METODOLOGIA Y PLAN DE TRABAJO

METODOLOGIA Y PLAN DE TRABAJO
November 2011 11
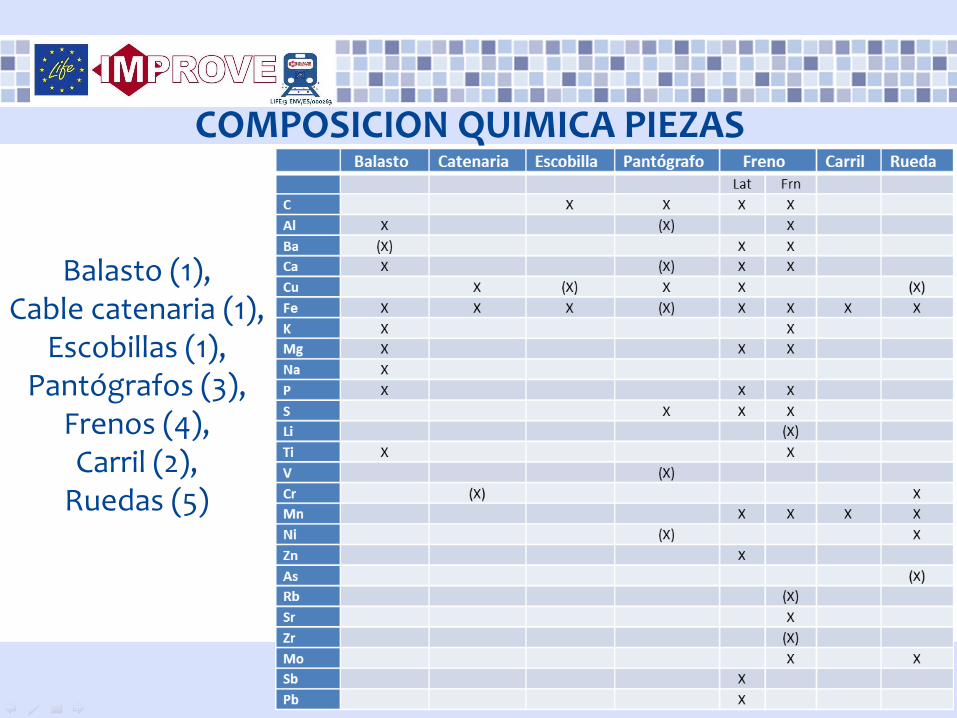
Balasto (1), Cable catenaria (1),
Escobillas (1), Pantógrafos (3),
Frenos (4), Carril (2),
Ruedas (5)
COMPOSICION QUIMICA PIEZAS

Es necesario determinar las fuentes de PM y su contribución a la calidad del aire en andenes y trenes para poder reducir su impacto.
Pruebas de estrategias de mitigación: Actividades en el túnel, Cambios en régimen de ventilación, Efecto y practicabilidad de aplicar un producto
antiresuspensión al balasto antes de su colocación,
Estrategias de mitigación para emisiones de componentes específicos (frenos, railes, catenarias).

November 2011 13
November 2011 14
SAGRERA L5
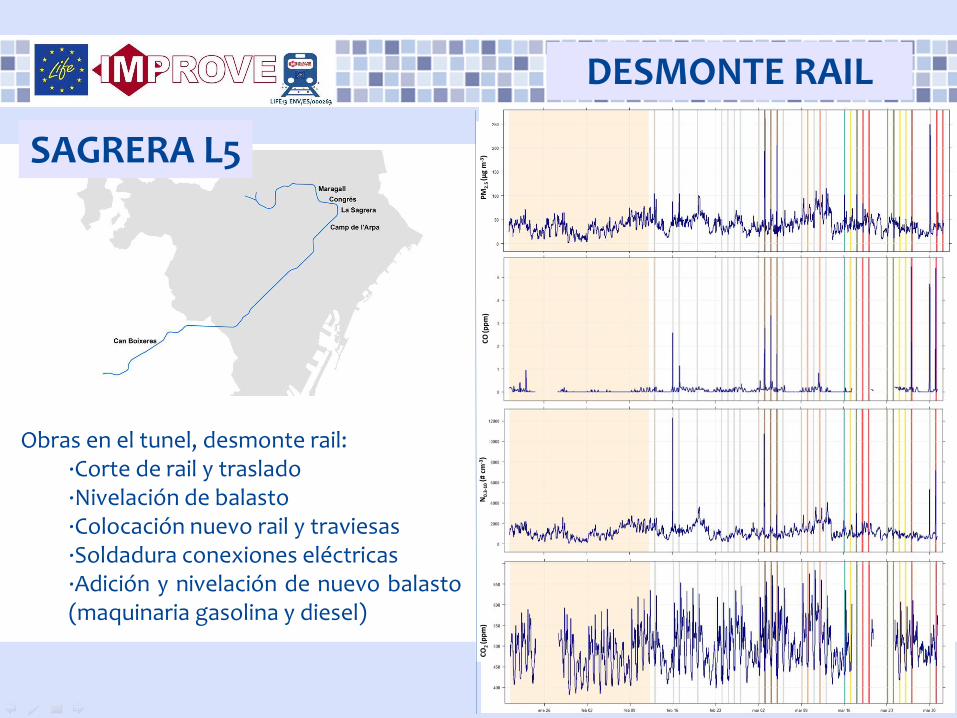
November 2011 15
Obras en el tunel, desmonte rail: ·Corte de rail y traslado ·Nivelación de balasto ·Colocación nuevo rail y traviesas ·Soldadura conexiones eléctricas ·Adición y nivelación de nuevo balasto (maquinaria gasolina y diesel)
PM
2.5
(µg
m-3
)C
O(p
pm
)N
0.3-
10(#
cm
-3)
CO
2 (p
pm
)
DESMONTE RAIL
SAGRERA L5
November 2011
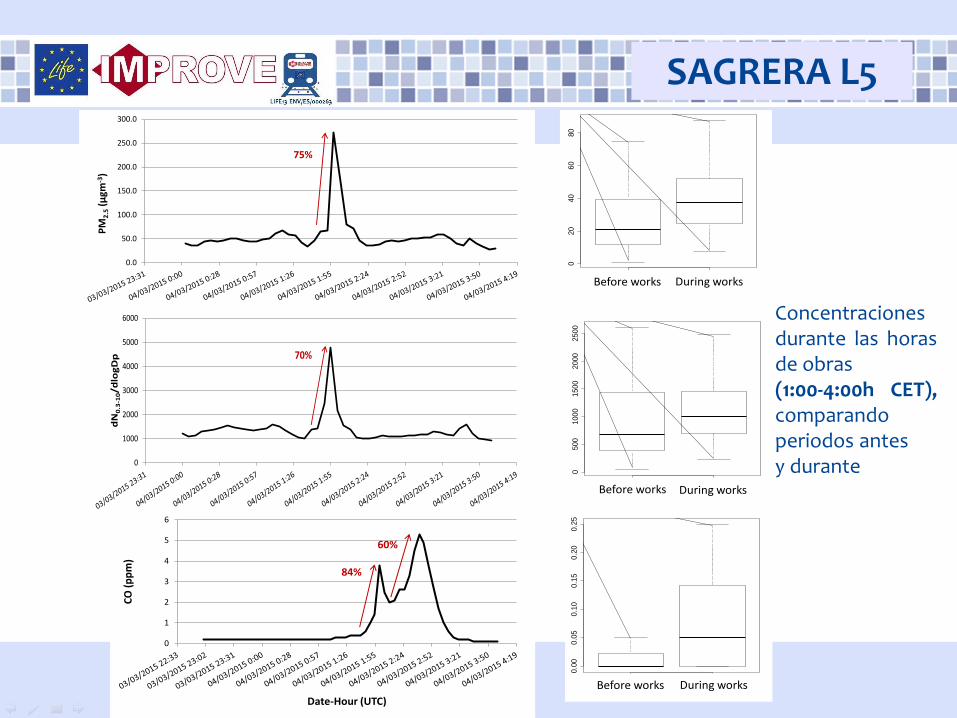
Concentraciones durante las horas de obras (1:00-4:00h CET), comparando periodos antes y durante
0.0
50.0
100.0
150.0
200.0
250.0
300.0
PM
2.5
(µgm
-3)
Date-Hour (UTC)
75%
0
1000
2000
3000
4000
5000
6000
dN
0.3
-10/d
log
Dp
Date-Hour (UTC)
70%
0
1
2
3
4
5
6
CO
(p
pm
)
Date-Hour (UTC)
84%
60%
SAGRERA L5
1 2
0500
1000
1500
2000
2500
N0.3-10 (# cm-3)
Before works During works1 2
020
40
60
80
Before works During works
PM2.5 (µg m-3)
1 2
0.0
00.0
50.1
00.1
50.2
00.2
5
Before works During works
CO (ppm)
1 2
0500
1000
1500
2000
2500
N0.3-10 (# cm-3)
Before works During works1 2
020
40
60
80
Before works During works
PM2.5 (µg m-3)
1 2
0.0
00.0
50.1
00.1
50.2
00.2
5
Before works During works
CO (ppm)
1 2
0500
1000
1500
2000
2500
N0.3-10 (# cm-3)
Before works During works1 2
020
40
60
80
Before works During works
PM2.5 (µg m-3)
1 2
0.0
00.0
50.1
00.1
50.2
00.2
5
Before works During works
CO (ppm)

November 2011 17
SAGRERA L5
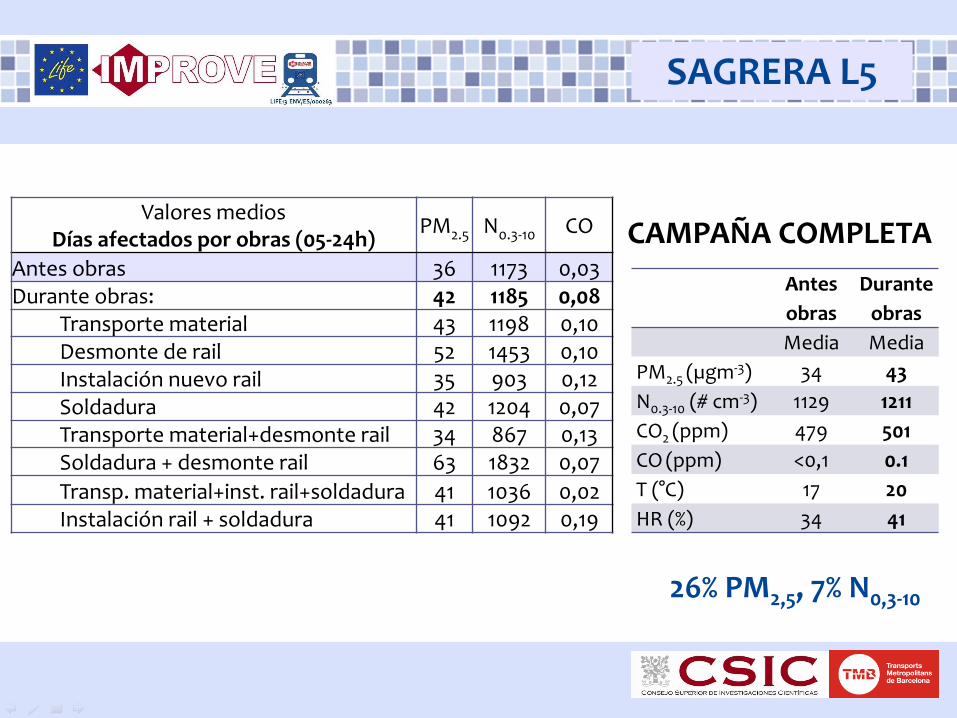
Valores medios Días afectados por obras (05-24h)
PM2.5 N0.3-10 CO
Antes obras 36 1173 0,03 Durante obras: 42 1185 0,08
Transporte material 43 1198 0,10 Desmonte de rail 52 1453 0,10 Instalación nuevo rail 35 903 0,12 Soldadura 42 1204 0,07 Transporte material+desmonte rail 34 867 0,13 Soldadura + desmonte rail 63 1832 0,07
Transp. material+inst. rail+soldadura 41 1036 0,02 Instalación rail + soldadura 41 1092 0,19
November 2011 18
Antes
obras
Durante
obras
Media Media
PM2.5 (µgm-3) 34 43
N0.3-10 (# cm-3) 1129 1211
CO2 (ppm) 479 501
CO (ppm) <0,1 0.1
T (°C) 17 20
HR (%) 34 41
SAGRERA L5
Valores medios Días afectados por obras (05-24h)
PM2.5 N0.3-10 CO
Antes obras 36 1173 0,03 Durante obras: 42 1185 0,08
Transporte material 43 1198 0,10 Desmonte de rail 52 1453 0,10 Instalación nuevo rail 35 903 0,12 Soldadura 42 1204 0,07 Transporte material+desmonte rail 34 867 0,13 Soldadura + desmonte rail 63 1832 0,07
Transp. material+inst. rail+soldadura 41 1036 0,02 Instalación rail + soldadura 41 1092 0,19
CAMPAÑA COMPLETA
26% PM2,5, 7% N0,3-10

November 2011 19
PM2.5 Al2O3 Fe2O3 TiO2 K2O P2O5 CuO MnO ZnO Cr2O3 TC SO42- NO3
- Cl- NH4+
Sin obras 85 1.17 44.4 0.06 0.3 0.07 0.17 0.32 0.34 0.05 15.8 2.4 0.7 0.3 0.4
Obras 107 2.18 58.1 0.09 0.5 0.09 0.23 0.42 0.41 0.06 19.8 2.9 0.7 0.1 0.6
% inc. 26 86 31 50 82 29 35 31 21 20 25 22 -1 -56 32
Li V Co Ni As Se Rb Sr Zr Cd Sn Sb La Ce Pb Bi U
Sin obras 0.7 6.5 1.9 19 2.1 0.3 0.8 36 17 0.1 10 2.0 0.4 0.8 7.5 0.2 <0.1
Obras 1.1 8.7 2.1 25 2.5 0.3 1.6 44 16 0.1 10 1.9 0.5 1.1 9.2 0.3 0.1
% inc. 57 34 11 32 19 - 100 22 -6 - - -5 25 38 23 50 -
SAGRERA L5

November 2011 20
Localización PM2.5 Al2O3 Fe2O3 TiO2 K2O P2O5 CuO MnO ZnO Cr2O3 TC
Transporte material 16 51 5 33 28 67 27 9 8 0 23
Sag-Cong
Desmonte rail 24 67 25 33 16 67 36 27 8 100 26
Instalación nuevo rail 3 26 9 0 -16 17 45 27 25 100 -19
Soldadura 24 56 20 33 20 33 45 27 17 100 -4
Cam-Sag
Desmonte rail 39 53 27 0 32 67 36 27 17 100 34
Instalación nuevo rail 26 79 37 33 20 33 55 55 0 100 -3
Soldadura 26 86 11 67 4 67 18 18 0 100 15
Li V Co Ni As Se Rb Sr Zr Cd Sn Sb La Ce Pb
Transporte material 100 42 17 11 -9 0 25 19 0 0 4 2 25 10 3
Sag-Cong
Desmonte rail 100 21 50 27 0 0 50 37 4 100 17 46 25 10 35
Instalación nuevo rail 100 -42 17 40 0 100 0 22 2 0 12 -7 0 0 -12
Soldadura 150 -4 33 42 9 200 50 37 3 0 6 2 25 0 0
Cam-Sag
Desmonte rail 150 88 50 45 9 100 50 59 1 100 37 26 25 20 21
Instalación nuevo rail 200 -8 67 91 9 100 50 52 2 0 30 2 25 20 -3
Soldadura 350 75 100 56 0 100 25 56 5 0 -25 7 25 10 -39
SAGRERA L5
PORCENTAJE INCREMENTO

November 2011 21
Localización PM2.5 Al2O3 Fe2O3 TiO2 K2O P2O5 CuO MnO ZnO Cr2O3 TC
Transporte material 16 51 5 33 28 67 27 9 8 0 23
Sag-Cong
Desmonte rail 24 67 25 33 16 67 36 27 8 100 26
Instalación nuevo rail 3 26 9 0 -16 17 45 27 25 100 -19
Soldadura 24 56 20 33 20 33 45 27 17 100 -4
Cam-Sag
Desmonte rail 39 53 27 0 32 67 36 27 17 100 34
Instalación nuevo rail 26 79 37 33 20 33 55 55 0 100 -3
Soldadura 26 86 11 67 4 67 18 18 0 100 15
Li V Co Ni As Se Rb Sr Zr Cd Sn Sb La Ce Pb
Transporte material 100 42 17 11 -9 0 25 19 0 0 4 2 25 10 3
Sag-Cong
Desmonte rail 100 21 50 27 0 0 50 37 4 100 17 46 25 10 35
Instalación nuevo rail 100 -42 17 40 0 100 0 22 2 0 12 -7 0 0 -12
Soldadura 150 -4 33 42 9 200 50 37 3 0 6 2 25 0 0
Cam-Sag
Desmonte rail 150 88 50 45 9 100 50 59 1 100 37 26 25 20 21
Instalación nuevo rail 200 -8 67 91 9 100 50 52 2 0 30 2 25 20 -3
Soldadura 350 75 100 56 0 100 25 56 5 0 -25 7 25 10 -39
SAGRERA L5
PORCENTAJE INCREMENTO
Incremento > 50% Transporte: Al, P, Li, Mo Desmonte rail: Al, P, Cr, Li, V, Co, Se, Rb, Sr, Mo, Cd Nuevo rail: Al, Cu, Mn, Cr, Li, Se, Mo, Co, Ni, Rb, Sr Soldadura: Al, Ti, P, Cr, Li, Se, Rb, Mo, V, Co, Ni, Sr, Mo
November 2011 22
PALAU REIAL y MARIA CRISTINA L3

November 2011
PM
2.5
(µg
m-3
)CO
(pp
m)
N0.
3-10
(# c
m-3
)CO
2 (p
pm
)
PM
2.5
(µg
m-3
)C
O(p
pm
)N
0.3
-10
(# c
m-3
)C
O2
(pp
m)
MARIA CRISTINA PALAU REIAL
APORTACION BALASTO
No activity
Addition of
ballast/Track
tamping
No activity
Addition of
ballast/Track
tamping
PM2.5 (µgm-3)
N0.3-10 (#cm-3
)
CO (ppm)
CO2 (ppm)
a) PALAU REIAL b) MARIA CRISTINA
579
7680.3
111.3
0
50
100
150
0 1factor(type)
CO
2(p
pm
)
764
761684.5
2245.8
0
1000
2000
3000
0 1factor(type)
CO
2(p
pm
)
708
730.08
0.16
0.0
0.1
0.2
0.3
0.4
0.5
0 1factor(type)
CO
2(p
pm
)
727 76449.96 460.48
400
450
500
550
600
0 1factor(type)
CO
2(p
pm
)
529 6260.95 61.9
0
50
100
150
0 1factor(type)
CO
2(p
pm
)
560 62
1290.98 1322.39
0
1000
2000
3000
0 1factor(type)
CO
2(p
pm
)
PALAU REIAL y MARIA CRISTINA CON AGUA CON POLIMERO
05-24h
39%
100%
33%
38%

No activity
Addition of
ballast/Track
tamping
No activity
Addition of
ballast/Track
tamping
PM2.5 (µgm-3)
N0.3-10 (#cm-3
)
CO (ppm)
CO2 (ppm)
a) PALAU REIAL b) MARIA CRISTINA
579
7680.3
111.3
0
50
100
150
0 1factor(type)
CO
2(p
pm
)
764
761684.5
2245.8
0
1000
2000
3000
0 1factor(type)
CO
2(p
pm
)
708
730.08
0.16
0.0
0.1
0.2
0.3
0.4
0.5
0 1factor(type)
CO
2(p
pm
)
727 76449.96 460.48
400
450
500
550
600
0 1factor(type)
CO
2(p
pm
)
529 6260.95 61.9
0
50
100
150
0 1factor(type)
CO
2(p
pm
)
560 62
1290.98 1322.39
0
1000
2000
3000
0 1factor(type)
CO
2(p
pm
)
PALAU REIAL y MARIA CRISTINA CON AGUA CON POLIMERO
05-24h
39%
100%
33%
38%

November 2011 26
TARRAGONA L3

November 2011
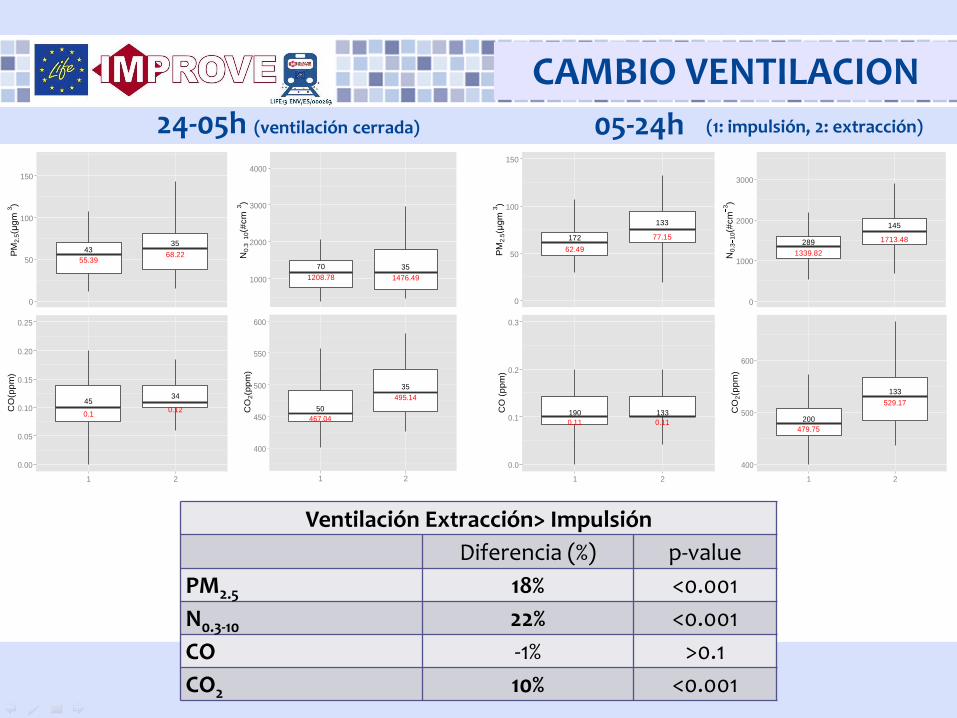
CAMBIO VENTILACION
Setmana 1 Del 10-17.06.2015
Setmana 2 Del 17-24.06.2015
Setmana 3 Del 24.06-01.07.2015
DIA NIT DIA NIT DIA NIT
IMP RÀPIDA ATURADA EXT RÀPIDA ATURADA IMP RÀPIDA ATURADA
November 2011
Ventilación Extracción> Impulsión
Diferencia (%) p-value
PM2.5 18% <0.001
N0.3-10 22% <0.001
CO -1% >0.1
CO2 10% <0.001
172
133
62.49
77.15
0
50
100
150
1 2factor(type)
PM
2.5(µgm
3)
289
145
1339.82
1713.48
0
1000
2000
3000
1 2factor(type)
N0
.31
0(#
cm
3)
190 133
0.11 0.11
0.0
0.1
0.2
0.3
1 2factor(type)
CO
(p
pm
)
200
133
479.75
529.17
400
500
600
1 2factor(type)
CO
2(p
pm
)
4335
55.3968.22
0
50
100
150
1 2factor(type)
PM
2.5(µgm
3)
4534
0.10.12
0.00
0.05
0.10
0.15
0.20
0.25
1 2factor(type)
CO
(pp
m)
50
35
467.04
495.14
400
450
500
550
600
1 2factor(type)
CO
2(p
pm
)
70 35
1208.78 1476.491000
2000
3000
4000
1 2factor(type)
N0
.31
0(#
cm
3)
05-24h 24-05h (ventilación cerrada)
CAMBIO VENTILACION (1: impulsión, 2: extracción)

November 2011 29
• De acuerdo a esta campaña las concentraciones de PM aumentaron en el aire de la estación cuando se variaron las condiciones de ventilación en cerca de un 20%.
• Este incremento se observó inmediatamente despues del cambio de ventilación.
• Los niveles no continuaron ascendiendo durante la semana.
• Los cambios de ventilacion no afectaron claramente la calidad del aire en la estación durante la noche .
• Con estos resultados la ventilación por impulsión de aire exterior se recomienda sobre la extracción de aire del interior del metro.
• Se está llevando a cabo una segunda prueba en la misma estación en condiciones de invierno para corroborar los resultados obtenidos.
CAMBIO VENTILACION
November 2011 30
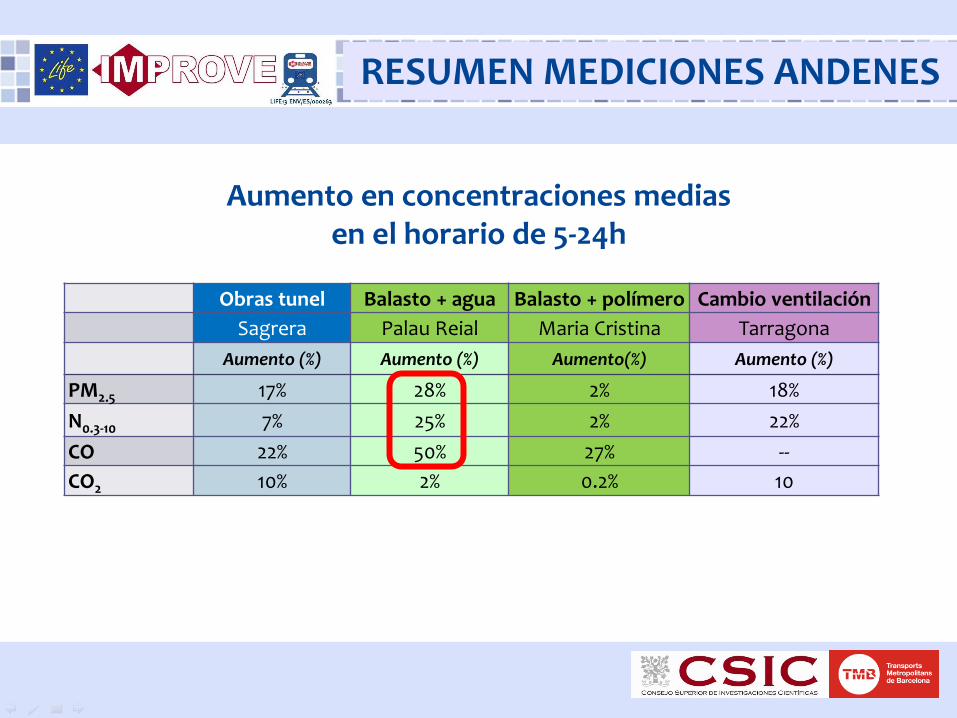
Obras tunel Balasto + agua Balasto + polímero Cambio ventilación
Sagrera Palau Reial Maria Cristina Tarragona
Aumento (%) Aumento (%) Aumento(%) Aumento (%)
PM2.5 17% 28% 2% 18%
N0.3-10 7% 25% 2% 22%
CO 22% 50% 27% --
CO2 10% 2% 0.2% 10
Aumento en concentraciones medias en el horario de 5-24h
RESUMEN MEDICIONES ANDENES
November 2011
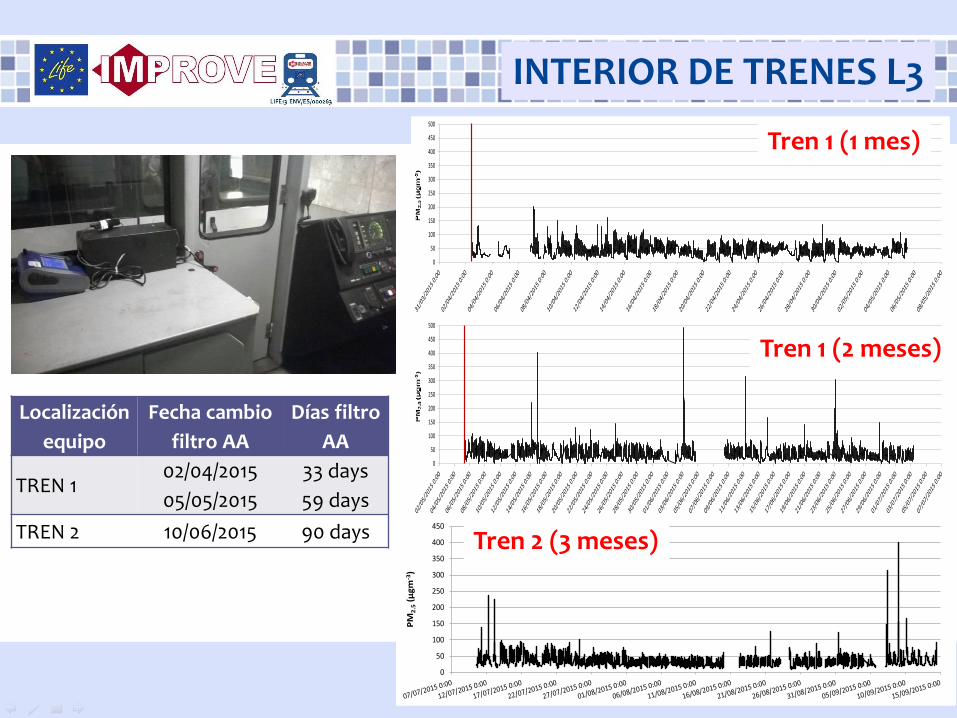
Localización
equipo
Fecha cambio
filtro AA
Días filtro
AA
TREN 1 02/04/2015
05/05/2015
33 days
59 days
TREN 2 10/06/2015 90 days
INTERIOR DE TRENES L3
0
50
100
150
200
250
300
350
400
450
500
0
50
100
150
200
250
300
350
400
450
500
0
50
100
150
200
250
300
350
400
450
PM
2.5
(µg
m-3
)
Tren 1 (1 mes)
Tren 1 (2 meses)
Tren 2 (3 meses)

November 2011 32
0
50
100
150
0 1 2 3 4 5 6 7 8 9 10 11 12 13 14 15 16 17 18 19 20 21 22 23 24 25 26 27 28 29 30 31 32 33Number of days since the filters replacement
PM
2.5(µgm
3)
0
50
100
150
0 1 2 3 4 5 6 7 8 9 101112 131415 161718 192021 222324 2526 272829 303435 363738 394041 424344 454647 4849 505152 535455 565758 59Number of days since the filters replacement
PM
2.5(µgm
3)
0
25
50
75
100
125
30313233343536373839404142434445464748495051525354555657585960616263646568697071727374757677787980818283848586878990919293949596
Number of days since the filters replacements
PM
2.5(µgm
-3)
INTERIOR DE TRENES L3
0
10
20
30
40
50
60
70
0 3 6 9 12151821 0 3 6 9 12151821 0 3 6 9 12151821 0 3 6 9 12151821 0 3 6 9 12151821 0 3 6 9 12151821 0 3 6 9 12151821
Monday Tuesday Wednesday Thursday Friday Saturday Sunday
PM
2.5
(µg
m-3
)
0
10
20
30
40
50
60
70
0 3 6 9 12151821 0 3 6 9 12151821 0 3 6 9 12151821 0 3 6 9 12151821 0 3 6 9 12151821 0 3 6 9 12151821 0 3 6 9 12151821
Monday Tuesday Wednesday Thursday Friday Saturday Sunday
PM
2.5
(µg
m-3
)
Tren 1
Tren 2
CICLO HORARIO

November 2011 33
INTERIOR DE TRENES L3
• Las concentraciones de PM2.5 dentro de los trenes de la L3 fueron un 30-50% más bajas que las medidas simultáneamente en andenes de estaciones de la misma línea.
• Los niveles de PM2.5 medidos dentro del tren fueron c. 20% más elevados durante los dias laborales, mostrando que la frecuencia de trenes influye en las concentraciones de PM del metro.
• Los picos en concentraciones registrados están relaccionados con actividades nocturnas cuando el tren está en la cochera (e.g. tipos de limpieza incluyendo graffiti, limpieza con aire comprimido, etc.)
• No se observa una diferencia apreciable en los niveles de PM2.5 después de que el filtro de AA ha estado funcionando hasta 3 meses indicando que, al menos en términos de calidad del aire , no sería necesario cambiar estos filtros mensulamente como se hace ahora.

November 2011 34
TAREAS/ACCIONES A REALIZAR
Seguimiento del impacto de las acciones del proyecto (obligatorias) • C1 Effectiveness of the project actions compared to initial situation. • C2 Assessment of the socio-economic impact of the project due to improved air quality.
Acciones de comunicación y diseminación (obligatorias) • D1 A Project website. • D2 LIFE+ Information boards. • D3 Dissemination of project results (project website, media/press releases, workshops/conferences, technical guides, brochures/articles scientific journals, Open forum). • D4 Production of Layman's Report, targeted at general public & political decision-makers.

36 http://improve-life.eu/

November 2011 37
November 2011 38
• Factors controlling air quality in different European subway systems. Environmental Research 2016: 46, 35–46
• Origin of inorganic and organic components of PM2.5 in subway stations of Barcelona, Spain. Environmental Pollution 2016: 208, 125-136
• Urban Air Quality comparison for bus, tram, subway and pedestrian commutes in Barcelona. Environmental Research 2015: 142, 495–510
• Deposition of aerosol particles from a subway microenvironment in the human respiratory tract. Journal of Aerosol Science 2015: 90, 103-113.
• Exposure to airborne PM in the subway system. Science of Total Environment 2015: 511, 711–722 • A new look at inhalable metalliferous airborne particles on rail subway platforms. Science of the
Total Environment 2015: 505, 367–375 • Subway platform air quality: assessing the influences of tunnel ventilation, train “piston effect”
and station design. Atmospheric Environment 2014: 92, 461-468
• COST Action TD1105 EuNetAir, Third Scientific Meeting. Istanbul, TURQUIA. Diciembre 2014. • 2015 SETAC Europe, 25th Annual Meeting (Barcelona, ESPAÑA, Mayo 2015). • 1st International Conference on Transport and Health (Londres, REINO UNIDO Julio 2015). • 2015 European Aerosol Conference (Milan, ITALIA, Septiembre 2015).
PUBLICACIONES CIENTIFICAS Y CONFERENCIAS

November 2011 39
CUESTIONARIOS

November 2011 40

November 2011 41
November 2011 42

November 2011
1. PM concentrations
3. Black carbon
5. PM2,5
sampler chemistry
4. CO, CO2, Temp, RH.
6. GPS
2. Nanoparticles number

November 2011
1 km
A
B
CSIC
La Rambla
Sants
L’Eixample INNER CITY GRIDPLAN
Francesc Macia
Palau Reial
Bus
Tram + walking Metro
METRO TRAM BUS (DIESEL)
N0.3-10 2,1 x 10⁴ 2,8 x 10⁴ 4,6 x 10⁴
Tamaño (nm) 91 67 63
CO 0,9 0,5 1,0
CO2 631 660 674
BC -- 3,0 5,1
