implementing the african continental free trade area
TRANSCRIPT

Research in Applied Economics
ISSN 1948-5433
2021, Vol. 13, No. 1
http://rae.macrothink.org 15
Implementing the African Continental Free Trade Area
(AfCFTA): The Effects of Trade Procedures on Trade
Flows
Manfred Kouty1,*
1International Relations Institute of Cameroon (IRIC), University of Yaounde 2, Cameroon
*Corresponding author: International Relations Institute of Cameroon (IRIC), University of
Yaounde, Cameroon. Tel: 237-677-302-892. E-mail: [email protected]
Received: April 9, 2020 Accepted: April 21, 2020 Published: March 20, 2021
doi: 10.5296/rae.v13i1.18468 URL: https://doi.org/10.5296/rae.v13i1.18468
Abstract
In January 2018, the 10th African Union (AU) Summit of African Heads of States and
Governments was held in Kigali. At this occasion, 44 countries had signed the African
Continental Free Trade Area (AfCFTA) agreement. In this study, it is pointed out that the
implementation of AfCFTA cannot be done without harmonized trade procedures. Using a
gravity model of 49 African countries over the 2010-2015 periods, the study estimates the
impact of inefficient trade procedures on intra-African trade. The results show that trade
procedures such as the number of documents required to import goods and Border
compliance negatively affect intra-African trade. This suggests the need of harmonization and
rationalization of trade procedures to boost intra-African trade.
JEL Classification: C33; F13; F15; H32; O55.
Keywords: trade procedures, regional integration, AfCFTA, gravity model
Research in Applied Economics
ISSN 1948-5433
2021, Vol. 13, No. 1
http://rae.macrothink.org 16
1. Introduction
Long time before the establishment of the African Union (AU) in 2000, regional integration
was a key policy agenda item across the African continent. The adoption of the Lagos Plan of
Action in 1980 was a major framework for the achievement of this goal. But the Abuja
Treaty (1991) which establishes the African Economic Community (AEC) appears to be the
main legal framework of continental integration. According to the Abuja treaty, African
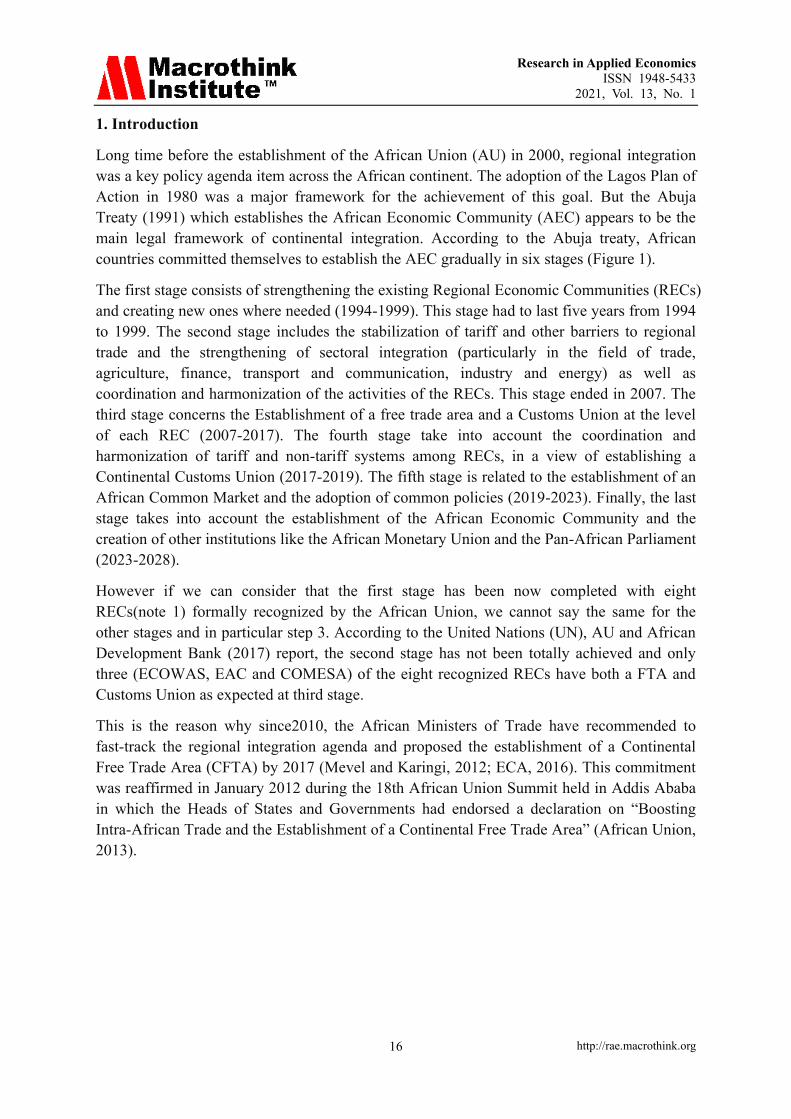
countries committed themselves to establish the AEC gradually in six stages (Figure 1).
The first stage consists of strengthening the existing Regional Economic Communities (RECs)
and creating new ones where needed (1994-1999). This stage had to last five years from 1994
to 1999. The second stage includes the stabilization of tariff and other barriers to regional
trade and the strengthening of sectoral integration (particularly in the field of trade,
agriculture, finance, transport and communication, industry and energy) as well as
coordination and harmonization of the activities of the RECs. This stage ended in 2007. The
third stage concerns the Establishment of a free trade area and a Customs Union at the level
of each REC (2007-2017). The fourth stage take into account the coordination and
harmonization of tariff and non-tariff systems among RECs, in a view of establishing a
Continental Customs Union (2017-2019). The fifth stage is related to the establishment of an
African Common Market and the adoption of common policies (2019-2023). Finally, the last
stage takes into account the establishment of the African Economic Community and the
creation of other institutions like the African Monetary Union and the Pan-African Parliament
(2023-2028).
However if we can consider that the first stage has been now completed with eight
RECs(note 1) formally recognized by the African Union, we cannot say the same for the
other stages and in particular step 3. According to the United Nations (UN), AU and African
Development Bank (2017) report, the second stage has not been totally achieved and only
three (ECOWAS, EAC and COMESA) of the eight recognized RECs have both a FTA and
Customs Union as expected at third stage.
This is the reason why since2010, the African Ministers of Trade have recommended to
fast-track the regional integration agenda and proposed the establishment of a Continental
Free Trade Area (CFTA) by 2017 (Mevel and Karingi, 2012; ECA, 2016). This commitment
was reaffirmed in January 2012 during the 18th African Union Summit held in Addis Ababa
in which the Heads of States and Governments had endorsed a declaration on “Boosting
Intra-African Trade and the Establishment of a Continental Free Trade Area” (African Union,
2013).

Research in Applied Economics
ISSN 1948-5433
2021, Vol. 13, No. 1
http://rae.macrothink.org 17
Figure 1. Roadmap towards an African Economic Community
Source: ECA(2016).
Even if the African Continental Free Trade Area (AfCFTA) does not feature explicitly in the
Abuja Treaty, in accordance with the sequential stages of regional economic integration, it is
an important way to catch up with stage 4 which relates to the creation of Continental
Customs Union. Also considered as a keystone initiative of AU's Agenda 2063, the
agreement establishing the AfCFTA was signed by 44 countries at a summit of the African
Unionheld in Kigali (Rwanda) in March 21, 2018. The agreement officially entered into force
in 2019 and its implementation is effective since the first January 2021(note 2).
As mentioned in article 3 of the AfCFTA agreement, the key objective of the AfCFTA is to
boost intra-African trade. However this objective cannot be achieved if some challenges are
not addressed among which the setting up of a single continental legal trade regime. This
include the harmonization of trade procedures (AU, 2013; UNCTAD, 2019). Article 20 of the
annex 4 on trade facilitation of AfCFTA agreement clearly states that "each State Party shall,
subject to paragraph 2, apply uniform import, export, and transit procedures and uniform
documentation requirements for release of goods throughout its territory".
The recent economic literature emphasizes that, trade procedures related to international trade
transactions represent a major obstacle to trade in Africa where customs and administrative
processes are inefficient and differ from country to country (WTO, 2015; UNCTAD, 2019).
Harmonization of the mentioned trade procedures is therefore one of the big challenges of the
AfCFTA. The objective of this study is to evaluate and analyze the effects of inefficient trade
procedures on trade volumes between African countries. The study uses gravity model of 49
African countries over the 2010-2015 periods. The findings suggest that trade procedures
Research in Applied Economics
ISSN 1948-5433
2021, Vol. 13, No. 1
http://rae.macrothink.org 18
such asthe number of documents required to import goods and Border compliance negatively
affect intra-African trade. The rest of the paper proceeds as follows: the next section presents
the brief review of the literature. This is followed by the empirical analysis of trade
procedures in African countries. The econometrics analysis is presented in Section 4. Section
5 outlines the results and Section 6 concludes.
2. Literature Review
Extensive literature reviews can be found in Zaki (2007), Bourdet and Persson (2012),
Donaldson et al. (2017). We define briefly the trade procedures and discuss the empirical
studies.
a. What is trade procedures and what does it involve ?
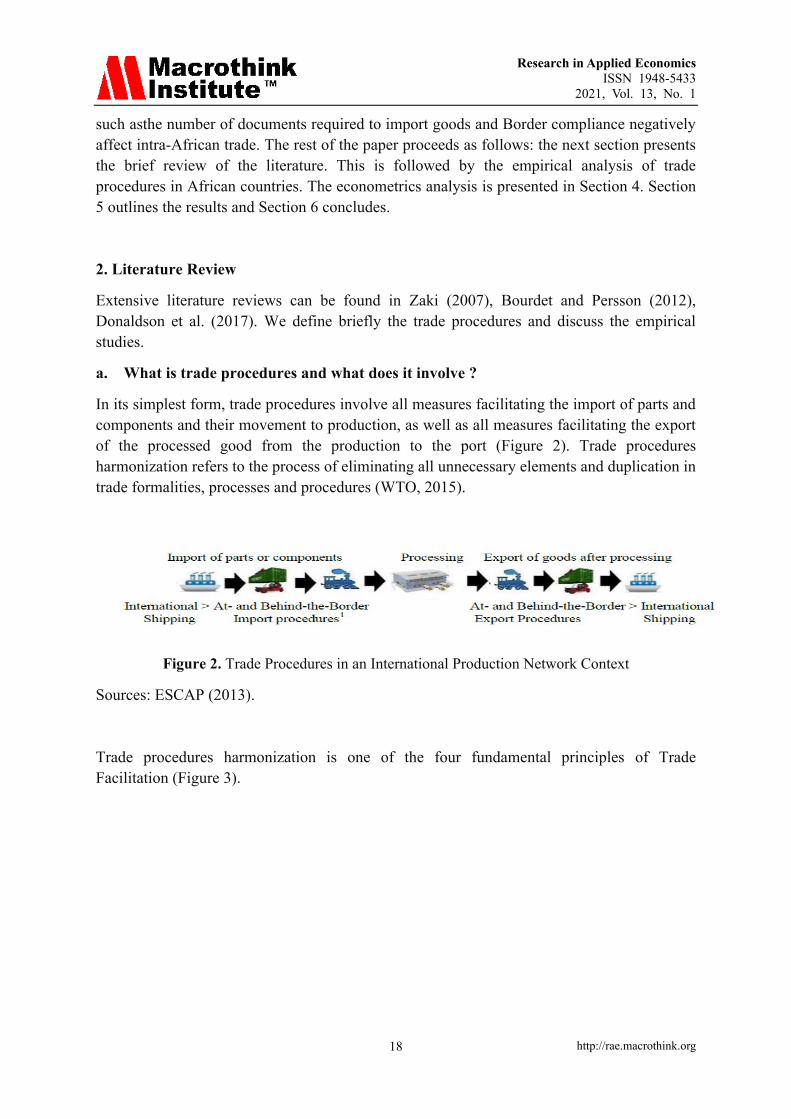
In its simplest form, trade procedures involve all measures facilitating the import of parts and
components and their movement to production, as well as all measures facilitating the export
of the processed good from the production to the port (Figure 2). Trade procedures
harmonization refers to the process of eliminating all unnecessary elements and duplication in
trade formalities, processes and procedures (WTO, 2015).
Figure 2. Trade Procedures in an International Production Network Context
Sources: ESCAP (2013).
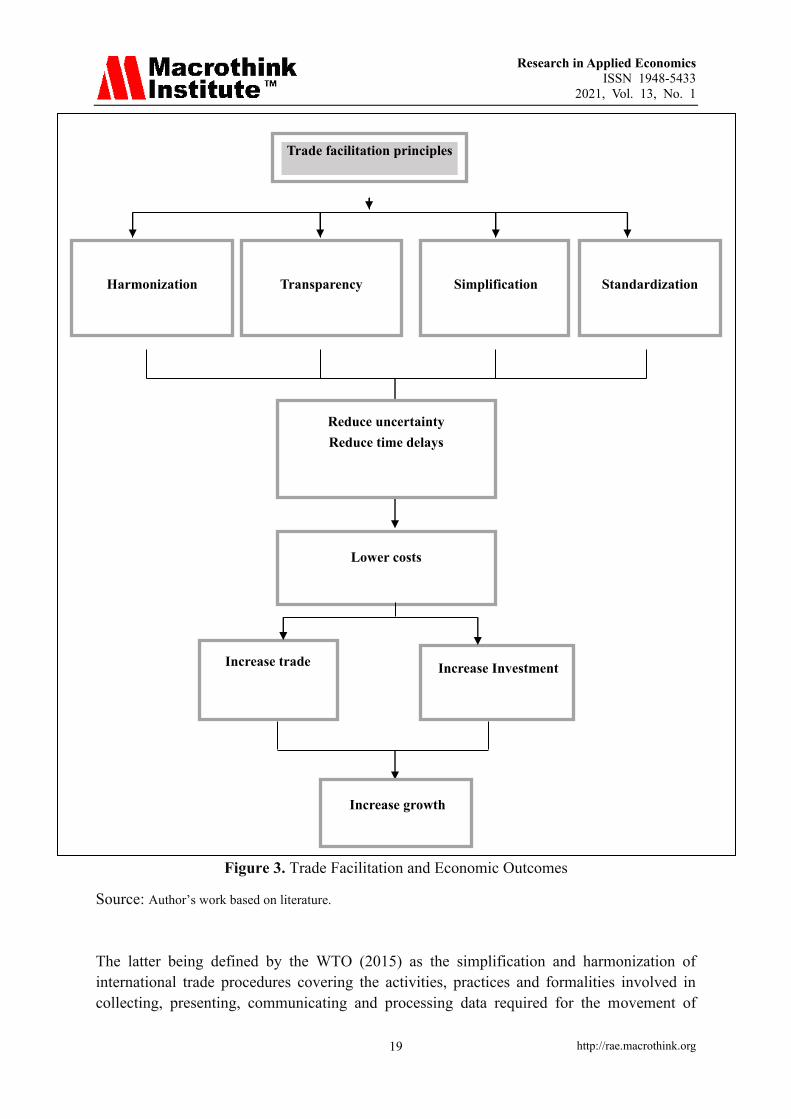
Trade procedures harmonization is one of the four fundamental principles of Trade
Facilitation (Figure 3).
Research in Applied Economics
ISSN 1948-5433
2021, Vol. 13, No. 1
http://rae.macrothink.org 19
1. Trade facilitation: What have been done in central in central Africa?
Recognizing the important role play by TF in stimulating economic growth and intra-regional
trade, the central Africa authorities have take many decisions.
Gaph number TF component in CEMAC and ECCAS, EPA, AGOA
2. Evaluation
Figure 3. Trade Facilitation and Economic Outcomes
Source: Author’s work based on literature.
The latter being defined by the WTO (2015) as the simplification and harmonization of
international trade procedures covering the activities, practices and formalities involved in
collecting, presenting, communicating and processing data required for the movement of
Trade facilitation principles
Harmonization
Transparency
Simplification
Standardization
Reduce uncertainty
Reduce time delays
Lower costs
Increase trade Increase Investment
Increase growth
Research in Applied Economics
ISSN 1948-5433
2021, Vol. 13, No. 1
http://rae.macrothink.org 20
goods in international trade. Like other measures of trade facilitation, trade procedures
harmonization reduce delays (reduce the time needed for travel, border-crossings and
administrative procedures) and uncertainty (availability of information, enhancing
predictability), thereby lowering costs for both importers and exporters. These lower trading
costs in turn increases productivity and positively affects trade flow and investment. Trade
expansion and investment contribute to economic growth and generate income for poverty
reduction Europe (AfDB, AU and ECA,2013).
b. Previous research
The empirical literature on the effects of trade procedures on trade relies to the literature of
trade facilitation. Many authors (Moïsé and Sorescu, 2013; Hummels and Schaur, 2013;
Seetanah et al., 2016), highlights the importance of trade facilitation for economic
development and regional integration. Empirically, the literature distinguishes two
approaches to analyze the effect of trade facilitation on trade: the bottom up approach and the
top down approach.
The bottom up approach was developed by Anderson and Van Wincopp (2003) who used the
gravity model to determine the fundamental trade facilitation factors that have a significant
impact on bilateral trade flows. These factors are directly observable data or proxy of trade
facilitation variables. Anderson and Van Wincopp (2003) found that trade costs represent an
equivalent tax of 170% for industrialized countries and came to the conclusion that the
border-related trade barriers, wholesale and retail distribution costs and transportation costs
are the main factors that negatively affect bilateral trade flows.
Following Anderson and Van Wincopp (2003) approach, Moïsé and Sorescu (2013) found
that formalities relating to procedures, and formalities in documents, exhibit among the
highest and most robust impacts on trade flows and trade costs in developing countries. Other
authors like Djankov et al. (2010) investigated the effect of time on trade and found that each
additional day that a product is delayed prior to being shipped reduces trade by more than one
percent. Bourdet and Persson (2012), estimate the impact of trade procedures on exports from
non-EU countries and found that harmonization could have substantial trade effects. Freund
and Rocha (2010) used detailed data on transit, documentation and customs delays on
Africa’s exports and found that a one-day reduction in inland travel times led to a 7 per cent
increase in exports. This result is consistent with the findings of Hummels and Schaur (2013)
who suggested in their study that the reduction of transit time by one day could drive trade at
a magnitude equivalent to a reduction in the advalorem tariff by 0.6 to 2.1 per cent.
The top down approach was developed by Novy (2013) and extended by Arvish et al. (2013).
This approach contrasts with the “bottom up” in the sense that it infers overall trade costs
indirectly from trade data without distinguishing between cost components (transport costs,
costs associated with completing trade procedures and the delay behind-the-border etc.). This
indicator captures all trade costs components that have been impossible to include in the
gravity framework. After building a bilateral trade costs of many countries, the trade costs
indicator is in turn used in the gravity model in order to estimate its effect on trade flows.
Using the top down approach, Arvishet al. (2013) found evidence that Sub-Saharan African

Research in Applied Economics
ISSN 1948-5433
2021, Vol. 13, No. 1
http://rae.macrothink.org 21
countries and low income countries are subject to very high levels of trade costs and this
explains their slow participation in international trade. Similarly, Kouty (2018) suggest that a
country’s ability to reduce trade costs and increase trade globally depends on its connectivity
on international supply chain. The quality of supply chain connectivity of a country is based
on the trading across border indicators (number of documents, time, and cost involved) and
the Liner Shipping Connectivity Index (LSCI).
3. Trade Procedures in African Countries: What Does Data Show?
In this section we present some findings of trade procedures indicators in Africa. Generally,
trade procedures are based on the Trading Across Border (TAB) indicators of World Bank.
The TAB indicators include: the documents required to export and import measured in
number, the time required to export and import measured in days, and the cost required to
export and import measured in us dollars per container. Figure 4 shows the average time to
clear export through customs in some regions in the world. We need in average ten days to
clear direct exports through customs in Sub-Saharan Africa. This is too high compared to
other regions such as Central Europe in which the procedures take only 4 days.
Figure 4. Average Time to Clear Exports Through Customs (2017)
Source: World bank data(note 3).
This long delay in Sub-Saharan Africa may be justified by the cumbersome border-crossing
procedures. Figure 5 shows that the number of documents required to export (8) and import
(9) is higher in Africa than in any other region.
02468
1012
CentralEurope andthe Baltics
East Asia &Pacific
Europe &Central Asia
Latin America& Caribbean
Sub-SaharanAfrica
Middle East &North Africa
Average time to clearexports through customs(days)

Research in Applied Economics
ISSN 1948-5433
2021, Vol. 13, No. 1
http://rae.macrothink.org 22
Figure 5. The Number of Documents to Export and Import Goods (2017)
Source: World Bank data
The cumbersomeborder-crossing negatively affects the custom efficiency. As figure 6 and 7
show, Sub-Saharan Africa and, Latin America and Caribbean arethe two regions where the
customs procedures are the least efficient.
Figure 6. Burden of Custom Procedure (2014)
Source: World Economic Forum data.
02468
10
CentralEurope andthe Baltics
East Asia &Pacific
Europe &Central Asia
Latin America& Caribbean
Sub-SaharanAfrica
Middle East &North Africa Documents to export
(number)
Documents to import(number)
012345
Central Europeand the Baltics
East Asia &Pacific
Europe &Central Asia
Latin America& Caribbean
Sub-SaharanAfrica
Middle East &North Africa
Burden of customsprocedure (1=extremelyinefficient to 7=extremelyefficient)

Research in Applied Economics
ISSN 1948-5433
2021, Vol. 13, No. 1
http://rae.macrothink.org 23
Figure 7. Cost to Import and Export by Region, 2016 (Dollars)
Source: UNCTAD (2019).
In short, the cumbersome border-crossing procedures and delays add to the overall costs of
intra-African trade. Consequently, Africa is one of the regions in the world that trade little
with itself (Figure 8).
Since the last three decades, African countries have seen massive trade liberalization, but the
inefficient trade procedures continue to increase the cost of moving goods within the
continent. Sub-Saharan African countries have the lowest trade among themselves compared
with other regions. Intra-regional trade is estimated at about 18% compared with 55% in
America, 59% in Asia and 69% in Europe(note 4). Toboost trade among themselves, African
countries should harmonize procedures.
Figure 8. Intra-trade by Region in 2016
Source: UNCTADSTAT(note 5).
7.9
17.75
55.2159.4
68.7
0
10
20
30
40
50
60
70
80
Oceania Africa America Asia Europe
Intr
-tra
de
(% o
f to
tal e
xpo
rt)
Research in Applied Economics
ISSN 1948-5433
2021, Vol. 13, No. 1
http://rae.macrothink.org 24
4. Econometrics Analysis
With the basic analyses conducted so far, it is impossible to determine how trade procedures
influence trade. To address this issue, we use a gravity model that allows to analyze the
impact of trade procedures on intra-African trade flows. Following Anderson et Van
Wincoop (2003), our regression equation takes the form:
𝑋𝑖𝑗 =𝑌𝑖𝑌𝑗
𝑌(
𝑡𝑖𝑗
𝑃𝑖𝛱𝑗)1−𝜎
, (1)
where ijX denotes nominal exports from country j to i,
iY and jY are the exogenously
given GDP’s per capita of the two countries respectively, 𝑌 the is the world GDP, and is
the elasticity of substitution across goods ( ). The terms i , jP represent price
indices(note 6) in countries i and j respectively while the expression ijt denotes bilateral
trade costs. Given the multiplicative nature of the gravity equation, the standard procedure for
estimating a gravity equation (1) is simply to take the natural logarithms of all variables and
obtain a log-linear equation that can be estimated by ordinary least squares regression. This
yields the estimation equation:
𝑙𝑛𝑋𝑖𝑗 = 𝑎0 + 𝑎1𝑙𝑛𝑌𝑖+𝑎2𝑙𝑛𝑌𝑗 + 𝑎3𝑙𝑛𝑡𝑖𝑗 + 𝑎4𝑙𝑛𝑃𝑖 + 𝑎5𝑙𝑛𝛱𝑗 + 𝜀𝑖𝑗 (2)
where 𝑎0, is a constant, 𝑎3 = 1 − 𝜎 and 𝜀𝑖𝑗, is the error term.
In practice, the bilateral trade costs and the multilateral resistance variables is used as proxy
by bilateral distance and dummies for islands, landlocked countries, contiguity, common
language and colonial links. Finally, the estimated equation is:
ijttiijtititit
ijtijtijtijt
ijjtitijtijt
RTAliancebordercompdocumentstimeimport
encycommoncurrnizercommoncoloolanguagecommonethngeciallanguacommonoffi
contiguityGDPpGDPpcedisX
+++++++
++++
++++=
1211109
8765
43210 lnlntanlnln
(3)
The parameter 0 represents the intercept while the parameters
i ’s ( i ) are the coefficients.
i is the a country-specific effect (exporter or importer) and t , the time-specific effect.ijt
is the error term that is assumed to be normally distributed with mean zero. The definitions of
variables and data sources are presented in appendix (table 1). The study includes the total of
49 African countries over the 2010-2015 periods. The choice of countries (the list of
countries is in appendix) and years can be justified by the availability of the data.
Research in Applied Economics
ISSN 1948-5433
2021, Vol. 13, No. 1
http://rae.macrothink.org 25
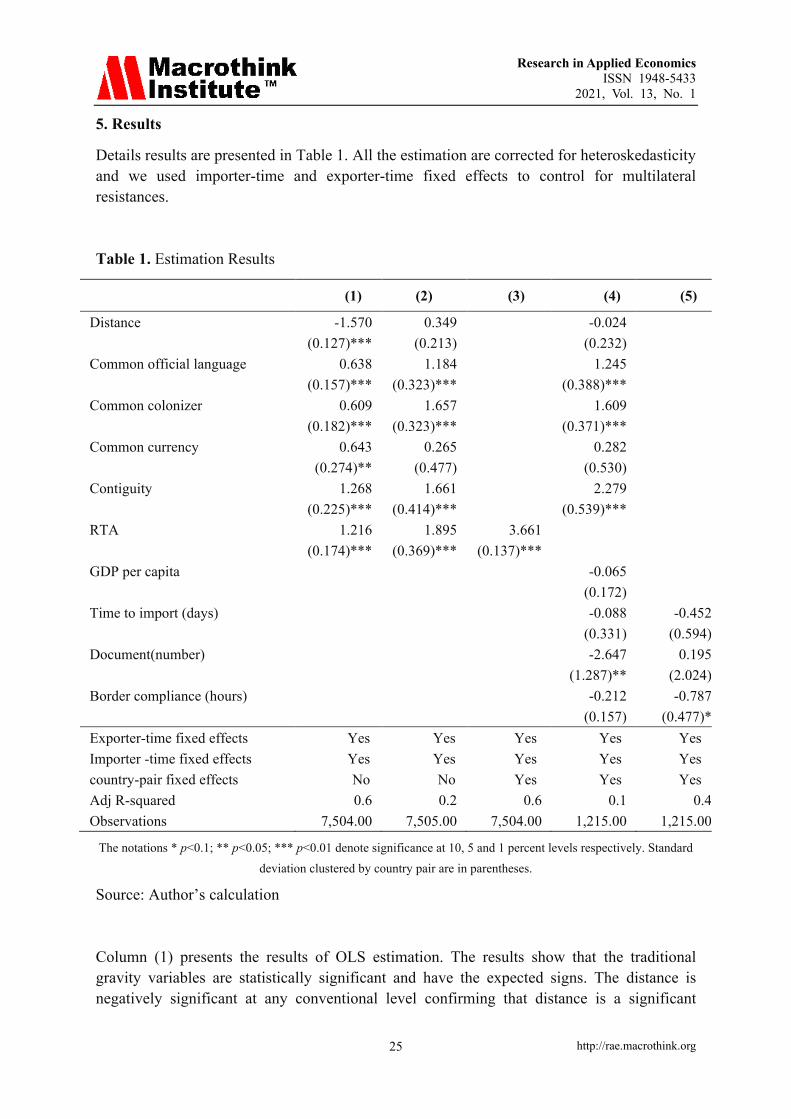
5. Results
Details results are presented in Table 1. All the estimation are corrected for heteroskedasticity
and we used importer-time and exporter-time fixed effects to control for multilateral
resistances.
Table 1. Estimation Results
(1) (2) (3) (4) (5)
Distance -1.570 0.349 -0.024
(0.127)*** (0.213) (0.232)
Common official language 0.638 1.184 1.245
(0.157)*** (0.323)*** (0.388)***
Common colonizer 0.609 1.657 1.609
(0.182)*** (0.323)*** (0.371)***
Common currency 0.643 0.265 0.282
(0.274)** (0.477) (0.530)
Contiguity 1.268 1.661 2.279
(0.225)*** (0.414)*** (0.539)***
RTA 1.216 1.895 3.661
(0.174)*** (0.369)*** (0.137)***
GDP per capita -0.065
(0.172)
Time to import (days) -0.088 -0.452
(0.331) (0.594)
Document(number) -2.647 0.195
(1.287)** (2.024)
Border compliance (hours) -0.212 -0.787
(0.157) (0.477)*
Exporter-time fixed effects Yes Yes Yes Yes Yes
Importer -time fixed effects Yes Yes Yes Yes Yes
country-pair fixed effects No No Yes Yes Yes
Adj R-squared 0.6 0.2 0.6 0.1 0.4
Observations 7,504.00 7,505.00 7,504.00 1,215.00 1,215.00
The notations * p<0.1; ** p<0.05; *** p<0.01 denote significance at 10, 5 and 1 percent levels respectively. Standard
deviation clustered by country pair are in parentheses.
Source: Author’s calculation
Column (1) presents the results of OLS estimation. The results show that the traditional
gravity variables are statistically significant and have the expected signs. The distance is
negatively significant at any conventional level confirming that distance is a significant
Research in Applied Economics
ISSN 1948-5433
2021, Vol. 13, No. 1
http://rae.macrothink.org 26
impediment to bilateral trade (Head and Mayer, 2013; 2014). In fact, a 10 per cent increase in
distance between two African countries cuts their trade, on average, by 15 per cent. The
impact of sharing a common border, speaking the same official language, and sharing
colonial ties and common currency are positive and statistically significant, in line with the
literature (Melitz, 2008; Melitz and Toubal, 2014). Similarly, the Regional Trade Agreement
(RTA) has a positive and significant effect suggesting that, everything been equal, RTA
increases trade between member countries as documented by Anderson and Yotov (2016).
The PPML estimation results are reported in column (2). The traditional gravity variables
remain statistically significant except for distance and common currency. However, previous
estimations can suffer for endogeneity problem due to the omitted variable. According Baier
and Bergstrand (2007), the estimates of the RTAs impact on trade obtained without proper
account for endogeneity are biased downward. After controlling for endogeneity by using the
country-pair fixed effects, the RTA remain statistically significant as reported in column (3).
In column (4) and (5), the estimated coefficients of our explanatory variables of main interest,
Document (the number of documents required to import goods) and Border compliance
(hours)are highly statistically significant and have a negative sign. This suggest that the 1 per
cent increase in import documents number would, on average, lead to import volumes being
diminished by 26,47 per cent. Similarly, the 1 per cent increase in border compliance would,
on average, lead to import volumes being diminished by7,87 per cent.
In other words, the trade procedures caused by the number of document to import and border
compliance do indeed have a significantly negative effect on trade volumes. It follows that a
country which reforms its trade procedures so that the number of documents to import and
the time delays at the border are decreased could expect to see increased import volumes.
6. Conclusion
The purpose of this paper has been to evaluate and analyze the effects of inefficient trade
procedures on trade volumes between African countries. For this aim, we use gravity model.
The model includes a total of 49 African countries over the 2010-2015 periods. Our
descriptive analysis shows that the intra-African trade ratio is low compared with other
regions in the world. Among the factors holding back the intra-African trade figure
prominently: the document requirements, the cumbersome border-crossing procedures
and delays. For instance, we need in average ten days to clear direct exports through customs
in Sub-Saharan Africa and on average eight documents to import.
Our econometric analysis found that trade procedures such as the number of documents
required to import goods and Border compliance negatively affect trade volume in Africa.
The policy implications of our results are important for the implementation of AfCFTA. In
general, trade facilitation measures as a whole will help African countries to improve their
trade performance. In particular, there is a need of harmonization of trade procedures. This
include the harmonization of documents in number and in forms, and the streamlining of
customs procedures.
Research in Applied Economics
ISSN 1948-5433
2021, Vol. 13, No. 1
http://rae.macrothink.org 27
References
AfDB (African Development Bank), AU (African Union) & ECA (Economic Commission
for Africa) 2013). Assessing Regional Integration in Africa VI: Harmonizing Policies to
Transform the Trading Environment. Addis Ababa, Ethiopia.
https://doi.org/10.18356/5d7bf72c-en
African Union (2013). Action plan for boosting intra-African trade.
https://doi.org/10.4060/cb3172en
Anderson, J.E., &Van Wincoop, E. (2003). Gravity with Gravitas: A Solution to the Border
Puzzle. American Economic Review, 93(1),
170-192.https://doi.org/10.1257/000282803321455214
Anderson, J. E., & Yotov, Y. V. (2016). Terms of Trade and Global Efficiency Effects of
Free Trade Agreements, 1990-2002. Journal of International Economics, 99(C),
279-298. https://doi.org/10.1016/j.jinteco.2015.10.006
Arvis, J.-F., Duval, Y., Shepherd, B., & Utoktham, C. (2013). Trade Costs in the Developing
World: 1995–2010. Policy Research Working Paper 6309. World Bank Washington,
DC. https://doi.org/10.1596/1813-9450-6309
Baier, S. L., & Bergstrand, J. H. (2007). Do Free Trade Agreements Actually Increase
Members’ International Trade? Journal of International Economics, 71(1), 72-95.
https://doi.org/10.1016/j.jinteco.2006.02.005
Bourdet, Y., & M. Persson (2012), Completing the European Union Customs Union: The
Effects of Trade Procedure Harmonization. Journal of Common Market Studies, 50(2),
300-314. https://doi.org/10.1111/j.1468-5965.2011.02203.x
Djankov, S., Freund, C., & Pham, C.S. (2010), Trading on Time. Review of Economics and
Statistics, 92(1), 166-173.https://doi.org/10.1162/rest.2009.11498
Donaldson, D., Jinhage, A., & Verhoogen, E. (2017). Beyond borders: Making transport
work for African trade. Growth Brief, International Growth Centre, March 2017.
ECA (Economic Commission for Africa) (2016). Brief for the Office of the Executive
Secretary on Regional Integration and the Continental Free Trade Area. African Trade
Policy Centre. Addis Ababa.
Economic and Social Commission for Asia and the Pacific(ESCAP) (2013). International
Supply Chain Connectivity (ISCC) Database: Explanatory Note for Users.
Freund, C. L. & Rocha, N. (2010). What Constrains Africa’s Exports?. Policy Research
Working Paper No 5184. Washington DC: World Bank.
https://doi.org/10.1596/1813-9450-5184
Head, K. (2003), Gravity for beginners. mimeo, University of British Columbia.
Head, K., & Mayer, T. (2013). What Separates Us? Sources of Resistance to Globalization.
Research in Applied Economics
ISSN 1948-5433
2021, Vol. 13, No. 1
http://rae.macrothink.org 28
Canadian Journal of Economics, 46(4), 1196-1231.https://doi.org/10.1111/caje.12055
Head, K., & Mayer, T. (2014). Gravity Equations: Workhorse, Toolkit, and Cookbook. In G.
Gopinath, E. Helpman & K. Rogoff (Eds.), Handbook of International Economics, 4.
Oxford: Elsevier B. V. https://doi.org/10.1016/b978-0-444-54314-1.00003-3
Hummels, D. L., &Schaur, G. (2013). Time as a Trade Barrier. American Economic Review
103(7), 2935-2959.https://doi.org/10.1257/aer.103.7.2935
Kim, S., Lee H., & Park, I. (2004). Measuring the Impact of APEC Trade Facilitation: A
Gravity Analysis". Paper presented in the Reunion of the Economic Committee of the
APEC. Santiago, Chili.
Kouty, M. (2018), Trading costs in Africa: does international supply chain connectivity
matter? Journal of Economic Development, 43(2), 85-102.
https://doi.org/10.35866/caujed.2018.43.2.005
Melitz, J. (2008). Language and Foreign Trade. European Economic Review, 52(4), 667-699.
https://doi.org/10.1016/j.euroecorev.2007.05.002
Melitz, J., & Toubal, F. (2014). Native Language, Spoken Language, Translation and Trade.
Journal of International Economics, 93(2), 351-363.
https://doi.org/10.1016/j.jinteco.2014.04.004
Mevel. S., & Karingi, S. (2012). Deepening regional integration in Africa: A computable
general equilibrium assessment of the establishment of a continental free trade area
followed by a continental customs union. Presented at the seventh African Economic
Conference. 30 October to 2 November. Kigali. https://doi.org/10.18356/fbd43b1f-en
Moïsé, E., & Sorescu, S. (2013). Trade Facilitation Indicators: The Potential Impact of Trade
Facilitation on Developing Countries Trade. OECD Trade Policy Papers. 144. OECD
Publishing. https://doi.org/10.1787/5k4bw6kg6ws2-en
Novy, D. (2013). Gravity Redux: Measuring International Trade Costs with Panel Data.
Economic Inquiry, 51(1), 101-121.https://doi.org/10.1111/j.1465-7295.2011.00439.x
Seetanah, B., Sannassee, R. V., & Fauzel, S. (2016). Trade facilitation and trade flows:
Evidence from Africa. In WTO (Ed.), Trade costs and inclusive growth (pp. 200-220).
Geneva, Switzerland. https://doi.org/10.30875/49648549-en
United Nations Economic Commission for Africa, African Union & African Development
Bank (2017). Assessing Regional Integration in Africa VIII: Bringing the Continental
Free Trade Area About. Addis Ababa, Ethiopia. https://doi.org/10.18356/06269c87-en
UNCTAD (2019). The Economic Development in Africa Report 2019: Made in Africa –
Rules of Origin for Enhanced Intra-African Trade. New York and Geneva.
https://doi.org/10.18356/c5dd68cb-en
Zaki, C. (2007). Does Trade Facilitation Matter in Bilateral Trade? University of Paris 1,
mimeo.

Research in Applied Economics
ISSN 1948-5433
2021, Vol. 13, No. 1
http://rae.macrothink.org 29
World Bank (2020). The African Continental Free Trade Area: Economic and Distributional
Effects. Washington, DC: World Bank. https://doi.org/10.1596/978-1-4648-1559-1
World Trade Organization (WTO) (2015). World Trade Report 2015: Speeding Up Trade:
Benefits And Challenges of Implementing the WTO Trade Facilitation Agreement.
Geneva, Switzerland. https://doi.org/10.30875/3f513c80-en
Appendix
Figure A1. Members of AfCFTA by statute
Source: World Bank(2020).
Research in Applied Economics
ISSN 1948-5433
2021, Vol. 13, No. 1
http://rae.macrothink.org 30
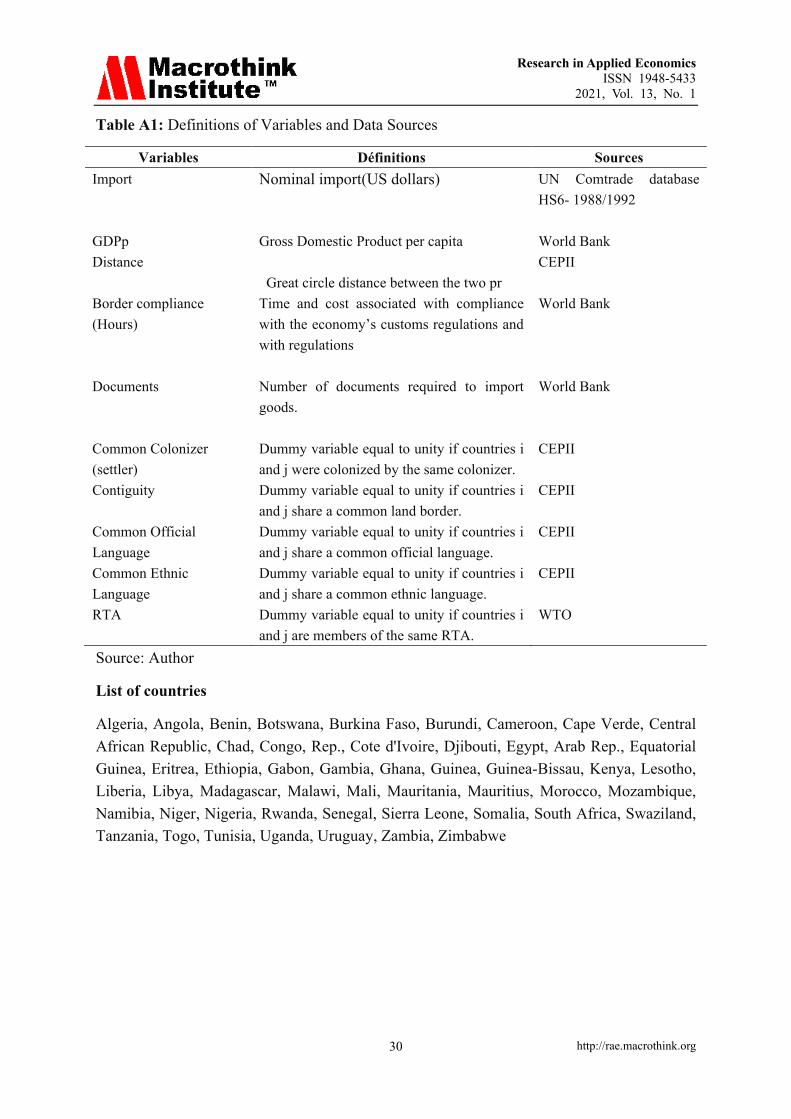
Table A1: Definitions of Variables and Data Sources
Variables Définitions Sources
Import Nominal import(US dollars) UN Comtrade database
HS6- 1988/1992
GDPp Gross Domestic Product per capita World Bank
Distance
Great circle distance between the two pr
CEPII
Border compliance
(Hours)
Time and cost associated with compliance
with the economy’s customs regulations and
with regulations
World Bank
Documents Number of documents required to import
goods.
World Bank
Common Colonizer
(settler)
Dummy variable equal to unity if countries i
and j were colonized by the same colonizer.
CEPII
Contiguity Dummy variable equal to unity if countries i
and j share a common land border.
CEPII
Common Official
Language
Dummy variable equal to unity if countries i
and j share a common official language.
CEPII
Common Ethnic
Language
Dummy variable equal to unity if countries i
and j share a common ethnic language.
CEPII
RTA Dummy variable equal to unity if countries i
and j are members of the same RTA.
WTO
Source: Author
List of countries
Algeria, Angola, Benin, Botswana, Burkina Faso, Burundi, Cameroon, Cape Verde, Central
African Republic, Chad, Congo, Rep., Cote d'Ivoire, Djibouti, Egypt, Arab Rep., Equatorial
Guinea, Eritrea, Ethiopia, Gabon, Gambia, Ghana, Guinea, Guinea-Bissau, Kenya, Lesotho,
Liberia, Libya, Madagascar, Malawi, Mali, Mauritania, Mauritius, Morocco, Mozambique,
Namibia, Niger, Nigeria, Rwanda, Senegal, Sierra Leone, Somalia, South Africa, Swaziland,
Tanzania, Togo, Tunisia, Uganda, Uruguay, Zambia, Zimbabwe
Research in Applied Economics
ISSN 1948-5433
2021, Vol. 13, No. 1
http://rae.macrothink.org 31
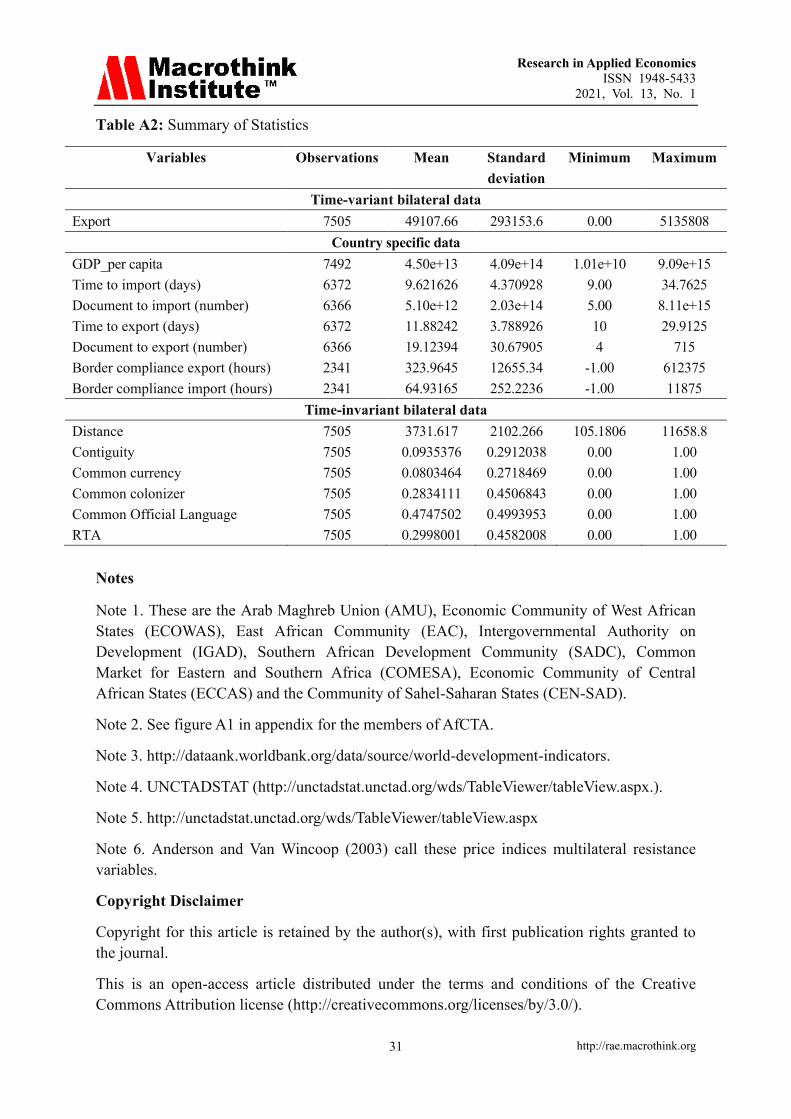
Table A2: Summary of Statistics
Variables Observations Mean Standard
deviation
Minimum Maximum
Time-variant bilateral data
Export 7505 49107.66 293153.6 0.00 5135808
Country specific data
GDP_per capita 7492 4.50e+13 4.09e+14 1.01e+10 9.09e+15
Time to import (days) 6372 9.621626 4.370928 9.00 34.7625
Document to import (number) 6366 5.10e+12 2.03e+14 5.00 8.11e+15
Time to export (days) 6372 11.88242 3.788926 10 29.9125
Document to export (number) 6366 19.12394 30.67905 4 715
Border compliance export (hours) 2341 323.9645 12655.34 -1.00 612375
Border compliance import (hours) 2341 64.93165 252.2236 -1.00 11875
Time-invariant bilateral data
Distance 7505 3731.617 2102.266 105.1806 11658.8
Contiguity 7505 0.0935376 0.2912038 0.00 1.00
Common currency 7505 0.0803464 0.2718469 0.00 1.00
Common colonizer 7505 0.2834111 0.4506843 0.00 1.00
Common Official Language 7505 0.4747502 0.4993953 0.00 1.00
RTA 7505 0.2998001 0.4582008 0.00 1.00
Notes
Note 1. These are the Arab Maghreb Union (AMU), Economic Community of West African
States (ECOWAS), East African Community (EAC), Intergovernmental Authority on
Development (IGAD), Southern African Development Community (SADC), Common
Market for Eastern and Southern Africa (COMESA), Economic Community of Central
African States (ECCAS) and the Community of Sahel-Saharan States (CEN-SAD).
Note 2. See figure A1 in appendix for the members of AfCTA.
Note 3. http://dataank.worldbank.org/data/source/world-development-indicators.
Note 4. UNCTADSTAT (http://unctadstat.unctad.org/wds/TableViewer/tableView.aspx.).
Note 5. http://unctadstat.unctad.org/wds/TableViewer/tableView.aspx
Note 6. Anderson and Van Wincoop (2003) call these price indices multilateral resistance
variables.
Copyright Disclaimer
Copyright for this article is retained by the author(s), with first publication rights granted to
the journal.
This is an open-access article distributed under the terms and conditions of the Creative
Commons Attribution license (http://creativecommons.org/licenses/by/3.0/).