implementing the gsbpm - european free trade associationtest production systems 3.3 configure...
TRANSCRIPT

United Nations Economic Commission for EuropeStatistical DivisionUnited Nations Economic Commission for EuropeStatistical Division
Implementing the GSBPM
Steven Vale

What is the GSBPM?
Generic Statistical Business Process Model
Shows the different steps to produce official
statistics
Provides standard terminology to help
statistical organisations:
• Modernise statistical production processes
• Share methods and components
A short history
Created as part of the UNECE “Common
Metadata Framework”
Versions 1-3 only used within
metadata group
Version 4 – April 2009
Version 5 – December 2013
New version – End of 2018
• Minor changes, more explanations, better
integration with other models
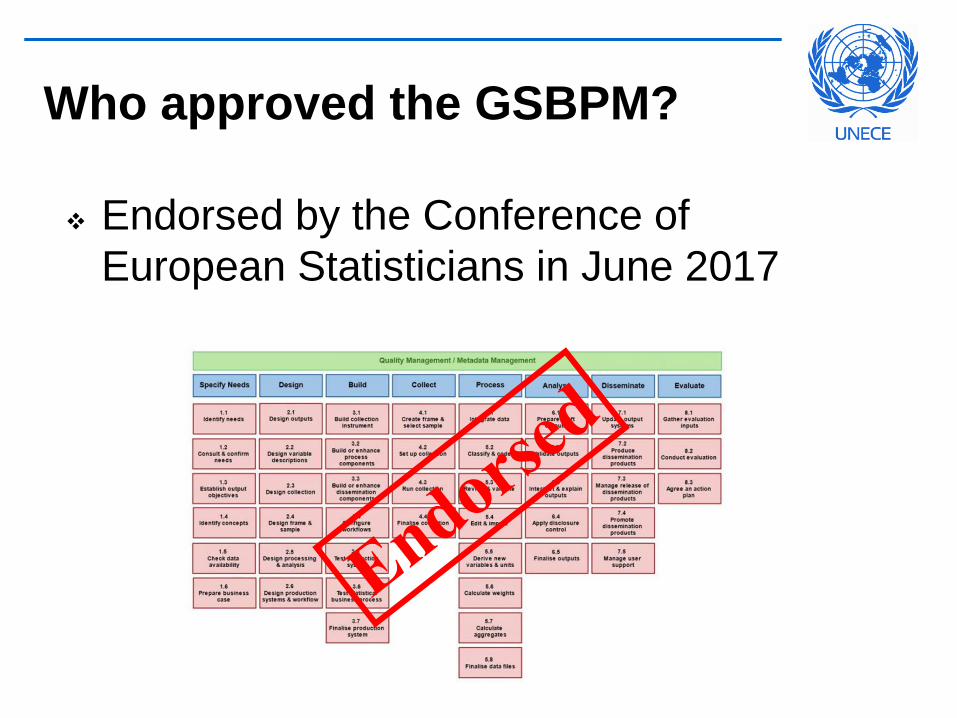
Who approved the GSBPM?
Endorsed by the Conference of
European Statisticians in June 2017
Why do we need the GSBPM?
To facilitate communication within and
between statistical organisations
To define and describe statistical
processes in a coherent way
To compare and benchmark processes
within and between organisations
To make better decisions on how to
organise statistical production

Applicability (1)
All activities undertaken by producers of
official statistics which result in data outputs
All statistical domains
National and international statistical
organisations

Applicability (2)
Development and maintenance of statistical
registers
All types of data source:
• Surveys / censuses
• Administrative sources / register-based
statistics
• Mixed sources
• “Big Data”
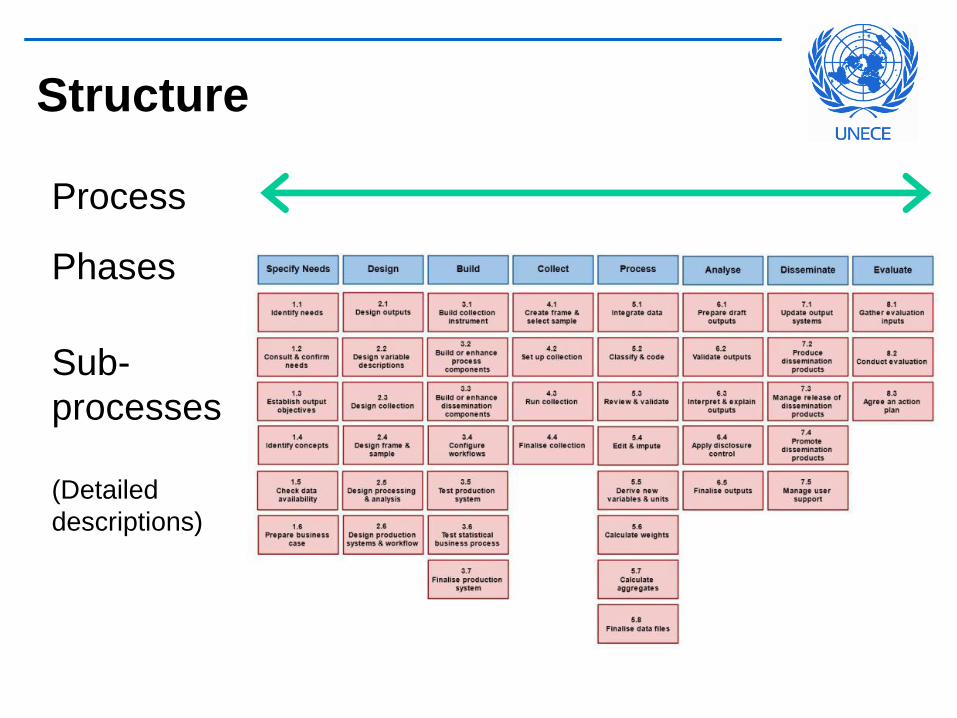
Structure
Process
Phases
Sub-
processes
(Detailed
descriptions)

Key features
Not a linear model Sub-processes are not followed in a strict
order
It is a matrix, through which there are many
possible paths

The GSBPM is used by more than
70 statistical organisations
worldwide

Uses of the GSBPM
Managing statistical programmes
Cost / resource allocation
Documenting statistical processes
Framework for quality assessment
Sharing statistical software
Communication!

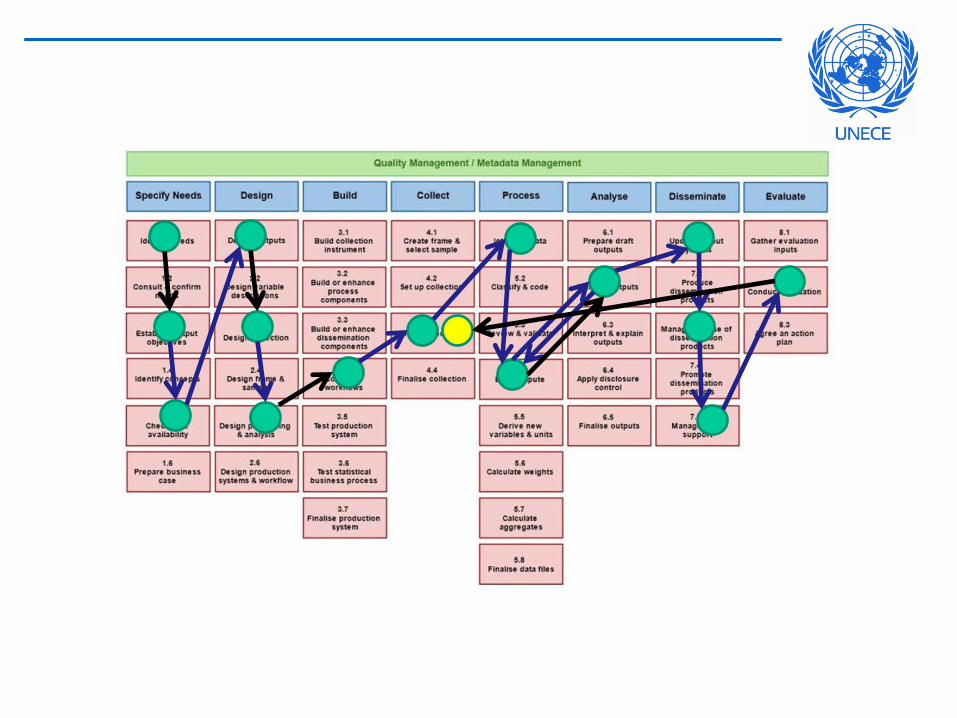
Example: Resource planning
Mapping processes to GSBPM
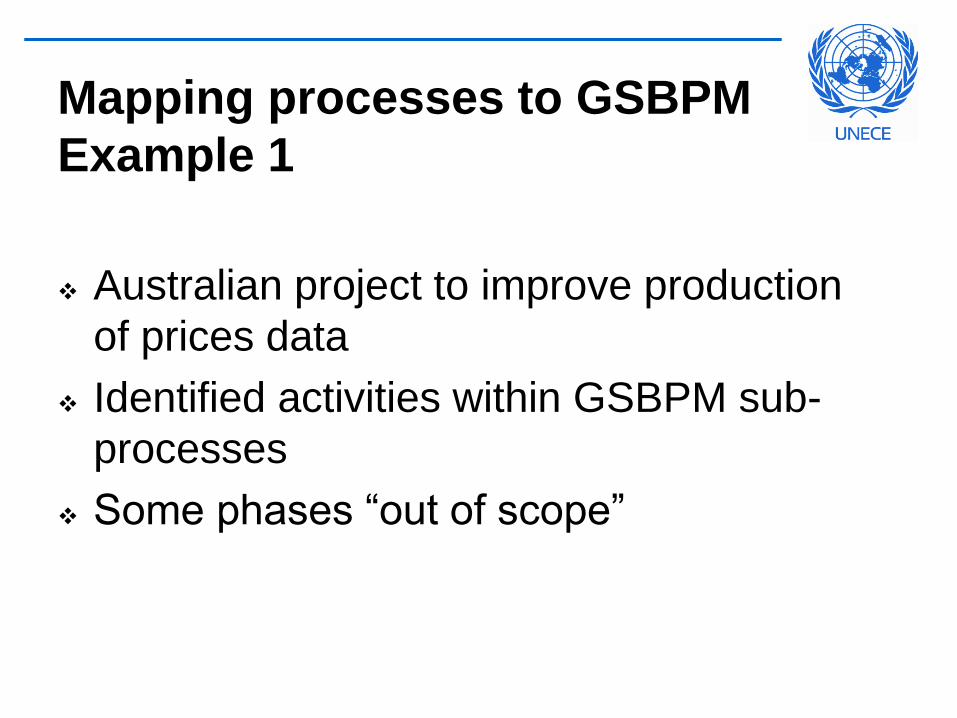
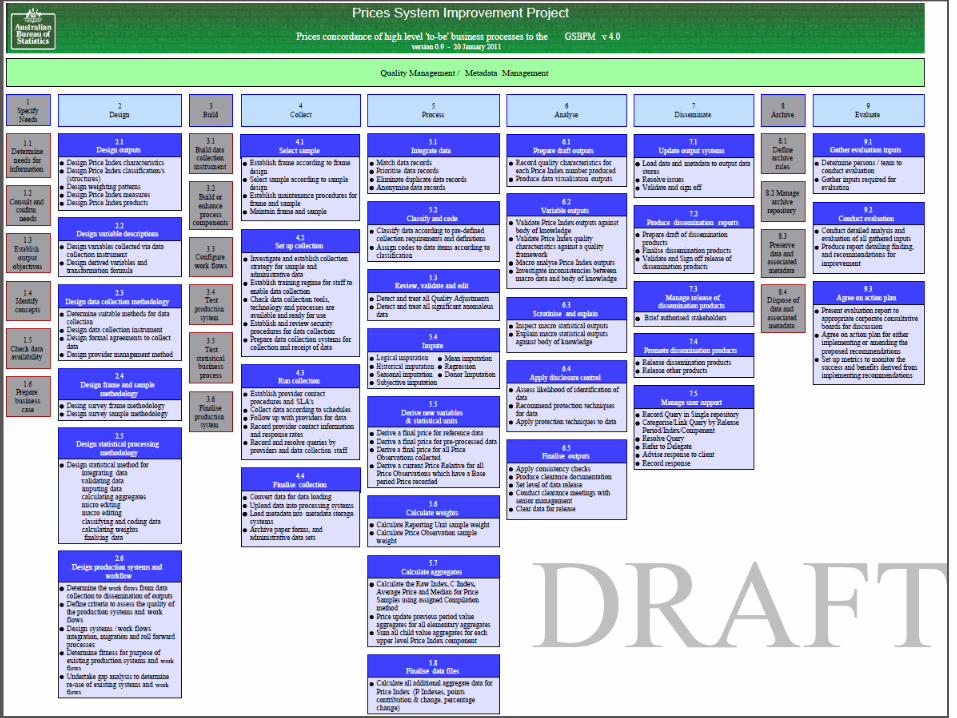
Example 1
Australian project to improve production
of prices data
Identified activities within GSBPM sub-
processes
Some phases “out of scope”
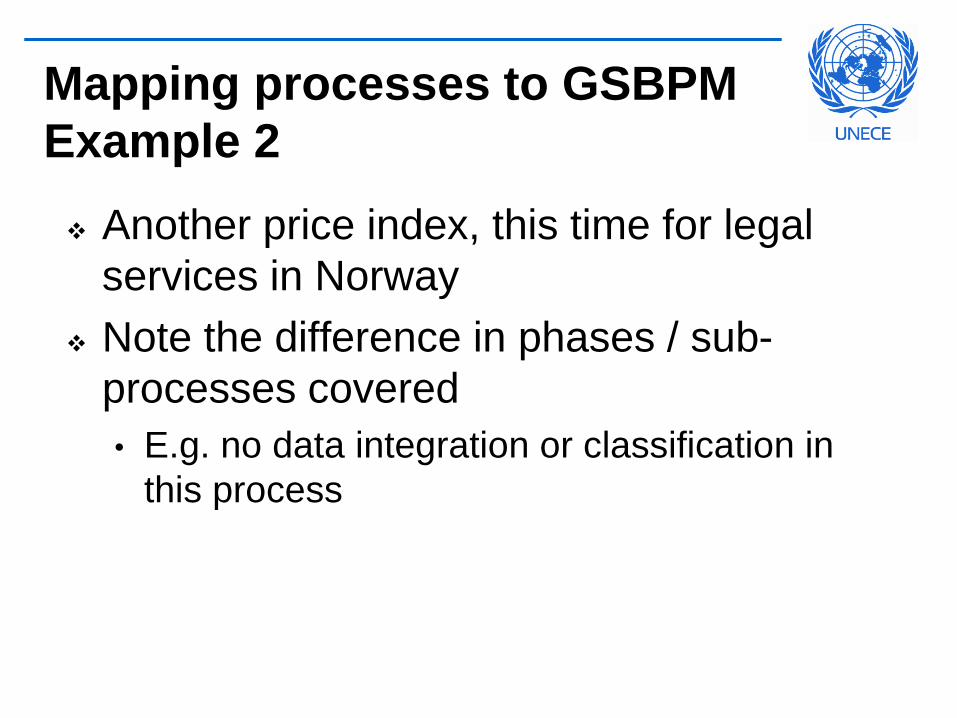
Another price index, this time for legal
services in Norway
Note the difference in phases / sub-
processes covered
• E.g. no data integration or classification in
this process
Mapping processes to GSBPM
Example 2

5.8
Finalise data files
5.6
Calculate weights
Price index for legal services
Quality Management / Metadata ManagementSpecify
NeedsDesign Build Collect Process Analyse Disseminate
1.1
Determine needs for
information
• Eurostat regulation
• Ministry of Justice
• Trade association
• Major companies
1.2
Consult & confirm
needs
• See 1.1
1.6
Prepare business case
1.4
Identify concepts
1.3
Establish output
objectives
1.5
Check data availability
• Provided in regulation
• Variables
• Classifications
• Project plan
• Finances
• Choose companies
(population) together with
trade association
2.2
Design variable
descriptions
• See Eurostat regulation
• Agree on level of detail
• Translation
2.6
Design production
systems & workflow
2.4
Design frame & sample
methodology
2.3
Design data collection
methodology
2.5
Design statistical
processing
methodology
• Paper & electronic
questionnaires
• Scanning
• Establish population
• Make sample plan
• Stratification by size
• Scanning paper
questionnaires
• Electronic data capture
• Micro controls
• Weighting
• Estimation
3.1
Build data collection
instrument
• Standard first page
• Test paper & electronic
3.2
Build or enhance
process components
• Integrated system for
editing and estimation
• Sample register
3.6
Finalise production
system
3.4
Test production
systems
3.3
Configure workflows
3.5
Test statistical business
process
• Meetings with the various
data capture divisions
• Test micro-controls
• Documentation
• Training
• Meetings with 1st and
2nd line support
• No field test or pilot
carried out
4.1
Select sample
• Companies selected
according to sample plan
4.2
Set up collection
• Time plan
• Preprinting, packing,
sending, scanning etc.
4.4
Finalise collection
4.3
Run collection
• Packing & sending
• Receive electronic data
• Scan papir
• Update received reg.
• Send warnings & fines
5.1
Integrate data
• No integration carried out
5.2
Classify and code
• No classifying or coding
carried out
5.4
Impute
5.3
Review, validate & edit
5.5
Derive new variables &
statistical units
• Duplicates
• Regional and product
views
• Discover outliers
• Correct microdata
• No imputation carried out
• Weights are established in
phase 2
• Weights are stored per
survey
• Publication variables
• Observation units =
analysis units
6.1
Prepare draft outputs
• Index & 4 sub-indices
• Confidence intervals
• Coefficient of variation
• Tables & graphs
6.2
Validate outputs
• Check most important
companies have replied.
Iterative with 4.3
• Check variation
coefficient.
6.4
Apply disclosure control
6.3
Scrutinize & explain
6.5
Finalize outputs
• Consult trade association.
• Trade trends
• Any previous periods
• Other price indexes
• Aggregation & publication
level
• Final consistency checks
• Supporting internal
documentation
7.1
Update output systems
• Load data into StatBank
7.2
Produce dissemination
products
• Daily statistics
• About the statistics
• Tables & graphs
7.4
Promote dissemination
products
7.3
Manage release of
dissemination products
7.5
Manage user support
• Statistical calender
• Approval routines
• ssb.no
• Daily statistics
• Web statistics
• Mail or telephone
• Contact 1.1 users
• Data from electronic &
paper questionnaires
• Deliver data to processing
5.7
Calculate aggregates
• Data files are finalised
2.1
Design outputs
General dissemination
policy:
• About the statistics• Tables in StatBank
• Text & graphs
• Aggregates are calculated

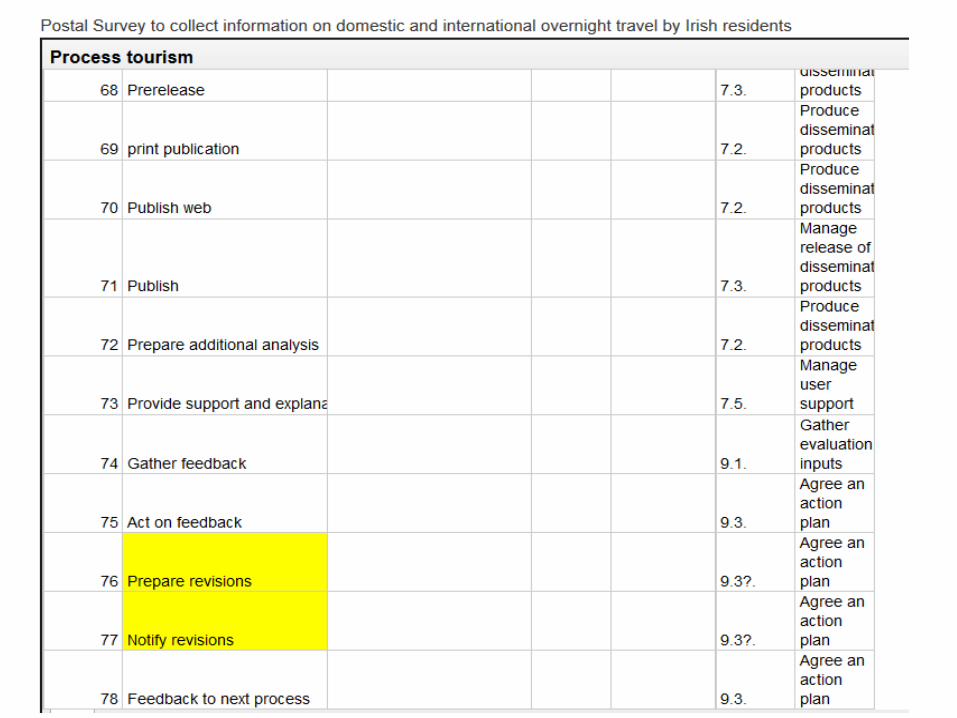
Irish tourism survey
Mapped GSBPM to 78 survey process
steps
Mapping processes to GSBPM
Example 3

Denmark – quarterly survey on
employment in construction
Established, regular survey
• Just phases 4 to 7
Mapping processes to GSBPM
Example 4


More detail?
Example from
Azerbaijan of
an extra level

GSBPM for statistical registers?
Register maintenance is a continuous
activity, not a single process
But registers have:
• Inputs “collected” from different sources
• Processing and analysis of data
• Outputs – statistics and sampling frames
Therefore register maintenance is
similar to other statistical production

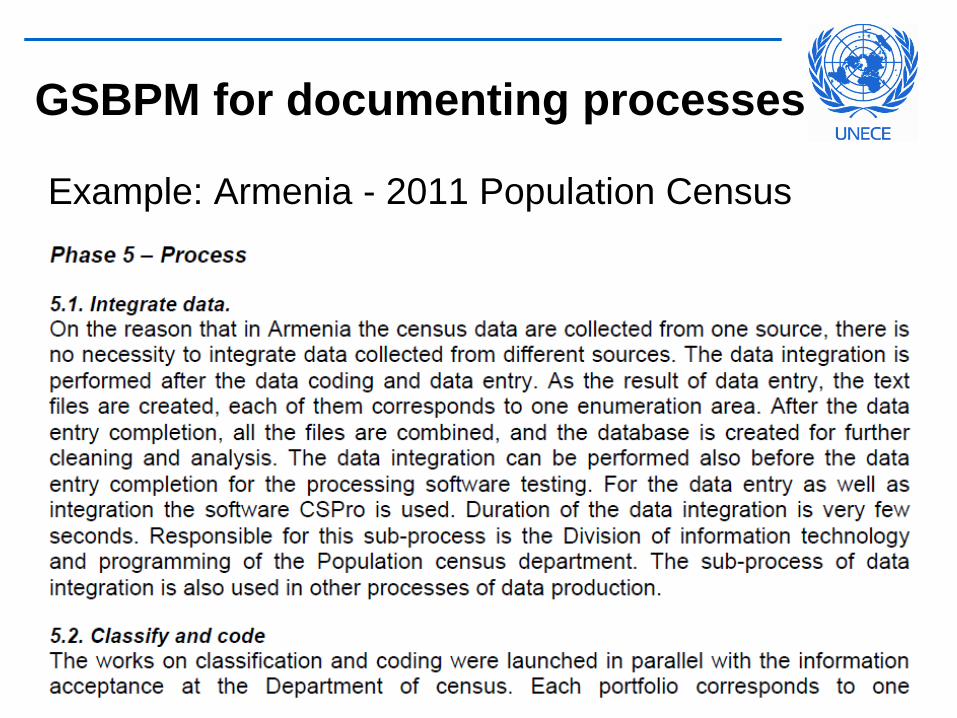
Example: Armenia - 2011 Population Census
GSBPM for documenting processes

Similar approaches are
now widely used in
many other countries

February 2014 –pilot surveys description
Labour statistics Industry Statistics
10-12 June 2014, Nizhny Novgorod, Russia
Belarus: Using GSBPM 5.0 to describe the existing statistical production processes
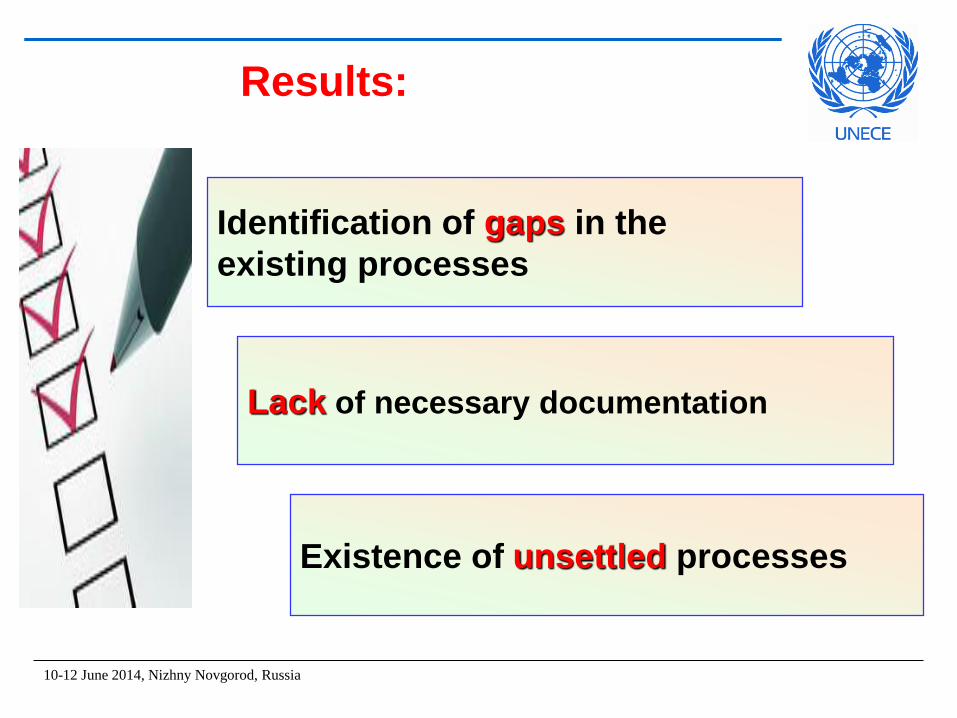
Results:
Identification of gaps in the
existing processes
10-12 June 2014, Nizhny Novgorod, Russia
Lack of necessary documentation
Existence of unsettled processes

Manage and document statistical productiona) Documentary system for statistical surveys
b) Descriptions of processes of the statistical survey
c) Guidelines for Quality Assurance (QA)
Usefulness of GSBPM

Documentation of statistical survey
1. Before:
a) Missed documentation
b) Not structured documents
c) In different places
2. A new system:
a) One place for all surveys
b) Documents are structured (GSBPM)
c) The information can not be lost
d) Unauthorised access is not possible
e) Comparability between surveys
f) Preparation of documentation is planned part
of the survey implementation
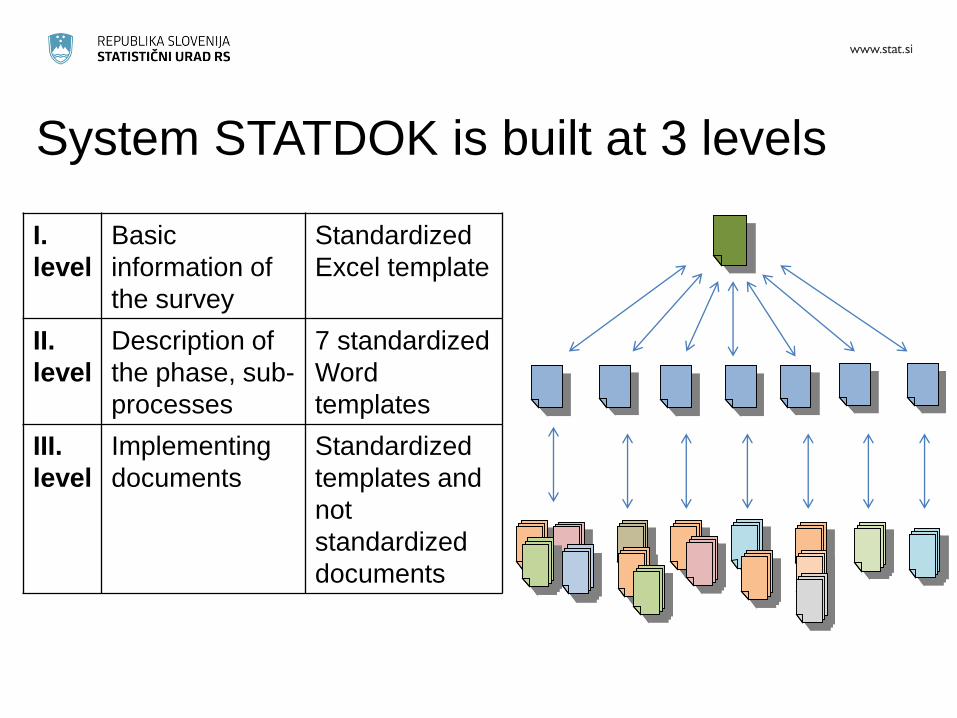
System STATDOK is built at 3 levels
I.
level
Basic
information of
the survey
Standardized
Excel template
II.
level
Description of
the phase, sub-
processes
7 standardized
Word
templates
III.
level
Implementing
documents
Standardized
templates and
not
standardized
documents

1. Methodologist
2. Head of the
organizational unit
3. Process / sub-
process administrator
and leadership
How did we do it?
How should it be done?
How is it done in other surveys?
Do we have data for 19XX?
Are they comparable?
Where can we find them?
Analysis of documentation
Education of co-workers
Optimisations
Standardization
Similarity
Personal data
Critical points
…
STATDOK is useful

Swim lanes method - Armenia
Purpose of documentation
Needs to be agreed before work starts!
Examples:
• Knowledge management
• Succession planning
• Standardisation – understanding the starting
point
• Metadata / quality management
• International reporting

What to document?
For the whole process:
• Summary of purpose
• Sources, outputs and users
• Links to other processes
• Costs?
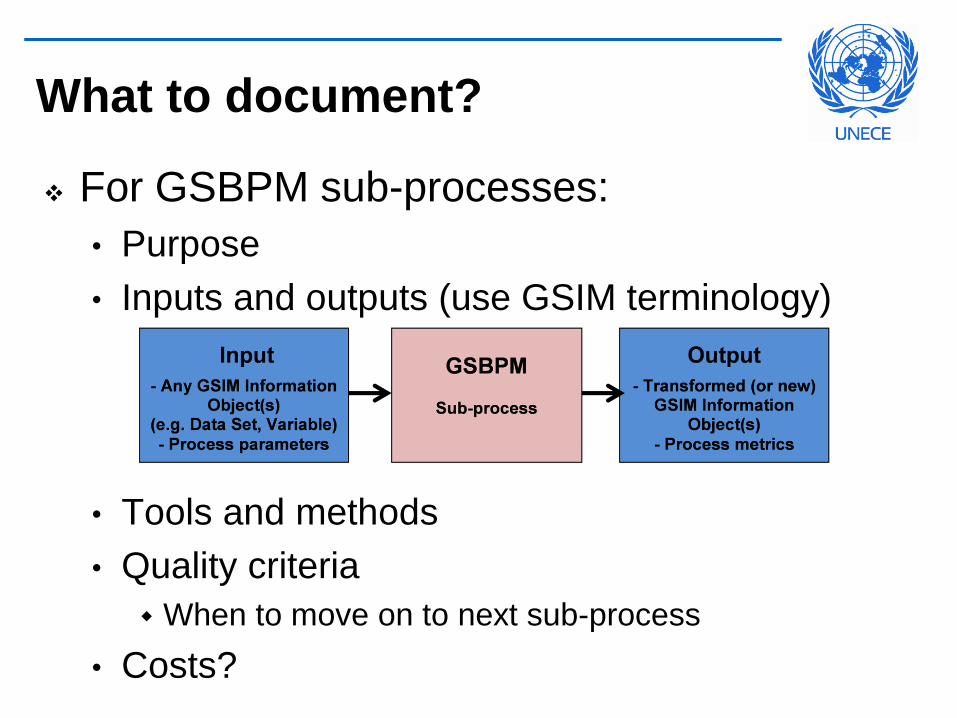
What to document?
For GSBPM sub-processes:
• Purpose
• Inputs and outputs (use GSIM terminology)
• Tools and methods
• Quality criteria
When to move on to next sub-process
• Costs?
How to document?
Use consistent terminology
Use a common template
Store in a flexible database to allow
creation of reports for different purposes
Standard documentation for common
sub-processes
• Quicker and more efficient
• Incentive for standardisation!

GSBPM and Quality
Quality indicators task team
• Canada, Hungary, Italy, Turkey, Eurostat
Mapping existing national / EU quality
indicators to GSBPM sub processes
Generic quality indicators for each GSBPM
sub-process
• Processes based on surveys: 2016
• Processes based on administrative data: 2017

More information
GSBPM Wiki
www1.unece.org/stat/platform/display/GSBPM