implications of rapid charging and chemo-mechanical
TRANSCRIPT

IMPLICATIONS OF RAPID CHARGING AND CHEMO-MECHANICAL
DEGRADATION IN LITHIUM-ION BATTERY ELECTRODES
A Thesis
by
MOHAMMED FOUAD MOHAMMED HASAN
Submitted to the Office of Graduate and Professional Studies of
Texas A&M University
in partial fulfillment of the requirements for the degree of
MASTER OF SCIENCE
Chair of Committee, Partha P. Mukherjee
Committee Members, Devesh Ranjan
Raktim Bhattacharya
Head of Department, Andreas A. Polycarpou
May 2014
Major Subject: Mechanical Engineering
Copyright 2014 Mohammed Fouad Mohammed Hasan

ii
ABSTRACT
Li-ion batteries, owing to their unique characteristics with high power and energy
density, are broadly considered a leading candidate for vehicle electrification. A pivotal
performance drawback of the Li-ion batteries manifests in the lengthy charging time and
the limited cycle life. Fast charging is one of the most desired characteristics for the
emerging vehicle technologies, which is at a nascent stage and not well understood.
Moreover, cycle life is a vital component of battery integration and market penetration.
The objectives of this work include: (1) investigating the fast charging induced
performance limitations with emphasis on temperature extremes; and (2) studying the
implications of combined chemical and mechanical degradation modes on the battery
cycle life.
In this work, a coupled electrochemical-thermal model is utilized to study the
internal behavior and thermal interactions during fast charging process. Additionally, the
cycle life predictions are realized by developing a capacity fade model consisting of a
coupled chemical (irreversible solid electrolyte interface formation) and mechanical
(intercalation induced damage) degradation formalism with thermal effect.
Primary results with conventional protocol at high rate (3C) show that at moderate
and high operating temperatures the main performance limitations of fast charging
originate from lithium ion transport in the electrolyte and ohmic resistance. However,
charge transfer resistance is found to be the limiting mechanism for the conventional 1C
charging rate at low temperatures. Furthermore, it was found that the concentration build-

iii
up at anode surface can be effectively manipulated by using an appropriate charging
protocol such as pulse charging and boostcharging. However, it was concluded that at low
temperatures, a successful charging protocol is achieved by utilizing the principle of
thermal excitement. For battery cycle life, results show that mechanical degradation is the
predominant mechanism for capacity fade at low temperatures and high rates. However,
the temperature as a stress factor is the principle capacity fade source at high operating
temperatures where mechanical degradation is not prominent. The importance of cooling
condition, particle size and the exchange current density on life cycle have been
emphasized. Finally, a degradation phase map that shows the significance of active
particle size and stress factors (temperature and current rate) on the capacity fade is
presented. It is concluded that the particle size showed a trade-off in the capacity fade
results at different temperatures.

iv
ACKNOWLEDGEMENTS
First I would like to express my special thanks to my advisor, Dr. Partha
Mukherjee, for his wisdom and guidance throughout my work and preparation of this
thesis. Additionally, I would like to thank my committee members, Dr. Bhattacharya and
Dr. Ranjan, for their guidance and support throughout the course of this research. I would
also like to thank my parents and siblings, for their support and encouragement. They
were always there whenever needed. Thanks also go to my friends and colleagues for
making my time at Texas A&M University a great experience.

v
NOMENCLATURE
cellA surface area of the cell (m2)
sa specific surface area (1/m)
ec electrolyte concentration (mol/l)
sc solid phase concentration (mol/l)
pC cell heat capacity (J/kg.k)
eD lithium ion diffusivity in the electrolyte (m2/s)
sD solid phase diffusivity (m2/s)
,a iE activation energy (J/mol)
F faraday’s constant (J/mol)
convh heat transfer coefficient (W/m2.K)
0,ij exchange current density (A/m2)
locj local current density (A/m2)
cellm cell mass (kg)
P arbitrary parameter
actQ active polarization heat generation (J/m3)
ohmQ ohmic heat generation (J/m3)
rxnQ reaction heat generation (J/m3)
R gas constant (J/mol.k)
fR film resistance (Ω/m2)
ParticleR active material particle radius (m)

vi
T temperature (K)
t transference number
ambT ambient temperature (K)
nU open circuit potential of negative electrode (V)
pU open circuit potential of positive electrode (V)
Greek letters
a transfer coefficient for anodic current
c transfer coefficient for cathodic current
e volume fraction of the electrolyte
s solid phase active material volume fraction
i electrical potential (V)
bruggeman tortuosity exponent
i overpotential (V)

vii
TABLE OF CONTENTS
Page
ABSTRACT .......................................................................................................................ii
ACKNOWLEDGEMENTS .............................................................................................. iv
NOMENCLATURE ........................................................................................................... v
TABLE OF CONTENTS .................................................................................................vii
LIST OF FIGURES ........................................................................................................ viii
LIST OF TABLES ............................................................................................................ xi
CHAPTER I INTRODUCTION AND LITERATURE REVIEW ................................... 1
Literature Review ....................................................................................................... 3 Summary .................................................................................................................. 10
CHAPTER II RAPID CHARGING PERFORMANCE ANALYSIS ............................. 12
Electrochemical-Thermal Model .............................................................................. 13
Fast Charging Performance and Limiting Mechanisms ........................................... 18 Charging Protocols ................................................................................................... 30
Electrode Design Parameters .................................................................................... 44 Summary .................................................................................................................. 54
CHAPTER III CYCLE LIFE ANALYSIS BY COUPLED CHEMICAL AND
MECHANICAL DEGRADATION MECHANISMS ............................ 56
Mathematical Model ................................................................................................. 56 Results and Discussion ............................................................................................. 66 Summary .................................................................................................................. 84
CHAPTER IV CONCLUSION AND OUTLOOK .......................................................... 87
REFERENCES ................................................................................................................. 91

viii
LIST OF FIGURES
Page
Figure 1 Comparison between modeling and experimental results (Ji et al. [81])
with charging at different C-rates at 25oC ......................................................... 17
Figure 2 The charging time and columbic efficiency as a function of charge /
discharge at operating temperatures of: 25oC (a, b) 45oC (c, d) and -20oC
(e, f) ................................................................................................................... 19
Figure 3 Cell resistances at an operating temperature of 25˚C; at (a) self-heating
[h = 28 W/m2.K], (b) adiabatic and (c) isothermal ............................................ 21
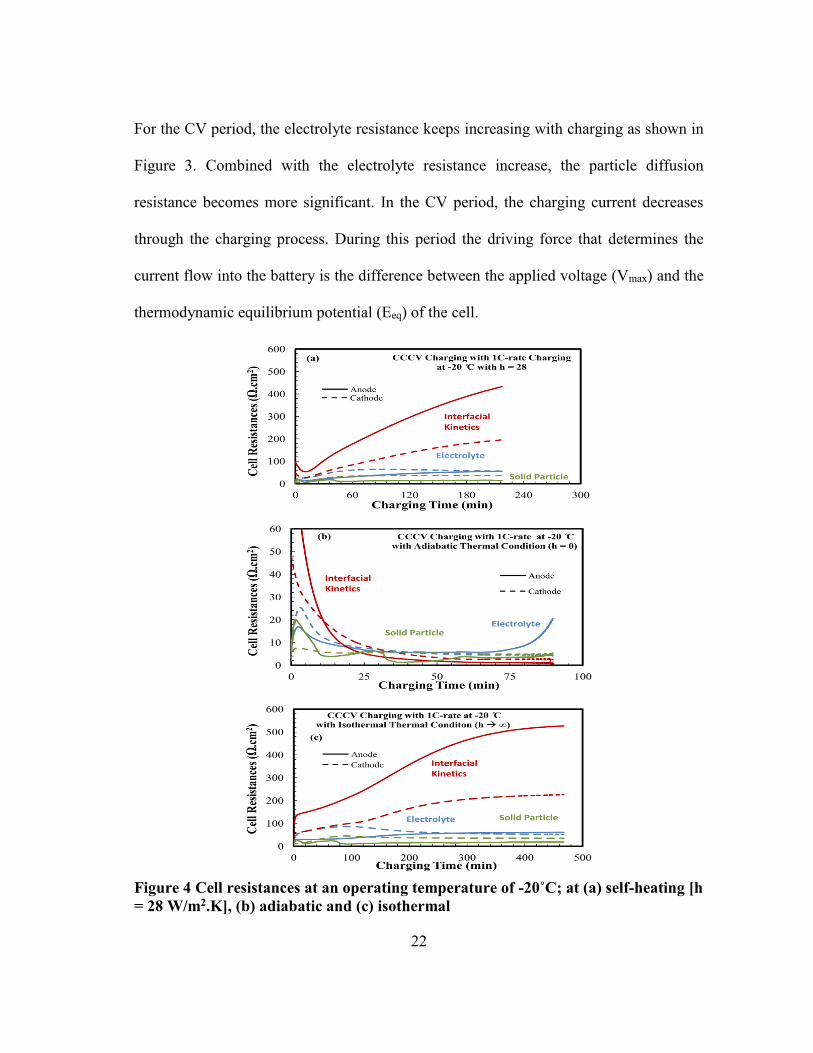
Figure 4 Cell resistances at an operating temperature of -20˚C; at (a) self-heating
[h = 28 W/m2.K], (b) adiabatic and (c) isothermal ............................................ 22
Figure 5 Cell resistances at an operating temperature of 45˚C; at (a) self-heating
[h = 28 W/m2.K], (b) adiabatic and (c) isothermal ............................................ 23
Figure 6 The electrolyte concentration and potential across the cell at the end of the
CC period during fast charging with 3C at 25˚C and self-heating thermal
condition ............................................................................................................ 24
Figure 7 The cell resistance during slow charging at 25˚C and self-heating (h = 28
W/m2.K) thermal condition ............................................................................... 25
Figure 8 The adiabatic charging performance curve and temperature increase
starting from -20˚C ............................................................................................ 28
Figure 9 The constant current protocol charging time and charging efficiency with
different applied charging currents starting at 25oC .......................................... 31
Figure 10 The local utilization of the active material across the cell for CC charging
at 3C-rate starting at 25˚C ................................................................................ 32
Figure 11 Pulse charging with duty cycle of 75% and an average applied current of
2C in terms of the charging time, capacity return and temperature
increase in (a) and the pulse charging is followed by CV charge in (b) .......... 33
Figure 12 The effect of the pulse charging on the lithium ion concentration at the
anode/separator (iSOC).................................................................................... 34

ix
Figure 13 Comparison between CV and CCCV with 3C protocols in terms of the
charging time, capacity return and temperature increase, the maximum
voltage applied is 4.2V in the CV and CCCV protocols ................................. 36
Figure 14 Comparison between boostcharging and CCCV with 3C protocols in
terms of the charging time, capacity return and temperature increase, the
maximum voltage applied in the boostcharging protocol are 4.2V in (a)
and 4.3 in (b) .................................................................................................... 37
Figure 15 Analysis of the electrolyte variables during the boostcharge period ............... 38
Figure 16 Constant current charging starting at -20˚C with self-heating thermal
condition (h = 28 W/m2.K) .............................................................................. 40
Figure 17 The reaction current distribution across the cell in (a) and the
concentration profile in (b) at different times during the CC charging
with 1C starting at -20˚C ................................................................................. 42
Figure 18 The low temperature charging protocol using pulse charge and discharge
followed by the CCCV protocol. ..................................................................... 43
Figure 19 The heat generation inside the cell in (a) and the accompanied internal cell
resistances in (b), during the charge/discharge pulse followed by CCCV ...... 44
Figure 20 The effect of electrode design parameters with (3 C-rate) CCCV charging
starting at 25˚C and using self-heating thermal condition (h = 28 W/m2.K)
(a) anode porosity, (b) anode thickness, (c) electrolyte concentration and
(d) anode active material particle size ............................................................. 47
Figure 21 The effect of electrode design parameters with (1 C-rate) CCCV charging
starting at -20˚C and using self-heating thermal condition (h = 28 W/m2.K)
(a) anode porosity, (b) anode thickness, (c) electrolyte concentration and
(d) anode active material particle size ............................................................. 48
Figure 22 The effect of electrode design parameters with (3 C-rate) CCCV charging
starting at 45˚C and using self-heating thermal condition (h = 28 W/m2.K)
(a) anode porosity, (b) anode thickness, (c) electrolyte concentration and
(d) anode active material particle size ............................................................. 49
Figure 23 Transfer current distribution at the end of the CC period when charging
with CCCV with 3C-rate at 25˚C (a) the distribution at different electrode
thickness and (b) the distribution at different electrode porosities .................. 51
Figure 24 Schematic diagram showing the difference between a fresh active
material particles and consumed active material particle. Initially the

x
particle have no cracks within its body and in the latter case particle is
fractured and cracks formed due to diffusion induced stress upon cell
cycling .............................................................................................................. 57
Figure 25 Schematic diagram of the lattice spring model used in this study to
capture the fracture damage in the active material particles ............................ 61
Figure 26 A comparison between the coupled model and the experimental results of
Ning et al. [98] at different discharge C-rates ................................................. 69
Figure 27 The effect of the cycling rate (C-rate) on the SEI thickness increase with
number of cycles (a) and the percentage of the mechanical induced
capacity fade at the fractured surface (b) ......................................................... 70
Figure 28 The cell temperature during discharging at different C-rates. The initial
operating temperature is 25oC and the heat transfer coefficient is 20
W/m2.K ............................................................................................................ 74
Figure 29 The percentage of the mechanical induced lithium ion consumption at the
fractured surface at different initial operating temperature accompanied
with the physical fracture representation ......................................................... 76
Figure 30 The surface SEI layer growth as a function of cycle number at different
initial operating temperature ............................................................................ 77
Figure 31 A phase map shows the effect of the cooling condition on the capacity
fade process with particle size of 5µm. Insulated cell (h = 0) in (a) and
isothermal cell with cooling condition of (h ∞) in (b) ................................ 78
Figure 32 Comparison between capacity fade with including the fracture effect and
with no fracture considerations. The heat transfer coefficient is
20 W/m2.K and the active material particle size is 10 µm ............................... 80
Figure 33 The effect of graphite kinetics (exchange current density) on the cell
capacity fade .................................................................................................... 82
Figure 34 A degradation phase map showing the effect and dependency of capacity
loss with h = 20 W/m2.K on different design and operating parameters ......... 83
Figure 35 Comparison between experimental discharge curves of Ning et al. [64]
with model predictions at different cycles ....................................................... 84

xi
LIST OF TABLES
Page
Table 1 Design and electrochemical parameters of the base simulation .......................... 17
Table 2 The anode thickness and porosity values used in the parametric studies and
the adjusted cathode design parameters .............................................................. 45
Table 3 The coupled chemo-mechanical model design and electrochemical
parameters ........................................................................................................... 67

1
CHAPTER I
INTRODUCTION AND LITERATURE REVIEW
The shortage of the fossil fuels sources along with their detrimental effects to the
atmosphere have urged exploring for alternative energy sources. The base of today’s
dilemma manifests in the substantial dependence on fossil fuels as the main source of
energy. A remarkable energy generation, conversion and storage alternatives have been
proposed in the literature to substitute and alleviate these concerns. Li-ion battery, is an
electrochemical energy storage device that is used widely in portable applications such
as cell phones, electric tools and medical equipment due to clean and efficient energy
delivery. In addition, Li-ion batteries with their high power and energy densities are a
leading candidate for powering the new generation of the hybrid-and pure electric-
vehicle power sources. [1, 2]
Li-ion batteries are secondary type batteries that consist of an anode and cathode
on either side of a porous separator immersed in an electrolyte. The material of both
anode and cathode are specified based on the cost, safety and performance. Typically,
graphite and lithium titanate (LTO) are used as anode materials and lithium cobalt oxide
(LCO), Lithium iron phosphate (LFP), lithium manganese oxide (LMO) and lithium
nickel manganese cobalt oxide (NMC) are used for cathode. The operation of the battery
is reversible where lithium ions move from the anode to the cathode through a porous
separator during discharge and back to the anode during charging process. Li-ion battery
is rechargeable due to the reversible ions intercalation process between the electrodes.

2
In principle, the charging time of the Li-ion battery is the time needed for the Li
ions to travel from the cathode to the anode. During this process the Li ions undergo
several electrochemical resistances which originate from the charge transfer kinetics,
electrolyte conductivity, and Solid Electrolyte Interphase (SEI) and solid state diffusion.
These resistances will hinder the Li ions to travel at high rates which extends the
charging time of the cell. In addition, during fast charging the Li-ion cells are prone to a
high heat generation inside the battery causing to the risk that cell temperatures go
beyond allowable levels. The heat generation is a result of the high current densities
used for fast charging at moderate and high temperatures.[3] The lack in understanding
of the basic operation and performance of the Li-ion cells during fast charging is one of
the overriding barriers for the growth of the HEVs and EVs. Furthermore, a better
understanding of the cell internal limiting mechanisms and factors are needed at
different operating conditions which is inaccessible by experimental studies.
Meanwhile, the limited cycle life, particularly during fast charging process, is a
key performance drawback of Li-ion battery. These batteries suffer degradation that
caused its aging during operation and during storage of these batteries referred as cycle
and calendar life respectively. Different aging mechanisms have been identified in the
literature. Growth of passivated surface film layer (SEI), lithium plating, loss of cyclable
lithium ions, and side reaction upon overcharging or discharging and structural
degradation are the major sources of battery aging. [4-14] The irreversible formation of
the Solid Electrolyte Interphase (SEI) at the anode particles surface is identified
3
as an essential aging mechanism for these batteries causing capacity loss and resistance
rise.
Literature Review
Generally, fast charging is a terminology used for a technique that provide a
charge duration of less than 1 hour with a charge rate of higher than 1C. [15] The
reduction of charging time or rapid charging of these batteries has become an imperative
concern to enhance their characteristics. Several charging protocols have been proposed
to achieve shorter charging times. Notten et al. [16] proposed a boostcharging protocol
where a boostcharge period is applied to the battery followed by the conventional
Constant Current Constant Voltage CCCV charging. The boostcharging protocol
fulfilled the fast charging requirements with little degradation effects. In a different
work, Purushothaman and Landau [17] developed a macro-homogeneous lithium
diffusion model of lithium into the graphite anode for both conventional and pulse
charging. The model predicts that pulse charging could achieve about 2.5 faster than
conventional charging. However, in the model they assume that the charging of the
battery is controlled by lithium mass transport and not kinetically limited. In addition,
they did not use a fully thermal electrochemical model to describe the charging process
of the cell. Moreover, Chung et al. [18] developed a linearly descending current charging
protocol based on a simple continuous non-porous electrode model. It showed that
reduction of charging time when charging with the linearly descending current protocol
as compared to constant current charging to the same state of charge. Nevertheless,
Sikha et al. [19] showed that the decrease of charging time resulted from using this

4
protocol could be achieved only at the expense of overcharging the cell that harmfully
affects the cycle life of the battery. In the same work, the authors proposed a new the
varying decay current a charging protocol with shorter charging time. Most recently,
Anseán et al. [20] proposed a multistage fast charging technique for high power LFP
cells. Cycle-life and performance tests of the cells charged with the protocol showed
satisfactory results in terms of cycle life and power capability. Finally, Abou Hamad et
al. [21] proposed a new charging method for Li-ion batteries that could achieve a faster
charging based on molecular dynamics simulations. They showed that by applying an
additional oscillating electric field the average intercalation time of lithium ions inside
the anode is reduced which reduces the charging time. Furthermore, they concluded that
the oscillating field lowers the free-energy barrier for intercalation and increases the
diffusion rate. The rate-limiting step for the simulations is the intercalation process
rather than diffusion. However, the simulations did not include the kinetics of charge
transfer which impacts the charging process of the cell. Zhang et al. [22] studied the
charging process of a LiCoO2-based Li-ion battery using three electrode cell. The CCCV
protocol has been used to study the effect of the charging current and ambient
temperature on the potentials of the anode and cathode. They found that high current
rates and at low temperatures are favorable conditions for lithium plating and charging
time could not be improved significantly with increasing the charging current. In a
similar study, Zhang et al. [23, 24] studied the charge and discharge characteristics of Li-
ion cells using various electrochemical techniques at different temperatures. They
concluded that, the ohmic resistance dominates the cell resistance at room temperatures.

5
On the other hand, the charge transfer resistance which is related to the reaction kinetics
within the cell dominates the cell at low temperatures and it is strongly dependent on the
operating temperature. The charging process at low temperatures has been a subject for
study in the literature. Fan and Tan [25] studied the charging process of Li-ion cells at
low temperatures with both conventional and pulse charging. They concluded that
lithium solid diffusion inside the graphite is the rate-limiting factor in charging at low
temperatures. In addition, the lithium diffusion in the graphite has been found to be the
rate limiting step in low temperatures charging of Li-ion cells by Huang et al. [26] .
However, Zhang et al. [27] have studied the charging process of Li- ion battery at low
temperatures and concluded that the charge transfer resistance to be rate limiting step. In
contrast, the solid electrolyte interface (SEI) has been suggested to be the rate limiting
step in the charge capability at low temperatures by Smart et al. [28]
Also, the cell structure is suggested to be a crucial factor for charging rate
according to many studies. [29] In particular, Park et al. [30] studied the effect of
different design parameters on the charging time of the cell. Among the studied
parameters it was found that thinner cathode thickness would considerably reduce the
charging time of the cell. Likewise, Tachibana et al. [29] investigated the effect of the
passivation film on the aluminum current collector by focusing on the contact resistance
at current collector cathode composite interface. The study demonstrated that reducing
the contact resistance between the active material matrix and current collector
accomplishes a high charging/discharging rate and capacity. Different studies have
focused on the type of the active material for both electrodes and studied their effects on

6
the charging time. [31-33] Shi [34], investigated the rapid charge capabilities of two
different anode materials graphite and coke. The study concludes that the charge rate
capability of coke is higher than graphite. However, compared to cock, graphite have a
higher reversible and flatter lithium insertion voltage profile which makes it preferable
for constructing Li-ion batteries. So far, investigations of fast charging issue are limited
despite its significance intended for EV applications. In addition, these investigations
and studies have been mostly limited by experimental measurements and findings. Few
modeling studies have attempted to investigate the fast charging operation of Li-ion
batteries. The 2D pseudo electrochemical model of Li ion cells, [35] has achieved a
noteworthy success in the prediction of the Li-ion batteries performance and behavior
compared with experimental results. Subsequently, due to the fact that the
electrochemical processes inside the battery are temperature dependent a fully
electrochemical thermal model has been developed. [36-40]
Intercalation and deintercalation of Li ions inside the active particles generate
significant amount of stress which leads to fracture damage.[41-46] Formation of cracks
creates new surface area during cycling. These fresh surfaces act as catalysis for SEI
formation. At high charge or discharge rates, the diffusion induced fracture and crack
propagation exacerbate that results in a higher side reactions rates. [47, 48] Wachtler et
al. [49] discussed several possible mechanisms for irreversible capacity loss of carbon
and lithium metal based negative electrodes. One is the reduction of oxide impurities
which is primarily limited to the first cycles and other mechanism is the limited insertion
and extraction of ions causes trapping of lithium in the electrode attributable to kinetic

7
and thermodynamic reasons. On the other hand, SEI formation as a result of electrolyte
decomposition on the active material surface is an essential mechanism of capacity loss.
Furthermore, the volume changes caused by intercalation and deintercalation stimulate
diffusion induced stress that give rise to crack formation and isolation of active material,
this mechanism is cited as loss of contact by the authors. In the later mechanism, SEI
formation is vitalized for the sake of divulgence of new surface of the active material on
the electrolyte. In like manner SEI layer is prone to mechanical fracture besides the
active material crack and fracture during lithium intercalation and deintercalation. The
SEI alienation from the active material particles surface under cycling conditions
provokes binder swelling and accumulation of SEI in the electrolyte. The SEI alienation
is a possible, not investigated yet, capacity fade mechanism that is significant at
advanced cycles. Renganathan et al. [50] developed a rigorous full sandwich Li-ion cell
model with mechanical stress generation resulted from particles intercalation and
associated lattice volume change and phase transformation during the charge and
discharge. The model is used to investigate the effect of the current rates and design
parameters on the mechanical degradation of battery electrodes. They concluded that the
thickness and the porosity of electrodes have less impact on stress generation than
particles size. Garcia et al. [51] developed a coupled electrochemical and mechanical
model to study the effect of microstructure on electrode utilization, power density and
chemically induced stresses in Li-ion batteries. Their work predicts that high rates cause
a large stresses and share in mechanical failure of electrodes. They concluded that
maximize the surface area for intercalating lithium ions and controlling the transport

8
paths and particle size distribution of active material, could improve battery
performance. Zhao et al. [52] investigated the effect of material properties, particle size,
and discharge rate on electrodes fracture by adopting combined diffusion kinetics and
fracture mechanics framework. They introduced a strategy for fracture prevention by
predicting the critical charging rate and particle size through the calculation of stress and
energy release rates in the electrodes of Li-ion batteries.
Mathematical models have been investigated intensively for cycle life predictions
due to their effectiveness in terms of accuracy and results output times compared to
experimental techniques. [53-62] Ramadass et al. [63] adopted a semi-empirical
approach to develop a capacity fade model for Li-ion cells. The solvent reduction
reaction during charging process is adopted as a main source of capacity loss. Ning et al.
[64] developed a first principle cycle life model based on lithium ion loss in the parasitic
reaction and film resistance rise. Safari et al. [65] developed a multimodal, physics-
based aging model to study the calendar and cycle life of Li-ion batteries. In the model,
capacity fade is originated from the growth of a SEI layer that is formed by solvent
decomposition. The authors pointed out that a physics-based capacity-fade coupled with
fracture mechanics model is required battery life predictions. Sankarasubramanian and
Krishnamurthy [66] have developed a one dimensional capacity fade model for Li-ion
batteries. They included the solvent diffusion and kinetics of solid electrolyte interphase
(SEI) formation in the model. However, the model neglects the effect of electrode
fracture and volume changes. Wang et al. [67] carried out cycle life capacity fade study
for LiFePO4 battery. They concluded that time and temperature are the most dominant

9
factors affecting the capacity fade at low C-rates while the charge/discharge rate effects
became major at high C-rates. Pinson and Bazant [68] have developed a single particle
model for capacity fade prediction. The model has showed accurate fit with experimental
based on assumption that the SEI formation is the main degradation mechanism. In
addition, they extended the model to porous electrodes and showed that even at high
rates a homogeneous SEI formation occurs within the electrode. Deshpande et al. [47]
studied the capacity fade of graphite-LiFePO4cells by a coupled mechanical-chemical
degradation model. The Paris’ Law formulation of mechanical fatigue has been
employed to predict the crack formation on the electrodes. They found that the gradual
growth of the existing SEI thickness and the SEI formed on the crack surface to be the
irreversible capacity loss. Narayanrao et al. [69] developed a phenomenological
degradation model of Li-ion cells. In the model, the fracture, SEI formation and Isolation
are described in phenomenological expressions and are coupled with the pseudo-two
dimensional model.
The effect of temperature on the capacity fade of Li-ion battery has also been
studied by experiments and mathematical models.[70, 71] Ramadass et al. [72, 73]
conducted a capacity fade study for Li-ion batteries at high temperatures. Cells cycled at
high temperatures exhibit a higher capacity fade and resistance increase than cycled at
room temperatures due to the intensive and repeated film formation at the negative
electrodes. Prada et al. [74] studied the capacity and power fade for both calendar and
cyclic life of LiFePO4-graphite Li-ion battery. They developed an electrochemical and
thermal model that incorporate contributions of the porosity change at the negative

10
electrode, SEI film resistance and the electrolyte mass transport resistance. The study
revealed that cracking and fracture for cycling operating conditions accelerates the aging
process. Xie et al. [75] analyzed the capacity fade of the Li-ion battery under different
operating conditions; temperatures, current intensity and cooling conditions using the
pseudo 2D mathematical model with side reactions elementary kinetics. They showed
that SEI layer growth is greatly affected by the operating temperature and the capacity
fade is efficiently reduced by controlling the cooling conditions on the cell surface.
Moreover, according to the authors the results of different charging-discharging rates
substantiate that high charge\discharge manifests the highest capacity fade. Ecker et al.
[76] carried out a comprehensive calendar and cycle life study of high energy Li-ion
battery with; carbon and NCM negative and positive electrodes respectively. The results
showed that calendar aging exhibit a linear dependency with time. Conversely, cycle life
analysis demonstrated an unforeseen drop in the cell capacity at a certain point in the
lifetime. In addition, faster aging and degradation is observed in the cycle life compared
to calendar due to mechanical stresses.
Summary
The proposed work delineates Li-ion cell performance during fast charging
operation by a coupled electrochemical-thermal model with full consideration of
temperature and concentration dependent transport and kinetic properties that is highly
coupled in fast charging process. The basic behavior and operation of the fast charging
of Li-ion cells at subzero and room temperatures are investigated. The limiting
mechanisms and factors of the conventional charging protocol are identified in terms of

11
specific cell resistance resulted from each internal cell individual component. A detailed
study of the charging time, efficiency and thermal effects of fast charging protocols
proposed in literature are conducted. Finally, the effects of different design factors;
electrode thickness, electrode porosity, particle size and electrolyte concentration on the
charging time and efficiency have been studied.
Additionally, the study is extended to investigate the influence of the combined
chemical and mechanical degradation mechanisms on the cycle life of Li-ion battery by
a coupled electrochemical-mechanical model. The computational method comprises of a
first principle capacity fade model for chemical degradation predictions and a
stochastic diffusion induced fracture for mechanical damage predictions incorporated
in a lumped thermal single particle model. The coupled model is envisioned to present a
fundamental elucidation of the high degradation and poor performance during fast
charging and discharging rates.

12
CHAPTER II
RAPID CHARGING PERFORMANCE ANALYSIS
Investigations of fast charging are limited despite its significance intended for
EV applications. In addition, these investigations and studies have been mostly limited
by experimental measurements and findings. Few modeling studies have attempted to
investigate the fast charging operation of Li-ion batteries. The 2D pseudo
electrochemical model of Li ion cells, has achieved a noteworthy success in the
prediction of the Li-ion batteries performance and behavior compared with experimental
results. [35] Subsequently, due to the fact that the electrochemical processes inside the
battery are temperature dependent a fully electrochemical thermal model has been
developed. [36-39] The lack in understanding of the basic operation and performance of
the Li-ion cells during fast charging is one of the overriding barriers for the growth of
the HEVs and EVs. Furthermore, a better understanding of the cell internal limiting
mechanisms and factors are needed at different operating conditions which is
inaccessible by experimental studies. In the present paper, using the electrochemical
thermal coupled model for Li-ion cell the basic behavior and operation of the fast
charging of Li-ion cells at subzero, moderate and high temperatures are investigated.
The limiting mechanisms and factors of the conventional charging protocol are identified
in terms of voltage losses and cooling conditions. A detailed study of the charging time,
efficiency and thermal effects of fast charging protocols from literature are conducted.
Finally, optimization of the battery design parameters has been performed using the

13
conventional charging protocol at different operating temperatures. The concept of the
transfer reaction current has been utilized to elucidate the microstructural and internal
effect of the electrode design parameters.
Electrochemical-Thermal Model
In the present study, a Li-ion 18650 cylindrical cell of 2.2 Ah is used as a
physical base for the mathematical model. The cell consists of a graphite anode on a
copper current collector, and LiNi1/3Mn1/3Co1/3O2 (NCM) cathode, on a carbon-coated
aluminum current collector. The cell is filled with 1.2 M LiPF6 in Propylene Carbonate-
Ethylene Carbonate-Dimethyl Carbonate PC-EC-DMC (27-10-63 vol. %) electrolyte.
The present work employ the electrochemical thermal (ECT) coupled model originally
developed by Gu and C. Y. Wang. [37] The governing equations include the
electrochemical kinetics; charge conservation in both Solid and Electrolyte phases,
Electrolyte-phase Li ion, Active material Li ions species conservation and energy
balance equations. In the solid phase the electronic charge balance can be expressed as in
Eq. 1 where the specific surface area and the effective electronic conductivity of the
solid phase is given in Eq. 2:
, , , . ( )eff
s i s s i loc ia j [1]
,
, , , ,
,
3;
s i eff
s i s i s i s i
Particle i
aR
[2]
In the solution phase the governing equation for electronic charge balance
expressed in Eq. 3:
, . ( ln )eff eff
e e D e s i locc a j [3]

14
The effective ionic conductivity in the solution and the effective diffusional ionic
conductivity is given in Eq. 4 and 5 respectively. [77]
24
5
4
5 10 2
5 2 8 2
10.5 6.68 10
4.94 10 0.04710
1.78 10 8.86 10
6.96 10 2.8 10
e
eeff
e e i
e e
e
c
c Tc
c T c T
T c T
[4]
2 ln
1 1ln
effeff eD
e
RT d ft
F d c
[5]
The material balance of lithium ions in the intercalation particle of the solid
phase is described by Fick’s law as expressed in Eq. 6. The boundary condition of Eq.
6, is given in Eq. 7 at the particle surface and zero diffusion flux boundary condition at
the center of the particle.
2
,2
1s ss i
c cD r
t r r r
[6]
, ,
,
i
s i loc i
s i
r R
c jD
r F
[7]
The material balance of the electrolyte salt in the solution phase is expressed in
Eq. 8.
, ,
, . (1 )s i loc ieffe
e i e e
a jcD c t
t F
[8]
The insertion and deintercalation reaction rates (charge transfer kinetics) follow
the Butler-Volmer equation given in Eq. 9.
, ,
, 0, exp expa i i c i i
loc i i
F Fj j
RT RT
[9]

15
where the kinetic overpotential (η𝑖) of each electrode is given in Eq.10:
, , , ,i s i e i ref i loc i fU j R [10]
In Eq.9, the exchange current density is given as,
0, ,max , ,( ) ( )a a c
i i e s s i s ij k T c c c c
[11]
The open circuit potential of the graphite anode and the NCM cathode are
obtained from experimental measurements and the resulting empirical formulas are
given in Eq. 12 and 13 simultaneously. [78, 79]
61.79
665.8 39.42 41.92
0.1493 0.8493
0.3824( ) (0 1)
0.03131arctan 25.59 4.099
0.009434arctan 32.49 15.74
x
x x
n
e
e eU x x
x
x
[12]
4 3
2
10.72 23.88( ) (0.3 1)
16.77 2.595 4.563p
y yU y y
y y
[13]
The energy conservation in the cell is based on the thermal lumped model and is
formulated as given in Eq. 14.
cell p ohm rxn act conv cell amb
Tm C q q q h A T T
t
[14]
where the first three terms on the right hand side of Eq.14 are the heat generation inside
the cell which can be expressed as given in Eq. 15.

16
2 2
,
, ,
, ,
ln .eff eff eff
ohm s i s e e D e e
irxn s i loc i
act s i loc i s e i
q c
dUq a j T
dT
q a j U
[15]
In the model, Arrhenius dependence is used to update all the parameters that
depend on temperature as given by Eq. 16 where P represents any temperature
dependent parameter used in the present model:
,
0,
1 1exp
a i
i i
ref
EP P
R T T
[16]
The present coupled electrochemical-thermal model is solved using AutoLion
commercial software for analysis of automotive Li-ion batteries. The accurate
predictions made by the present ECT model are attributed to the inclusive material
database over a wide range of conditions (temperatures and concentrations) utilized to
build AutoLion. [80] The baseline design parameters and electrochemical parameters
used for the present model are given in Table 1. Figure.1 shows a comparison between
the modeling results predicted by the present model and experimental results at 0.7C. In
the present study, the experimentally validated model is used to explore the operation
and performance of Li-ion battery fast charging.

17
Table 1 Design and electrochemical parameters of the base simulation Design Parameters Anode Separator Cathode
Thickness (µm) 81 20 78
Porosity 0.26 0.46 0.28
Loading (mAh/cm2) 4.5 3.9
Electrolyte concentration (mol/L) 1.2
Particle radius (µm) 10 5
Exchange current density i0 (A/m2) 12[39] (x = 0.5) 2[81] (y = 0.5)
Activation energy of i0 (kJ/mol) 68[82] 50[82]
Charge transfer coefficient αa, αc 0.5, 0.5 0.5, 0.5
Film resistance R f (Ω/cm2) 10[81] 10[81]
Activation energy of R f (kJ/mol) 50[81] 50[81]
Solid state diffusivity Ds (m2/s) 1.6 × 10⁻¹⁴ (1.5 −
x)1.5 [36]
1.0 × 10⁻¹⁰
[36],[83]
Activation energy of Ds (kJ/mol) 30 [84] 30[81]
Contact resistance (Ω.cm2) 6[81]
Heat Transfer coefficient (W/m2 K) 28.4[81]
Figure 1 Comparison between modeling and experimental results (Ji et al. [81])
with charging at different C-rates at 25oC

18
Fast Charging Performance and Limiting Mechanisms
During the cell charging operation, lithium ions diffuse and migrate from the
cathode of the cell to the anode through the separator and intercalate to the active
material particles by the surface electrochemical reaction. The main transfer processes
that take place in the cell are; diffusion, migration and surface diffusion flux at the active
material particles by the electrochemical reaction. The accompanied voltage losses of
these processes are the ionic resistance and concentration polarization in electrolyte, and
kinetic resistance at the anode surface. In fast charging operation, our concern is the time
constant for each individual process. The limiting charging mechanism process is
considered to have the highest time constant which is equivalent to the process with the
highest internal resistance. Moreover, the internal cell resistances are highly dependent
on the ambient temperature, which suggests different charging behaviors.
The cell performances during fast charging are investigated for the thermal
effects and the charging current. The CC-CV charging protocol is employed in the base
case simulation. The operating temperatures of 25, -20, and 45, are chosen to
present the moderate, subzero and high temperature respectively. A comparison between
the isothermal, adiabatic and the convective heat transfer condition is outlined to analyze
the thermal influence on the cell resistance. The conditions for the base case for fast
charging at room temperatures are chosen to be 3C-rate and 4.2V in the CV period with
a cut-off current of 0.05C-rate. [30, 85] However, for subzero temperatures the cell is
charged to 4.2V with 1C rate with a cut-off current 0.05 C-rate consistent with Zhao et

19
al. [86] Figure 2 shows the performance chart over a wide range of charging and
discharging rates.
Figure 2 The charging time and columbic efficiency as a function of charge /
discharge at operating temperatures of: 25oC (a, b) 45oC (c, d) and -20oC (e, f)
In the case of room temperatures the cell is charged with 1C to 4C rates followed
by galvanostatic discharge at the same rates. For the subzero temperature however, the
cell is charged with 0.2C to 1C rates and discharged galvanostatically. Higher charging
and discharges C-rates should be avoided at low temperatures, because of the high IR

20
polarization which brings the cell to CV period rapidly. For moderate and high
temperatures the increase in the charging rates achieves a reduction of the charging time.
However, it should be noticed that increasing the charging rate in the CC period beyond
3C does not reduce the charging time significantly for the studied thermal conditions. At
high charging rates, the CV period is extended which does not decrease the charging
time significantly according to Zhao et al. [86] Therefore, the charging condition of 3C
is a good choice for fast changing. Further, the reduction in the charging time is attained
at the expense of the columbic efficiency. On the other hand, the charts demonstrate the
sensitivity and discrepancy in the performance of the cell at different thermal conditions.
A higher deterioration in the cell performance is noticed in the isothermal conditions in
terms of the charging time and efficiency compared to other thermal conditions. It is
clear that the adiabatic conditions at all temperatures outperform the self-heating and
Isothermal conditions.
To understand the cell behavior with different thermal condition further,
examination is conducted. The cell resistance at different thermal conditions are
identified and compared with the base case thermal condition. Figures 3, 4 and 5 display
the cell resistance as a function of charging time for 25oC, -20oC and 45oC respectively.
Firstly, for the base condition the electrolyte resistance is dominants resistance and
increases during the charging process. The anode lower porosity with the larger
thickness makes its electrolyte resistance higher compared to the cathode side.

21
Figure 3 Cell resistances at an operating temperature of 25˚C; at (a) self-heating [h
= 28 W/m2.K], (b) adiabatic and (c) isothermal
Figure 6 shows the electrolyte concentration and potential at the end of the CC
charging period. The electrolyte concentration at the cathode current collector reaches
about 1.5 times the initial concentration at the end of the CC period which suggests high
electrolyte conductivity. However, the large ohmic potential drop control the CC period.
22
For the CV period, the electrolyte resistance keeps increasing with charging as shown in
Figure 3. Combined with the electrolyte resistance increase, the particle diffusion
resistance becomes more significant. In the CV period, the charging current decreases
through the charging process. During this period the driving force that determines the
current flow into the battery is the difference between the applied voltage (Vmax) and the
thermodynamic equilibrium potential (Eeq) of the cell.
Figure 4 Cell resistances at an operating temperature of -20˚C; at (a) self-heating [h
= 28 W/m2.K], (b) adiabatic and (c) isothermal

23
Figure 5 Cell resistances at an operating temperature of 45˚C; at (a) self-heating [h
= 28 W/m2.K], (b) adiabatic and (c) isothermal
This driving force; is equivalent to the sum of the overvoltage inside the cell,
which originates from different sources as mentioned previously. The charging current
decreases due to the increase in the voltage difference with SOC increase during the
charging process. Physically, during the CV period the charging current carries all the

24
lithium ions from the electrolyte and inserts it into the anode. Consequently, the
concentration of the lithium ion in the electrolyte decreases and approaches zero.
Therefore, the diffusion overvoltage in the electrolyte due to the concentration gradient
in the electrolyte increases strongly and ends the charging process.
Figure 6 The electrolyte concentration and potential across the cell at the end of the
CC period during fast charging with 3C at 25˚C and self-heating thermal condition
Figure 7 demonstrate the cell resistance during slow charging at 0.5C. In
comparison between fast and slow charging, it is observed that the anode particle
resistance has two peaks related to the OCP of graphite that infers a uniform utilization
of graphite particles at slow charging. In addition, the electrolyte resistance shows a
more uniform resistance as seen by the constant behavior during charging in the CC
period. The lower porosity combined with the higher thickness of the electrode is
reflected by the higher electrolyte resistance at the anode side. In the CV period, the
anode electrolyte resistance increases and dominates the cell resistance and terminates

25
the charging process. The portion of the CV period in the slow charging is lower
compared to fast charging due to the high increase in the electrolyte resistance.
Furthermore, the charging process at room temperature is strongly affected by
the thermal condition of the cell as shown in Figure 3. The adiabatic condition
outperforms the self-heating and Isothermal conditions in terms of cell internal
resistance.
Figure 7 The cell resistance during slow charging at 25˚C and self-heating (h = 28
W/m2.K) thermal condition
In the adiabatic conditions the heat generated inside the battery during charging
is utilized to increase the temperature of the cell. The electrolyte resistance dominates
the cell resistance as observed for all the thermal conditions at room temperature.
Moreover, the temperature rise, results in a decrease in the charge transfer kinetic and
solid particle resistances; resulting in faster kinetics and enhanced solid state diffusion.
While the performance of the cell is improved, the temperature rise on the other hand
may exceed the safety level of the cell and could produce an inhomogeneous

26
temperature distribution inside the cell. To sum up, the charging time is affected by the
thermal conditions of the charging operation. The adiabatic condition demonstrates the
ultimate cell behavior and shortest charging time; however, the safety of the cell may
suffer due to the high temperature rise. In regard with charging time and cell safety, the
self-heating condition exhibit the best option in which the safety and charging time falls
in an acceptable range as opposed to the isothermal conditions where the safety of the
cell is maintained with longer charging times. Likewise, from the previous analysis it is
inferred that, the termination of the charging, capacity return and charge efficiency at all
the cooling condition are controlled by the electrolyte resistance that take over the cell
resistances, followed by the particle resistance.
As shown in Figure 2d for subzero temperatures, a lower range of C-rates are
employed due to the high internal resistances that cause shutdown of charging when
charging at high rates. In contrast with the room temperature, a steeper reduction in the
columbic efficiency is observed at low temperatures. In the discharge process at subzero
temperatures, the capacity loss of the cell at subzero temperatures upon discharge is
attributed to the electrolyte resistance increase at the isothermal condition and the solid
state diffusion limitations at the adiabatic and convection heat transfer conditions. [81]
For the isothermal operation discharge the substantially high electrolyte resistance that
leads to cell shutdown preventing further discharge. However, as shown in Figure 2 a
smother decrease in the cell efficiency at adiabatic and convective heat transfer
conditions is observed. The enhanced behavior is mainly due to the temperature rise
which enhances the ionic conductivity and salt diffusivity that reduce the electrolyte
27
resistance during the discharge process and the solid state diffusion which limits the
discharge process. [81] With regard to the charging time at subzero temperatures, a high
difference in the performance results is observed at each thermal condition as shown in
Figure 2c. The adiabatic condition manifests a considerable charging time reduction
compared to other thermal conditions. The variation in the charging time and
performance of the cell at different thermal effects are examined based on the cell
internal resistances at 1C charging rate and shown in Figure 4. The cell resistance in the
case of isothermal is highest. The anode charge transfer kinetic resistance dominates the
cell resistances with the progress of charging and is the rate limiting step for charging at
subzero temperatures. The predicted results obtained by the present model that charge
transfer resistance is the rate limiting step of low temperature charging which coincide
with experimental observations. [27] Also, the electrolyte resistance follows the anode
kinetics resistance. The effect of the electrolyte resistance on the short CC period is
understood by the sharp concentration gradient occurring at the cathode side that
produces a high concentration polarization in the electrolyte causing concentration build-
up. The combined effect of slow kinetics at low temperature and the high concentration
polarization brings the cell to the upper voltage rapidly, that diminishes the CC period
and extends the CV period significantly. Results of charging adiabatically are shown in
Figure 8. The successful performance of the cell is attributed to the drop of cell
resistance.

28
Figure 8 The adiabatic charging performance curve and temperature increase
starting from -20˚C
Figure 4c shows the decrease of cell resistances in the case of adiabatic charging.
The charge transfer kinetics decreases with charging due to the rise in cell temperature.
Moreover, the temperature rise causes the transition of the charge transfer kinetic from
the linear to the Tafel region. In the Tafel kinetic, a lower kinetic resistance is achieved
due to the exponential increase of reaction current with overpotential, in contrast to the
linear region. The temperature increase successfully suppresses the charge transfer
kinetics of the cell which dominates the cell resistances in the isothermal and self-
heating conditions. Beside the decrease of the charge transfer kinetics, cell electrolyte
and solid diffusion resistances sources are decreasing; the highest decrease exhibit in the
charge transfer kinetics due to their high activation energies. [82] A uniform active
material utilization is predicted based on the solid phase diffusion resistance curve which
reveals two fluctuations. These fluctuations propose that the electrode is near its
29
equilibrium state and minimum resistances. The electrolyte resistance shows two
different trends during the charging process. Initially, a sharp increase in the electrolyte
resistance at the anode and cathode takes place. Afterwards, the resistance reaches a
peak in which it starts to diminish until the end of charge process. Conversely, a steep
rise in the anode electrolyte resistance occurs at charge termination which ends the
charging process as observed at room temperature charging. The peak in electrolyte
resistance is responsible for the wide U-shape curve in the adiabatic conditions in Figure
8. Physically, at the initial adiabatic charging stage the temperature increases rapidly
simultaneously the electrolyte concentration accumulation arises due to the high current
flow. The temperature increase attempts to increase the ionic conductivity of the
electrolyte. Contrariwise, the concentration build-up will result in an increase in the
charge carrier’s accumulation in the cell hence, the charge carriers will tend to interact
with each other rather than carrying the lithium ion between the electrodes. Therefore,
the ionic conductivity decreases and an increase in the electrolyte resistance come about.
Subsequently, the temperature rise and the concentration build-up dissipation will result
in the increase in the cell performance that is indicated by the minimum value on the
charging profile and successive increase in the voltage. Finally, the increase in the cell
temperature switches the rate limiting step from the kinetics to the electrolyte which
controls the charging at high and moderate temperatures. The behavior of charging at
high temperature (45oC) is similar to that observed with charging at 45oC. However, the
charging time is lower compared to 25oC due to the enhanced electrolyte and solid phase
parameters that decrease the cell internal resistances.

30
Charging Protocols
Charging Protocols Investigation at Moderate Temperatures
The charging protocols have greatly investigated in the literature for fast
charging applications. Most of the previous studies have focused on finding protocols at
moderate charging temperatures. However, only some studies have applied or proposed
the same concept for subzero and high temperatures. Moreover, there is lacking in
understanding the discrepancy of the physical behavior of the cell when different
charging protocol is exploited. Hence, it is worthy to explore the cell behavior and
performance under different charging methodologies. Among the studied charging
protocols in the literature Constant Current (CC) and Constant Power (CP) protocols are
considered the simplest to execute from a practical standpoint. [40] Figure 9 displays the
charging time and charging efficiency with different charging rates (C-rates) of CC
charging. Clearly, the increase of the charging rates accomplishes a reduction of the
charging time of the cell. In contrast, the reduction of charge duration is achieved at the
expense of the charge efficiency which decreases with the charging rate. Typically, the
CC protocol is followed by a CV charging where lower charging rates is imposed to
overcome the loss of the charge efficiency which extend the charging time due to the
high resistances as discussed previously.
Figure 10 shows the local utilization of the active material across the cell which
is introduced with 3C-rate charging at 25oC. The figure illustrates the material utilization
during charging process and it is observed that the anode is mainly utilized in the region

31
next to the separator. The high utilization near the separator is ascribed to the overriding
electrolyte overvoltage that prevail the cell resistance during charging.
Figure 9 The constant current protocol charging time and charging efficiency with
different applied charging currents starting at 25oC
Also, at the interface of the anode/electrolyte the lithium saturates by reaching
the maximum concentration value as observed from the figure that causes the cutoff of
the charging process in a short time after the commence of charging. The high
electrolyte resistance inside the cell will lead to a higher utilization near the separator
causing an earlier lithium saturation and bringing the charging process to an end.
Accordingly, a key factor that controls the charging performance and achieves fast
charging with a slight impact on the charge efficiency is a crucial need for charging
protocols to compete with the CC protocol. A successful protocol would bring the
lithium concentration to a high level without reaching the saturation limit. [16, 17]

32
Figure 10 The local utilization of the active material across the cell for CC charging
at 3C-rate starting at 25˚C
The varying current pulse charging mode had been proposed by Purushothaman
and Landau. [17] It consists of constant width charging and rest pulses and the applied
current density is decreasing with charging progress. The simulation results of the pulse
charging protocol with an average of 2C rate charging with convective heat conditions
are shown in Figure 11a. The temperature rise is about 10oC in the pulse charging
protocol due to the high charging rates at the foremost stages of charging. In varying
current pulse charging mode, the charging rates are initially high and decrease with the
progression of charging which facilitate to circumvent the internal behavior of the cell
during the charging process. Hence, the concentration build-up are mitigated in the case
of pulse charging due to the declining charging rates and the imposed rest periods that
interfere the charging process. In fact, the effectiveness of the pulse charging mode is
based on the concept of increasing the surface concentration of the lithium at initial

33
stages near the saturation value then maintaining the concentration values close to the
saturation. This is achieved by exciting the cell via the high charging rates at the
beginning that brings the cell voltages near the maximum voltage, then stabilizing the
cell which is manifested by the decreasing charging rates which sustain the cell voltage
level. Figure 12 illustrates the interface State of Charge iSOC (concentration of lithium
on solid particle interface over is the maximum concentration of lithium) at the
anode/separator interface during the pulse charging.
Figure 11 Pulse charging with duty cycle of 75% and an average applied current of
2C in terms of the charging time, capacity return and temperature increase in (a)
and the pulse charging is followed by CV charge in (b)

34
Figure 12 The effect of the pulse charging on the lithium ion concentration at the
anode/separator (iSOC)
It is evident that primarily, the concentration of the lithium increases rapidly in
which induced by the high ohmic drop and concentration overpotential in the electrolyte.
At this stage, the anode is mostly utilized in the vicinity of the separator and non-
uniform active material utilization inside the anode. In later stages of pulse charging, the
reduction of the charging current and the rest pulses avoid the lithium concentration to
transcend the saturation which maintains the maximum driving force for lithium
intercalation. Although pulse charging grants fast charging of the cell, the charge
efficiency is lower compared to the conventional charging, providing a full charging
efficiency with a longer time. To increase the charge efficiency of the pulse charge it is
followed by a CV charging as shown in Figure 11b. The CV period leads to a higher
degree of lithium intercalation to the anode from the electrolyte. The intercalated lithium
ions will increase the average lithium concentration of lithium inside the anode resulting
in a higher charging efficiency. From the previous results, a high effectiveness of the

35
varying pulse charging is attained with respect to fast charging and charging efficiency
suggesting a successful charging protocol.
Along with pulse charging protocol, a variety of innovative charging protocols
have been proposed to fulfill charging time reduction along with high charging
efficiency. The basic principle of these protocols is to bring the cell voltages to the upper
maximum voltage by applying high charging rates at the beginning of charging. The
most attractive protocols respecting the charging time and efficiency are the Constant
Voltage (CV) charging. A comparison between the CV with conventional protocols
simulation results of charging time, efficiency and temperature increase inside the
battery are shown in Figure 13. It can be seen that the CV charging exceeds the
conventional charging and achieves a high charging time reduction. At the beginning of
the CV charging, the applied charging rates are exceptionally high due to the low
internal resistances inside the cell. With the progression of the charging process, the
increase of the internal resistances causes the charging current to decrease rapidly to
maintain a constant voltage operation. Despite the significant time reduction
accomplished by the CV protocol, it is infrequently used due to the need of high power
supplies to provide the high charging current at the onset of charging. Moreover, the
high temperature inside the battery that resulted from the high current may cause
temperature gradients inside the cell causing its degradation. For that reason, an
innovative boostcharging protocol has been proposed by Notton et al. [16]. In this
protocol, a boostcharge period is applied before the application of the conventional
charging, that is a constant current imposed to bring the cell to its maximum voltage

36
where it is maintained for a predominated time. Figure 14 illustrates the simulation
results of the boostcharging protocol with Imax of 5C and Vmax of 4.2 V in (a) and 4.3 V
in (b) with an arbitrary chosen boostcharge period of 7 min followed by conventional
charging with 1C and 1/20C cut-off current.
Figure 13 Comparison between CV and CCCV with 3C protocols in terms of the
charging time, capacity return and temperature increase, the maximum voltage
applied is 4.2V in the CV and CCCV protocols
Outstanding results of the boostcharging protocol are found; which achieve
approximately 85% capacity returns in the first 10 min, of charging and complete
charging with times less than 40 min. The felicitous performance of boostcharging is
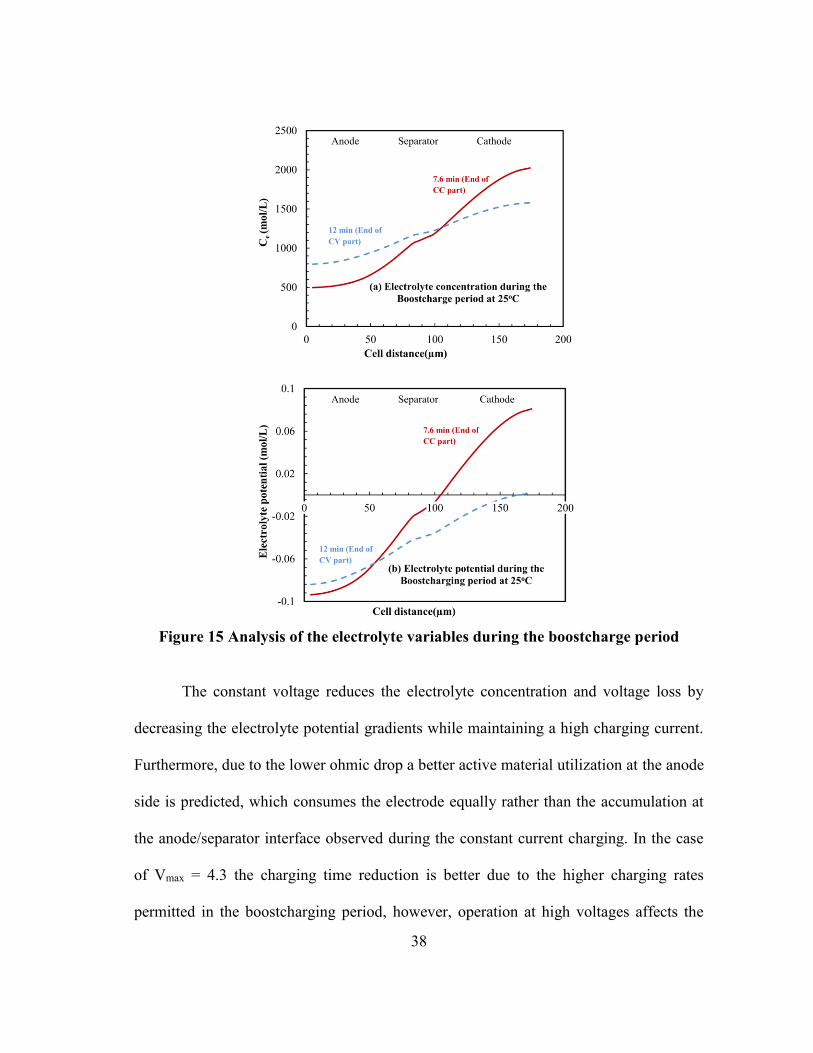
manifested in improved internal cell behavior. Figure 15 demonstrates that during the
first constant current stage, a high concentration gradient occurs inside the cell
accompanied by voltage loss due to the increase of the electrolyte potential gradients
across the cell.

37
Figure 14 Comparison between boostcharging and CCCV with 3C protocols in
terms of the charging time, capacity return and temperature increase, the
maximum voltage applied in the boostcharging protocol are 4.2V in (a) and 4.3 in
(b)
The figure reveals the distribution of the electrolyte variables across the cell
during the boostcharge period at the end of the constant current and constant voltage
parts. The high electrolyte gradients cause the deviation of the ionic conductivity and
diffusivity from the ideal values and early lithium saturation which promote the shift to
the constant voltage charging. The constant voltage charging during the boostcharging is
a key factor in the superior cell performance during this protocol.
38
Figure 15 Analysis of the electrolyte variables during the boostcharge period
The constant voltage reduces the electrolyte concentration and voltage loss by
decreasing the electrolyte potential gradients while maintaining a high charging current.
Furthermore, due to the lower ohmic drop a better active material utilization at the anode
side is predicted, which consumes the electrode equally rather than the accumulation at
the anode/separator interface observed during the constant current charging. In the case
of Vmax = 4.3 the charging time reduction is better due to the higher charging rates
permitted in the boostcharging period, however, operation at high voltages affects the

39
life of the cell. To sum up, fast charging protocol at room temperatures could be
achieved by thorough examination of the internal cell behavior. Based on the predicted
simulation results, a fundamental aspect of the fast charging protocol is achieved by
applying high charging rates that brings the cell voltage to the upper value in a short
time and sustains high charging rates during this stage. One strategy is to apply the pulse
charging mode that bring and retain the lithium surface concentration to a high level near
the saturation value. Also, applying a constant voltage charging at the initial stages of
charge as in the boostcharging protocol, is beneficial for the charging time reduction.
The CV charging contributes in eliminating the high concentration and potential
gradients in the electrolyte which dominates the cell resistance during moderate and high
temperature operation. Thus, manipulating the charging rates within the charging
process provides a positive feedback on the intrinsic cell behavior that is experimentally
hard or impossible to achieve. On the other hand, the electrochemical thermal model
provides a confident response on the thermal behavior and temperature distribution
inside the cell. The temperature rise during fast charging is a critical characteristic and
could not be abandoned in contrast to the isothermal model which provides misleading
results.
Charging Protocols Investigation at Low Temperature
The cell resistance during low temperature operation is significantly higher than
the room temperature operation. The applied fast charging protocols at room temperature
might not be appropriate for low temperature charging due to the difference in the
internal nature of the cell. Similarly, the charging currents rates employed in the case of

40
low temperature operation should be smaller. [25] In the present paper, the charging
rates utilized are ranged from 0.2C to 1C for the simulations of constant current charging
as shown in Figure 16. Clearly, as the charging rates increase, the charging time
subsequently decrease, however, a substantial drop in the charging efficiency.
Figure 16 Constant current charging starting at -20˚C with self-heating thermal
condition (h = 28 W/m2.K)
The poor performance of low temperature CC charging is attributed to the
sluggish kinetics and the concentration gradients in the electrolyte. Figure 17 shows the
reaction current and electrolyte concentration at different times during 1C charging at -
20oC. The low charging efficiency at 1C-rate can be explained by the low reaction rates
and the small reaction current that travels from the cathode to the anode due to the high
charge transfer resistance. Due to the low pore wall flux, a considerable concentration
gradient arises at early time of charging in the electrolyte, inducing a high electrolyte
resistance with low ionic conductivity causing cell shutdown. The CC protocol is not
adequate for low temperature charging, especially at high charging rates, which should

41
be followed by the CV charging to increase the charging efficiency that results in an
extended charging times as discussed in the previous section.
Additionally, limited charging protocols have been introduced for low
temperature applications. Recently, a new low temperature mode has been proposed by
Zhao et al. [86], which facilitate the low temperature charging by achieving lower
charging time and higher capacity compared to conventional charging. The proposed
mode is based on the concept of cell excitement; via charge and discharge pulses
followed by the conventional charging protocol. That is to say, benefiting from the
temperature increase during the discharge pulse the electrochemical properties of the cell
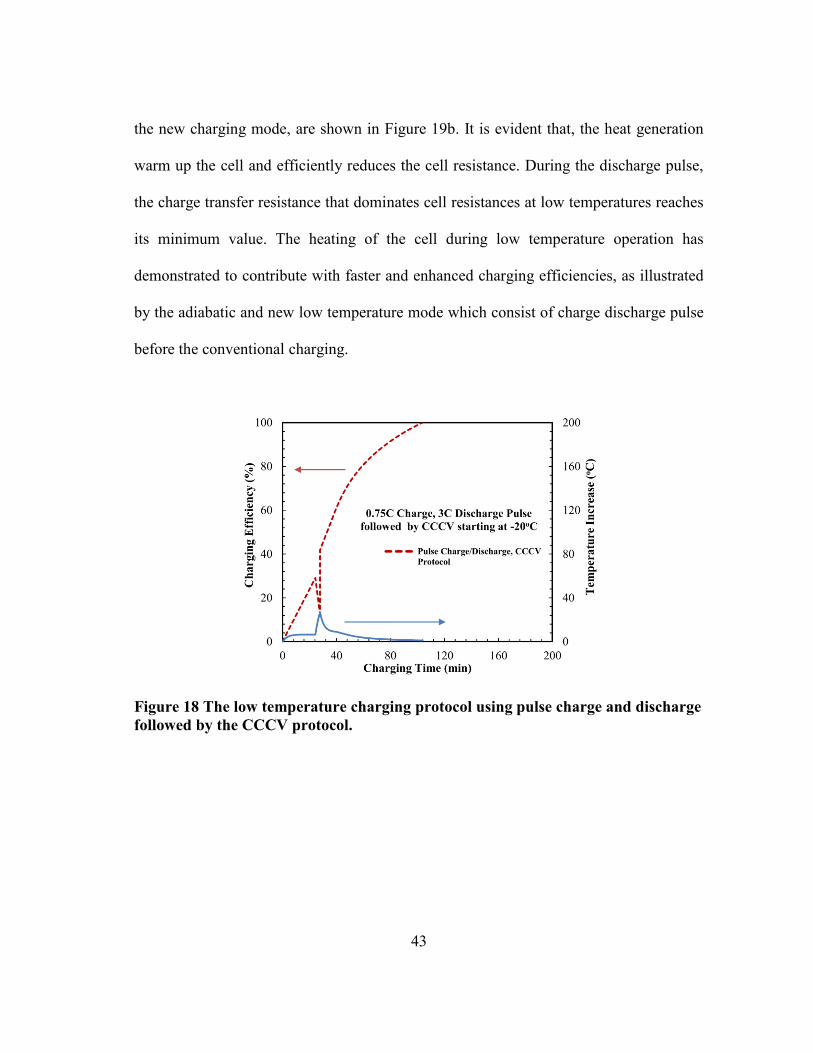
is improved enabling a higher low temperature charging performance. Figure 18 shows a
the predicted simulation results of the pulse conventional charging mode. The pulse
conventional charging mode consists of 0.75C charge pulse and 3C discharge. As can be
observed, during the charge pulse the temperature increases slightly, however, an abrupt
rise in the cell temperature follow in the discharge pulse. The increase in the cell
temperature which is about 30oC boosts the cell performance by reducing the charging
times along with complete charging efficiency.
The heat generation from the main sources with the charging progress is shown
in Figure 19a. The primary source of heat generation is the reaction heating which
significantly increases at the discharge pulse. The heat generation from the reversible
entropic source is negligible during the operation and reaches a maximum value at the
end of the discharge pulse where highest temperature gradient crop up inside the cell.

42
Figure 17 The reaction current distribution across the cell in (a) and the
concentration profile in (b) at different times during the CC charging with 1C
starting at -20˚C
It is discern that most of the generated heat is utilized to heat the cell in
consequence of the low heat convection to ambient. Therefore, the total cell resistance
the sum of the kinetic, electrolyte and solid particle resistances, which is resulted from
43
the new charging mode, are shown in Figure 19b. It is evident that, the heat generation
warm up the cell and efficiently reduces the cell resistance. During the discharge pulse,
the charge transfer resistance that dominates cell resistances at low temperatures reaches
its minimum value. The heating of the cell during low temperature operation has
demonstrated to contribute with faster and enhanced charging efficiencies, as illustrated
by the adiabatic and new low temperature mode which consist of charge discharge pulse
before the conventional charging.
Figure 18 The low temperature charging protocol using pulse charge and discharge
followed by the CCCV protocol.

44
Figure 19 The heat generation inside the cell in (a) and the accompanied internal
cell resistances in (b), during the charge/discharge pulse followed by CCCV
Electrode Design Parameters
Several studies approached the design parameters of the cell to improve its
performance on account of the significant effect on the electrochemical characteristics.
However, the majority of these studies have focused on the discharge performance. [87]
On the other hand, limited studies have addressed the performance during fast charging
and high power applications and the effect of the thermal conditions at different

45
operating temperatures. The parametric study is performed for the subzero, moderate and
high temperatures to identify the charging time and charge capacity for each design
parameter. The conventional charging protocol with maximum voltage of 4.2 V and
0.05C cut-off current are employed to conduct the parametric analysis with charging
currents of 3C for room and 1C for subzero temperature. The cell design parameters
considered in the analysis are the electrode thickness and electrode porosity, electrolyte
concentration and particle size whereas the separator thickness and porosity are held
constant at the base case parameters as shown in Table 2. The parametric studies
performed in this paper adopts the methodology of Ji et al. [81] where the study is
conducted by varying one parameter around its base case value while set the other
parameters at their base case values.
Table 2 The anode thickness and porosity values used in the parametric studies and
the adjusted cathode design parameters
Anode Thickness
(µm) Cathode Thickness (µm)
Anode Porosity Cathode Porosity
56 53 0.2 0.22
61 58 0.26 0.28
66 63 0.32 0.31
71 68 0.35 0.36
76 73 0.41 0.4
81 78 0.45 0.46
86 83 0.5 0.51
91 88
96 93
101 98
The influence of the anode thickness is studied by changing it value from 56 μm
to 101 μm while keeping a constant negative to positive ratio which is achieved by

46
adjusting the cathode thickness as given in Table 2. For the anode porosity study, the
porosity of range 0.2 to 0.5 is used to capture its influence.
The result of the parametric studies and parameters influences on the fast
charging performance are illustrated in Figure 20. It demonstrates the trade-off between
the charge capacities and the charging time at 25˚C as a result of varying the design
parameters. As observed from the results, the anode parameters effectively impact the
cell performance with respect to charging time and charge capacity. The charge capacity
of the cell is decreasing with increasing the anode porosity. The charging time, shows
the same trend with the increase of the anode porosity. The decline of the charging
performance with porosity is occasioned by the decrease of the electrode material
implied in the lower active material loading with electrodes having higher porosity.
Furthermore, the concentration polarization raise induced by the greater surface ion flux
and the lower surface area at larger porosities contribute to the drop in the charging
performance. The high concentration polarization prompts an earlier transition from the
CC period to the CV period which extends the duration of charging as discussed
previously. On the other hand, the decrease of porosity suppresses the performance of
the charging process which generates a slower charging process. The electrolyte
transport parameters particularly, the effective salt diffusion coefficient and the effective
ionic conductivity, are dependent on the porosity of the cell components. Low electrode
porosity implicates an intricate electrode microstructure because of higher tortuosity
which reduces the effective parameters of the electrolyte. In this case, the effective

47
parameters create a higher ohmic drop and concentration overpotential in the electrolyte
where the electrolyte resistances increase develops leading to a higher charging time.
Figure 20 The effect of electrode design parameters with (3 C-rate) CCCV charging
starting at 25˚C and using self-heating thermal condition (h = 28 W/m2.K) (a) anode
porosity, (b) anode thickness, (c) electrolyte concentration and (d) anode active
material particle size
The competition among the electrochemical, diffusion, migration and thermal
processes inside the cell is highly dependent on its physical parameters such as the
porosity (active material loading). Moreover, the predicted charging performance
parametric studies for anode porosity at -20˚C and 45 ˚C show generally analogous trend
as shown in Figure 21a and 22a. Nevertheless, the range of predicted charging time
values are smaller than these observed at room temperature further, these values fall in a

48
smaller range while a considerably higher range of values are noticed for the subzero
charging. The disparity at different temperatures is ascribed to the nature of the
processes and the overvoltage with the operating temperatures and the strong link
between these processes and the temperature at which charging is performed.
Figure 21 The effect of electrode design parameters with (1 C-rate) CCCV charging
starting at -20˚C and using self-heating thermal condition (h = 28 W/m2.K) (a)
anode porosity, (b) anode thickness, (c) electrolyte concentration and (d) anode
active material particle size
Apparently, at high charging temperature, availing from the room temperatures
in the cell; the effective electrolyte parameters, and the charge transfer kinetics in
addition to the solid state diffusion all show improvement in their cell performances, in
contrast to the subzero operation. The anode thickness on the other hand, reveals
comparative relation between the charging time and the charge capacity as illustrated in

49
Figure 20b. The charge capacity is superior for thicker anodes concurrently longer
charging time is sought.
Figure 22 The effect of electrode design parameters with (3 C-rate) CCCV charging
starting at 45˚C and using self-heating thermal condition (h = 28 W/m2.K) (a) anode
porosity, (b) anode thickness, (c) electrolyte concentration and (d) anode active
material particle size
The battery charging performance maintain a similar trend for both high and low
temperatures as seen in Figure 21b and 22b with different charging time values. The
observable details outcomes an optimal range of design parameters that yield in the
minimum charging time with a high charge capacity. The results of the parametric study
are compatible with theoretical simulation of charge performance predicted by an
electrochemical model. [30] Understanding how the thickness and porosity affect the

50
charge performance is recognized by studying the limiting mechanisms in the electrodes.
This is manifested in the transfer current density across the cell that relates the
electrochemical reaction and the pore wall flux as shown in Figure 23. The transfer
current density at the end of the CC charging period for different thicknesses and
porosities are shown in Figure 23a and 23b respectively. A peak subsists in the transfer
current that represents the maximum reaction rate and active material utilization. The
transfer current density next to the separator becomes poorer with time because the
active material particles in this region are almost completely charged, hence, the peak
moves to the current collector to satisfy the charge balance equation. The peak shifts
from the anode/separator interface to the end of the anode during the CC charging
period. Therefore, in order to achieve a high active material utilization, the peak of the
transfer current density should reach the anode current collector at the end of CC charge.
The transfer current density peak location has a direct relation with the cell design
parameters that influence the charging performance. [88] In the case of thin electrode
thickness, the current density and the ionic current path are smaller, therefore, the peak
penetrates deeper inside the electrode that successfully decreases the activation and
polarization overpotential. Therefore, the peak in the transfer current density reaches
nearly to or at the current collector with the end of the CC period. The underlying
transfer current penetration that shows a uniform and fast active material utilization
elucidates the improvements in battery’s charging times and performance for thin
electrodes. For thicker electrode thicknesses, the current density and the ionic current
path are higher due to the high voltage loss in the electrolyte causing high electrolyte

51
resistance and low peak penetration in the anode that prolongs the charging time of the
battery. For the electrode porosity, the charging time of the battery decreases with the
increase of the porosity. Furthermore, the high active material loading at low electrode
porosity leads to a higher charge capacity.
Figure 23 Transfer current distribution at the end of the CC period when charging
with CCCV with 3C-rate at 25˚C (a) the distribution at different electrode
thickness and (b) the distribution at different electrode porosities
In the case of higher electrode porosity, the effective electrolyte conductivity and
diffusivity are improved as observed from the enhanced peak penetration inside the
anode as shown in Figure 23b, indicating a uniform and homogeneous lithium

52
distribution in the electrode. At the microstructure level, the lithium ions transport
through a convoluted path at low porosities as opposed to high porous electrodes that
shows a localized transport reaction near the anode/separator interface and low
penetration rate. The local lithium consumption creates a high concentration build-up
near the anode/separator interface that shifts the charging to the constant voltage period.
The influence of the electrolyte concentration and the anode active material
particle sizes on the charging time and capacity are studied. The electrolyte
concentration can directly affect the electrolyte parameters that is; the conductivity and
diffusivity and the exchange current density which reflects the intrinsic charge transfer
kinetics, is also a function of the electrolyte concentration. It is seen in Figure 20c and
20d that electrolyte concentration and particle size does not affect the charge capacity of
the battery. The charging time however, shows a different trend with the increase of the
electrolyte concentration, it first shows a decrease in the charging time where it reaches a
minima then it increases with concentration. The results of the parametric study suggests
that an optimal concentration value exists within between 0.8 – 1.2 mol/L which
minimize the charging time. The range of the optimal charging performance is
occasioned by the decrease of the potential polarization due to the enhanced electrolyte
conductivity. In this concentration range, the electrolyte conductivity falls in it optimal
and the maximum values. [77] Nevertheless, the performance of charging shows a
different behavior at low temperature with different electrolyte concentration as shown
in Figure 21c. The charging time decrease slightly and then increase sharply along with
the increase of the concentration. This suggests that a high electrolyte concentration and

53
potential gradient, build-up in the battery due to low conductivity and diffusivity causing
in increase the charging time and hence lowering the charge capacity.
Finally, the effect of the anode active material particle size on the charging
performance has been studied. The particle size have little impact on the battery
charging time and charge capacity on high temperature and moderates temperature
charging as seen in Figure 20d and 22d. On the other hand, as shown in Figure 21d, the
lower particle sizes provide a boost in charging performance at low temperature
charging. Since the charge transfer reaction is the limiting step at low temperature
charging, the particle size reduction is an efficient approach to increase the battery
performance that decrease the charging time and increase the charge capacity. The
particle size increases the electroactive surface area of the electrode that will in terms
enhance the electrochemical kinetics at the electrode surface that reduces the charge
transfer resistance. The increase of the particle size could increase the anode solid phase
diffusion limitations that will add up with the charge transfer to decrease the battery’s
performance. In summary, it is found that the design parameters have a high impact on
the charging performance of the cell, by changing the nature of the voltage losses across
the cell during charging duration. In the manufacturing process, the design variables can
be fabricated, which spurs the optimization of the design parameters during the process
to afford the best possible performance for fast charging applications.

54
Summary
Investigations of cell performance and limiting mechanisms during fast charging
operation of Li-Ion cell have been conducted at subzero, moderate and high operating
temperatures. The simulations of the fast charging at different temperatures and thermal
conditions were performed by an electrochemical thermal coupled model. The
simulations commenced with a base case fast charging, in order to capture the
limitations and controlling mechanisms of fast charging at different temperatures.
Charging time and columbic efficiency is found to be highly dependent on the charging
rates and thermal conditions. At subzero temperatures, due to the charge transfer kinetics
limitations and poor electrolyte parameters, a high charging time and low columbic
efficiency is found. The electrolyte resistance dominates the charging process at high
and moderate temperatures because of the high ohmic drop and concentration
overpotential. At the adiabatic conditions, the increase of the cell temperature
suppresses the kinetics limitations and the electrolyte resistance turns out to be the
limiting factor for low temperatures, leading to a high time and efficiency improvements
compared to moderate and high temperatures.
For the charging protocols, pulse charging protocol achieves a fast charging by
increasing the surface concentration of the lithium at initial stages, using high pulses,
near the saturation value then maintaining the concentration values close to the
saturation by decreasing the pulse values. For boostcharging protocol, the applied
constant voltage at the boostcharging period reduces the electrolyte concentration and
voltage loss by decreasing the electrolyte potential gradients while maintaining a high

55
charging current that efficiently reduces the charging times with high charge efficiency.
For low charging protocols, a successful reduction of time is achieved by applying
charge and discharge pulses, before the conventional charging start. The heat generation,
as a result of these pulses could capably reduce the charge transfer resistance and
concentration polarization inside the cell leading to faster charging. The parametric
studies show that optimization of the cell design parameters improve the charging
process performance by affecting the nature of the voltage losses during charging
duration in the cell. The anode thickness and porosity shows an optimal range that lead
to rapid charging, combined with high charge capacity.

56
CHAPTER III
CYCLE LIFE ANALYSIS BY COUPLED CHEMICAL AND MECHANICAL
DEGRADATION MECHANISMS
The limited cycle life, particularly during fast charging process, is a critical
performance drawback of Li-ion battery. These batteries suffer degradation that cause
their aging during operation and storage. Although tremendous progress in using
mathematical models in predicting the cycle life, limited studies have coupled the
chemical and the mechanical aspects in cyclic life predictions. The significance of the
coupling is manifested during high charge and discharge rates, that the intense
intercalation poses high mechanical stresses to fracture the electrode. In this study, we
are investigating the influence of the combined chemical and mechanical degradation
mechanisms on the cycle life of Li-ion battery by a coupled electrochemical-mechanical-
thermal model. The computational method comprises of; a first principle capacity fade
model for chemical degradation predictions and a stochastic diffusion induced
fracture for mechanical damage predictions incorporated in a lumped thermal single
particle model. The coupled model is envisioned to present a fundamental elucidation of
the high degradation and poor performance during fast charging and discharging rates.
Mathematical Model
In Li-ion batteries, the SEI layer is formed on the active material surface of the
negative electrodes as a protecting layer. This layer is a product of electrolyte

57
decomposition reaction that is formed during the first cycle. However, the formation of
this layer is unrestricted by the first cycle, it maintains to grow subsequently. Therefore,
it creates a critical issue in the battery’s life due to the continuous cyclable lithium
consumption. Furthermore, the formation of cracks in the electrode active material due
to mechanical degradation creates additional sites for the decomposition reaction to
occur. A schematic presentation of the electrochemical and mechanical degradation
model in this study is shown in Figure 24.
Figure 24 Schematic diagram showing the difference between a fresh active
material particles and consumed active material particle. Initially the particle have
no cracks within its body and in the latter case particle is fractured and cracks
formed due to diffusion induced stress upon cell cycling
Initially, SEI formation occurs at the anode surface by solvent reduction at the
active material initial surface and continues to increase in the following cycles. Then, as
a result of diffusion induced stress of Li ions; the active material cracks which increase
the surface area of contact between anode active material and electrolyte increasing the
side reactions rates. The cracked surface continues to propagate due to cycling causing
the growth of the SEI layer on crack surface area.

58
Mukherjee et al. [89] presented a comprehensive and detailed introduction to
modeling and simulation of Li-ion battery. A chemical and mechanical coupled
degradation model that is incorporated in a physics based single particle model is
developed in the present study. In developing the present model, several assumptions
have been made to keep it simple and computationally efficient. First, the capacity fade
and lithium ions loss is attributable solely to the SEI formation on the available sites at
the anode. Furthermore, we assume a thin and homogeneous electrode which results in a
uniform SEI layer formation throughout the anode. This assumption is justified by
Pinson and Bazant [68] in which the authors showed a uniform SEI formation in the
electrode during fast charging with a thin and homogenous electrode. Based on the
previous assumption the electrolyte concentration variation inside the cell and its effect
on the SEI layer formation is negligible that rationalizes the use of single particle model
in the present study. In this study, a coupled mechanical, electrochemical-thermal single
particle based model is developed to predict the cycle life of Li-ion batteries with
different operating conditions; temperature and C-rates and design parameters; particle
size.
Mechanical Degradation Model for Electrode Fracture
The intercalation deintercalation reaction is the main reaction that occurs in the
anode of the Li-ion battery as given in Eq. 17. For the mechanical analysis, during
cycling the anode bonds undergoes diffusion induced stress due to the intercalation and
deintercalation reaction. In the present model, we assume that the total electroactive
surface area of the anode consists of two components. First, the initial surface area of the
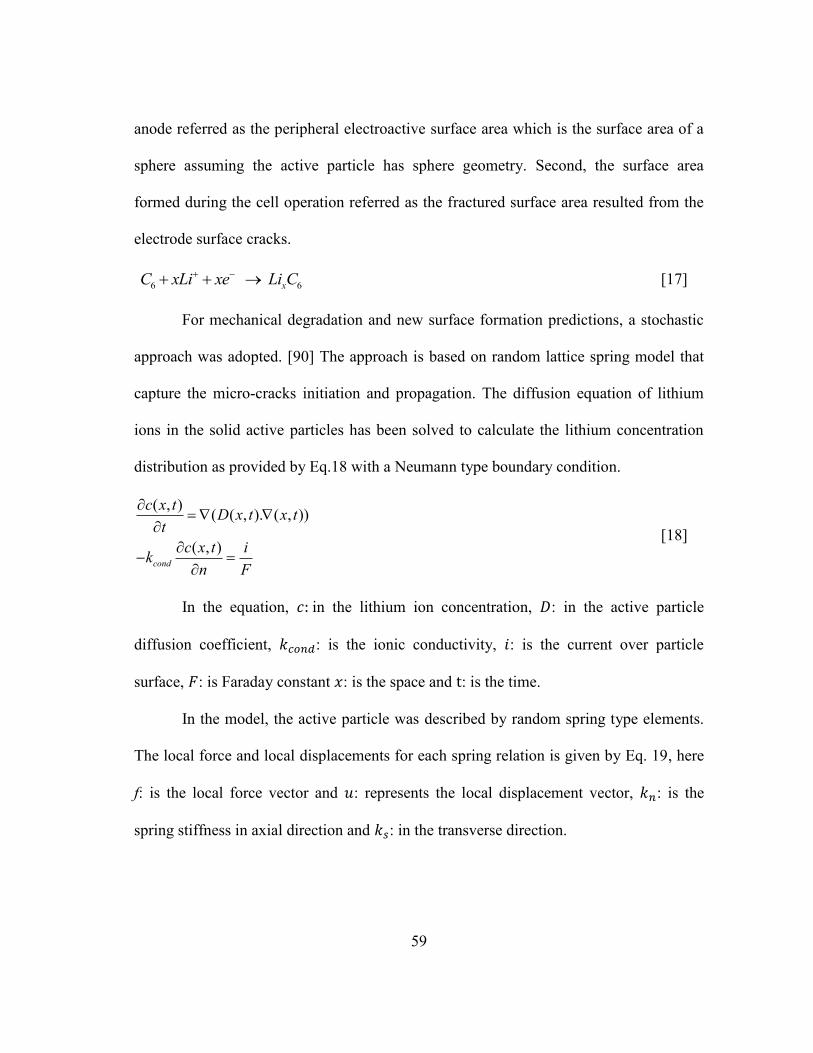
59
anode referred as the peripheral electroactive surface area which is the surface area of a
sphere assuming the active particle has sphere geometry. Second, the surface area
formed during the cell operation referred as the fractured surface area resulted from the
electrode surface cracks.
6 6 xC xLi xe Li C [17]
For mechanical degradation and new surface formation predictions, a stochastic
approach was adopted. [90] The approach is based on random lattice spring model that
capture the micro-cracks initiation and propagation. The diffusion equation of lithium
ions in the solid active particles has been solved to calculate the lithium concentration
distribution as provided by Eq.18 with a Neumann type boundary condition.
( ( , ). ( , ))( , )
( , )cond
D x t x tc x t
t
ik
n
t
F
c x
[18]
In the equation, 𝑐: in the lithium ion concentration, 𝐷: in the active particle
diffusion coefficient, 𝑘𝑐𝑜𝑛𝑑: is the ionic conductivity, 𝑖: is the current over particle
surface, 𝐹: is Faraday constant 𝑥: is the space and t: is the time.
In the model, the active particle was described by random spring type elements.
The local force and local displacements for each spring relation is given by Eq. 19, here
f: is the local force vector and 𝑢: represents the local displacement vector, 𝑘𝑛: is the
spring stiffness in axial direction and 𝑘𝑠: in the transverse direction.
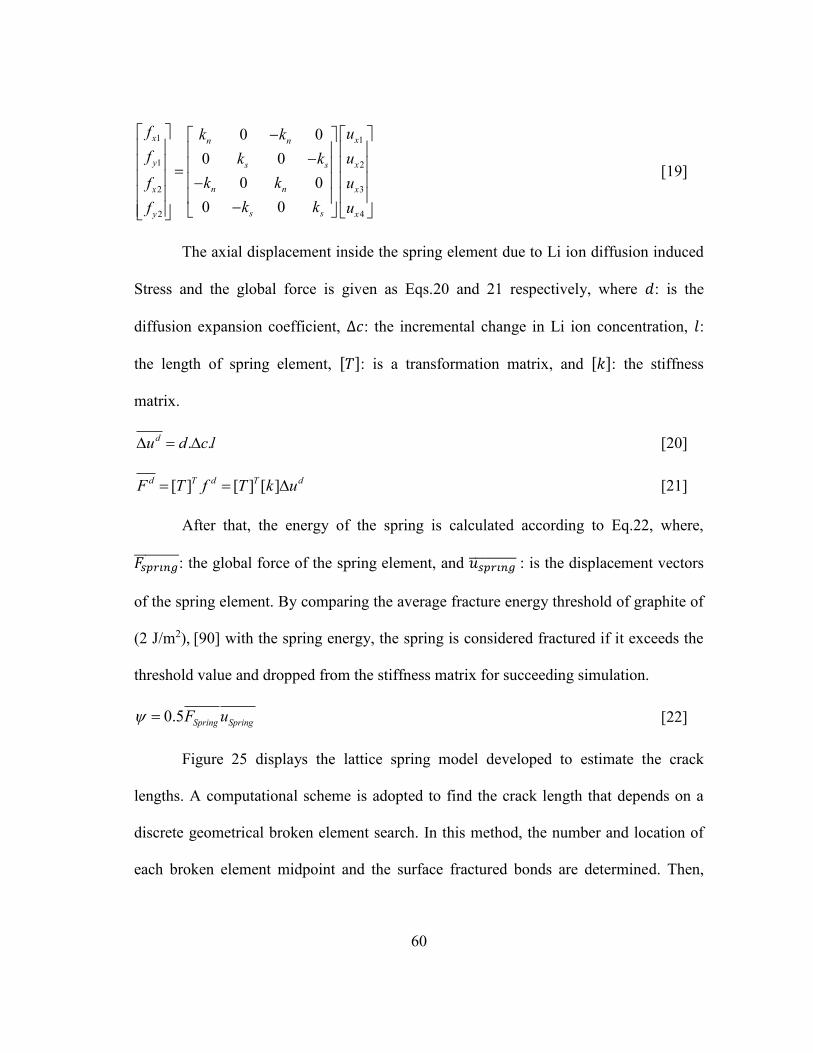
60
1 1
1 2
2 3
2 4
0 0
0 0
0 0
0 0
x xn n
y xs s
n nx x
s sy x
f uk k
f uk k
k kf u
k kf u
[19]
The axial displacement inside the spring element due to Li ion diffusion induced
Stress and the global force is given as Eqs.20 and 21 respectively, where 𝑑: is the
diffusion expansion coefficient, ∆𝑐: the incremental change in Li ion concentration, 𝑙:
the length of spring element, [𝑇]: is a transformation matrix, and [𝑘]: the stiffness
matrix.
. .du d c l [20]
[ ] [ ] [ ]d T d T dF T f T k u [21]
After that, the energy of the spring is calculated according to Eq.22, where,
𝐹𝑠𝑝𝑟𝑖𝑛𝑔 : the global force of the spring element, and 𝑢𝑠𝑝𝑟𝑖𝑛𝑔 : is the displacement vectors
of the spring element. By comparing the average fracture energy threshold of graphite of
(2 J/m2), [90] with the spring energy, the spring is considered fractured if it exceeds the
threshold value and dropped from the stiffness matrix for succeeding simulation.
0.5 Spring SpringF u [22]
Figure 25 displays the lattice spring model developed to estimate the crack
lengths. A computational scheme is adopted to find the crack length that depends on a
discrete geometrical broken element search. In this method, the number and location of
each broken element midpoint and the surface fractured bonds are determined. Then,

61
each individual crack length in the active material particle is estimated by tracking and
adding the broken element lengths to the existing crack lengths. Furthermore, an
orientational averaging has been conducted to convert the crack surface from a 2D
surface to a 3D sphere representation to estimate the fractured surface area. The 2D
circle has been rotated along any diameter axis in an out of plane direction by 180o to
obtain the 3D sphere representation as given in Eq. 23.
Figure 25 Schematic diagram of the lattice spring model used in this study to
capture the fracture damage in the active material particles
,
1
2 . cos( ).Number of Cracks
Cracks Particle crack
surface
A l R d d [23]
Then, the total electro-active surface area of Cracks within the electrode is solved
as shown in Eq. 24. The peripheral electroactive surface area of the electrode is given in
Eq.25. 𝑛: is the number of active material spherical particles in the electrode is given in
Eq. 26 by using the total electro-active surface area of electrode 𝑺𝑬𝒍𝒆𝒄𝒕𝒓𝒐𝒅𝒆,𝑺𝒖𝒓𝒇𝒂𝒄𝒆.

62
,
1
. 4Number of Cracks
Electrode Cracks crackS n R l
[24]
,
3 Electorde ElectordeElectrode Surface
VS
R
[25]
Electorde Electrode
Particle
Vn
V
[26]
The total surface area exposed to the side reaction is calculated by the sum
electro-active surface area of active materials surface and the fractured surface as given
in Eq.27.
, , , Electorde Total Electrode Surface Electrode CracksA S S [27]
Electrochemical Model for Intercalation/Deintercalation and Side Reactions
The actual capacity loss occurs due to the presence of side reactions that
consume the lithium ions irreversibly. In the present chemical degradation model, the
SEI formation is assumed to be the main side reaction where the lithium ions are
consumed at the initial electrode surface and on the new electrode surface generated due
to fracture.
The intercalation deintercalation rate expression is given by the Butler-Volmer
Eq. 28, in the expression of the exchange current density appears in Eq. 29. in the
equations, 𝛼𝑎, 𝛼𝑐 are the anodic and the cathodic transfer coefficients, 𝑅 is the universal
gas constant, 𝑇 is the temperature, 𝑘𝑗 is the rate constant of both electrodes, 𝑥𝑗,𝑠𝑢𝑟𝑓 is the
state of charge (SOC) for both electrodes and it is defined as 𝑐𝑗,𝑠𝑢𝑟𝑓 𝑐𝑗,𝑚𝑎𝑥⁄ the local
lithium ions concentration over the maximum lithium ion concentration, 𝑐𝑒 is the

63
electrolyte concentration and assumed constant according to the single particle model
and 𝜂𝑗 is the overpotential of both electrodes and is given Eq. 30 and 31 for anode and
cathode respectively. The open circuit potential empirical formulas as a function of SOC
for both electrode are taken from Guo et al. [91]
int, 0 exp expa j c j
j
F Fi i
RT RT
[28]
0, ,max , ,max , ,max
a c c
j j j j surf j j surf j ei k c x c x c c
[29]
arg
( )- arg
app Film
n n n j
n
I R Disch eU SOC
Ch eS
[30]
( )p p p jU SOC [31]
The difference between the solid phase potential of the positive and negative
electrode is the cell voltage defined as given in Eq. 23. The first two terms represent the
difference between the solid phase potentials of cathode and the anode. As discussed
earlier, the electrolyte variables are not solved in the present model based on the SEI
formation uniformity in a homogeneous thin electrode. The potential drop in the
electrolyte is characterize in the third term as nonlinear resistor and is temperature
dependent as shown later.
1, 1,cell p n app cellV I R [32]

64
The chemical formulas of the side reaction are presented in Eq. 33. Eq. 34 gives
the reaction rate expression of the SEI formation it is assumed to be irreversible and
calculated by using the cathodic Tafel kinetics and the thickness of the film is also
coupled in the rate expression according to Lin et al. [92] where 𝜆 is the decay constant,
𝑘𝑆𝐸𝐼 is the rate constant of the side reaction, a fitting parameter in our model and 𝐶𝐸𝐶 is
the concentration of the solvent.
2 2 EC Li e P [33]
0, .a s
SEI
F
RT
SEI si i e e
[34]
0,s SEI ECi k FC [35]
,
app Film
s n ref s
n
I RU
S [36]
The film thickness growth associated with SEI formation and the film resistance
increase due to the growth of the film on the anode surface is given by Eqs. 37 and 38. In
the equations 𝑀𝑆𝐸𝐼 is the molecular weight, 𝜌𝑆𝐸𝐼 is the density and 𝜎𝑆𝐸𝐼 the conductivity
of the SEI layer.
2
SEI SEI SEI
SEI
d i M
dt F
[37]
,
( )SEIFilm Film ini
SEI
tR R
[38]
65
The capacity loss with time is directly related to the rate of lithium consumption
due to side reactions and is given by Eq.39 where 𝐴𝐸𝑙𝑒𝑐𝑡𝑟𝑜𝑑𝑒,𝑇𝑜𝑡𝑎𝑙 is the electroactive
surface area of the active material particles exposed to the electrolyte.
, sElectorde Total SEI
dQA i
dt [39]
Energy Balance and Temperature Dependent Parameters
The lumped energy balance equation is adopted and solved in this model to
predict the internal cell temperature. The energy equation with the associated initial
condition is defined as Eq. 40 where 𝜌 is the cell density, 𝑉 is the cell volume, 𝐶𝑝 is the
heat capacity of the cell, ℎ is the convective heat transfer coefficient, 𝐴 is the cell surface
area and 𝑇𝑎𝑚𝑏 is the ambient temperature. [91]
0
( ) ( )p n
Cell p p n p n Cell Cell amb
ambt
dU dUdTm C IT SOC SOC I IR hA T T
dt dT dT
T T
[40]
The first term on the right hand side represents the heat generated due to the
reaction entropy change which is commonly called the reversible heat. The irreversible
heat generation as a result of electrode polarization is characterized in the second term
on the right hand side. The third term is the convective heat between the cell and its
surroundings. The mechanical and electrochemical degradation model is coupled with
the thermal model through the dependency of the model parameters on the temperature.
The Arrhenius correlation is employed to predict the change of the transport and kinetic
model parameters with cell temperature. The dependent temperature solid phase

66
diffusion coefficient, reaction rate constant, cell resistance and side reaction rate constant
are given as follows:
, 1 1
, , , .
D j
ref
Ea
R T T
Solid j Solid j refD D e
[41]
, 1 1
, , , .
k j
ref
Ea
R T T
Rxn j Rxn j refk k e
[42]
1 1
, .
RCell
ref
Ea
R T T
Cell Cell refR R e
[43]
1 1
, .
kSEI
ref
Ea
R T T
SEI SEI refk k e
[44]
where 𝑇𝑟𝑒𝑓 is the reference temperature, 𝐷𝑆𝑜𝑙𝑖𝑑,𝑗,𝑟𝑒𝑓 is the reference solid phase diffusion
coefficient at 𝑇𝑟𝑒𝑓 with 𝐸𝑎𝐷,𝑗 activation energy, 𝑘𝑅𝑥𝑛,𝑗,𝑟𝑒𝑓 is the intercalation
deintercalation reference reaction rate constant at 𝑇𝑟𝑒𝑓with 𝐸𝑎𝑘,𝑗 activation energy,
𝑅𝑐𝑒𝑙𝑙,𝑟𝑒𝑓 is the reference value of the cell resistance defined as 𝜙2 ,𝑝 − 𝜙2 ,𝑛 = 𝐼𝑅𝑐𝑒𝑙𝑙 at
𝑇𝑟𝑒𝑓 and 𝑘𝑆𝐸𝐼,𝑟𝑒𝑓 is the reference side reaction rate constant at 𝑇𝑟𝑒𝑓 with 𝐸𝑎𝑘𝑆𝐸𝐼,𝑗
activation energy.
Results and Discussion
In this section, we studied the combined chemical and mechanical degradation
mechanisms effect on the cell cycle life and capacity fade using the developed model.
The model was used to investigate the effects of mechanical degradation and SEI
formation at different operating temperatures, current intensities and particle size, the
cooling condition and operating temperature, and the intercalation reaction exchange

67
current density on the cell capacity fade and the influence of active material fracture on
cycle life. Finally, the study concludes with a phase map that demonstrates the effect of
stress and design factors on the combined chemical, mechanical and thermal degradation
mechanisms.
Table 3 The coupled chemo-mechanical model design and electrochemical
parameters Parameter Anode
Cathode
Maximum Concentration (𝑪𝒎𝒂𝒙𝑳𝒊 ) (mol/cm3) 0.030555[63] 0.051555[63]
Diffusion Coefficient (𝑫𝒔) (cm2/s) 1.0 × 10⁻¹⁰[53] 3.9 × 10⁻¹⁰[53]
Particle Radius R (µm) 5.0 × 10⁻⁴[74] 5.0 × 10⁻⁴[74]
Reaction Rate Constant (𝒌𝒔) (A cm2.5/mol1.5) 0.4854[93] 0.2252[93]
Anodic Transfer Coefficient 0.5 0.5
Cathodic Transfer Coefficient 0.5 0.5
Activation Energy of reaction constant (J/mol) 2.0 × 10+4[94] 5.8 × 10+4[95]
Activation Energy of diffusion coefficient
(J/mol)
3.5 × 10+4[84] 2.9 × 10+4[96]
Active Material Volume Fraction (𝜺𝒋) 0.49 0.52
Electrode Volume ( 𝒗𝒋) (cm3) 6.52 6.71
Electrolyte Concentration (𝑪𝒆) (mol/cm3) 1.0 × 10⁻³
Molecular Weight SEI (𝑴𝑺𝑬𝑰) (g/mol) 162[65]
Density SEI (𝝆𝑺𝑬𝑰) (g/cm3) 1.69[65]
Solvent Concentration (𝑪𝑬𝑪) (mol/cm3) 0.004541[65]
Initial SEI Thickness (𝜹𝑺𝑬𝑰𝟎 ) (cm) 5.0 × 10⁻⁷[74]
SEI Layer Conductivity (𝜿𝑺𝑬𝑰) (S/cm) 5.0 × 10⁻⁸[65]
Activation Energy of side reaction constant
(𝑬𝒂𝒌𝒔𝒊𝒅𝒆) (J/mol)
6.0 × 10+4[74]
OCP reference of the film (V) 0.4
Cathodic Transfer Coefficient of SEI formation 0.5
SEI Decay Rate Constant (𝝀) (1/cm) 1.8 × 10+5
Heat Capacity (J/K·g) 0.75[91]
Cell mass (g) 39.4[97]
Faraday constant (C/mol) 96487
Gas constant (J/mol.K) 8.3143
Reference Temperature 𝑻𝒓𝒆𝒇 (K) 298.15

68
The study is commenced by an attempt to construct a baseline case for model
predictions by comparison with experimental results for different C-rates by Ning et al.
[98] Figure 26 shows a comparison between the experimental results and the predicted
capacity fade by the coupled model using the parameters data in Table 3. The capacity
fade is more apparent at higher C-rates as illustrated in Figure 26. This behavior is in
agreement with other studies that included the effect of the C-rate. The C-rate is
considered on the stress factors along with the operating temperature and DOD that
significantly affect the capacity fade and cycle life of Li-Ion batteries. Several studies
have investigated the effect of the current rates on the capacity fade. For instance, Qi
Zhang et al. [99] have studied the capacity fade at low rates. They concluded that the
capacity fade at low rates is comprised of three stages, in which the anode is dominant in
the first stage and the cathode becomes the limiting electrode in the last stage. Rahimian
et al. [100] showed that the cycle life of the battery could be enhanced and maximized
by charging rates optimization. On the other hand, Wang et al. [67] studied the effect of
high discharge rate on the cycle life experimentally, they observed an exponential
increase in the capacity loss with C-rate. The experimental result of Wang et al, have
been predicted by Prada et al. [74] using their electrochemical and thermal aging model.
In the model, the authors hypothesized that the high capacity loss at higher current rates
is attributed to the changes in the mass transport of solvent and solvent reduction
kinetics rate in through the SEI layer. They have used the solvent diffusion coefficient
through the SEI layer as an adjustable parameters to fit the experimental results. Pinson
and Bazant [68], developed a single particle aging model that have been validated with

69
several experimental results. Recently, the authors extended the simplified model to
account for high C-rates, by constructing a relation between the solvent diffusion
coefficient and C-rate. They assumed that the cell temperature rise above the room
temperature by a quantity proportional to the C-rate and using the Arrhenius dependence
of diffusion coefficient on the temperature and current. [101] As Figure 26 shows, the
present coupled electrochemical, thermal and mechanical aging model provides good
prediction and trend for current rate effect for all C-rates and show a slight over
prediction for 3C at the early cycles.
Figure 26 A comparison between the coupled model and the experimental results of
Ning et al. [98] at different discharge C-rates
Figure 26 shows two distinct behaviors during cycling and capacity fade process.
Initially, the battery degradation illustrates that the battery with all C-rates suffers a
major degradation during the initial cycling stages and then continue to fade with
relatively lower degree where the fading process stabilize. The present coupled model
have successfully captured the initial increase in the capacity fade that can be explained
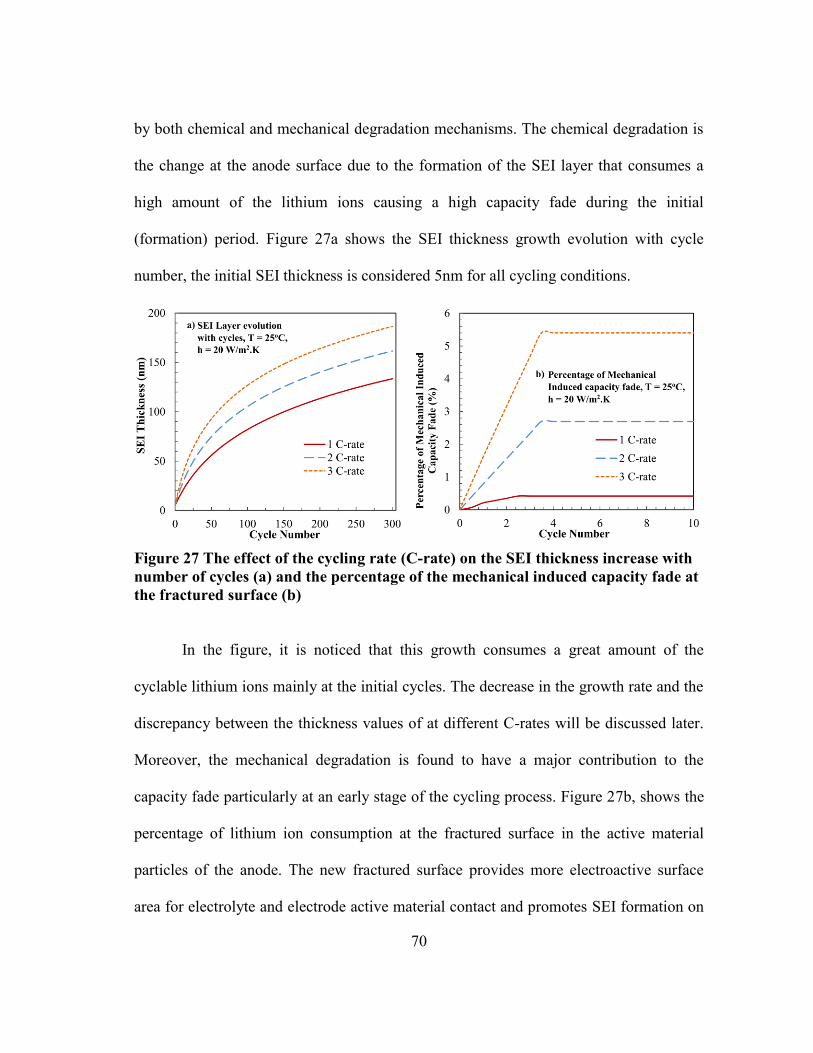
70
by both chemical and mechanical degradation mechanisms. The chemical degradation is
the change at the anode surface due to the formation of the SEI layer that consumes a
high amount of the lithium ions causing a high capacity fade during the initial
(formation) period. Figure 27a shows the SEI thickness growth evolution with cycle
number, the initial SEI thickness is considered 5nm for all cycling conditions.
Figure 27 The effect of the cycling rate (C-rate) on the SEI thickness increase with
number of cycles (a) and the percentage of the mechanical induced capacity fade at
the fractured surface (b)
In the figure, it is noticed that this growth consumes a great amount of the
cyclable lithium ions mainly at the initial cycles. The decrease in the growth rate and the
discrepancy between the thickness values of at different C-rates will be discussed later.
Moreover, the mechanical degradation is found to have a major contribution to the
capacity fade particularly at an early stage of the cycling process. Figure 27b, shows the
percentage of lithium ion consumption at the fractured surface in the active material
particles of the anode. The new fractured surface provides more electroactive surface
area for electrolyte and electrode active material contact and promotes SEI formation on
71
its surface. The figure illustrate that the fracture evolution occurs during about the first
few cycles in the cycle life for all operating conditions and then the fracture damage
saturates successively. In addition, the fracture surface area increases with increasing the
applied current density providing higher side reaction kinetics for the cell with higher
cycling intensity that will be discussed in more details later. The mechanical degradation
behavior in the present model reveals the high capacity loss that occurs at initial stage of
the cycle life. That is, the active material particles of the anode are assumed to be free of
cracks in the fresh battery and the total electroactive surface area of electrode is
comprised of the peripheral area of active material particles. Subsequently, upon battery
cycling, a simultaneous increase in the electroactive surface area as a result of fracture
damage and crack formation within the body of the active material particles and solvent
reduction at the peripheral and fractured electroactive surface area occurs. The combined
phenomenon promotes high side reaction kinetics at the initial period of cycling which
clarifies the high loss of cyclable lithium ions and capacity fade at the initial period of
cycling. Nevertheless, it is clear from Figure 26 that the capacity fade is rendered after
this initial period in the battery’s cycle life. This behavior have been noticed by a
comprehensive capacity fade simulation study of Lin et al. [92] where they defined it as
“stabilization stage”. The kinetics of the side reaction at the anode surface controls the
capacity fade of the battery during the cycle life. The side reaction kinetics are
dependent on the temperature rise during cell operation, mechanical modifications of the
electrode active material through the increase in the electroactive surface area and
dependent on the chemical changes of the SEI layer through the increase in its thickness

72
that directly affects the deactivation kinetics of the side reaction. We found that the
capacity fade reduction at this stage of the cycle life is a result of reduction in side
reaction rate. In this stage of cycle life, the electroactive surface area of the active
material electrode remains unchanged with no increase due to fracture damage
saturation. In addition, the increase of the SEI layer thickness represented in the
deactivation rate, counteracts its growth rate. [65, 102, 103]
On the other hand, the capacity loss is higher for battery cycled at high C-rates.
The tendency of high capacity fades for higher rates manifests in the combined effect of
the internal mechanical and thermal mechanisms inside the battery. More serious
fracture damage occurs in the case of high C-rates. The large lithium ion concentration
gradient in the active material particles for high current densities, poses a more severe
intercalation and deintercalation diffusion induced stress. The higher stress results in
more fracture damage inside the particles that lead to a higher crack length and
penetration and thus a higher electroactive surface area. The present model does not
solve the fracture of the SEI layer; however, during cycling operations the SEI layer is
predisposed to fracture damage due to its limited elasticity which could increase its
porosity by crack formation. The fracture of the SEI layer could be a research topic for
future work.
Likewise, the temperature of the battery is a function of the current rate as can be
seen in Figure 28. The temperature increase is correlated to the cycling C-rate due to the
high heat generation resulted from the higher current passage inside the battery. Since
the side reaction rate constant is a temperature dependent parameter, higher temperature
73
will increase the side reaction kinetics which promote solvent reduction kinetics and
produce a higher SEI thickness with increasing C-rate as shown in Figure 27b. Clearly,
the SEI thickness growth is proportional to the C-rate, and the highest thickness is
exhibited at 3 C-rate in later cycles. The temperature effect on the SEI growth and
capacity fade becomes dominant in the stabilization period and later in the cycle life
however, in an early stage of the cycle life a slight difference in SEI thickness with
different C-rates which suggests that temperature of the cell have a minor impact. From
these observations, it is clear that the cycle life of the battery is limited by the fracture
damage in the active material particles and loss of cyclable lithium ion SEI formation at
the early stage of cycle life, and becomes limited by the thermal degradation and
temperature rise later in cycle life.
From engineering prospective, the nature of the solvent reduction reaction and
the growth of the SEI layer are influenced by several factors. These factors can be
categorized into a manufacturing practice factors and operational related factors. The
nature of the electrolyte solvent and the anode active material type falls in the first
category that cannot be changed after battery seal. On the other hand, the second
category includes the operating conditions such as; current intensity and the operating
temperature which can be monitored and controlled during battery operation, these
factors have a high influence on the capacity fade of the battery. [104] Since the effect of
the current intensity have discussed earlier, the effect of the operating temperature effect
on the capacity fade is investigated. Figure 29, illustrates the percentage of the capacity
fade that occur at the fractured electroactive surface at three different initial operating

74
temperature 5oC, 25oC and 45oC with 3C cycling rate. In addition, the figure depicts the
physical fracture and ion concentration profiles after fracture saturation for all operating
temperatures. The capacity fade due to fracture damage is found to be more critical at
5oC than 25oC and 45oC. It is apparent that the fracture and concentration gradient is
correlated to temperature decrease.
Figure 28 The cell temperature during discharging at different C-rates. The initial
operating temperature is 25oC and the heat transfer coefficient is 20 W/m2.K
The decrease of the active material diffusion coefficient with temperature
decrease, stimulate a high intercalation and deintercalation lithium ion concentration
gradient within the active material particles. The concentration build-up at lower
operating temperatures, induces an immense mechanical stress causing a high fracture
damage which in turn produce a larger cracks length and surface area leading to higher
magnitude of capacity fade at fracture surface at lower temperatures. Conversely, the
solid phase diffusion coefficient increases with temperature that allows a faster Li ion

75
diffusion inside the electrode and preventing concentration build-up and high
concentration gradient at higher operating temperature. However, the total capacity fade
during the cycle life associated with increasing temperature is found to be higher with
increasing the initial operating temperature. Figure 30, display a comparison between the
evolution of SEI layer thickness with the battery’s cycle life at with initial operating
temperature of 5oC, 25oC and 45oC with 3C cycling rate. The thickness of SEI is kept
increasing with life cycle at all the three operating temperatures. However, the highest
increase exhibited in the battery cycled at 45oC with thicker SEI layer that indicates
highest cyclable lithium consumption. This observation answers the tendency of
increasing of capacity fade with temperature, since the side reaction rate increases
rapidly with temperature through the rate constant temperature dependency. The
thickness increase trend at different operating temperatures suggests that the thicker SEI
layer that take place during high operating temperatures is decaying faster. From the
previous discussion, a clear trade-off exist between the thermal mechanism represented
in temperature rise during cycling and the mechanical degradation mechanism
represented as the cracks electroactive surface area increase in the model. Furthermore,
it is concluded that at high initial operating temperatures the mechanical degradation is
negligible and the capacity fade is controlled by the thermal heat generation on the
peripheral surface of active material particles. On the other hand, at subzero operating
temperatures, the mechanical degradation mechanism is expected to control the capacity
fade of the battery.

76
The thermal management of Li-Ion systems is an important aspect from an
engineering design prospective. The temperature of the battery and the thermal cooling
conditions arises many drawbacks in the safety of the Li-Ion battery which curb its
growth for automotive and aerospace applications. Conversely, the cooling conditions
may have a positive impact and boost the battery performance.
Figure 29 The percentage of the mechanical induced lithium ion consumption at the
fractured surface at different initial operating temperature accompanied with the
physical fracture representation
For instance, Ji et al. [81] investigated the cell performance at subzero operating
temperatures, they observed that a significant increase the battery performance for an
insulated battery where an adiabatic cooling condition is imposed on the cell. Here we

77
studied the effect of the cooling condition on the cell cycle life at different initial
operating temperatures and current intensities. Figure 31, illustrates a phase map for two
different extreme cooling conditions.
Figure 30 The surface SEI layer growth as a function of cycle number at different
initial operating temperature
Figure 31a shows the capacity fade phase map at the adiabatic condition which is
achieved by setting (h = 0) in the energy equation, in this case, an ideal insulation is
assumed to cover the cell and all the heat generated within the cell is turned to
temperature rise. The capacity fade phase map of an isothermal condition is seen in
Figure 31b, in isothermal condition the cell temperature are kept at its initial operating
temperature which can be simulated by using a high heat transfer coefficient (h ∞) that
deliver all the generated heat inside the battery to the ambient. The capacity fade at both
cooling conditions shows dissimilar trends. A severe capacity fade is observed in the
case of adiabatic cooling condition compared to isothermal condition. The phase map in

78
Figure 31a exhibit a well like behavior at moderate operating temperatures particularly
at high current intensities and shows an extreme capacity fade at low and high operating
temperatures. Although the battery experience an enhanced performance at adiabatic
conditions at low operating conditions, the battery suffers from a high capacity fade that
is comparable with high initial operating temperatures. Physically, the charge transfer
resistance inside the battery increases as the initial operating temperature decrease,
which produce a higher heat generation to overcome the high resistance that result in
higher temperature rise compared to moderate and high operating temperatures during
adiabatic conditions. The temperature rise inside the battery enhances the cell
electrochemical parameters such as the charge transfer kinetics, diffusivity and
conductivity which considerably enhance its performance.
Figure 31 A phase map shows the effect of the cooling condition on the capacity
fade process with particle size of 5µm. Insulated cell (h = 0) in (a) and isothermal
cell with cooling condition of (h ∞) in (b)

79
However, the combined effect of the high mechanical fracture at low temperature
and the temperature rise during adiabatic condition will also enhance the side reaction
kinetics leading to higher capacity fade. Figure 31a suggests that during adiabatic
operation, the capacity fade of the battery is solely limited by the thermal aging
mechanism at high operating temperature, and at low operating temperatures, the battery
capacity fade is limited by the combined temperature rise and fracture damage. The
adiabatic conditions could be beneficiary for operating at moderate temperatures because
the temperature rise will enhance the performance with a reasonable capacity fade of the
battery. On the other hand, it is seen in Figure 31b that at isothermal cooling conditions,
a considerable reduction in the battery’s capacity fades. At isothermal cooling
conditions, a perfect cooling path is assumed to keep the temperature at its initial
operating temperature. The highest capacity loss increases as the initial operating
temperature increase is noticed at all current intensities. However, as the initial operating
temperature decrease during isothermal operation, the capacity fade is mainly occurs due
to the high fracture damage and the thermal effect is negligible. Figure 31 proposes a
direct relation between thermal management and cycle life of Li-Ion batteries. The trade-
off between the battery performance, fracture damage, cycle life and cooling
requirements which is a function of cost at different operating temperatures, construct an
engineering optimization thermal management problem.
To explore the effect of fracture damage on the cycle life, a thorough
investigation of the active material fracture effect on cycle life and capacity fade is
conducted. The comparison is performed for the first ten cycles with and without

80
including the fracture damage in capacity fade simulations, for 3C galvanostatic cycling
at 25oC and with an anode particle size of 10µm. Figure 32, illustrates the battery
cycling performance for two cases with fracture and without fracture and shows the
accompanied normalized capacity of the battery. In both cases drop in the voltage during
discharge and the accompanied capacity fade represented as normalized capacity is
observed. Figure 32 enable us to construct a comparison between the mechanical and
chemical degradation mechanisms. The results infer that the capacity fade at the very
first few cycles have approximately the same behavior. A higher decline in the battery’s
normalized capacity curve is clearly noticed afterwards. Firstly, the formation of SEI
specifically at the first few cycles controls the capacity fade that lead to similar decay
behavior in both cases. However, in the case which includes the fracture damage, the
mechanical degradation becomes significant and accelerates the capacity fade process.
Figure 32 Comparison between capacity fade with including fracture effect and
with no fracture considerations. The heat transfer coefficient is 20 W/m2.K and
active material particle size is 10 µm

81
In the cycling plot, it is observed that in both cases the termination discharge
voltage is the same which indicate that the SOC of the anode in both cases are equal due
to the loss of equal cyclable lithium. The potential of the anode increase due to the
higher loss in the SOC occurs in the curve which includes the fracture damage effect
leading to cell voltage shift. On the other hand, the slow decrease of the SOC in the case
which does not include fracture damage retains a stable decrease in the cell performance.
In addition to the fracture effect, an attempt is made to study the effect of the
active material properties. Figure 33, shows the effect of the exchange current density on
the capacity fade of the cell, a comparison consist of changing the exchange current
density by 0.25 and 4 times around its baseline value with 3C rate cycling at 25oC. This
parameter is a fundamental kinetic parameter for redox reactions, the importance of this
parameter is that is shows the degree of competition between the reversible intercalation
reaction and the irreversible solvent reduction reaction at the active material surface. The
lowest exchange current density results in the highest capacity fade. The results
demonstrate that the sluggish intercalation/deintercalation kinetics and the high charge
transfer resistance at low exchange current density enhances the cyclable lithium
consumption in the solvent reduction reaction which becomes kinetically favorable. The
exchange current density is a function of the active material surface nature, electrolyte
and lithium concentration that propose surface modifications and changing the
electrolyte would decelerate the capacity fade of the cell.

82
Figure 33 The effect of graphite kinetics (exchange current density) on the cell
capacity fade
Figure 34, represents a phase map that predict the degradation of the battery
under varying operating temperatures, current rates, and particle sizes that is
characterized by the active material particle radius. In Figure 34a the total capacity fade
of the battery is given and in Figure 34b the percentage of the capacity fade at the
fractured surface to the total capacity fade of the battery. Each particle size is
represented by its unique surface that shows the capacity fade with a range of operating
temperatures and current densities as seen in Figure 34. In general, for the capacity fade
is proportional to the current density in both surfaces. However, the surfaces intersect
each other deducing a trade-off between capacity fade with different active material
particle sizes.

83
Figure 34 A degradation phase map showing the effect and dependency of capacity
loss with h = 20 W/m2.K on different design and operating parameters
In the case larger particle size the low temperatures suffer greater capacity fade
than higher temperatures. On the other hand, at small particle sizes the cell experiences a
higher capacity fade with increasing temperature and current rate. This is elucidated by
the compromise between the peripheral and fracture electroactive surface area, the
peripheral surface area as given in Eq.9 decreases as the particle size increase and
conversely, the fracture surface area increase as the particle size increase as predicted by
the present model. That is, when the particle size is 5 µm the major consumption of
lithium ions take place at the peripheral electroactive surface area and fewer portions
will be consumed at the fracture surface area as displayed in Figure 34b. When doubling
the particle size to 10 µm, the peripheral electroactive surface area will decrease to half,
which at the same time increase the fractured electroactive surface area increasing the
consumption of the lithium ion at the fractured electroactive surface area and decrease it
at the peripheral surface area as shown in Figure 34b. The fracture damage increases as

84
the operating temperature decrease that intensify diffusion induced stress and increase
the percentage of capacity loss at the fractured surface as clearly shown in Figure 34b.
For instance, at the lowest temperature the fractured surface contribute to about 50% of
the total capacity fade and cyclable lithium loss when the particle size is 10 µm while
about 20 % when the particle size is 5 µm at the same current rate.
Finally, by using the information and the experimental results of Ning et al. [64]
an attempt to predict the discharge curves is made. Figure 35 illustrates a comparison
between the experimental discharge curves with the present model predicted results at
different cycle numbers, good comparison is attained between both results.
Figure 35 Comparison between experimental discharge curves of Ning et al. [64]
with model predictions at different cycles
Summary
A coupled chemical, mechanical and thermal capacity fade model based on a
single particle framework is developed to study the cycle life of the Li-Ion battery. A
first principle chemical model has been proposed to study the irreversible formation of

85
the SEI layer on the anode. Moreover, the induced stress mechanical fracture of the
active material was characterized by a stochastic methodology based on the lattice spring
model. The lumped energy balance equation had been solved to capture the effect of the
operating temperature and thermal degradation on the cell capacity fade. An
investigation of the effect of the current rates, operating temperature, exchange current
density of the intercalation reaction and cooling conditions on the capacity fade have
been conducted. The capacity fade results indicate that the mechanical degradation is
higher at low operating temperatures and high current rates. However, the temperature
rise in the battery which increases the high cyclable lithium consumption in the solvent
reduction reaction, is a key factor for capacity fade at high operating temperatures in
which mechanical degradation is negligible.
In conclusion, the capacity fade is an inevitable dilemma for Li-ion batteries
however; a crucial challenge is how the cycle life can be prolonged. The importance of
the cooling condition, particle size and the exchange current density on life cycle have
been emphasized. The intercalation reaction kinetics characterized by the exchange
current density provides an enhanced cell performance and lower capacity fade
suggesting that this parameter is critical to afford higher cycle life. The effect of the
cooling conditions have indicated dissimilar results; in the adiabatic condition the battery
suffers from a major capacity fade especially at high and low operating temperatures
which is not seen at isothermal condition. The particle size showed that increasing the
particle sizes can intensify the mechanical degradation leading to a higher capacity fade

86
at low temperatures. A degradation phase map characterizing the capacity fade regimes
in terms of active particle size, operating temperature and current rate have been
developed. Finally, the present model can be extended to elucidate intrinsic battery
behavior and their effect on the capacity fade operation. Future work could include:
studying the effect of SEI layer fracture in the capacity fade model which could be
important at high charge rate, and including different aging mechanisms in the model
such as lithium plating which is significant at high charging rates and low temperature
operations.

87
CHAPTER IV
CONCLUSION AND OUTLOOK
Li-ion batteries are considered as one of the most promising power solutions to
electric cars due to their high energy and power densities. However, the inherent
underlying technical barriers implied in theses batteries hinder their application as a
powertrain solution for hybrid and electric vehicles. These barriers include the limited
cycle and calendar life and the long charging time. Therefore, a fundamental
understanding of the fast charging and cycle life is needed in order to overcome these
barriers and attain more powerful and sustainable Li-ion batteries.
Investigations of cell performance and limiting mechanisms during fast charging
operation of Li-ion cell have been conducted at moderate and extreme operating
temperatures. The simulations of fast charging at different temperatures and thermal
conditions were performed by an electrochemical-thermal coupled model. The study is
commenced with a base case with conventional charging, in order to capture the
limitations and controlling mechanisms of fast charging at different temperatures.
Charging time and columbic efficiency is found to be highly dependent on the
charging/discharging rates and cooling conditions. The electrolyte resistance dominates
the charging process at high and moderate operating temperatures because of the high
ohmic drop and concentration overpotential limitations. Moreover, at subzero
temperatures, due to the charge transfer kinetics limitations, a high charging time and
low columbic efficiency were found. Furthermore, the study of charging protocols
reveals that pulse charging protocol achieves fast charging by increasing the surface

88
concentration of the lithium at initial stages, using high pulses, near the saturation value
then maintaining the concentration values close to the saturation by decreasing the pulse
values. Likewise, for the boostcharging protocol, it was found that the applied constant
voltage at the boostcharging period reduces the electrolyte concentration overpotential
and voltage loss while maintaining a high charging current that efficiently reduces the
charging times. Furthermore, for subzero temperature charging protocols, it was
concluded that a fruitful protocol is achieved by increasing the cell temperature via
applying charge and discharge pulses, before the conventional charging and charging the
battery adiabatically. The temperature rise will reduce the charge transfer resistance
inside the cell leading to faster charging. Additionally, the parametric studies show that
optimization of the cell design parameters improve the charging process performance by
affecting the nature of the voltage losses during charging duration in the cell. The anode
thickness and porosity could be effectively optimized to reduce charging time and
achieve high charge capacity. The importance of the local transfer current density has
been emphasized to elucidate the internal performance of the battery at different
electrode design parameters. On the other hand, electrolyte concentration results show
that an optimal concentration value exists associated with electrolyte conductivity which
minimize the charging time. Additionally, it was found that the particle size reduction is
an efficient approach to increase the battery charging performance at low temperature
due to reduction charge transfer resistance.
Furthermore, the capacity fade of the cell with chemical and mechanical
degradation mechanisms are studied. The cycle life predictions are realized by

89
developing a capacity fade model consisting of a coupled chemical (SEI) and
mechanical (diffusion induced stress and damage) degradation formalism with thermal
effect. An investigation of the effect of the current rates, operating temperature,
exchange current density of the intercalation reaction and cooling conditions on the
micro crack formation and capacity fade have been conducted. The results indicate that
the mechanical degradation is greater at low operating temperatures and high current
rates. However, the temperature is a key factor for capacity fade at high operating
temperatures is the high side reaction kinetics where mechanical degradation is
negligible. Conclusively, the capacity fade is an inevitable dilemma for present Li-ion
batteries however a crucial challenge is how the cycle life can be prolonged. The
significance of the cooling condition, particle size and the exchange current density on
life cycle have been emphasized. The intercalation reaction kinetics characterized by the
exchange current density provides an enhanced cell performance and lower capacity fade
signifying that this parameter is critical to afford higher cycle life. The effect of the
cooling conditions have indicated a high effect on the capacity fade, in the adiabatic
condition, the battery suffers from a major capacity fade especially at high and low
operating temperatures which is conversely seen at isothermal condition. For the
electrode design parameters, it was concluded that increasing the particle sizes intensify
the mechanical degradation, due to high concentration gradient, which exaggerate
capacity fade at low temperatures. A degradation phase map characterizing the capacity
fade regimes in terms of active particle size, operating temperature and current rate have
90
been developed. Finally, the present model can be extended to elucidate intrinsic battery
behavior and their effect on the capacity fade operation.
For future research, the study of present rapid charging could also be extended to
perform a parametric study of material properties on rapid charging, which could
improve the experimental efforts in this area. Moreover, the present cycle life could be
extended to include the effect of physical SEI layer fracture that could be important at
high charge rate. Moreover, it is worthy to study the effect of active material isolation
that could have a dominant effect on cycle life during advanced stages which could
cause a sudden decrease in the cycle life of the battery. Furthermore, future work may
include the study of the cycle life with consideration of different aging mechanisms. One
of these degradation mechanisms is the lithium plating that causes irreversible lithium
consumption. Lithium plating becomes an important degradation mechanism at high
charging rates and low temperature operations.

91
REFERENCES
1. B. Scrosati and J. Garche, Journal of Power Sources, 195, 2419 (2010).
2. National Research Council, Review of the Research Program of the Partnership for a
New Generation of Vehicles: Seventh Report, The National Academies Press,
Washington, DC (2001).
3. K. Onda, T. Ohshima, M. Nakayama, K. Fukuda and T. Araki, Journal of Power
Sources, 158, 535 (2006).
4. P. Arora, R. E. White and M. Doyle, Journal of the Electrochemical Society, 145,
3647 (1998).
5. J. Vetter, P. Novák, M. R. Wagner, C. Veit, K. C. Möller, J. O. Besenhard, M.
Winter, M. Wohlfahrt-Mehrens, C. Vogler and A. Hammouche, Journal of Power
Sources, 147, 269 (2005).
6. V. Agubra and J. Fergus, Materials, 6, 1310 (2013).
7. M. Broussely, P. Biensan, F. Bonhomme, P. Blanchard, S. Herreyre, K. Nechev and
R. J. Staniewicz, Journal of Power Sources, 146, 90 (2005).
8. M. Broussely, S. Herreyre, P. Biensan, P. Kasztejna, K. Nechev and R. J. Staniewicz,
Journal of Power Sources, 97–98, 13 (2001).
9. G. Sarre, P. Blanchard and M. Broussely, Journal of Power Sources, 127, 65 (2004).
10. R. Spotnitz, Journal of Power Sources, 113, 72 (2003).
11. S. C. Nagpure, B. Bhushan and S. S. Babu, Journal of the Electrochemical Society,
160, A2111 (2013).
12. E. Peled, Journal of the Electrochemical Society, 126, 2047 (1979).
13. P. Verma, P. Maire and P. Novak, Electrochimica Acta, 55, 6332 (2010).
14. P. Liu, J. Wang, J. Hicks-Garner, E. Sherman, S. Soukiazian, M. Verbrugge, H.
Tataria, J. Musser and P. Finamore, Journal of the Electrochemical Society, 157,
A499 (2010).
92
15. V. Svoboda, in Encyclopedia of Electrochemical Power Sources, J. Garche Editor,
p. 424, Elsevier, Amsterdam (2009).
16. P. H. L. Notten, J. Veld and J. R. G. van Beek, Journal of Power Sources, 145, 89
(2005).
17. B. K. Purushothaman and U. Landau, Journal of the Electrochemical Society, 153,
A533 (2006).
18. S. K. Chung, A. A. Andriiko, A. P. Mon'ko and S. H. Lee, Journal of Power
Sources, 79, 205 (1999).
19. G. Sikha, P. Ramadass, B. S. Haran, R. E. White and B. N. Popov, Journal of
Power Sources, 122, 67 (2003).
20. D. Anseán, M. González, J. C. Viera, V. M. García, C. Blanco and M. Valledor,
Journal of Power Sources, 239, 9 (2013).
21. I. Abou Hamad, M. A. Novotny, D. O. Wipf and P. A. Rikvold, Physical Chemistry
Chemical Physics, 12, 2740 (2010).
22. S. S. Zhang, K. Xu and T. R. Jow, Journal of Power Sources, 160, 1349 (2006).
23. S. S. Zhang, K. Xu and T. R. Jow, Journal of Power Sources, 160, 1403 (2006).
24. S. S. Zhang, K. Xu and T. R. Jow, Electrochimica Acta, 48, 241 (2002).
25. J. Fan and S. Tan, Journal of the Electrochemical Society, 153, A1081 (2006).
26. C. K. Huang, J. S. Sakamoto, J. Wolfenstine and S. Surampudi, Journal of the
Electrochemical Society, 147, 2893 (2000).
27. S. S. Zhang, K. Xu and T. R. Jow, Electrochemistry Communications, 4, 928
(2002).
28. M. C. Smart, B. V. Ratnakumar, L. D. Whitcanack, K. B. Chin, S. Surampudi, H.
Croft, D. Tice and R. Staniewicz, Journal of Power Sources, 119, 349 (2003).
29. K. Tachibana, T. Suzuki, C. Kanno, T. Endo, T. Ogata, T. Shimizu, S. Kohara and
T. Nishina, Electrochemistry, 71, 1226 (2003).
30. C. K. Park, Z. W. Zhang, Z. Q. Xu, A. Kakirde, K. Kang, C. Chai, G. Au and L.
Cristo, Journal of Power Sources, 165, 892 (2007).

93
31. D. Crain, J. P. Zheng, C. Sulyma, C. Goia, D. Goia and D. Roy, Journal of Solid
State Electrochemistry, 16, 2605 (2012).
32. B. Kang and G. Ceder, Nature, 458, 190 (2009).
33. H. Shi and R. Brodd, in Proceedings of the Symposium on Batteries for Portable
Applications and Electric Vehicles, C. F. Holmes and A. R. Landgrebe, Editors, p.
77, The Electrochemical Society Proceedings Series, Pennington, NJ (1997).
34. H. Shi, Journal of Power Sources, 75, 64 (1998).
35. M. Doyle, J. Newman, A. S. Gozdz, C. N. Schmutz and J. M. Tarascon, Journal of
the Electrochemical Society, 143, 1890 (1996).
36. W. F. Fang, O. J. Kwon and C. Y. Wang, International Journal of Energy
Research, 34, 107 (2010).
37. W. B. Gu and C. Y. Wang, in Proceedings of Lithium Batteries, S. Surampudi, R.
A. Marsh, Z. Ogumi and J. Prakash, Editors, p. 748, The Electrochemical Society
Proceedings Series, Pennington, NJ (2000).
38. K. Smith and C. Y. Wang, Journal of Power Sources, 160, 662 (2006).
39. V. Srinivasan and C. Y. Wang, Journal of the Electrochemical Society, 150, A98
(2003).
40. E. Prada, D. Di Domenico, Y. Creff, J. Bernard, V. Sauvant-Moynot and F. Huet,
Journal of the Electrochemical Society, 159, A1508 (2012).
41. B. Suthar, V. Ramadesigan, S. De, R. D. Braatz and V. R. Subramanian, Physical
Chemistry Chemical Physics, 16, 277 (2014).
42. X. C. Zhang, W. Shyy and A. M. Sastry, Journal of the Electrochemical Society,
154, A910 (2007).
43. Y. T. Cheng and M. W. Verbrugge, Journal of the Electrochemical Society, 157,
A508 (2010).
44. C. K. ChiuHuang and H. Y. S. Huang, Journal of the Electrochemical Society, 160,
A2184 (2013).
45. D.-W. Chung, P. R. Shearing, N. P. Brandon, S. J. Harris and R. E. García, Journal
of The Electrochemical Society, 161, A422 (2014).

94
46. Y.-T. Cheng, M. Verbrugge and R. Deshpande, in IUTAM Symposium on Surface
Effects in the Mechanics of Nanomaterials and Heterostructures, A. Cocks and J.
Wang Editors, p. 203, Springer Netherlands (2013).
47. R. Deshpande, M. Verbrugge, Y. T. Cheng, J. Wang and P. Liu, Journal of the
Electrochemical Society, 159, A1730 (2012).
48. J. Li, E. Murphy, J. Winnick and P. A. Kohl, Journal of Power Sources, 102, 302
(2001).
49. M. Wachtler, J. O. Besenhard and M. Winter, Journal of Power Sources, 94, 189
(2001).
50. S. Renganathan, G. Sikha, S. Santhanagopalan and R. E. White, Journal of the
Electrochemical Society, 157, A155 (2010).
51. R. E. Garcia, Y. M. Chiang, W. C. Carter, P. Limthongkul and C. M. Bishop,
Journal of the Electrochemical Society, 152, A255 (2005).
52. K. J. Zhao, M. Pharr, J. J. Vlassak and Z. G. Suo, Journal of Applied Physics, 108
(2010).
53. S. Santhanagopalan, Q. Z. Guo, P. Ramadass and R. E. White, Journal of Power
Sources, 156, 620 (2006).
54. V. Ramadesigan, P. W. C. Northrop, S. De, S. Santhanagopalan, R. D. Braatz and
V. R. Subramanian, Journal of the Electrochemical Society, 159, R31 (2012).
55. J. Deng, G. J. Wagner and R. P. Muller, Journal of the Electrochemical Society,
160, A487 (2013).
56. K. Jagannathan and K. Raghunathan, Journal of the Electrochemical Society, 159,
A26 (2012).
57. L. Cai, Y. L. Dai, M. Nicholson, R. E. White, K. Jagannathan and G. Bhatia,
Journal of Power Sources, 221, 191 (2013).
58. S. Santhanagopalan, Q. Zhang, K. Kumaresan and R. E. White, Journal of the
Electrochemical Society, 155, A345 (2008).
59. G. Sikha, B. N. Popov and R. E. White, Journal of the Electrochemical Society,
151, A1104 (2004).

95
60. J. W. Lee, Y. K. Anguchamy and B. N. Popov, Journal of Power Sources, 162,
1395 (2006).
61. M. Safari, M. Morcrette, A. Teyssot and C. Delacourt, Journal of the
Electrochemical Society, 157, A713 (2010).
62. M. M. Joglekar and N. Ramakrishnan, Journal of Power Sources, 230, 143 (2013).
63. P. Ramadass, B. Haran, R. White and B. N. Popov, Journal of Power Sources, 123,
230 (2003).
64. G. Ning, R. E. White and B. N. Popov, Electrochimica Acta, 51, 2012 (2006).
65. M. Safari, M. Morcrette, A. Teyssot and C. Delacourt, Journal of the
Electrochemical Society, 156, A145 (2009).
66. S. Sankarasubramanian and B. Krishnamurthy, Electrochimica Acta, 70, 248
(2012).
67. J. Wang, P. Liu, J. Hicks-Garner, E. Sherman, S. Soukiazian, M. Verbrugge, H.
Tataria, J. Musser and P. Finamore, Journal of Power Sources, 196, 3942 (2011).
68. M. B. Pinson and M. Z. Bazant, Journal of the Electrochemical Society, 160, A243
(2013).
69. R. Narayanrao, M. M. Joglekar and S. Inguva, Journal of the Electrochemical
Society, 160, A125 (2013).
70. J. Shim, R. Kostecki, T. Richardson, X. Song and K. A. Striebel, Journal of Power
Sources, 112, 222 (2002).
71. Y. C. Zhang and C. Y. Wang, Journal of the Electrochemical Society, 156, A527
(2009).
72. P. Ramadass, B. Haran, R. White and B. N. Popov, Journal of Power Sources, 112,
606 (2002).
73. P. Ramadass, B. Haran, R. White and B. N. Popov, Journal of Power Sources, 112,
614 (2002).
74. E. Prada, D. Di Domenico, Y. Creff, J. Bernard, V. Sauvant-Moynot and F. Huet,
Journal of the Electrochemical Society, 160, A616 (2013).

96
75. Y. Xie, J. Li and C. Yuan, Journal of Power Sources, 248, 172 (2014).
76. M. Ecker, N. Nieto, S. Käbitz, J. Schmalstieg, H. Blanke, A. Warnecke and D. U.
Sauer, Journal of Power Sources, 248, 839 (2014).
77. L. O. Valoen and J. N. Reimers, J. Electrochem. Soc., 152, A882 (2005).
78. M. W. Verbrugge and B. J. Koch, J. Electrochem. Soc., 150, A374 (2003).
79. N. Yabuuchi, Y. Makimura and T. Ohzuku, J. Electrochem. Soc., 154, A314
(2007).
80. Y. Ji and C. Y. Wang, Electrochimica Acta, 107, 664 (2013).
81. Y. Ji, Y. C. Zhang and C. Y. Wang, Journal of the Electrochemical Society, 160,
A636 (2013).
82. T. R. Jow, M. B. Marx and J. L. Allen, Journal of the Electrochemical Society, 159,
A604 (2012).
83. K. M. Shaju, G. V. S. Rao and B. V. R. Chowdari, Journal of the Electrochemical
Society, 151, A1324 (2004).
84. T. L. Kulova, A. M. Skundin, E. A. Nizhnikovskii and A. V. Fesenko, Russian
Journal of Electrochemistry, 42, 259 (2006).
85. B. G. Kim, F. P. Tredeau and Z. M. Salameh, in Power and Energy Society General
Meeting - Conversion and Delivery of Electrical Energy in the 21st Century, p. 1,
IEEE, Pittsburgh, PA (2008).
86. X. Zhao, G. Zhang, L. Yang, J. Qiang and Z. Chen, Journal of Thermal Analysis
and Calorimetry, 104, 561 (2011).
87. H. Zheng, J. Li, X. Song, G. Liu and V. S. Battaglia, Electrochimica Acta, 71, 258
(2012).
88. M. Wang, J. Li, X. He, H. Wu and C. Wan, Journal of Power Sources, 207, 127
(2012).
89. P. P. Mukherjee, S. Pannala and J. A. Turner, in Handbook of Battery Materials,
2nd ed., C. Daniel, J. O. Besenhard, Editors, p. 841, Wiley-VCH Verlag GmbH
&Co. KGaA, Weinheim, Germany (2011).
97
90. P. Barai and P. P. Mukherjee, Journal of the Electrochemical Society, 160, A955
(2013).
91. M. Guo, G. Sikha and R. E. White, Journal of the Electrochemical Society, 158,
A122 (2011).
92. X. K. Lin, J. Park, L. Liu, Y. Lee, A. M. Sastry and W. Lu, Journal of the
Electrochemical Society, 160, A1701 (2013).
93. P. Ramadass, B. Haran, P. M. Gomadam, R. White and B. N. Popov, Journal of the
Electrochemical Society, 151, A196 (2004).
94. O. Y. Egorkina and A. M. Skundin, Journal of Solid State Electrochemistry, 2, 216
(1998).
95. H. H. Zheng, J. H. Qin, Y. Zhao, T. Abe and Z. Ogumi, Solid State Ionics, 176,
2219 (2005).
96. K. Nakamura, H. Ohno, K. Okamura, Y. Michihiro, I. Nakabayashi and T.
Kanashiro, Solid State Ionics, 135, 143 (2000).
97. R. Moshtev and B. Johnson, Journal of Power Sources, 91, 86 (2000).
98. G. Ning, B. Haran and B. N. Popov, Journal of Power Sources, 117, 160 (2003).
99. Q. Zhang and R. E. White, Journal of Power Sources, 179, 793 (2008).
100. S. K. Rahimian, S. C. Rayman and R. E. White, Journal of the Electrochemical
Society, 157, A1302 (2010).
101. R. Gogoana, M. B. Pinson, M. Z. Bazant and S. E. Sarma, Journal of Power
Sources, 252, 8 (2014).
102. A. M. Colclasure, K. A. Smith and R. J. Kee, Electrochimica Acta, 58, 33 (2011).
103. M. A. McArthur, S. Trussler and J. R. Dahn, Journal of the Electrochemical
Society, 159, A198 (2012).
104. J. Christensen and J. Newman, Journal of the Electrochemical Society, 151,
A1977 (2004).