implicit associations with regard to alcohol abuse among...
TRANSCRIPT

Bachelor thesis Safety and Health Stephan Verroen, s0125725
1 | P a g e
Implicit associations with regard to alcohol abuse among the mild
intellectual disabled. An explorative study.
Stephan Verroen
Abstract
Alcohol abuse among people with an
intellectual disability can pose several threats.
Behavioural problems like criminal behaviour,
antisocial and aggressive behaviour are all
related to alcohol usage. Furthermore, current
explicit measurements cannot easily be used in
relation to the cognitive, social and practical
problems. Based on current research, implicit
association tests like the Approach Avoidance
Test can give new insights in addiction among
people with an intellectual disability. These
studies indicate that, when using an approach
avoidance task, group differences between high
alcohol drinkers, social drinkers and non
drinkers can be found. This study investigates
the feasibility of an implicit association test
among people with an intellectual disability.
Method. Among eleven respondents the
AAT was conducted. To measure the feasibility,
an observational checklist was used.
Furthermore, a student control group was used
to compare the test outcomes. Internal
consistency and group differences were
calculated.
Results. Joystick handling seemed a
problem among some of the respondents with an
intellectual disability. Internal consistency was
high among both PWaID and students. Group
differences were not found among the people
with an intellectual disability nor among the
student group.
Key words: Intellectual Disabillity, AAT, implicit
associations, alcohol, addiction
Introduction
Alcohol abuse among people with
an Intellectual Disability (PWaID) can be
seen as a serious problem, since it is
related to several serious complications.
That is, research indicates that PWaID
that are familiar with alcohol abuse tend
to score high on criminal behavior,
greater use of illicit substances
(McGillivray & Moore, 2001; Poldrugo,
1998) and more aggressive and antisocial
behaviour (Didden, Embrechts, van der
Toorn & Naarhoven (2009). According to
Poldrugo (1998), offenders with an
intellectual disability are highly
represented in prison. About half of these
criminal offenders are related to alcohol
abuse. Interestingly, PWaID that show
alcohol abusive behaviour tend to be
better informed about the side effects of
the substances (McGillivray & Moore,
2001; Poldrugo, 1998) than non-drinkers
(Didden, Embregts, van der Toorn &
Laarhoven, 2009). However, research is
not decisive on the direction of the
relationship between criminal behaviour
and the degree of substance use and
knowledge. Whether high levels of
criminal behaviour lead to high levels of

Bachelor thesis Safety and Health Stephan Verroen, s0125725
2 | P a g e
substance use and knowledge, or whether
the direction of this relationship is in the
opposite direction, remains unclear
(McGillivray & Moore, 2001). Further
research is necessary to determine the
direction of this relationship.
Besides the behavioural problems
regarding alcohol abuse, risks related to
the actual alcohol using behaviour are
significant among PWaID. Alcohol and
smoking are identified by the World
Health Organisation (2002) as two of the
most significant behavioural risks to
health. Research shows that PWaID are at
higher risk for substance abuse and
addiction (Moore & Polsgrove, 1991) and
may also be more vulnerable to the risk
of experiencing negative side effects as a
result of the drug use (McGillivray &
Moore, 2001). Additionally, evidence
exists that heavy alcohol usage has
serious negative effects on the wellbeing
of the consumer. Serious alcohol use over
years is related to the higher risk of
bowel, throat and oesophagus cancer,
liver and gastrointestinal disease, ulcers;
pancreatitis; strokes; heamatogical
disorders; and muscular and edocrine
disoders (Davidson, 1989; National
Institute on Alcohol Abuse & Alcoholism,
1997; Regan, 1990)., cited in Degenhardt,
2000). Moreover, in relation to alcohol
abuse, bio-medical factors such as a
compromised tolerance to substances
(Rimmer, Braddock & Marks, 1995) and a
negative influence of the combination of
medication and alcohol (McGillivray &
Moore, 2001) result in several risks for
PWaID.
Among PWaID, drinking rates are
highest among people living in group
homes or boarding houses (Degenhardt,
2000). Within these homes, clients live
with each other in a group. These clients
are more independent, are given more
freedom and have less supervision. With
these privileges they are easier exposed
to alcohol temptations. Furthermore,
without direct supervision clients can
drink at home or at their own rooms.
Based on research done by Rimmer,
Braddock & Marks (1995), these clients
are at higher risk of the use and misuse of
alcohol. Moreover, among the actual
problem drinkers, problems resulting
from the drinking were higher than
compared to the non-disabled (Edgarton,
1995). Additionally, PWaID are more
susceptible to social pressure (Zachofsky,
Reardon & O’Connor, 1974). PWaID tent
to score lower on a self-esteem scale and
have an impaired self-regular behaviour
(Didden, Embregts, van der Toorn &
Laarhoven, 2009), leaving them more
vulnerable to drug and alcohol influences.
Within the domain of health
research, little is known about the actual
quantification of alcohol drinking
behavior among PWaID (Taggart,
Mclaughlin, Quinn & Milligan, 2006;
Didden, Embregts, van der Toorn &
Laarhoven, 2009). Available research

Bachelor thesis Safety and Health Stephan Verroen, s0125725
3 | P a g e
suggests that alcohol drinking and the
usage of other substances among PWaID is
relatively low when compared to the non-
disabled (Edgarton, 1986; Degenhardt,
2000). Based upon the guidelines set up
by the Trimbos Instituut (Netherlands
Institute of Mental Health and Addiction),
alcohol drinking is considered as a
problem, when more than 20 alcohol
consumptions per week or 1 binge drink
(6 alcoholic drinks per event) per 2 weeks
are consumed. However, it should be
noted that difficulties arise when
comparing drinking behaviour among
PWaID to the drinking behaviour of non-
disabled people. Research done by
Westermeyer, Kemp & Nugent (1996)
suggests a lower threshold within alcohol
abuse among PWaID. They state that,
among PWaID with an alcohol drinking
disorder, the amount of alcohol
consumption is significantly lower than
compared to the non-disabled. So, when
comparing quantifications of alcohol
consumption between PWaID and a non-
disabled population, it is difficult to set
an actual ‘problem’ amount of alcohol.
Based on the problems and risks
related to alcohol usage among PWaID, it
seems odd that no accurate figures exist
about the range of the problem. Based on
the studies of Christian & Poling (1997)
and Mcgillicuddi & Blane (1999) cognitive
capacities may play a crucial role. PWaID
did not have an adequate level of reading
skills, comprehension and abstract
reasoning to undergo the regular alcohol
treatment and therapy (Christian &
Poling, 1997). Also, social skill deficits
were highlighted as a major problem in
regular therapy and prevention, as being
a significant problem in group counseling.
According to these limitations, PWaID
could experience serious limitations with
regard to the interventions compared to
the normal populations.
In conclusion, alcohol usage or,
moreover, alcohol abuse is a serious
problem under PWaID. Behavioural
problems like criminal behaviour,
antisocial and aggressive behaviour are
all related to alcohol usage. Furthermore,
beside the general side effects of alcohol
usage, PWaID seem more vulnerable to
these side effects. When trying to make
estimations on the actual size of the
problem, cognitive and social problems
within the PWaID make the use of general
methods difficult. Nonetheless, it seems
reasonable to quantify the problems with
substance use among PWaID.
Generally in health psychology,
when trying to asses this kind of
information, research starts with
identifying the cognitive factors
underlying substance use and addiction
(Rooke, Hine & Thorsteinsson, 2008). The
basic assumption, on which a lot of this
research is build, is that these cognitive
factors could be measured using
instruments tapping into the
introspective, explicit decision making

Bachelor thesis Safety and Health Stephan Verroen, s0125725
4 | P a g e
factors (Rooke, Hine & Thornsteinsson,
2008). Based on the classical cognitive
models like the Theory of Planned
Behaviour (TPB) (Ajzen, 1991), the Health
Belief model (Becker, 1974) and the
Protection Motivation Theory (Rogers,
1983) addiction can be explained using
introspective determinants. For instance,
from the TPB, addiction can be explained
using perceived behavioural control,
social norm and attitude. These
determinants can be measured using
questionnaires which are aimed at
assessing the explicit knowledge the
person has on the relevant determinants.
As a result, the scores on the classic
models show a pure explicit measurement
on addiction.
Based on new dual process models
by Wiers & Stacy (2006), addiction can be
explained by an interaction between
explicit cognitive models, such as the
TPB, but also by implicit models.
Furthermore, research suggest that these
implicit models play a large role in the
maintenance of the addictive behaviour
(Munafó en Albery, 2007; Gerrard,
Gibbons, Houlihan, Stock & Pomery,
2007). These implicit models claim that
addiction is influenced by the implicit
associations with regard to substances.
These implicit associations related to
substances are explained as an impulsive
urge to the addictive behaviour.
Loewenstein (1996) stated that drug use
is explained by uncontrolled, visceral
urges, which overrules the explicit ratio.
With regard to abuse, this can be
explained as a subconscious preference
towards alcohol related phenomena.
Within the implicit association tests,
several tests are developed, all tapping
into the subconscious mind of the
respondents. In most of these studies
relevant stimuli were presented, e.g.
determinant-relevant stimuli versus
opposite stimuli, according to verbal or
pictorial ques. In most of these studies,
the reaction times that are recorded are
the dependent variable. Furthermore,
Wiers and Stacy (2006), state several
advantages with assessing implicit
association in relation to addiction. First,
it goes beyond the traditional view of
assessing addiction determinants using
introspective, explicit models. Second,
implicit cognitions are far less, or not at
all sensitive to social desirability. Third,
the implicit cognitions can help explain
the unexplained factors in addictive
behaviour, such as the discrepancy
between the addictive behaviour and the
logics of the ratio. Fourth and final,
Rooke, Hine & Thornsteinsson (2008)
state that the use of both implicit and
explicit cognitions can close the gap
between social psychology, cognitive
psychology and cognitive neuroscience.
Rinck & Becker (2007) developed an
implicit association test based on
approach and avoidance. The Approach
Avoidance Task has been used in a variety

Bachelor thesis Safety and Health Stephan Verroen, s0125725
5 | P a g e
of studies. For instance, promising results
were found to measure attitude toward
spiders and smoking.
In this Approach Avoidance Task,
participants are presented pictures of
determinant relevant stimuli and the
opposite of this determinant, like alcohol
versus soda, on a computer screen.
Furthermore, in the AAT on-screen
determinant relevant pictures should be
pushed or pulled with a given joystick,
simulating an approach (pulling) and
avoidance (pushing) reaction towards the
stimuli. Moreover, using the joystick, the
approach and avoidance simulation is
enhanced in making an approaching arm
movement like pulling, and avoiding arm
movement like pushing (Palfai, 2006).
Also, to enhance the approach and
avoidance tendency, a zooming feature is
added to the reaction on screen. For
example, when reacting in an avoiding
way, one pushes the joystick away and
the onscreen stimulus is made smaller on
screen, vice versa in the approach
stimulus. To make a distinction between
approaching and avoiding, a stimulus like
a colored border or a tilted picture is
added to give the respondent a cue for
the correct response to the picture of the
determinant. So for example, a blue
border is given to an approach (pull) trial,
and a yellow border is given to an
avoidance (push) trial. In case of the
alcohol versus soda example, two types of
alcohol-stimuli (yellow and blue
bordered) and two types of soda-stimuli
are used. The reaction time of the given
stimuli was measured and calculated in
mean reaction times. Basic assumption of
the AAT is that, based on the content of
the determinant at hand, a preference
towards approach or avoidance could be
measured. In case of the alcohol-relevant
pictures, people with a high level of
alcohol consumption should show a
preference towards approaching the
alcohol stimuli (Wiers & Stacy, 2006).
At this time in research, no attempt
has been made to use an implicit
association test among PWaID. When
looking at the promising results that have
been made among a non-disabled
population, and the need for a
measurement to quantify alcohol
consuming problems among PWaID, the
AAT seems to be a good direction in
research. Related to PWaID, the AAT
overcomes most problems that come with
regular measurement. Through tapping
into the associations that people have
with the different pictures of alcohol and
soda, no social skills, reading skills and
limited comprehension skills are needed.
Therefore, the AAT seems to overcome
most of the limitations that arise with
explicit measures.
In conclusion, the main research
question of this study is to test whether
or not the AAT can be used as a
measurement device for PWaID. To do so,
first a feasibility study is conducted to

Bachelor thesis Safety and Health Stephan Verroen, s0125725
6 | P a g e
test whether the test can be carried out
by PWaID. Furthermore, output data are
analyzed to further test the usability.
Because no research exists on this
subject, no real estimation about the
effect size of the implicit association can
be made. Moreover, no data exists about
the extent of usability of the AAT among
PWaID. This study tries to give a first look
at the feasibility of the AAT among an
intellectual disabled group. Because of
the lack of generalisability between ID-
groups and non-disabled groups, all data
used in the non-disabled AAT used by
Wiers et al (2008) should be validated for
the PWaID-group. Based on the possible
limited attention span and the limited
cognitive comprehension of the PWaID,
the practical usability of the AAT should
be measured. Based on the practical use
of the AAT, these key points can be
subdivided into four key elements.
Although the AAT does not require a lot
of instruction or explanation, the limited
cognitive capacity of the PWaID could be
a problem for the basics of the AAT.
When instructions are forgotten, this
could seriously affect the test outcomes.
Therefore, at first overall test
understanding should be measured.
Furthermore, due to the length of the
test and confrontation with errors,
attention span and frustration tolerance
are of importance. These two points are
strong related. Due to the length of the
test, more errors can be made due to the
possible low attention span among
PWaID. These errors can cause the PWaID
to get more aroused and therefore
experience less frustration tolerance.
Furthermore, one of the most important
aspects of the AAT is the usage of a
joystick. Due to the multiple actions that
are needed to operate the joystick (e.g.
the usage of the trigger button at the
correct moment, movement and
centering of the joystick in reaction to
stimuli), difficulties could arise when not
performed correctly. Finally, general
likeability of the test should be high.
Because the test is only used among a
general population, no real indication of
the likability of an implicit test can be
made. Because of the usage of the
joystick and computer game interface of
the test, high likeability is expected.
“Essence of this paper is to check
whether potential observational problems
lead could lead to biased results in
relation to AAT scores.”
To further test the usability of the AAT
among PWaID, scores from PWaID are
compared to scores from a non-disabled
population. As successfully used in the
study of Wiers, Rink, Dictus & van den
Wildenberg (2008), a student control
group is formed. Therefore, we conduct
the next hypothesis:

Bachelor thesis Safety and Health Stephan Verroen, s0125725
7 | P a g e
H1: Internal consistencies between
stimuli are the same for PWaID as for the
control group
Based on research done by Wiers,
Rinck, Dictus & van den Wildenberg
(2008) and Palfai & Ostafin (2003) the
AAT proved to be a sufficient predictor of
alcohol using behaviour among a non-
disabled population. Those studies
showed that respondents with high
alcohol usage show an approach
preference toward the alcohol stimuli.
Respondents without this high alcohol
usage did not show this preference. Thus,
when using the AAT as quantification
measurement, based on the results of a
non-disabled population, a distinction can
be made between people with high
alcohol consuming behaviour, and people
without high levels of alcohol consuming
behavour. From this, we deduce the
second hypothesis:
H2a: Between group differences on
heavy alcohol drinkers and non heavy
alcohol drinkers exist between alcohol
and soda RT’s
Especially differences on pull
reactions are of interest; therefore, we
deduce the following hypothesis
H2b: Heavy alcohol drinking groups
differ in alcohol pull reactions from non
heavy drinking groups.
Method Alcohol use
As in the study of Wiers, Rinck,
Dictus & van den Wildenberg (2008) a
self-report questionnaire was used to
validate the actual alcohol use among the
student group. This self-report
questionnaire (Appendix I) was based on
the Alcohol questionnaire used by the
Trimbos Institution which proved to be a
good predictor of actual drinking
behaviour. Participants were asked about
their every day drinking behaviour over
the last week. They were asked whether
they consumed an alcoholic consumption,
the amount of standard sized
consumptions, on which day they
consumed it and what the reason for the
occasion was.
In current research, no valid
questionnaire about the drinking
behaviour of PWaID is available. To get a
reliable estimation of the actual drinking
behaviour for the PWaID group, two
different questionnaires were used. For
the PWaID group (Appendix II), the same
questionnaire structure as for the
students was used, but it was simplified
to meet the participant’s level of
vocabulary. The second questionnaire
(Appendix III) was filled in by the personal
supervisors of the participants. Goal of
this supervisor-questionnaire was to get
an estimation of the drinking behaviour
from the person closest to the

Bachelor thesis Safety and Health Stephan Verroen, s0125725
8 | P a g e
participant. As an addition to the alcohol
questionnaire of the supervisor, a
question about the IQ-score of the client
was added. Afterwards, the alcohol
consumption resulting from the client-
questionnaire was compared to the
estimation made by the supervisors of the
clients. Based on the amount of
discrepancy between both questionnaires,
no participants were excluded.
Participants
Non-disabled participants were
recruited from Twente University. Two
groups were formed; heavy drinkers, and
not heavy drinkers (social drinkers + non
drinkers). Participants were recruited
through e-mail invitation and publicity
during lunch breaks. The e-mail and
publicity contained information about the
study and the task to be performed.
Furthermore, inclusion and exclusion
criteria were presented. Inclusion criteria
for the heavy drinkers were, drinking 20
or more standard alcoholic drinks per
week, including at least one binge
(drinking more than 6 alcoholic drinks at
one event) for the past 2 weeks. Inclusion
criteria for the social drinkers were,
drinking less than 20 standard alcoholic
drinks per week, without a binge in the
past 2 weeks. Furthermore, non drinkers
did not drink at all in the last 2 weeks.
Exclusion criteria for both of the groups
were dyslexia and colorblindness.
Furthermore, error (incorrect response to
the cue) was calculated. Respondents
with an error of more than 25% were
excluded. In total 11 non disabled
participants were included in the test.
From these eleven respondents, 3
respondents were heavy drinkers, 5
respondents were social drinkers, and 3
respondents did not drink at all. No non
disabled respondents were excluded.
Average error on the task in the non
disabled group was 9.6%.
PWaID were recruited from three
institutions for people with an
intellectual disability in Enschede,
Groesbeek and Zutphen. As with the
student group, two groups were formed;
heavy drinkers/ not heavy drinkers.
Because of the delicate subject for the
clients of the institution, a subtle way of
approaching the clients of the institutions
was needed. To get a reliable insight in
the drinking habits of the clients, direct
supervisors of the clients of the
institution were asked to estimate the
amount of drinking of the different
clients. Based on this, participants were
divided among the 2 groups. Inclusion/
seclusion criteria were the same as for
the student group. In total 11 participants
were included in the test. From these
eleven respondents, 2 respondents were
heavy drinkers, and 9 respondents were
not heavy drinkers of did not drink at all.
Based on the error, three respondents
were excluded from the non-drinking
group, due to >25% error. Average error
Bachelor thesis Safety and Health Stephan Verroen, s0125725
9 | P a g e
on the task in the PWaID group was
23.4%.
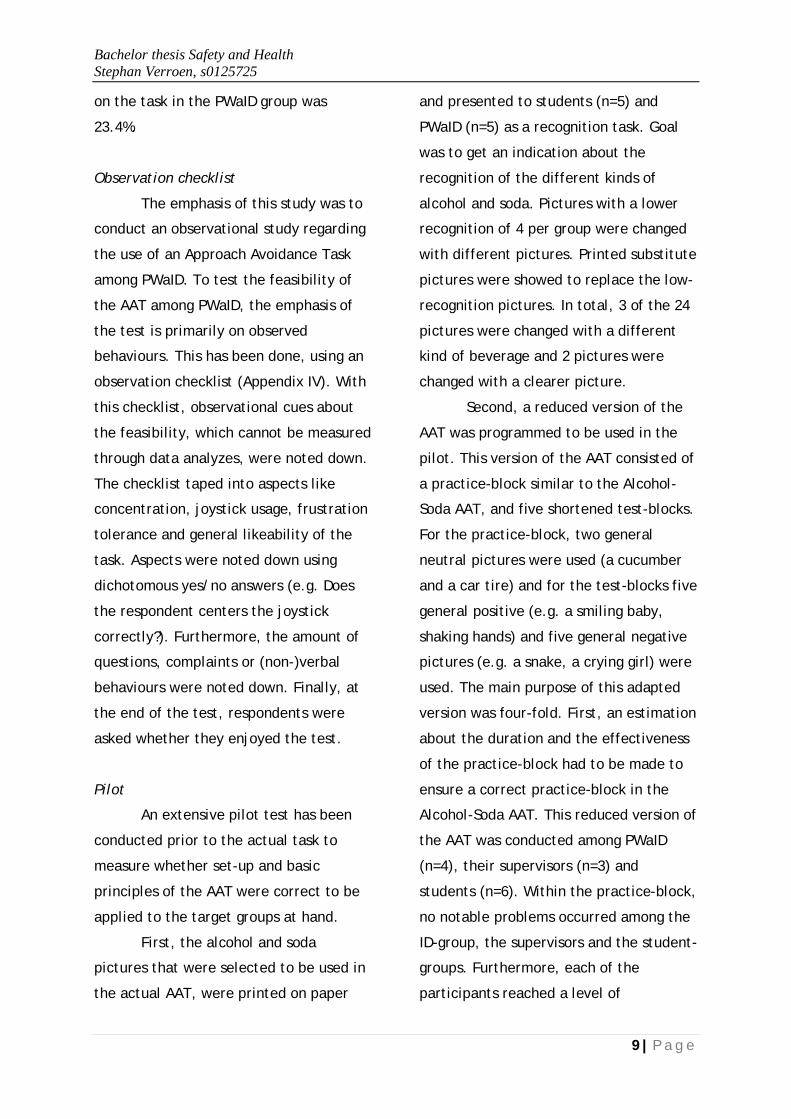
Observation checklist
The emphasis of this study was to
conduct an observational study regarding
the use of an Approach Avoidance Task
among PWaID. To test the feasibility of
the AAT among PWaID, the emphasis of
the test is primarily on observed
behaviours. This has been done, using an
observation checklist (Appendix IV). With
this checklist, observational cues about
the feasibility, which cannot be measured
through data analyzes, were noted down.
The checklist taped into aspects like
concentration, joystick usage, frustration
tolerance and general likeability of the
task. Aspects were noted down using
dichotomous yes/no answers (e.g. Does
the respondent centers the joystick
correctly?). Furthermore, the amount of
questions, complaints or (non-)verbal
behaviours were noted down. Finally, at
the end of the test, respondents were
asked whether they enjoyed the test.
Pilot
An extensive pilot test has been
conducted prior to the actual task to
measure whether set-up and basic
principles of the AAT were correct to be
applied to the target groups at hand.
First, the alcohol and soda
pictures that were selected to be used in
the actual AAT, were printed on paper
and presented to students (n=5) and
PWaID (n=5) as a recognition task. Goal
was to get an indication about the
recognition of the different kinds of
alcohol and soda. Pictures with a lower
recognition of 4 per group were changed
with different pictures. Printed substitute
pictures were showed to replace the low-
recognition pictures. In total, 3 of the 24
pictures were changed with a different
kind of beverage and 2 pictures were
changed with a clearer picture.
Second, a reduced version of the
AAT was programmed to be used in the
pilot. This version of the AAT consisted of
a practice-block similar to the Alcohol-
Soda AAT, and five shortened test-blocks.
For the practice-block, two general
neutral pictures were used (a cucumber
and a car tire) and for the test-blocks five
general positive (e.g. a smiling baby,
shaking hands) and five general negative
pictures (e.g. a snake, a crying girl) were
used. The main purpose of this adapted
version was four-fold. First, an estimation
about the duration and the effectiveness
of the practice-block had to be made to
ensure a correct practice-block in the
Alcohol-Soda AAT. This reduced version of
the AAT was conducted among PWaID
(n=4), their supervisors (n=3) and
students (n=6). Within the practice-block,
no notable problems occurred among the
ID-group, the supervisors and the student-
groups. Furthermore, each of the
participants reached a level of
Bachelor thesis Safety and Health Stephan Verroen, s0125725
10 | P a g e
experience well enough to carry out the
test.
Besides the efficiency, duration
and recognition, also more practical
matters were checked during the pilot.
First of all, the angle and view towards
the laptop-screen was checked to ensure
a clear view. No problems in relation to
the angle of the screen were found, but
pictures were presented in the left side
of the screen. Alterations were made
with regard to the screen-resolution, to
center the pictures that were presented.
Furthermore, the usability of the Logitech
Attack 3 joystick was tested. Problems
occurred when respondents pushed or
pulled the stick roughly, which resulted in
a small turn-over of the joystick. This
turn-over itself could return as an error in
the RT. Alterations were made to
overcome this problem.
Approach-avoidance task
A new variety of the Approach-
avoidance task of Rinck & Becker (2007)
was used to measure the effects among
the different groups. Basic elements, like
the joystick usage, zooming effect and
the test lay out were maintained. As a
cue to push or pull, a blue or yellow outer
glow following the contours of the picture
was chosen as a stimulus. Furthermore,
certain adaptations towards the target
groups were made. First of all, the visible
background used in prior AAT’s was
replaced by a black background color,
resulting in a stimuli-picture only
appearance on the screen. Without the
visible background, fewer distractions
could intervene with the reaction times.
Moreover, the practice block was
extended to improve the capability of the
respondents in coping with the test. The
practice block consisted of 40 trials, ten
times pull stimuli, ten times push stimuli,
10 times push-pull-push-pull and 10 times
randomization. Five different types of
general neutral pictures were used. As
showed in the pilot test, the practice
phase proved to be sufficient.
The test phase consisted of five,
randomized blocks of stimuli. Four
different kinds of alcohol were used:
beer, wine, strong liquor and mix-drinks.
From each kind of alcohol, three
different kinds of pictures were chosen.
Twelve soda pictures were chosen to
replicate the shape and color of the
alcohol pictures in the best way. As
showed in the pilot test, recognition of
the different kind of pictures high. For
each of the 24 alcohol and soda pictures,
a yellow outer glow picture and a blue
outer glow picture was made, resulting in
48 different stimuli. Each test-block
consisted of all the 48 pictures that were
available. Thus, in the five test-blocks,
240 trials were presented. During the test
phase, between blocks two and three, a
short pause was presented.
Finally, within the output, error
reaction and RT’s > 2 SD on pictures were

Bachelor thesis Safety and Health Stephan Verroen, s0125725
11 | P a g e
excluded from the test. Furthermore, to
control for any cue effect, a general
(yellow border = push, blue border = pull)
and a counterbalanced group (yellow
border = pull, blue border = push) were
formed. These groups should be
compared to control for any cue effects.
Results
Descriptive statistics
Table 1 shows the mean scores and
standard deviations of the different mean
RT scores of both the student group and
the PWaID group after excluding error
and outliers. For more detailed
information about the RT on the different
pictures, an extended table is added to
Appendix V (PWaID) and Appendix VI
(Students). As can be seen in both table 1
and Appendix V, for the PWaID group, the
spread of the mean scores and standard
deviations is high. This could indicate low
consistency between the different
respondents. For the student group,
normal scores were obtained indicating
higher levels of consistency.
Table 1: Descriptives PWaID (n=8) – Average Alcohol and Soda (error + outliers excluded)
Stimuli Min Max Mean Standard Deviation
Average
Alcohol
Pull
631,50 924,50 793,27 90,94
Average
Alcohol
Push
640,58 922,42 803,24 103,99
Average
Soda Pull
657, 67 876,17 787,22 84,90
Average
Soda Push
658,58 1015,08 818,44 127,13

Bachelor thesis Safety and Health Stephan Verroen, s0125725
12 | P a g e
Table 2: Descriptives Students (n=11) – Average RT & Relative score (error + outliers excluded)
PWaID
Feasibility
To test whether the AAT can be used
among PWaID, a feasibility test was
conducted. An observation checklist was
established in order to monitor whether
PWaID were able to execute the task at
hand and to see whether, and which
problems occurred during the test. The
observation checklist consisted of scores
that were given to five relevant
categories; test understanding,
frustration tolerance, attention span,
joystick handling and general likability.
Given scores can be found in table 2.
When a person performed excellent, no
checks were made on the observation
checklist indicating no problems on the
category. When overall performance was
well, incidental checks were made on the
checklist. For instance, respondent 101
had two complaints about the duration of
the test, but did not show any fatigue or
other discomfort. Respondents showing
overall positive behaviour, but also
reporting negative effects due to the test
were labeled as ‘ok’. For instance,
respondent 201 had multiple complains
about the test and the errors that were
made. This resulted in a somewhat
heightened level of frustration.
Respondent 102 stopped several times
during the test, due to frustration. This
had a somewhat negative effect on the
test results and thus was labeled ‘not ok’.
Serious negative effects were labeled as a
bad performance. For instance,
respondent 202 showed serious
disturbance on frustration tolerance and
test understanding, leading in serious
negative effects for the test results.
Furthermore, respondent 203 had serious
tremors, resulting in disturbed joystick
handling.
As can be seen in table 3, test
understanding, frustration tolerance,
attention span and general likeability did
not result in any problems for included
Stimuli Min Max Mean Standard Deviation
Average
Alcohol
Pull
554,33 735,67 616,67 51,48
Average
Alcohol
Push
568,83 756,00 614,68 57,19
Average
Soda Pull
567,83 781,00 622,56 59,05
Average
Soda Push
578,58 719,42 619,97 40,91

Bachelor thesis Safety and Health Stephan Verroen, s0125725
13 | P a g e
respondents. Respondents were able to
understand the general purpose of the
test, did not show any major problems in
frustration tolerance or attention span,
and all respondents liked the test.
However, the joystick handling among
PWaID was somewhat problematic. For
62.5% of all included respondents with an
ID, the joystick handling resulted in some
kind of problem. The joystick handling
problems resulted from the incorrect
usage of the trigger button (for instance,
multiple clicks when only one click was
needed). Although this incorrect usage in
essence should not lead to biased results,
it may have contributed in the frustration
tolerance and therefore did influence the
results. Furthermore, respondents 105,
201 and 203 showed difficulties in correct
centering of the joystick, resulting in a
more ‘pull’ oriented position of the
joystick. Multiple adjustments, like the
joystick – desk positioning and extra
advice about the joystick handling, had to
be made by the experiment leader to
overcome this problem. The problem
could not have been corrected with
respondent 203.
Table 3: Observation Checklist
* Respondents were excluded due to > 25% error rates ++ Respondent performed excellent + Respondent performed well +- Respondent performed ok - Respondent did not perform ok -- Respondent performed badly
When comparing respondents 101 and 204
(proper joystick handling) with
respondents 103, 105 and 201 (incorrect
joystick handling) differences can be seen
in RT (figure 1, 2 and 3 show RT’s of
respondent 101, 103 and 306, for more
details see Appendix VII). Respondents
that were able to handle the joystick
Respondent Test
understanding
Frustration
Tolerance
Attention
Span
Joystick
Handling
General
Likeability
101 ++ ++ + ++ ++
102* ++ - - +- +
103 ++ ++ + +- ++
104 ++ ++ ++ ++ ++
105 + ++ ++ - ++
201 + +- + - ++
202* -- -- - - +-
203* + + + -- +
204 ++ ++ ++ ++ ++
205 ++ ++ ++ ++ ++
206 ++ - - - +

Bachelor thesis Safety and Health Stephan Verroen, s0125725
14 | P a g e
properly, showed lower RT’s than the
other respondents. This indicates that
there could be a correlation between the
joystick handling and RT.
Figure 1) Respondent 101 (proper joystick handling)
Figure 2) Respont 103 (incorrect joystick handling)
Figure 3) Respondent 405 (student)

Bachelor thesis Safety and Health Stephan Verroen, s0125725
15 | P a g e
Furthermore, when compared to the
control group (students), RT’s of the
PWaID that showed incorrect joystick
handling were much higher. However,
PWaID with a proper joystick handling did
not (all) show large differences.
Furthermore, figure 4 shows the alcohol
push scores of respondents 101 and 104
(PWaID with correct joystick handling),
103, 105 and 201 (PWaID with incorrect
joystick handling) and 306 and 405
(students).
As can be seen, PWaID with incorrect
joystick handling showed higher RT’s in
push scores, when compared to PWaID
with correct joystick handling and
students. For the soda push stimuli, the
same result can be found (see Appendix
VIII). Because no differences can be found
between the pull scores of both the
alcohol stimuli (Appendix IX) and soda
stimuli (Appendix IX), the incorrect
joystick handling could account for the
differences in scores. For instance, the
improper joystick centering could explain
this pulling preference. For instance, as
can be seen in figure 5, respondent 105
tends to score higher on push stimuli than
on pull stimuli. Due to the pull
preference in joystick positioning (as
described above), pull stimuli seem to
have an advantage over push stimuli,
resulting in low pull scores versus high
push scores.
Figure 5) Respondent 105 (incorrect joystick handling)

Bachelor thesis Safety and Health Stephan Verroen, s0125725
16 | P a g e

Bachelor thesis Safety and Health Stephan Verroen, s0125725
17 | P a g e

Bachelor thesis Safety and Health Stephan Verroen, s0125725
18 | P a g e
In conclusion, joystick handling seems to
have some influence on the mean RT’s of
all the different pictures used in the AAT.
Because no differences within the
subjects exists between pushing and
pulling, the between subjects differences
cannot be explained by the joystick
handling problems.
As can be seen in figure 4 and
Appendices VII, VIII, no obvious problems
within the respondents arise between
pictures. In addition, to measure the
internal consistency between the
different pictures, a reliability analysis
was conducted to measure Cronbach’s
Alpha.
Cronbach’s Alpha was calculated
for both mean scores of the alcohol (push
and pull) and soda (push and pull)
pictures. Results showed that high
consistency exists among both alcohol
pictures (pull α = 0.80; push drinking
group α = 0.93) and soda pictures (pull α
= 0.88; push α = 0.94).
Moreover, using a one way
ANOVA, based on a mean score of the 12
different alcohol (push / pull) and soda
(push / pull) pictures, group differences
between the general and
counterbalanced group were measured.
Results indicate no significant differences
between alcohol pictures (pull: F(1,6) =
0.49, p = 0.50, push: F(1,6) = 1.26, p =
0.30). Within the soda pictures, no
significant differences exist between the
general and counterbalanced group (pull:
F(1,5) = 0.68, p = 0.44, push: F(1,5) =
3.74, p = 0.101).
Furthermore, to check for
differences between alcohol (push / pull)
and soda (push / pull) pictures between
the heavy alcohol drinking group and the
non heavy drinking group (social drinkers
+ non drinkers), a one way ANOVA was
conducted. No significant differences in
RT’s were found between groups in
alcohol (pull F(1,6) = 0.79, p = 0.40; push
F(1,6) = 1.87, p = 0.221) and soda
pictures (pull F(1, 6) = 2.01, p = 0.19;
push (F1,6) = 3.6, p = 0.10).
Students
To measure internal consistency
among the different pictures in the
student group, Crohnbach’s Alpha was
calculated. Results indicated high
internal consistency between alcohol
pictures (pull α = 0.90; push drinking
group α = 0.91) and the soda pictures
(pull α = 0.91; push α = 0.85) among the
student group. These results show that all
respondents in the student group scored
evenly on all pictures used within the
AAT.
Furthermore, based on a mean
score of the 12 different alcohol (push /
pull) and soda (push / pull) pictures,
within group comparisons were made
between the general and
counterbalanced group using ANOVA.
Results indicate no significant differences
between alcohol pictures (pull: F(1,9) =

Bachelor thesis Safety and Health Stephan Verroen, s0125725
19 | P a g e
0.23, p = 0.64, push: F(1,9) = 1.99, p =
0.19). Within the soda pictures, no
significant differences exist between the
general and counterbalanced group (pull:
F(1,9) = 0.36, p = 0.56, push: F(1,9) =
0.75, p = 0.40).
Furthermore to check for
differences between alcohol and soda
pictures between the heavy alcohol
drinking group and the non heavy drinking
group (social drinkers + non drinkers) a
one way ANOVA was conducted. No
significant differences in RT’s were found
between groups in alcohol (pull F(1,9) =
1.35, p = 0.28; push F(1,9) = 0.43, p =
0.53) and soda pictures (pull F(1, 9) =
1.5, p = 0.25; push (F1,9) = 0.22, p =
0.65).
Comparison
Based on the within group (PWaID
– students) results, relative AAT scores
did not seem to predict alcohol drinking
behaviour. Moreover, no group
differences were found between mean
alcohol scores (push / pull) or mean soda
scores (push / pull), neither among PWaID
nor among students. Furthermore, high
internal consistency between pictures
was found among students and PWaID.
Based on these findings,
hypothesis 1 is accepted. Furthermore,
based on the group differences,
hypothesis 2a and hypothesis 2b could not
be accepted or even calculated. Due to
the low statistical power, no conclusive
results can be drawn from this.
Discussion
This study examined the feasibility of an
implicit association test, the Approach
Avoidance Task, among people with an
intellectual disability. At first, an
observational checklist was used to
measure practical usability of the test.
Overall, this observation indicated
problems only with joystick handling.
Because of the possibility of biased
results due to this incorrect joystick
handling, results were further examined.
Respondents with joystick handling
problems (all PWaID) showed higher RT’s
on both alcohol and soda pictures (push
and pull). Furthermore, differences
between push and pull results were
observed (see Appendix VII ). Although
this difference could have been the result
of the incorrect joystick centering, these
push and pull differences were not found
within the respondents. Because joystick
problems were related to lower RT’s on
most of the pictures, a relation with
cognitive capacity and the capacity to
correctly carry out the AAT can be made.
Within the AAT, both visual and physical
actions have to be carried out at the
same time. When limited in cognitive
resources, this combination could lead to
difficulties within the AAT. Furthermore,
other explanations can be found in side

Bachelor thesis Safety and Health Stephan Verroen, s0125725
20 | P a g e
effects from medication (tremors),
possible physical discomfort, or
distraction from the experiment leader.
Within this study, the experiment leader
was also in the experiment room, filling
in the observation checklist. In further
research, the experiment leader should
be in a separate room.
Besides the practical feasibility of
the AAT, responses on the pictures were
analyzed. Cronbach’s alpha was
calculated to measure the internal
consistency. Among both PWaID and the
student group, high internal consistency
was found between the different alcohol
and soda pictures. Furthermore, no cue
preference was found between the PWaID
group and the student group.
Furthermore, no group effects
were found, neither among the PWaID-
group nor among the student group,
between the heavy alcohol drinkers,
social alcohol drinkers and the non-
alcohol drinkers. Contrary to Wiers,
Rinck, Dictus & van den Wildenberg
(2009), no pull preferences were found
among the heavy alcohol drinkers
compared to the other groups. Although
small alterations were made in the AAT
like the extended practice phase, cue
stimuli (yellow / blue borders), other
aspects are more likely to have had a
negative influence on the results. At first,
due to the exclusion criteria, only eight
PWaID respondents were used in the
analysis. In the student group, only 11
respondents were included. Furthermore,
from these respondents, two groups were
formed. Based on the alcohol drinking
rates, only two heavy alcohol drinkers
from the PWaID group were selected and
three heavy alcohol drinkers from the
student group were selected. Due to this
low group count, group effects were hard
to find. So, to further analyze the
between group effects, the number of
participants should be enlarged.
In conclusion, one can state that
the AAT cannot be used among an PWaID
group without making the proper
adjustments. First of all, a pilot test has
to be conducted to check for any joystick
handling problems. To overcome basic
joystick handling problems, extended
practice with the joystick handling could
decrease the problems. Furthermore,
respondent specific joystick positioning is
desired to ensure proper functioning and
usability. Moreover, when performing a
repeating task like the AAT, attention
plays a large role. Among PWaID this
could result in boredom or distraction
which will have negative effects on the
reaction times. Therefore, in further
research, AAT duration must be lowered
and distraction has to be limited to (near)
zero. This can be done by lowering the
number of pictures or stimuli groups and
placing the computer in a separate single
room.

Bachelor thesis Safety and Health Stephan Verroen, s0125725
21 | P a g e
References Ajzen, I. (1991). A theory of planned behavior. Organizational Behavior and Human
Decision Processes, 50, pp. 179-211. Christian, L, Poling, A. (1997). Drug abuse in persons with mental retardation: A Review. American journal on mental retardation, 102 (2), pp 126-136 Degenhardt, L., (2000). Interventions for people with alcohol use disorders and intellectual disability: A review on the literature. Journal of Intellectual & Developmental Disability, 25 (2), 135 - 146 Didden, R., Embregts, P., van der Toon, M., & Laarhoven, N., (2009). Substance abuse, coping strategies, adaptive skills and behavioral and emotional problems in clients with mild to borderline intellectual disability admitted to a treatment facility: A pilot study. Research in Developmental Disabilities, 30 (5), pp. 927 – 932 Edgerton, (1986). Alcohol and drug use by mentally retarded adults. American Journal on Mental Deficiency, 90, 602-609. Gerrard, M., Gibbons, F.X., Houlihan, A.E., Stock, M.L., Pomery, E.A. (2007) A dual process approach to health risk decision making. Department of Psychology, Iowa State University USA. Published in: Elsevier, 2007 Loewenstein, G. (1996). Out of control: Visceral influences on behavior. Organizational Behavior and Human Decision Processes, 65, pp. 272−292 Munafó, M.R. & Albery, I.P. (2007) Cognition and addiction. Dutch Journal of Psychiatry 49, 917-917 McGillevray, J.A., & Moore, M.R., (2001). Substance use by offenders with mild intellectual disability. Journal of Intellectual & Developmental Disability, 26,(4), pp. 297–310, Moore, D., & Polsgrove, L. (1991). Disabilities, developmental handicaps and substance misuse: a review. The International Journal of the Addictions, 26(1), 65–90. Palfai, T.P. (2006) Activating action tendencies: the influence of action priming on alcohol consumption among male hazardous drinkers. J Stud Alcohol 67, 926–933. Rinck, M. & Becker, E.S. (2007) Approach and avoidance in fear of spiders. J Behav Ther Exp Psychiatry 38, 105–120. Rimmer, J., Braddock, D., & Marks, B., (1995). Health characteristics and behaviors of adults with mental retardation residing in three living arrangements. Research in Developmental Disabilities, 16, 489-499. Rooke, S.R., Hine, D.W., & Thorsteinsson, E.B., (2008). Implicit cognition and substance use: A meta-analysis. Addictive behaviours, 33, 1314- 1328 Taggart, L., McLaughlin, D., Quinn, B., & Milligan, V., (2006). An exploration of substance misuse in people with intellectual disabilities. Journal of Intellectual Disability Research, 50 (8), 588-597 Tenneij, N., & Koot, H. (2007a). Doelgroep in beeld. Utrecht: De Borg
Bachelor thesis Safety and Health Stephan Verroen, s0125725
22 | P a g e
Wiers R.W & Stacy, A.W (2006). Handbook of implicit cognition and addiction. Thousand Oaks
Wiers, R.W., Rinck, M., Dictus, M., Wildenberg, van den, E. (2009). Relatively strong automatic appetitive action-tendencies in male carriers of the OPRM1 G-allele. Genes, brain and behaviour Westermeyer, J., Kemp, K., & Nugent, S., (1996). Substance disorder among persons with mild mental retardation. The American Journal on Addicitions, 5, 23-31. Zachofsky, T., Reardon, D., & O’Connor, G. (1974). Response of institutionalized retarded adults to social pressure in small groups. American Journal of Mental Defiency, 79 (1), 10-15

Bachelor thesis Safety and Health Stephan Verroen, s0125725
23 | P a g e
Appendix I + II – Questionnaire alcohol usage
1. Wat is je leeftijd
…………. jaar
2. Wat is je geslacht
a. Man b. Vrouw
3. Hoeveel dagen drink je, gemiddeld genomen, alcohol per week?
a. 0 b. 1-2 c. 3-4 d. 5 of meer
4. Als je alcohol drinkt, wat drink je dan meestal? Je mag meerdere antwoorden omcirkelen!
a. Bier uit een glas b. Bier uit een flesje c. Bier uit een blikje d. Wijn uit een wijnglas e. Sterke drank uit een borrelglas f. Een mixdrankje (bijvoorbeeld wodka-redbull) g. Breezer
5. Hoeveel glazen alcohol drink je, gemiddeld genomen, per week?
a. 0 – 5 b. 5 – 10 c. 10 – 15 d. 15 – 20 e. Meer dan 20
6. Hoe vaak drink je meer dan 5 standaardglazen alcohol op 1 gelegenheid?
a. Nooit b. Maandelijks of minder dan 1 keer per maand c. Twee tot drie keer per maand d. Elke week e. Meerdere dagen per week

Bachelor thesis Safety and Health Stephan Verroen, s0125725
24 | P a g e
Appendix III – Questionnaire supervisors
1. Wat is de leeftijd van de client …………. jaar
2. Wat is het geslacht van de client
c. Man d. Vrouw
3. Wat is het (geschatte) IQ van de client
a. Lager dan 50 b. 50 – 60 c. 60 – 70 d. 70 – 80 e. Hoger dan 80
4. Hoeveel dagen drinkt de client, gemiddeld genomen, alcohol per week?
e. 0 f. 1-2 g. 3-4 h. 5 of meer
5. Als u de cliënt over een periode van 2 weken, bijvoorbeeld de afgelopen 2 weken, zou moeten
omschrijven qua drankgebruik. Met welke stelling bent u het dan het meest eens? a. Cliënt heeft (bijna) niks gedronken (2 of minder keer gedronken) b. Cliënt heeft gematigd gedronken zonder openbaar dronkenschap (2 tot 3 keer gematigd
gedronken in 2 weken) c. Cliënt heeft een of meerdere malen zichtbaar te veel gedronken (5 of meer keer te veel
gedronken in 2 weken)
6. Hoe vaak schat u dat de cliënt meer dan 5 standaardglazen alcohol op 1 gelegenheid drinkt? f. Nooit g. Maandelijks of minder dan 1 keer per maand h. Twee tot drie keer per maand i. Elke week j. Meerdere dagen per week

Bachelor thesis Safety and Health Stephan Verroen, s0125725
25 | P a g e
Appendix IV – Observation Checklist
Fase Vraag Ja/Nee Opmerkingen Instructie 1. Resp. kan de
gelezen/gegeven instructie navertellen
2. Resp. heeft veel vragen over
de instructie 3. Resp. kijkt veel naar de
posters
Ja/ Nee Ja/Nee Ja/Nee

Bachelor thesis Safety and Health Stephan Verroen, s0125725
26 | P a g e
Practise Joystick Algemeen
4. Resp. maakt de joystick beweging niet volledig af
5. Resp. heeft moeite met het
centreren van de joystick
6. Resp. drukt de trigger button op het verkeerde moment in
7. Resp. laat door fysieke uitingen ongemak zien bij het maken van de training (frustratie tolerantie)
8. Resp. wil stoppen na de
practise fase
9. Resp. vind de practise-fase
onduidelijk (stelt vragen)
10. Resp. kijkt vaak naar posters voor reminder
11. Resp. reageert door fysieke en of verbale uitingen op fouten
Ja/Nee Ja/Nee Ja/Nee Ja/Nee Ja/Nee Ja/Nee Ja/Nee Ja/Nee

Bachelor thesis Safety and Health Stephan Verroen, s0125725
27 | P a g e
Testfase Trials (Blok 1)
10. Resp. reageert verbaal en/of fysiek op alcohol/fris stimuli
11. Resp. raakt en/of blijft opgewonden bij het zien van de alcohol/fris stimuli
Ja/Nee Ja/Nee

Bachelor thesis Safety and Health Stephan Verroen, s0125725
28 | P a g e
Algemeen
12. Resp. bekijkt de nieuwe stimuli lang (reageert niet adrem op kleur stimuli)
13. Resp. maakt (zichtbaar) veel
fouten bij duw of trek stimuli
14. Resp. maakt (zichtbaar) veel fouten bij alcohol of fris stimuli
15. Resp. laat door fysieke
uitgingen ongemak zien bij het maken van de testfase (zuchten, kreunen, klagen)
16. Resp. kijkt veel om zich heen tijdens de testfase
17. Resp. vind het erg vervelend
wanneer er fouten worden gemaakt
18. Resp. vraagt aandacht van de
proefleider ter verduidelijking
Ja/Nee Ja/Nee Ja/Nee Ja/Nee Ja/Nee Ja/Nee Ja/Nee
Blok 1+2: Blok 3tm5 Blok 1+2: Blok 3tm5 Blok 1+2: Blok 3tm5 Blok 1+2: Blok 3tm5
Nadien

Bachelor thesis Safety and Health Stephan Verroen, s0125725
29 | P a g e
19. Resp. vond de test moeilijk
20. Resp. vond de test lang duren
21. Resp. heeft de test niet afgemaakt
Ja/Nee Ja/Nee Ja/Nee
Algemene opmerkingen:

Bachelor thesis Safety and Health Stephan Verroen, s0125725
30 | P a g e
Appendix V – Descriptives PWaID
Descriptive Statistics
N Minimum Maximum Mean Std. Deviation
gem_alc_bierblik_pull 8 573,00 1109,00 817,6250 156,02375
gem_alc_bierblik_push 8 653,00 1078,00 847,3750 137,26610
gem_alc_bierfl_pull 8 555,00 1250,00 823,5000 214,56401
gem_alc_bierfl_push 8 570,00 943,00 788,1250 122,90814
gem_alc_biergl_pull 8 547,00 1137,00 788,0000 177,49125
gem_alc_biergl_push 8 622,00 987,00 806,7500 124,24371
gem_alc_mix_bre_pull 8 597,00 1609,00 901,3750 316,52711
gem_alc_mix_bre_push 8 578,00 1037,00 821,5000 153,42937
gem_alc_mix_coc_pull 8 541,00 938,00 811,1250 127,34816
gem_alc_mix_coc_push 8 644,00 894,00 760,3750 93,64666
gem_alc_mix_flu_pull 8 602,00 832,00 730,3750 88,06643
gem_alc_mix_flu_push 8 653,00 1028,00 840,3750 142,45695
gem_alc_sd_bac_pull 8 661,00 848,00 786,2500 67,60547
gem_alc_sd_bac_push 8 539,00 958,00 825,2500 131,90446
gem_alc_sd_jen_pull 8 618,00 1073,00 822,5000 132,69622
gem_alc_sd_jen_push 8 659,00 1172,00 817,0000 161,20085
gem_alc_sd_whi_pull 8 656,00 1053,00 770,2500 132,01163
gem_alc_sd_whi_push 8 641,00 1078,00 792,6250 143,61649
gem_alc_wijn_fles_pull 8 492,00 1078,00 782,8750 174,72218
gem_alc_wijn_fles_push 8 691,00 1338,00 843,8750 217,09671
gem_alc_wijnr_fl_pull 8 587,00 834,00 724,5000 77,57945
gem_alc_wijnr_fl_push 8 634,00 891,00 766,5000 92,74851
gem_alc_wijnw_gl_pull 8 521,00 903,00 760,8750 118,52479
gem_alc_wijnw_gl_push 8 566,00 891,00 729,1250 115,51677
Valid N (listwise) 8

Bachelor thesis Safety and Health Stephan Verroen, s0125725
31 | P a g e
Descriptive Statistics
N Minimum Maximum Mean Std. Deviation
gem_fris_7up_pull 8 568,00 900,00 808,6250 109,93107
gem_fris_7up_push 8 633,00 1006,00 801,5000 123,39368
gem_fris_appelsap_pull 8 578,00 866,00 741,5000 89,68198
gem_fris_appelsap_push 8 635,00 940,00 771,0000 107,59448
gem_fris_cassis_pull 8 597,00 891,00 772,7500 105,48900
gem_fris_cassis_push 8 694,00 973,00 828,3750 103,20429
gem_fris_cola_pull 8 660,00 1152,00 868,7500 191,97228
gem_fris_cola_push 8 621,00 981,00 801,2500 142,93930
gem_fris_colazero_pull 8 644,00 859,00 768,0000 69,12101
gem_fris_colazero_push 8 656,00 1016,00 847,0000 114,86016
gem_fris_dubbelfr_pull 8 631,00 1063,00 801,1250 137,34777
gem_fris_dubbelfris_push 8 535,00 1287,00 816,0000 231,01701
gem_fris_dubbelfrisklein_pu
ll
8 644,00 1073,00 817,2500 140,87456
gem_fris_dubbelfrisklein_pu
sh
8 603,00 948,00 771,5000 107,63032
gem_fris_grnthee_pull 8 512,00 903,00 726,1250 132,90860
gem_fris_grnthee_push 8 531,00 969,00 788,8750 128,36492
gem_fris_schwepp_pull 8 631,00 897,00 757,6250 103,60907
gem_fris_schwepp_push 8 537,00 1169,00 795,3750 214,75031
gem_fris_sinassap_pull 8 559,00 1110,00 785,7500 195,04706
gem_fris_sinassap_push 8 669,00 1062,00 839,6250 121,37773
gem_fris_sprite_pull 8 598,00 1012,00 820,5000 137,93477
gem_fris_sprite_push 8 600,00 1387,00 932,1250 256,74025
gem_fris_water_pull 8 647,00 950,00 778,6250 94,10319
gem_fris_water_push 8 599,00 1211,00 828,6250 189,00638
Valid N (listwise) 8

Bachelor thesis Safety and Health Stephan Verroen, s0125725
32 | P a g e
Appendix VI – Descriptives Students
Descriptive Statistics
N Minimum Maximum Mean Std. Deviation
gem_alc_bierblik_pull 11 475,00 681,00 600,3636 61,65918
gem_alc_bierblik_push 11 516,00 797,00 624,7273 93,03343
gem_alc_bierfl_pull 11 516,00 675,00 602,0000 51,28353
gem_alc_bierfl_push 11 510,00 709,00 593,4545 56,71748
gem_alc_biergl_pull 11 494,00 844,00 615,5455 99,80718
gem_alc_biergl_push 11 543,00 756,00 624,0909 63,26524
gem_alc_mix_bre_pull 11 462,00 794,00 641,3636 91,03765
gem_alc_mix_bre_push 11 570,00 781,00 643,4545 61,77437
gem_alc_mix_coc_pull 11 559,00 816,00 639,3636 72,73964
gem_alc_mix_coc_push 11 519,00 662,00 598,4545 49,04154
gem_alc_mix_flu_pull 11 528,00 695,00 623,3636 53,29216
gem_alc_mix_flu_push 11 508,00 969,00 623,7273 125,30769
gem_alc_sd_bac_pull 11 516,00 863,00 613,4545 96,35493
gem_alc_sd_bac_push 11 528,00 734,00 596,3636 69,49284
gem_alc_sd_jen_pull 11 516,00 853,00 645,1818 91,55743
gem_alc_sd_jen_push 11 525,00 741,00 602,4545 57,96096
gem_alc_sd_whi_pull 11 535,00 737,00 621,8182 69,71774
gem_alc_sd_whi_push 11 559,00 744,00 612,2727 59,58706
gem_alc_wijn_fles_pull 11 487,00 650,00 567,0909 55,78253
gem_alc_wijn_fles_push 11 506,00 784,00 625,8182 89,73942
gem_alc_wijnr_fl_pull 11 503,00 803,00 597,5455 81,07696
gem_alc_wijnr_fl_push 11 491,00 838,00 614,7273 102,29183
gem_alc_wijnw_gl_pull 11 578,00 710,00 633,0000 51,64107
gem_alc_wijnw_gl_push 11 513,00 788,00 616,6364 78,83435
Valid N (listwise) 11
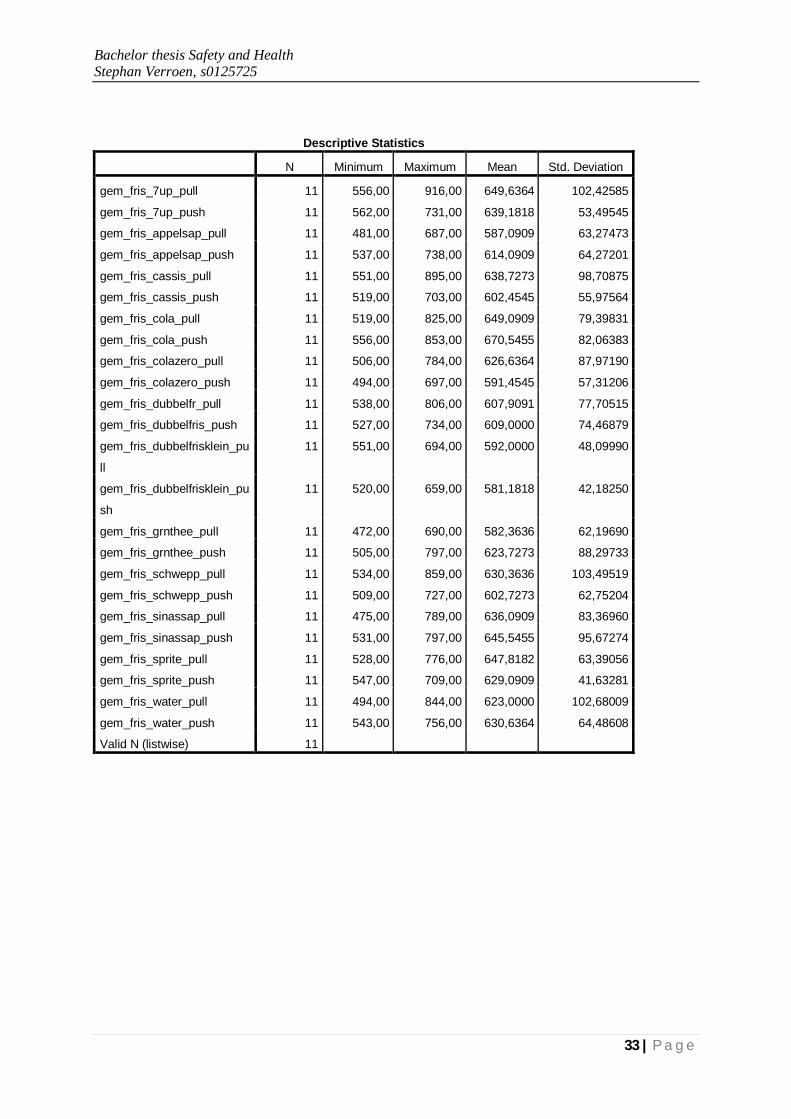
Bachelor thesis Safety and Health Stephan Verroen, s0125725
33 | P a g e
Descriptive Statistics
N Minimum Maximum Mean Std. Deviation
gem_fris_7up_pull 11 556,00 916,00 649,6364 102,42585
gem_fris_7up_push 11 562,00 731,00 639,1818 53,49545
gem_fris_appelsap_pull 11 481,00 687,00 587,0909 63,27473
gem_fris_appelsap_push 11 537,00 738,00 614,0909 64,27201
gem_fris_cassis_pull 11 551,00 895,00 638,7273 98,70875
gem_fris_cassis_push 11 519,00 703,00 602,4545 55,97564
gem_fris_cola_pull 11 519,00 825,00 649,0909 79,39831
gem_fris_cola_push 11 556,00 853,00 670,5455 82,06383
gem_fris_colazero_pull 11 506,00 784,00 626,6364 87,97190
gem_fris_colazero_push 11 494,00 697,00 591,4545 57,31206
gem_fris_dubbelfr_pull 11 538,00 806,00 607,9091 77,70515
gem_fris_dubbelfris_push 11 527,00 734,00 609,0000 74,46879
gem_fris_dubbelfrisklein_pu
ll
11 551,00 694,00 592,0000 48,09990
gem_fris_dubbelfrisklein_pu
sh
11 520,00 659,00 581,1818 42,18250
gem_fris_grnthee_pull 11 472,00 690,00 582,3636 62,19690
gem_fris_grnthee_push 11 505,00 797,00 623,7273 88,29733
gem_fris_schwepp_pull 11 534,00 859,00 630,3636 103,49519
gem_fris_schwepp_push 11 509,00 727,00 602,7273 62,75204
gem_fris_sinassap_pull 11 475,00 789,00 636,0909 83,36960
gem_fris_sinassap_push 11 531,00 797,00 645,5455 95,67274
gem_fris_sprite_pull 11 528,00 776,00 647,8182 63,39056
gem_fris_sprite_push 11 547,00 709,00 629,0909 41,63281
gem_fris_water_pull 11 494,00 844,00 623,0000 102,68009
gem_fris_water_push 11 543,00 756,00 630,6364 64,48608
Valid N (listwise) 11

Bachelor thesis Safety and Health Stephan Verroen, s0125725
34 | P a g e
Appendix VII – Figures

Bachelor thesis Safety and Health Stephan Verroen, s0125725
35 | P a g e

Bachelor thesis Safety and Health Stephan Verroen, s0125725
36 | P a g e

Bachelor thesis Safety and Health Stephan Verroen, s0125725
37 | P a g e

Bachelor thesis Safety and Health Stephan Verroen, s0125725
38 | P a g e
Appendix VIII – Figures

Bachelor thesis Safety and Health Stephan Verroen, s0125725
39 | P a g e

Bachelor thesis Safety and Health Stephan Verroen, s0125725
40 | P a g e
Appendix IX – Figures